Abstract
The nanoporous structure of oil-impregnated porous copper is closely related to its tribological and oil-retention properties, which are essential for its anti-friction and anti-wear, and long-lasting lubrication. In this study, different component Cu-Al precursors were obtained via plasma-activated sintering, followed by a dealloying method to obtain bulk nanoporous copper with different porosities. The effect of the nanoporous structure on oil-retention capacity and tribological properties was investigated. The results showed that as the porosity increased from 47.48% to 67.69%, the oil content increased from 8.01% to 20.18%, while the oil-retention capacity decreased from 97.12% to 33.92% at 7000 r/min centrifugal speed. With the storage of oil, the average friction coefficient was reduced by 68.2–85.9%. The self-lubricating effect can be ascribed to an oil film formed on the surface, and the main wear forms were abrasive wear and fatigue wear. This study may provide guidance for the development of high-performance oil-impregnated lubricating nanoporous copper.
1. Introduction
With the rapid development of the mechanical industry, higher requirements are put forward for the tribological performance of mechanical components (such as bearings, gears, etc.) [1]. The tribological properties of conventional materials cannot meet the operating requirements under special operating conditions. In extreme service environments, lubricant evaporation and creep can lead to insufficient lubrication [2,3]. Therefore, it is significantly important to develop new oil-containing composite materials to improve tribological properties and realize long-term service of mechanical components.
Porous oil-containing composites with good self-lubricating properties can be used to solve the problem of tribology in extreme conditions where lubricants cannot be replenished and in pollution-free environments [4]. Therefore, oil-containing porous materials have attracted much attention in the aerospace field [5,6]. Given the special merits of good wear resistance, thermal conductivity, high strength and oxidation resistance [7,8,9,10,11], copper alloys exhibit a wide range of applications in the field of friction. For example, Du et al. prepared porous copper with axially or radially aligned elongated cylindrical holes under high pressure using a mixture of hydrogen and argon gas. The oil-retention properties and sliding friction coefficient of porous copper were investigated concerning the porosity and pore size, and the friction coefficient of oil-containing friction was 0.15–0.19. However, the oil retention was not satisfactory, with a maximum of 55.89% under static conditions [12,13].
By absorbing and storing liquid lubricants, porous materials can continuously and steadily release them to friction surfaces stimulated by external loads and temperatures, thus reducing material friction and wear [14,15]. However, some disadvantages also exist, such as, firstly, the actual contact area between the two sliding surfaces being reduced, which would result in the stress distribution and metal deformation in the subsurface being compromised [16]. Secondly, the presence of the porous structure can reduce the mechanical strength and corrosion resistance and lead to the wear of surface defects and the development of fatigue cracks [17,18,19]. Therefore, regulation of the porous structure is important for the application of porous oil-containing materials. Compared with the traditional methods for the preparation of porous metal materials, the porous metal prepared via the dealloying method shows advantages in porous structure regulation and the preparation of micron or nanoscale porous metals, including the preparation of porous materials with high porosity and easy control of pore structure [20]. Furthermore, dealloying has also become a widely used method for fabricating nanoporous metals by selectively dissolving active components from binary or multiple alloys [21].
There are two important parameters related to oil-impregnated porous materials: the porosity and the size of the pores. There is a direct relationship between oil content and porosity of porous materials impregnated with oil [22], and according to current research, the oil content and oil circulation performance can be regulated by modulating the porosity [23,24,25]. The effect of porosity on wear performance is still under discussion [26,27]. The performance of oil-impregnated porous materials in terms of lubrication is significantly influenced by the pore size. Oil-impregnated porous materials have greater capillary force when pore size decreases, which contributes to an increase in oil content [28]. Additionally, the small pore size aids in reducing surface deformation and enhancing tribological characteristics [29,30]. Therefore, it is necessary to systematically investigate the effects of nanoporous structures on oil-retention capacity and tribological properties to advance the application of nanoporous copper in the field of lubrication. However, reports on the microstructure, oil-retention capacity and frictional behavior of bulk nanoporous copper are very limited.
In this work, to produce bulk nanoporous copper with pores that are uniform and evenly distributed, a chemical dealloying process was used. The mass fraction of copper in the precursor alloy was regulated to obtain nanoporous copper with different porosities. The objectives of this study can be divided into the following two aspects: first, determining the feasibility of preparing bulk nanoporous copper using a chemical dealloying method. Second, investigating the effect of nanoporous copper on the oil-retention and tribological behavior.
2. Experiment
2.1. Preparation of Precursor Alloys and Bulk Nanoporous Copper
In this study, the precursor alloy of the Cu-Al system was prepared from metallic Al powder (purity 99.5 wt.%, particle size 5 μm) produced by Henan Yuanyang Powder Technology Co. (Changyuan, China), and copper powder (purity 99.9 wt.%, particle size 1 μm, 0.2–1 μm) produced by Aladdin Co. (Shanghai, China). The selection of Cu powder with a relatively small particle size was beneficial to improve the effective connection of Cu powder and, thus, the strength of the skeleton. Polyal-phaolefin 10 (PAO 10) was sourced from ExxonMobil Chemical Co Ltd. (Shanghai, China). A two-dimensional ball mill (QM-A light ball mill, Xianyang, China) was used for ball milling and mixing the Cu and Al powders. The ball-milled Cu and Al mixed powder were loaded into a graphite grinding tool and then sintered rapidly using plasma-activated sintering (PAS) equipment (ED-PAS 111, Kanagawa, Japan). To avoid melting during sintering and to ensure the denseness of the precursor alloy in the experiment, sintering at 530 °C was selected, and the heating rate was 50 °C/min for 5 min. During sintering, the sintering pressure of the specimen was 50 MPa and the vacuum did not exceed 10 Pa. In addition, component gradients of 40/60, 50/50 and 60/40 at. % (Cu/Al) alloys were prepared by varying the ratios of Cu and Al. Machining and forming of Cu-Al precursor alloys were performed using a precision surface grinder (BLOHM Orbit 25EP, Hamburg, Germany) and a wire cutter (BM320, Dongguan Baoma CNC Equipment Co. manufacturer, Dongguan, China). Subsequently, porous Cu samples were prepared via selective corrosion of Al in Cu-Al precursor alloy using 10 wt.% H2SO4, 90 °C water bath, and the corrosion test was finished when there were no more bubbles formed by hydrogen gas from Al dissolution in the solution, and porous Cu samples were obtained. The porous Cu samples were taken out and immersed in deionized ethanol in turn for 20 min to remove the residual corrosive agent.
2.2. Material Characterizations
An X-ray diffractometer (XRD, Ultima III, Akishima, Japan) was used to identify the phase compositions of Cu-Al precursor alloys and porous Cu. Scanning Electron Microscope (SEM, Quanta FEG 250, Hillsboro, OR, USA) was used to analyze the microstructure. The elemental content and homogeneity of the Cu-Al precursor alloy were analyzed using energy dispersive spectroscopy (EDS). Inductive Coupled Plasma Emission Spectrometer (ICP, Prodigy 7, Hudson, NH, USA) was used to evaluate the residual aluminum content in the bulk nanoporous copper and the porosity of the material using Archimedes’ principle. Pore size and pore space distribution testing were performed with a mercury injection apparatus (AutoPore IV 9500, Atlanta, GA, USA). The prepared porous copper block (Փ15 × 2 mm nanoporous copper sample was used for oil-content and oil-retention test and Փ20 × 4 mm nanoporous copper sample for friction and wear test) and the base lubricant PAO10 were placed in a beaker and then placed in a vacuum drying oven at 110 °C and 0.08~0.09 MPa. The porous material was immersed in the liquid lubricant for 2~3 h so that the liquid lubricant was transformed into the porous material through the hole. To obtain the self-lubricating porous copper material containing the lubricant, the sample was taken out after the temperature decreased to room temperature and the excess lubricant was wiped off the surface with absorbent paper. The centrifuge (TG16-WS, Changsha, China) used to test the oil-retention rate of nanoporous copper had a speed setting of 1000–7000 rpm/min, and the oil content was measured every 15 min at room temperature. The oil content (Qc) and oil retention (Qr) were calculated according to Equations (1) and (2), respectively.
In the equation, before oil impregnation, the mass of nanoporous copper was m0; after oil impregnation, it was m; following centrifugation at a constant speed for t minutes, the mass of the oil-containing composite was mt.
Tribological tests on porous copper composites with different porosities containing PAO10 lubricant were performed on a nano soft material friction tester (TTX NTR2-TRB, Graz, Austria) in a ball-and-disk configuration. The friction samples were fixed on a friction test bench and commercially available GCr15 steel balls (Փ = 6 mm) were used as friction balls for friction testing. At least five repetitions of measurements were performed for each friction pair. A three-dimensional optical profiler (NANOVEA ST400, Irvine, CA, USA) was used to observe the wear surface and measure the wear volume, and a metallographic microscope (DM2500M, Weztlar, Germany) was used to observe the wear surface. Compression test was on nanoporous copper (3 × 3 × 6) using a universal test machine (Instron 5966, Boston, MA, USA) with an experimental loading rate of 0.05 mm/min. The oil-content and oil-retention testing process and the contact configuration diagram of the friction couples in the friction wear test are shown in Figure 1.

Figure 1.
Flow chart of oil-content and oil-retention test and contact configuration of friction couples in the friction wear test.
3. Results and Discussion
3.1. Preparation of Nanoporous Copper by Dealloying
Figure S1 shows the phase compositions of Cu40Al60, Cu50Al50 and Cu60Al40, precursor alloys sintered by PAS at 530 °C. Cu50Al50 and Cu60Al40 were single alloy compounds composed of AlCu and Cu9Al4 phases, respectively, and Cu40Al60 was composed of both AlCu and Al2Cu phases.
The precursor phase distribution and microstructure of Cu40Al60, Cu50Al50 and Cu60Al40 are shown in Figure 2a–c, which was sintered using PAS. The backscattered images show that Cu40Al60 consisted of two phases, with the AlCu phase in the bright region and the Al2Cu phase in the dark region. With the increase in copper content, the composition of the physical phase changed from two-phase to single-phase. Cu50Al50 and Cu60Al40 precursors had AlCu and Al4Cu9 single-phase composition, respectively, which showed weak contrast. The EDS images of the Cu-Al alloys are shown in Figure 2d–i, and they reveal that all of the precursor Cu-Al alloys were uniformly sintered.
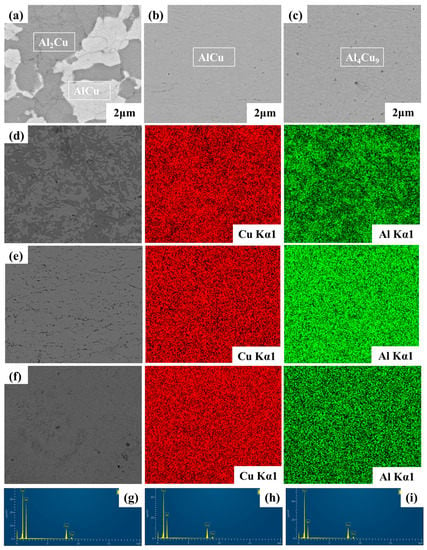
Figure 2.
Backscattered electron (BSE) images of Cu-Al precursor alloys: (a) Cu40Al60, (b) Cu50Al50, (c) Cu60Al40. EDS images of: (d,g) Cu40Al60, (e,h) Cu50Al50, (f,i) Cu60Al40.
Figure 3a displays the XRD phase distribution of bulk nanoporous copper produced by chemically treating Cu-Al alloy in a 10 wt.% H2SO4 solution. As can be seen, after dealloying the Cu-Al precursor alloy, only the Cu phase was detected, with complete dealloying of AlCu, Al2Cu and Cu9Al4 in the precursor alloy to form Cu. The impact of composition on the distribution of pore sizes is shown in Figure 3b. The findings demonstrate that the samples of nanoporous copper with porosities of 47.48% and 58.60% had a relatively concentrated pore size distribution. The pore size distribution of the porous copper fabricated by Cu40Al60 dealloying fell in the range of 100 to 500 nm, and the wide pore size distribution was mainly because the precursor alloy of this component consisted of two phases, Al2Cu and AlCu. As can be seen from Figure 3b, the average pore size values were 279.63 nm, 309.06 nm and 204.35 nm with increasing Cu content from 40 to 60 at. %. As the precursor alloy containing 40 at. % Cu consisted of two phases, AlCu and Al2Cu, the porous copper material had a wider pore size distribution, (dV/logD pore volume), and had a higher value and was related to the volume of the peak pore size distribution. The peak of the pore size distribution decreased with decreasing Al content. The actual porosity of nanoporous copper was closer to the theoretical porosity, as shown in Figure 3c. The porosity increased from 47.48% to 67.69% when the Cu content increased from 40 to 60 at.%. Table 1’s ICP results demonstrate that the primary elemental makeup was Cu after dealloying and the residual Al content in the nanoporous copper did not exceed 1 wt.%, further indicating that the dealloying process was complete. This also explains the reason why the theoretical porosity values were closer to the experimental porosity values in Figure 3c.

Figure 3.
(a) XRD pattern of bulk nanoporous copper obtained by dealloying Cu-Al alloys. (b) Pore size distribution of nanoporous copper from Hg porosimetry. (c) Theoretical and experimental porosity of bulk nanoporous Cu.

Table 1.
ICP testing of Al and Cu in dealloyed porous nanoporous copper.
After dealloying Cu-Al alloys in a 10 wt.% H2SO4 solution at 90 °C, Figure 4 displays the cross-sectional microstructure of bulk nanoporous copper. Figure 4a–c shows the macroscopic images of the microstructures of the dealloyed samples of Cu40Al60, Cu50Al50 and Cu60Al40 precursor alloys, and Figure 4d–f shows the local magnification. The “ligament-pore” bicontinuous three-dimensional network structure can be observed with SEM images. The porous copper ligaments had smooth surfaces, good connection between ligaments and good uniformity of ligament and pore sizes, with average ligament sizes of 291.61 nm (Cu40Al60), 246.50 nm (Cu50Al50) and 354.24 nm (Cu60Al40), respectively.
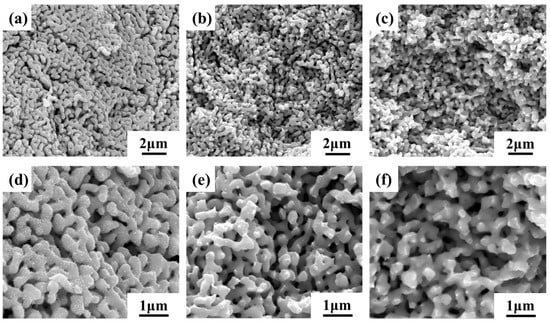
Figure 4.
Cross-sectional SEM micromorphology of bulk nanoporous copper formed by the dealloying of the precursor Cu-Al in the 10 wt.% H2SO4 solution: (a,d) Cu40Al60, (b,e) Cu50Al50, (c,f) Cu60Al40.
3.2. Oil-Retaining Capacity of Nanoporous Cu
The porosity of porous materials, which controls the amount of lubricant in saturated nanoporous copper, is strongly related to the oil content of those materials. To quantify the oil content of nanoporous copper, the variation in oil content of nanoporous copper with different porosities was measured via lubricant absorption experiments. In Figure 5a, it is evident that when porosity increased, the oil content did as well. The maximum value (20.18%) corresponded to the highest porosity (67.69%). High-speed centrifugation experiments were used to evaluate the oil-retention properties of oil-impregnated nanoporous copper composites, and Figure 5b shows the results of centrifugal mass loss of nanoporous copper injected with PAO10 for different porosities. The centrifugation speed of the experiment was increased gradually from 1000 to 7000 r/min in intervals of 1000 r/min, and the centrifugation test was performed for 15 min at each speed. The results showed that the mass loss of nanoporous copper samples with the same porosity became greater with the increase in centrifugation speed, because the centrifugal force increased with the increase in speed, making the centrifugal force exceed the capillary force, leading to an increase in mass lost. The nanoporous copper samples with different porosities showed good oil-holding capacity at low centrifugal speed (≤2000 r/min) with little oil loss. At high centrifugation speed, the higher of the porosity, the worse of the oil-retention capacity. The nanoporous copper with porosity (47.48%) exhibited the best oil-holding capacity.
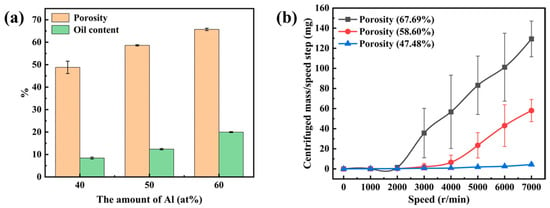
Figure 5.
(a) Relationship between porosity and oil content of nanoporous copper, (b) oil loss from nanoporous copper at different centrifugal speeds.
Porous materials can hold oil in the presence of capillary action, and the relationship between the adsorption force generated by capillary action and the diameter of the capillary tube can be described as follows:
In the formula, F is the capillary adsorption force (N), σ is the lubricating oil (PAO10) surface tension (N/m), θ is the contact angle (rad) between the lubricating oil and the surface of the nanoporous copper material and d is the nanoporous copper Aperture size (m). Equation (3) shows that the smaller the pore size, the greater the capillary force and the greater the oil-retention capacity. MacNeill GF’s [31] research shows that when the bearing is in normal operation, the lubricating oil flows to the friction surface under the action of centrifugal force, and its flow rate is Q; the expression is as follows:
where ∆p is the pressure difference (Pa) that causes the oil to flow, n is the porosity of the nanoporous copper, d is the pore size of the nanoporous copper (m), μ is the viscosity of the lubricating oil (pas) and L is the nanoporous copper hole height (m). Equation (4) can be analyzed to show that samples with both smaller pore size and porosity have smaller flow rates Q. Through Formulas (3) and (4), it can be analyzed that the nanoporous copper with a porosity of 47.48% had a higher capillary force and low flow rate of lubricating oil, and its oil-holding capacity was the best.
3.3. Friction Behavior of Nanoporous Copper
As shown in Figure 6a, the porous copper samples with 47.48% porosity were subjected to the dry friction test under a friction load of 1–7N, and their average friction coefficients were 0.5936, 0.5982, 0.5778 and 0.5392, respectively. As shown in Figure 6b, the porous copper samples with 58.60% porosity were subjected to the dry friction test under a friction load of 1–7N, and their average friction coefficients were 0.6150, 0.5928, 0.5660 and 0.5683, respectively. As shown in Figure 6c, the porous copper samples with 67.69% porosity were subjected to the dry friction test under a friction load of 1–7N, and the average coefficients of friction were 0.5773, 0.6006, 0.6559 and 0.6383, respectively. As shown in Figure 6a–c, with the porosity change from 47.48% to 67.69%, the dry friction coefficient for nanoporous copper samples was concentrated at 0.6, which remained stable in the long-time friction process. There were no major fluctuations in the dry friction coefficient of nanoporous copper as the porosity changed. On the one hand, friction occurred between the friction ball and the friction sub (Cu), with no major changes in the material of the friction sub. On the other hand, dry friction did not form an oil film to achieve friction reduction. For the porous copper samples with porosities of 47.48% and 58.6%, the friction coefficient gradually decreased with the increase in load, as shown in Figure 6a,b. With the load increasing, the porous structure was compacted and a smooth copper or copper oxide lubricating film could be formed, which made the friction coefficient decrease, while the porous copper sample with the porosity about 67.69% showed a gradual increase in the friction coefficient with increasing of load, as shown in Figure 6c. This was due to the reason that the high porosity would result in reduced mechanical strength, more structural damage and plastic deformation under load, and a wear surface with deeper grooves. The instability of the surface structure was consistent with the instability of its dry friction coefficient. Figure 6d,e shows the wear volumes of porous copper samples with porosities from 47.48% to 67.69% at different frictional loads, and wear volume increased with increasing frictional load for the same porosity. And, the wear volume of low porosity for the porous copper samples under the same load was smaller, which may be related to the fact that low porosity samples possessed higher strength and hardness features, as shown in Figure S2. The porous copper with porosity about 47.48% showed the best wear resistance, and the porous copper sample with porosity of 67.69% exhibited the worst wear resistance. Meanwhile, excessive wear occurred under the 7N load, mainly due to the large plastic deformation under this load.
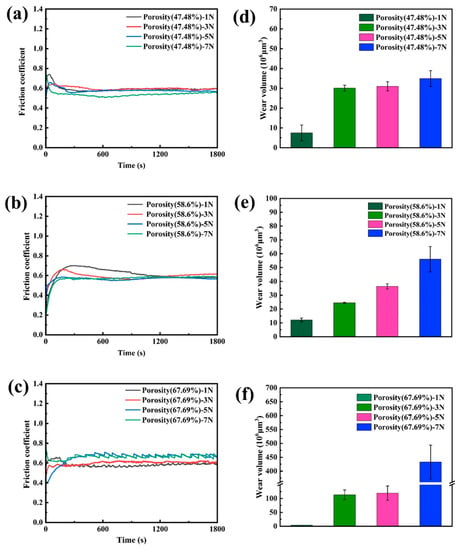
Figure 6.
(a) Dry friction coefficients of porous copper with 47.48% porosity under 1N, 3N, 5N, and 7N loads. (b) Dry friction coefficients of porous copper with 58.6% porosity at 1N, 3N, 5N, and 7N loads. (c) Dry friction coefficient of porous copper with 67.69% porosity at 1N, 3N, 5N, and 7N loads. (d) Dry friction wear volume of porous copper with 47.48% porosity at 1N, 3N, 5N, and 7N loads. (e) Dry friction wear volume of porous copper with 58.6% porosity at 1N, 3N, 5N, and 7N loads. (f) Dry friction wear volume of porous copper with 67.69% porosity under 1N, 3N, 5N, and 7N loads.
As shown in Figure 7, the surface morphology of the samples after dry friction was characterized using SEM. When the porosity was 47.48%, the wear degree of the sample was light, the crater plow furrow phenomenon was less and the lamellar spalling phenomenon cannot be observed in Figure 7(a1–a4). In contrast, the sample with the porosity of 67.69% was severely abraded, with numerous pits and flaking visible on the surface in Figure 7(c1–c4). The spalling pits in the sample with the porosity of 67.69% would act as a source of cracks, contributing to their formation and expansion. When cracks formed, it would lead to the friction film (Figure 7(a3,c1)) breakdown and result in direct contact between the material and the friction substrate. Without the lubrication and protection from such film in the friction process, due to the role of friction extrusion and heat, adhesion wear and shear fracture would occur between the material and the contact area of the friction vice. It also would lead to the exfoliation of more metal particles from the surface of the friction sub. When repeatedly performed, more pits and abrasive chips formed, as shown in region 3–region 5. Trace ploughing and unworn areas can be observed in region 1 and region 2 of the porous copper sample with a porosity of 47.48%, which is typical of adhesive wear. In addition, the porous copper with a porosity of 58.6% cracked as the load increased in Figure 7(b1–b4), which can be ascribed to the reason that fatigue wear resulting from the material’s tensile yield strength was lower than the shear force. As shown in Figure S3, the EDS test analysis of the friction surface after the friction test shows that the friction surface as mainly composed of Cu elements and trace amounts of O elements, combined with no new phases generated in the XRD pattern after dealloying, so the O elements on the friction surface were mainly adsorbed oxygen. The 3D morphology visualized the increase in wear spot and wear volume with increasing of load and porosity. The sample with a porosity of 47.48% showed the best frictional wear performance under dry friction conditions.
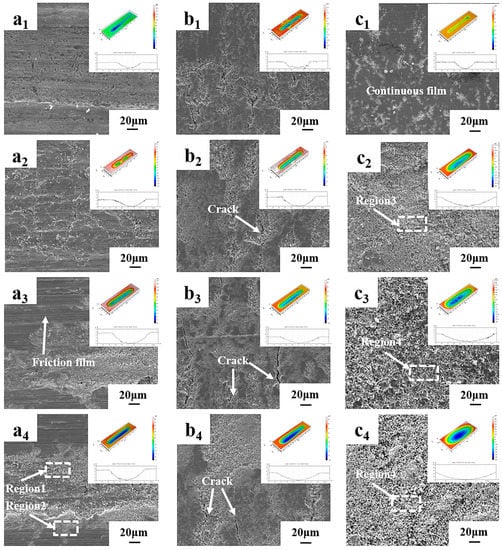
Figure 7.
(a1–a4) 3D morphology and SEM images of nanoporous copper blocks with 47.48% porosity under dry friction with friction loads of 1N, 3N, 5N and 7N, respectively; (b1–b4) 3D morphology and SEM images of nanoporous copper blocks with 58.6% porosity under dry friction with friction loads of 1N, 3N, 5N and 7N, respectively; (c1–c4) 3D morphology and SEM images of nanoporous copper blocks with 67.69% of porous copper nanoblocks under dry friction and SEM images with friction loads of 1N, 3N, 5N and 7N, respectively.
The coefficient of friction (COF) for the dry samples (not immersed in lubricating oil) was in the range from 0.5392 to 0.6559, and the friction curve is shown in Figure 6. After oil immersion, the porous copper samples with 47.48% porosity were subjected to friction tests with oil at friction loads of 1–7N, and the average friction coefficients were 0.0992, 0.0611, 0.0576 and 0.0471, as shown in Figure 8a. As shown in Figure 8b, the porous copper samples with 58.60% porosity were subjected to friction tests with oil at friction loads of 1–7N, and the average friction coefficients were 0.1415, 0.0705, 0.0619 and 0.0639. The average friction coefficients were 0.1415, 0.0705, 0.0619 and 0.0639. As shown in Figure 8c, the porous copper samples with 67.69% porosity were subjected to friction tests with oil at friction loads of 1–7N. The average friction coefficients were 0.1767, 0.1617, 0.1467 and 0.1485. Therefore, it can be easily concluded that the porous structure of the internal oil storage can successfully help the specimen to achieve the goal of self-lubrication. In addition, COF increased with increasing porosity of nanoporous copper, shown in Figure 8a–c, which may correlate with the reduced strength of high porosity porous copper. High porosity samples were prone to result in pore-structure collapse and pore-structure blockage during friction, preventing the formation of a good friction oil film and oil circulation, subsequently resulting in high friction coefficients. Furthermore, the COF decreased with the increase in the nanoporous copper friction load. When the friction load was 1N, a good oil film cannot be formed on the friction surface, which would result in a high friction coefficient, while with the progress of friction, a good oil film can form. Cyclization made the friction coefficient decrease gradually. The wear volume increased with the increase in load and porosity, but the oil-containing wear volume was lower than the dry friction wear volume, indicating that the oil film played a good lubricating role and reduced the wear of the matrix.
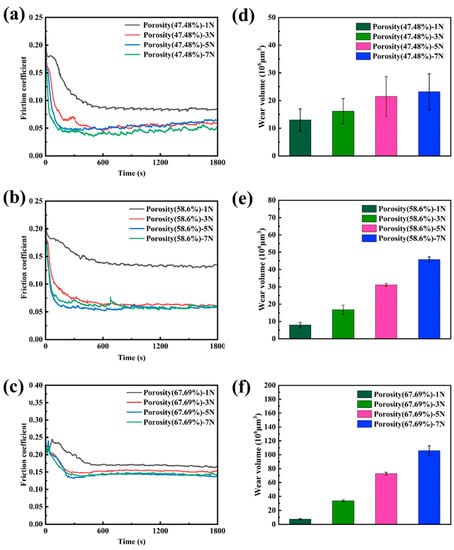
Figure 8.
(a) Oil friction coefficients of porous copper with 47.48% porosity under 1N, 3N, 5N, and 7N loads. (b) Oil friction coefficients of porous copper with 58.6% porosity at 1N, 3N, 5N, and 7N loads. (c) Oil friction coefficient of porous copper with 67.69% porosity at 1N, 3N, 5N, and 7N loads. (d) Oil friction wear volume of porous copper with 47.48% porosity at 1N, 3N, 5N, and 7N loads. (e) Oil friction wear volume of porous copper with 58.6% porosity at 1N, 3N, 5N, and 7N loads. (f) Oil friction wear volume of porous copper with 67.69% porosity under 1N, 3N, 5N, and 7N loads.
To understand the oil-containing frictional performance of the porous copper, the wear surface was observed, which is presented in Figure 9. On the surface of the as-prepared porous copper, shallow plow marks and some abrasive particles generated from loose debris can be seen in Figure 9(a3). In porous copper samples with porosities of about 47.48% and 58.60% with increasing friction load, the friction surface showed abrasive grains starting at low loads to trace plowing at high loads. This was mostly due to the load increment increasing the plastic deformation and the contact area between the friction ball and substrate material. In Figure 8, the friction coefficient increases and decreases with load. On the one hand, the spherical abrasive particles transformed sliding friction into rolling friction, and on the other hand, the friction process and the release of the lubricant to the surface to produce a lubricating layer both helped to effectively lower the friction coefficient. The shear fracture occurred with increasing load for the sample with a porosity of 67.69%, which resulted in fatigue wear. And more severe shear fracture would occur when the load becomes greater, and would also lead to spalling phenomena. Due to the presence of cracks, a good oil film cannot form, and flaking copper fragments would tend to stack on the friction surface, causing an increase in surface roughness, so the friction coefficient was higher and fluctuated severely. It coincided with the friction coefficient curve in Figure 8.
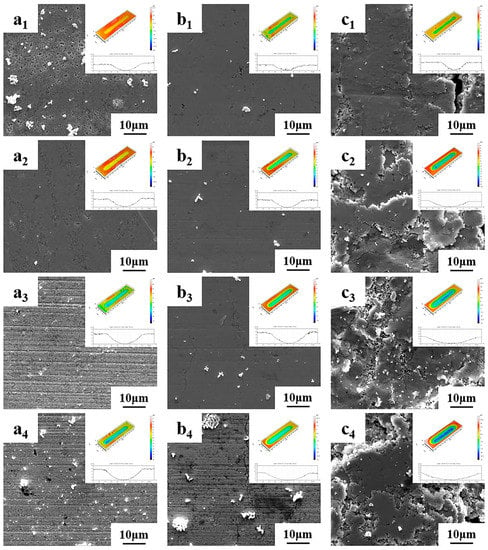
Figure 9.
(a1–a4) 3D morphology and SEM images of nanoporous copper blocks with 47.48% porosity under oil friction with friction loads of 1N, 3N, 5N and 7N, respectively; (b1–b4) 3D morphology and SEM images of nanoporous copper blocks with 58.6% porosity under oil friction with friction loads of 1N, 3N, 5N and 7N, respectively; (c1–c4) 3D morphology and SEM images of nanoporous copper blocks with 67.69% of porous copper nanoblocks under oil friction and SEM images with friction loads of 1N, 3N, 5N and 7N, respectively.
Figure 10 illustrates the lubrication mechanism of nanoporous copper under dry friction and lubrication conditions. The porous copper began to deform under the external force in the event of dry friction, resulting in cracks and abrasive grains (as seen in Figure 7). As the process continued, the porous copper gradually adhered to the surface of the steel ball and formed a transfer film, as shown in Figure 10(b1–b3). The dry friction coefficient gradually decreased and eventually became stable. If a crack was formed, it would lead to the rupture of the solid lubricating film and the direct contact between the material and the friction sub, which made the friction coefficient increase and the wear volume increase. As for the oil lubrication, due to friction after extrusion and friction heat, the extruded lubricant in the relative sliding surface formed a more stable layer of the lubricating film in the process of friction [32,33]. Due to the thick and complete lubricating film effect, the material and the friction sub did not contact directly and frictional wear occurred in the surface layer of the lubricating film, thus achieving a reduction in the coefficient of friction and wear volume, as shown in Figure 10(d1,d2). When the friction ended, the lubricant on the surface was recycled to the pore structure for storage by capillary forces, which resulted in long-lasting lubrication. In addition, the high porosity improved the oil content, but also reduced the mechanical strength of the nanoporous copper, making the surface more susceptible to deformation and leading to increased frictional resistance. Smaller pore size increases the oil-holding capacity but makes the pore structure more prone to clogging; therefore, a reasonable choice between porosity and pore size is critical for oil-bearing materials.

Figure 10.
Schematic diagram of dry friction and oil-containing friction mechanism of nanoporous copper: (a) initial stage of dry friction, (b) stable stage of dry friction, (c) initial stage of oil-containing friction, (d) stable stage of oil-containing friction. (b1–b3) EDS plots of the transferred film after dry rubbing. (d1,d2) Optical micrographs of the oil film.
4. Conclusions
The nanoporous copper with different porosity was prepared under different Cu-Al composition ratios. The structural parameters of the porous copper, including porosity, pore size and distribution were characterized, and their properties, including oil content, oil retention and tribological properties, were evaluated:
- By chemically dealloying Cu60Al40, Cu50Al50 and Cu40Al60 alloys in 10 wt.% H2SO4 solution at a temperature of 90 °C, bulk nanoporous copper (Փ15 × 2 mm) with consistent pore morphology was successfully produced. The pore structure increased from 204.35 nm to 309.06 nm, when the porosity increased from 47.48% to 67.69%.
- The oil content of porous copper increased with increasing porosity, reaching 20.18% on the specimen with the highest porosity of 67.69%. On the other hand, the oil-retention capacity of porous copper decreased with the increase in porosity. The nanoporous copper with a porosity about 47.48% can achieve a high oil retention of 97.12% at a centrifugal speed of 7000 (r/min).
- The dry friction effect of nanoporous copper can be ascribed to the formation of a transfer film, which makes the friction proceed steadily. The self-lubricating effect of oil-containing nanoporous copper can be attributed to the formation of a thick oil film on the friction surface, which reduced the friction coefficient with the lowest value about 0.047 and reduced the wear rate.
Supplementary Materials
The following supporting information can be downloaded at: https://www.mdpi.com/article/10.3390/met13071232/s1, Figure S1: XRD patterns of precursor Cu40Al60, Cu50Al50, Cu60Al40 alloys; Figure S2: (a) Hardness of nanoporous copper with different porosity, (b) stress–strain curve of nanoporous copper; Figure S3: EDS test results of dry friction surface with different porosity: (a) porosity 48.43%, (b) porosity 58.60%, (c) porosity 67.69%.
Author Contributions
Conceptualization, H.W., G.Y., M.C., H.L., Y.W. and Q.S.; methodology, H.W., G.Y., M.C., H.L., Y.W. and Q.S.; validation, M.C., Y.W. and Q.S.; formal analysis, J.Z.; writing—original draft preparation, J.Z.; writing—review and editing, J.Z., H.W. and G.Y.; project administration, F.C.; funding acquisition, F.C. All authors have read and agreed to the published version of the manuscript.
Funding
This work was supported by the National Key Research and Development Program of China (2021YFA0716304), the Guangdong Major Project of Basic and Applied Basic Research (2021B0301030001), Project supported by the Space Utilization System of China Manned Space Engineering (KJZ-YY-WCL03), the National Key Laboratory Foundation of Science and Technology on Materials under Shock and Impact (6142902210109), Independent Innovation Projects of the Hubei Longzhong Laboratory (2022ZZ-32), the National Natural Science Foundation of China (No. 11902232, 51972246, and 51521001) and the Joint Fund (Grant No. 8091B022108). The authors have no relevant financial or non-financial interests to disclose.
Data Availability Statement
Not applicable.
Conflicts of Interest
The authors declare no conflict of interest.
References
- Fusaro, R.L. Lubrication of Space Systems; NASA/TM-1994-106392; National Aeronautics and Space Administration: Washington, DC, USA, 1994. [Google Scholar]
- Wang, Y.; Liu, Q.; Yan, J. Characteristic Study on the Porous Reservoir of Liquid Lubricant in Space. Chin. J. Space Sci. 2008, 28, 592–596. [Google Scholar] [CrossRef]
- Neville, A.; Morina, A.; Haque, T.; Voong, M. Compatibility between tribological surfaces and lubricant additives—How friction and wear reduction can be controlled by surface/lube synergies. Tribol. Int. 2007, 40, 1680–1695. [Google Scholar]
- Yang, C.; Jiang, P.; Qin, H.; Wang, X.; Wang, Q. 3D printing of porous polyimide for high-performance oil impregnated self-lubricating. Tribol. Int. 2021, 160, 107009. [Google Scholar] [CrossRef]
- Gao, S.; Han, Q.; Zhou, N.; Pennacchi, P.; Chu, F. Stability and skidding behavior of spacecraft porous oil-containing polyimide cages based on high-speed photography technology. Tribol. Int. 2022, 165, 107294. [Google Scholar] [CrossRef]
- Shao, M.; Li, S.; Duan, C.; Yang, Z.; Qu, C.; Zhang, Y.; Zhang, D.; Wang, C.; Wang, T.; Wang, Q. Cobweb-like structural stimuli-responsive composite with oil warehouse and transportation system for oil storage and recyclable smart-lubrication. ACS Appl. Mater. Interfaces 2018, 10, 41699–41706. [Google Scholar] [CrossRef]
- Kong, Q.; Lian, L.; Liu, Y.; Zhang, J. Fabrication and compression properties of bulk hierarchical nanoporous copper with fine ligament. Mater. Lett. 2014, 127, 59–62. [Google Scholar] [CrossRef]
- Körner, C.; Singer, R.F. Processing of metal foams—Challenges and opportunities. Adv. Eng. Mater. 2000, 2, 159–165. [Google Scholar] [CrossRef]
- Banhart, J. Manufacture, characterisation and application of cellular metals and metal foams. Prog. Mater. Sci. 2001, 46, 559–632. [Google Scholar] [CrossRef]
- Dan, Z.; Qin, F.; Wada, T.; Yamaura, S.-I.; Xie, G.; Sugawara, Y.; Muto, I.; Makino, A.; Hara, N. Nanoporous palladium fabricated from an amorphous Pd42.5Cu30Ni7.5P20 precursor and its ethanol electro-oxidation performance. Electrochim. Acta 2013, 108, 512–519. [Google Scholar] [CrossRef]
- Zhao, C. Review on thermal transport in high porosity cellular metal foams with open cells. Int. J. Heat Mass Transf. 2012, 55, 3618–3632. [Google Scholar] [CrossRef]
- Du, H.; Qi, J.; Lao, Y.; Xiong, T. Oil retaining capability and sliding friction behaviour of porous copper with elongated cylindrical pores. J. Mater. Process. Technol. 2012, 212, 1796–1801. [Google Scholar] [CrossRef]
- Du, H.; Qi, J.; Du, S.; Xiong, T.; Li, T.; Lee, S.W. Structure and oil retaining capacity of gasar copper fabricated by radial solidification with a combined crystallizer. J. Mater. Process. Technol. 2010, 210, 1523–1528. [Google Scholar] [CrossRef]
- Zhao, H.; Prieto-López, L.O.; Zhou, X.; Deng, X.; Cui, J. Multistimuli Responsive Liquid-Release in Dynamic Polymer Coatings for Controlling Surface Slipperiness and Optical Performance. Adv. Mater. Interfaces 2019, 6, 1901028. [Google Scholar] [CrossRef]
- Li, X.; Chen, X.; Zhang, C.; Luo, J. Preparation of self-lubricating NiTi alloy and its self-adaptive behavior. Tribol. Int. 2019, 130, 43–51. [Google Scholar] [CrossRef]
- Fukumasu, N.; Boidi, G.; Seriacopi, V.; Machado, G.; Souza, R.; Machado, I. Numerical analyses of stress induced damage during a reciprocating lubricated test of fecmo sps sintered alloy. Tribol. Int. 2017, 113, 443–447. [Google Scholar] [CrossRef]
- Carabajar, S.; Verdu, C.; Hamel, A.; Fougères, R. Fatigue behaviour of a nickel alloyed sintered steel. Mater. Sci. Eng. A 1998, 257, 225–234. [Google Scholar] [CrossRef]
- Carabajar, S.; Verdu, C.; Fougeres, R. Damage mechanisms of a nickel alloyed sintered steel during tensile tests. Mater. Sci. Eng. A 1997, 232, 80–87. [Google Scholar] [CrossRef]
- Straffelini, G.; Fontanari, V.; Molinari, A. True and apparent Young’s modulus in ferrous porous alloys. Mater. Sci. Eng. A 1999, 260, 197–202. [Google Scholar] [CrossRef]
- Zou, L.; Ge, M.; Zhao, C.; Meng, Q.; Wang, H.; Liu, X.; Lin, C.-H.; Xiao, X.; Lee, W.-K.; Shen, Q.; et al. Designing Multiscale Porous Metal by Simple Dealloying with 3D Morphological Evolution Mechanism Revealed via X-ray Nano-tomography. ACS Appl. Mater. Interfaces 2019, 12, 2793–2804. [Google Scholar] [CrossRef]
- Erlebacher, J.; Aziz, M.J.; Karma, A.; Dimitrov, N.; Sieradzki, K. Evolution of nanoporosity in dealloying. Nature 2001, 410, 450–453. [Google Scholar] [CrossRef]
- Jia, W.; Yang, S.; Ren, S.; Ma, L.; Wang, J. Preparation and tribological behaviors of porous oil-containing polyimide/hollow mesoporous silica nanospheres composite films. Tribol. Int. 2020, 145, 106184. [Google Scholar] [CrossRef]
- Li, X.; Ling, Y.; Zhang, G.; Yin, Y.; Dai, Y.; Zhang, C.; Luo, J. Preparation and tribological properties of solid-liquid synergetic self-lubricating PTFE/SiO2/PAO6 composites. Compos. Part B Eng. 2020, 196, 108133. [Google Scholar] [CrossRef]
- Wang, H.; Liu, D.; Yan, L.; Li, M.; Wang, C.; Zhu, Y. A computed model for tribological properties of porous self-lubricating PPS composites: Numerical analysis and experimental verification. Wear 2014, 320, 94–102. [Google Scholar] [CrossRef]
- Qiu, Y.X.; Wang, Q.H.; Wang, C.; Wang, T. Preparation and properties of controllable porous films containing lubricant oil. Tribology 2012, 32, 480–485. [Google Scholar]
- Li, X.; Olofsson, U. A study on friction and wear reduction due to porosity in powder metallurgic gear materials. Tribol. Int. 2017, 110, 86–95. [Google Scholar] [CrossRef]
- Martin, F.; García, C.; Blanco, Y. Influence of residual porosity on the dry and lubricated sliding wear of a powder metallurgy austenitic stainless steel. Wear 2015, 328–329, 1–7. [Google Scholar] [CrossRef]
- Chen, W.; Zhu, P.; Liang, H.; Wang, W. Molecular Dynamics Simulations of Lubricant Recycling in Porous Polyimide Retainers of Bearing. Langmuir 2021, 37, 2426–2435. [Google Scholar] [CrossRef]
- Ye, J.; Li, J.; Qing, T.; Huang, H.; Zhou, N. Effects of surface pore size on the tribological properties of oil-impregnated porous polyimide material. Wear 2021, 484–485, 204042. [Google Scholar] [CrossRef]
- Xu, X.; Shu, X.; Pei, Q.; Qin, H.; Guo, R.; Wang, X.; Wang, Q. Effects of porosity on the tribological and mechanical properties of oil-impregnated polyimide. Tribol. Int. 2022, 170, 107502. [Google Scholar] [CrossRef]
- MacNeill, G.F. Porous Material Development for Instrument-Ball-Bearing Retainer Applications; MIT Charles Stark Draper Laboratory: Cambridge, MA, USA, 1973. [Google Scholar]
- Myant, C.; Fowell, M.; Spikes, H.A.; Stokes, J.R. An Investigation of Lubricant Film Thickness in Sliding Compliant Contacts. Tribol. Trans. 2010, 53, 684–694. [Google Scholar] [CrossRef]
- Spikes, H. The History and Mechanisms of ZDDP. Tribol. Lett. 2004, 17, 469–489. [Google Scholar] [CrossRef]
Disclaimer/Publisher’s Note: The statements, opinions and data contained in all publications are solely those of the individual author(s) and contributor(s) and not of MDPI and/or the editor(s). MDPI and/or the editor(s) disclaim responsibility for any injury to people or property resulting from any ideas, methods, instructions or products referred to in the content. |
© 2023 by the authors. Licensee MDPI, Basel, Switzerland. This article is an open access article distributed under the terms and conditions of the Creative Commons Attribution (CC BY) license (https://creativecommons.org/licenses/by/4.0/).