Abstract
Modelling the anisotropic plasticity of a metal requires the derivation of various experimental flow curves from specimens machined along different orientations and, depending on the anisotropy model, tested under different loading modes (tension, compression, torsion). The derivation of stress–strain curves from tensile experiments is a common practice within the uniform straining range but still presents some uncertainties after necking onset. Modern sheet metals, for structural applications where significant energy absorption is required, may exhibit early necking and prolonged post-necking ductility; when such alloys also exhibit pronounced anisotropy, the derivation of their flow curves may be challenging, whatever the loading mode or the specimen direction. This work examines the experimental procedures for determining the true-stress–true-strain curve and the anisotropic strain ratio, extended over the post-necking range and up to failure, from representative tensile tests along the rolling direction of PHS-1800 steel and aluminum 6181 alloy. The validity ranges of different standard procedures for stress–strain derivation are investigated to understand when and how fast the typical true-stress–true-strain data start to depart from the effective material response. Other considerations, based on simple experimental and post-processing procedures, aim at a procedure delivering useful information about the material response over the post-necking range and up to failure. The procedure to retrieve post-necking true curves and anisotropy ratios is then applied to tensile tests at static, intermediate, and high strain rates on the two sheet metals of interest.
1. Introduction
Structural sheet metals used in automotive applications are known for their mechanical properties such as high strength, energy absorption, formability, corrosion resistance, and lightness. Due to the technological processes to which they are subjected, they frequently exhibit anisotropic behaviour, and so the characterization of their elasto-plastic tensile response is not as straightforward as with isotropic materials. In the literature, many testing methodologies [1] for the calibration of several advanced plasticity models with different approaches [2] have been proposed.
Various researchers have implemented indirect approaches to derive a material’s elasto-plastic curve, often considering the hardening laws used most for automotive sheet metals [3]. The most common method is based on reverse engineering, in which, after various iterations, the error function between the output results from finite element simulations and the experimental data [4,5,6,7,8,9] is minimized. The inverse material FE-based characterization was used by Peirs et al. [10] in order to extract the flow curve in Ti6Al4V round specimens at high strain rates for tensile and shear load conditions, while Tardif and Kyriakides [11] conducted a campaign of uniaxial and biaxial tensile tests in order to inversely calibrate an anisotropic yield function and then characterize the mechanical behaviour of Al6061-T6 sheet metals. Another inverse identification procedure is the virtual fields method, in which it is necessary to formulate some preliminary assumptions about the formulation of the target material model to calibrate, in order to satisfy the principle of virtual work [12,13,14]. Another example is the numerical stepwise modelling method (SMM), proposed by Marth et al. [15,16] to characterize the tensile behaviour of thin sheet metals, in which the material flow curve is discretized by a continuous piecewise linear function, where each angular coefficient is calculated iteratively, step by step. A mixed indirect/direct approach has been proposed by Maček et al. [17] to calibrate a complex material model for 304 austenitic stainless steel, making use of data from simple uniaxial tests and a novel heterogeneous strain field tensile test.
Despite that the indirect procedures are widely adopted, when the material response is anisotropic and the dynamic behaviour must be assessed, while also incorporating thermal effects, the number of plasticity-related variables may substantially increase beyond the single-variable of plastic strain, eventually limiting the convenience of this kind of procedure and also making them prone to possible non-unicity issues. On the other hand, the direct procedures to obtain the flow curve from tensile tests are usually based on the experimental true-stress–true strain-curve, relating the evolving values of the load to those of the resisting section of the specimen. In fact, up to the necking onset, the true curve is very simply determined by experiments and is identical to the flow curve. Afterwards, experimental determination of the former curve is less straightforward, as it also involves triaxiality contributions, promoted by the hourglass-like shape of necked specimens, which must be depurated in order to deliver the latter curve. Regarding this topic, Bridgman [18] proposed the most well-known corrective factor in the scientific literature, depending on the curvature of the deformed surface of the specimen at the necking section. Choung and Cho [19] defined a quadratic corrective function, dependent on the true strain and Ludwik’s hardening exponent, suitable for converting the true curve into the flow curve. Mirone [20] observed that the evolution of necking during a tensile test is a material-independent phenomenon and proposed a polynomial corrective function, valid either for round or flat dog bone specimens, in order to transform the true curve into the neck-section-averaged flow stress curve.
The derivation of the experimental true/flow curve before necking onset is straightforward, as it only requires the classical load-elongation data regardless of isotropic or anisotropic materials. Indeed, many studies still mainly focus on the pre-necking phase in order to characterize the anisotropic behaviour of sheet metals [21]. On the other hand, after necking onset, the specimen elongation can no longer deliver the true curve because it cannot express the localized strain at the neck section. At that point, things become more or less complex depending on the anisotropy/isotropy of the material. If the material is isotropic or even transversely isotropic, then the true curve can be still easily derived by image analysis of video acquired from a single viewpoint, delivering the shrinking transverse dimension of the specimen (width of flat specimens or diameter of round specimens). Regarding this topic, Shokeir et al. [22] proposed an edge tracing method which allows automatic estimation of the radial deformation in axisymmetric tensile specimens via analysis of digital images recorded during the experiments. This kind of reasoning is possible since the transverse isotropy ensures the constancy of the aspect ratio of the cross section all over the test, as also shown in Mirone et al. [23,24]. If, instead, the material exhibits anisotropic plasticity, then the aspect ratio of the specimens changes during a test, e.g., rectangular cross sections change their width/thickness ratio and round cross sections become elliptic, as observed in Mirone et al. [23,25]. In such cases, simultaneous video acquisitions from two orthogonal viewpoints have been successfully adopted in [25] for deriving the post-necking true curves, but this procedure requires more experimental efforts than usual tensile tests. Even more complex experimental setups, using double video acquisition, are those implementing 3D Digital Imaging used to study anisotropic materials as in [23,26,27]. Zhang et al. [28] analyzed the relationship between area and thickness reduction during a tensile test, observing that the total the ratio ΔA/A0 can be decomposed into a proportional term and a non-linear term depending on the ratio Δt/t0.
In this work, a simple method is proposed to extend the true-stress–true-strain curve of anisotropic flat tensile specimen over the post-necking region, using the standard experimental equipment with a single camera for optical strain measurements, without the addition of a secondary video acquisition orthogonal to the main one. This procedure is based on the experimental relationship between the reducing specimen thickness and width which, thanks to the volume conservation of the parallelepiped specimen volume, before necking onset can be determined by a single camera delivering the elongating length and the shrinking width. Such reductions are found to evolve according to a simple power function for each material, which also reflects the thickness and the width at failure, measured on the fractured specimens after the test ends. Then, the power laws are taken as reliable between necking onset and failure, delivering all the necessary information to calculate post-necking true-stress–true-strain curves. The relationships describing the width-thickness evolution also deliver the Lankford coefficient of the anisotropic material, solving some intrinsic complications in determining its magnitude at low plastic strains.
2. Four Approaches to the Stress and Strain Derivation in Flat Tensile Specimens
High-strength steels and other structural alloys may exhibit early necking and significant ductility at the same time, so that that the necking phenomenon nearly affects their entire tensile flow curves.
The quantification of the necking effect on the true curve of flat plate or thin sheet specimens is more complex than it is for round specimens [23,24]. If the material is anisotropic, then further considerations apply [25,28].
Before the necking onset, the true curve is perfectly coincident to the flow curve, but afterward, the load/area ratio includes the hydrostatic stresses due to the distorting geometry of the specimen, which contributes to the neck-averaged axial stress but not to the flow stress. Various models [18,19,20] are available to correct the true curve after necking onset, transforming the post-necking true stress into an estimate of the neck-averaged equivalent flow stress.
By definition, the true stress and the true strain for smooth tensile specimen are:
where , , and L0 and are the undeformed cross section and the gage length in the initial undeformed state and in the current deformed state.
For a smooth tensile specimen with rectangular cross section, where the volume of the gage length is a straight parallelepiped (see Figure 1), the true curve can be determined through four different experimental postprocessing approaches, all nominally accurate and perfectly coincident to each other under standard isotropy conditions.
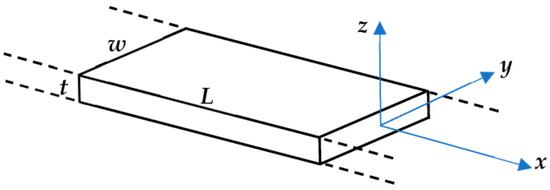
Figure 1.
Specimen orientation and relevant dimensions.
2.1. L-Based (Measurements of the Gage Length)
The L-based procedure is the oldest and most common method. The volume conservation over the parallelepiped volume of Figure 1 yields , therefore Equations (1) and (2) become:
where L0 and are the original and the current elongated gage length. This approach is the most popular because the elongation measurement is very simple. It is known to be only valid up to necking onset and to rapidly loose accuracy afterward as the specimen shape becomes hourglass-like.
2.2. W-Based (Measurements of the Neck Width)
If the material is isotropic, then the ratio of thickness/width remains constant throughout the test: therefore, measured experimentally also delivers the thickness: . Therefore, the cross section can be expressed as: and Equations (1) and (2) become:
This method is an improvement of the L-based one because, for isotropic materials, it extends the true curve beyond the necking onset and up to failure.
2.3. DIC-Peak (Local Peak Strain from Digital Image Correlation)
Depending on the aspect ratio of the cross section, the peak of axial strain from DIC measurements on the necked specimen can be more or less close to , (also expressing the neck-averaged axial strain). As depicted in Figure 2, the strain distributions at the mean plane of thick specimen can be quite higher than those on the surface in case of nearly-square cross sections (large through-the-thickness gradients), while in case of thin specimens, the strain distributions are almost invariant along the thickness direction (negligible through-the-thickness gradients). Then, in the former case the DIC-peak strain can be lower than the section-averaged strain , while in the latter case it is certainly higher.
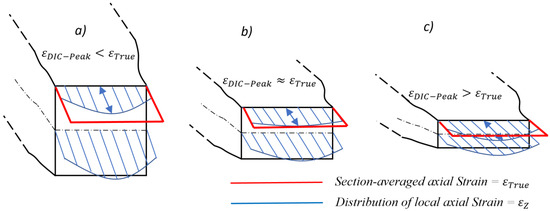
Figure 2.
Core and Surface strain distributions in thick to thin specimens (a–c).
Cross sections with the proper intermediate aspect ratio can make the DIC-peak strain close or equal to , although the achievement of this condition within acceptable accuracy would require remarkable efforts in calibration and design of experiments. Furthermore, to control (increase) the thickness/width ratio of the specimens with thin sheet metals leads toward the overall specimen miniaturization.
Within the accuracy limits of assuming that the DIC-peak strain is representative of , the true stress and strain as in Equations (7) and (8) are available:
where delivers the current deformed cross section of the specimen.
2.4. L & W-Based (Measurements of Length and Neck Width)
If the material response is anisotropic, then the constancy of the ratio is not preserved during the test. Therefore, cannot be derived from simple width measurements and the W-based approach is not valid, either before necking onset or after. Under such circumstances, the L-based procedure still applies to the pre-necking range (the conservation of the parallelepiped volume of the specimen still applies), but no option is available at later test stages.
Therefore, a new procedure is proposed here for deriving an estimate of the true curve after necking onset of anisotropic flat tensile specimens. Combining the measurements of both and w, the evolving ratio can be indirectly derived throughout the pre-necking strain range due to the volume conservation, according to Equation (9):
For isotropic materials, this relationship degenerates in but for anisotropic materials, the general unknown relationship between and must be derived from experimental measurements by relating the outcome of Equation (9) to the measured evolving ratio .
Equation (9) is only valid before necking onset and it stops being reliable afterward because the necking results in the specimen volume no longer being a straight parallelepiped.
To estimate how evolves after necking onset, the trend derived from Equation (9), based simply on measurements of and , could be prolonged throughout the post-necking range up to failure. The values and at failure can also be determined from image analysis of broken specimens, to verify the possibility of extending the pre-necking trend of Equation (9) beyond necking onset and, thus, to validate the proposed procedure.
The above approaches are implemented with the experimental data from a campaign on two automotive alloys, as detailed in the next sections.
3. Materials and Methods
The automotive alloys at hand are a high-strength martensitic steel PHS1800 and an aluminium alloy AL6181. Their nominal yield stresses are, respectively, 1500 MPa (ultimate stress 1800 MPa, elongation at failure 5%) and 230 MPa (ultimate stress 365 MPa, elongation at failure 23%), and their chemical compositions are reported in Table 1.

Table 1.
Composition of PHS1800 steel and AL6181 aluminium alloy.
Static tests at 3 × 10⁻⁴/s are run with an electromechanical testing machine, medium-rate dynamic tests at 10/s are run with a hydraulic testing machine, and high strain rate tests at 250/s are run with a direct-tension Hopkinson bar (see Figure 3).
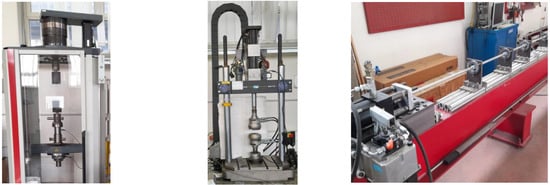
Figure 3.
Testing machines for static (left), intermediate (centre), and high strain rate (right) experiments.
Three repetitions are made for each material at each rate, for a total of 18 tests, using flat specimens, as in Figure 4.
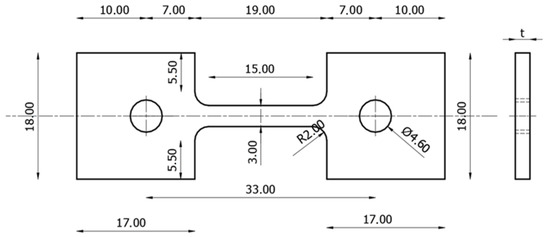
Figure 4.
Specimen dimensions in mm.
The PHS1800 specimens are 1.5 mm thick while the Al6181 specimens are 2.0 mm thick.
The current tensile load is derived either by the load cell of the testing machine or by the three-waves procedure on the Hopkinson bar. Optical measurements are taken on the frames of video acquisitions of the front view of the specimen, deriving the L-based, w-based and DIC-Peak strains as discussed in the previous section. A Phantom V-711 speed camera (Vision Research Inc., Wayne, NJ, USA) is used for dynamic tests, delivering up to 200.000 frames per second at a resolution of 250 × 150 pixels for the faster tests. Representative series of data are reported in the figures below for each material.
4. Discussion of Results
This section reports the application of the above procedures to the experimental results, showing the different outcomes and comparing them to each other.
First, the strain histories, according to the four discussed approaches, are plotted and compared to each other for six representative tests within the experimental campaign. All the strain histories of the PHS1800 steel (left column of Figure 5) are almost overlapping each other until the necking onset (early necking strain at all rates), independently of the procedure used for their derivation.
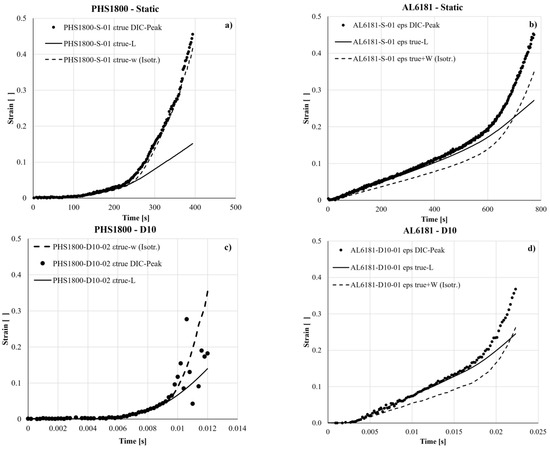
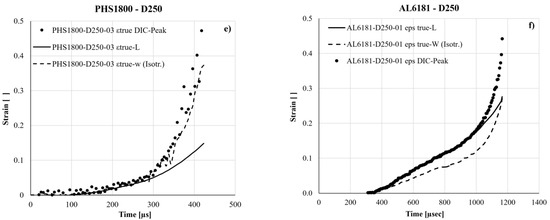
Figure 5.
L-based, w-based, and DIC-Peak Strain histories for PHS1800 steel (a,c,e) and AL6181 alloy (b,d,f) in representative tests at static and dynamic rates.
This means that the eventual anisotropy of such steel negligibly affects the equality , so that and the strain definitions of Equations (1) and (5) are coincident with each other, . Instead, the identity of strains from Equations (1), (3), and (7), , is always guaranteed before necking onset because of the stress–strain uniformity, independently of the isotropic/anisotropic response of metals.
After necking onset, completely fails to reflect the strain localization and starts underestimating the effective true strain, instead and more closely reflects the strain surge due to the necking localization, as visible in Figure 2c. In the post-necking range, can be only affected the eventual anisotropy, while is likely affected, to different extents, by the through-the-thickness gradients depicted in Figure 2.
Therefore, while the pre-necking strain history of the PHS steel is identified and validated by all three strain definitions (short strain range from 0 to 0.05), currently no reliable prediction is available over the much longer post-necking strain range (between 0.05 and 0.35 for dynamic tests, up to 0.5 for the static ones), where the effective true strain stays somewhere between the three different predictions of , and .
The DIC-Peak readings on this steel also tend to scatter at high strains because the outer surface of this alloy is covered by a natural oxide layer that is detrimental to the adhesion of the DIC paint pattern. Figure 6a shows the necked D250-01 specimen at incipient failure, with its DIC pattern just sprayed over a center strip of the front surface to try to improve its adhesion, evidencing that before failure the surface layer free of paint also deteriorates and detaches.
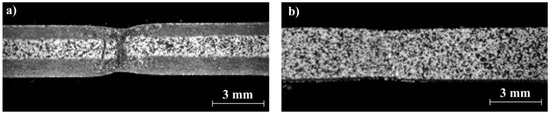
Figure 6.
Deformed specimens of PHS1800 (a) and AL6181 (b).
The AL6181 alloy (in Figure 6b the D250-01 specimen at incipient failure) exhibits much less pronounced necking distortion and good adhesion of the DIC pattern covering the entire surface.
Before the necking onset (strains below ), the strain histories of the AL6181 alloy remarkably differ from each other (second column of Figure 5): the strains and remain identical to each other because of the pre-necking strain uniformity, but is quite lower than the former strains, which highlights a pronounced anisotropy effect. In fact, the evidence that can be expressed as:
Before necking onset, the specimen is still a straight parallelepiped independent of the material anisotropy; then volume conservation yields:
Combining Equations (10) and (11) delivers:
The inequality in (12) proves that the Al6181 alloy exhibits plastic anisotropy and that the strains parallel to the thickness are greater than those parallel to the width. This means that and also correctly deliver the pre-necking true strain for anisotropic materials, while only does so for isotropic materials.
In the post-necking phase, and also progressively bifurcates from each other, so that the three discussed approaches deliver three distinct predictions during this phase of the tests.
For the alloy AL6181, the pre-necking true strain can also be accurately determined despite the anisotropy; however, so far no reliable estimate of the true strain is available in the post-necking range (from 0.12 to somewhere around 0.35). These uncertainties about the post-necking true strain also apply to the shrinking neck section and, in turn, to the related true stress.
Both metals at hand exhibit failure strains roughly around 0.45, with necking strains of 0.05 (Steel) and 0.12 (Al alloy); therefore, the above uncertainties about the true curve respectively apply over nearly 90% and 75% of the material life.
4.1. Neck Section of Flat Anisotropic Specimens
The trend of the thickness reduction, , is estimated by the volume conservation according to Equation (13), which is only valid in the pre-necking phase because the specimen shape still remains a straight parallelepiped:
Over the post-necking phase of a test, Equation (13) stops delivering accurate evaluations of the ratio because the shape of the specimen progressively assumes the typical hourglass-like aspect. However, the ratios at failure and are obtained in this work by image analysis of the fractured specimens, as visible in Figure 7 for two representative tests.
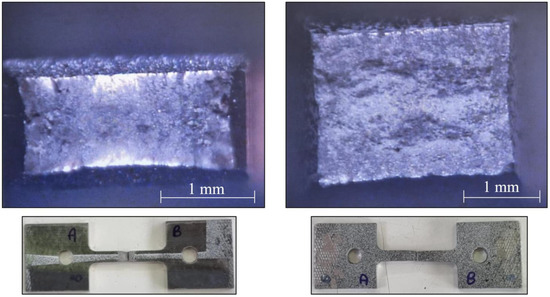
Figure 7.
Thickness and width at failure from broken specimens of PHS1800 (left) and AL6181 (right).
Figure 8 reports the experimental values of plotted against the width reduction ratio , for representative tests of each material sheet: the pre-necking data from Equation (13) are reported as a dense scatter of circular points and the post-necking values (where Equation (13) stops being valid) are reported, for completeness, as the dashed curves. Data at failure are identified by triangular points.
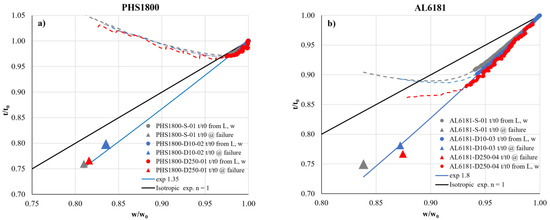
Figure 8.
Thickness reduction vs. width reduction for PHS1800 steel (a) and AL6181 alloy (b) representative tests at static and dynamic rates.
The initial undeformed state of the specimen corresponds to the point of coordinates (1;1); as the test proceeds, the cross section shrinks and the successive points of the trend move backward.
The valid data of vs. consisting of the pre-necking range together with the isolated points at failure, are found to very closely follow a power law according to Equation (14), plotted as the blue continuous curves in Figure 8, with best-fit exponents n = 1.35 for the PHS steel and n = 1.8 for the Al alloy.
After the necking onset, Equation (13) stops delivering reliable estimates, so the resulting trends quickly change their path and the dashed curves bifurcate from the respective power laws. The black continuous curves in Figure 8 refer to the case of perfect isotropy where , so that the function of Equation (14) degenerates into an identity function and its plot becomes a straight 45 degree segment.
The exponents, n, of the approximating functions in Figure 8 also exhibit the important feature of expressing the ratio of strain along the thickness/strain along the width, also known as Lankford coefficient Ryz or Rzy. Applying the logarithm to both sides of Equation (14), before necking onset yields:
Figure 8 indicates that if the power trend of Equation (14) adequately describes the relationship between thickness and width of anisotropic specimens before necking and at failure, its estimate is also reliable all over the post-necking strain range. This means that the proposed procedure can deliver the shrinking cross section of anisotropic tensile specimens from simple optical measurements of the specimen width and length, possibly supported, for further validation, by width–thickness measurements on the fractured specimens.
It is also demonstrated now that if the Lankford coefficient is evaluated directly from the strains, instead of being derived as the exponent of the best-fitting curve of vs. , accuracy issues arise, especially in case of early necking materials, because of the intrinsically indetermined ratio between plastic strains tending to zero at the beginning of the plastic range.
Figure 9 compares the Lankford coefficient from four representative experiments according to Equation (16) against the estimate discussed before:
with calculated once by the L-based and w-based strains, then by DIC-Peak strains along x and y directions.
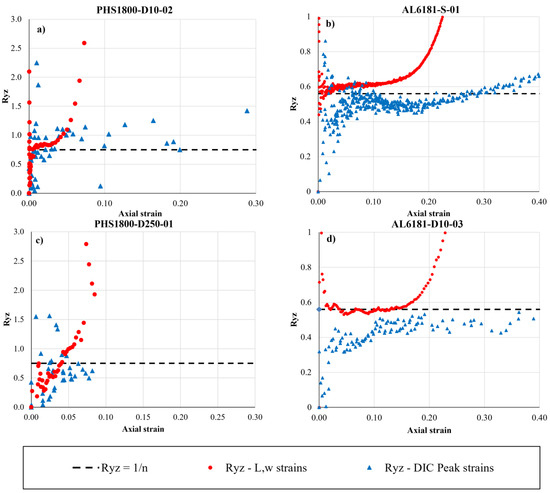
Figure 9.
Lankford coefficients from DIC strains, from L-w strains, and from power laws of the t-vs.-w reduction in representative tests on PHS1800 (a,c) and AL6181 (b,d).
The trends of for the PHS1800 steel (Figure 9a,c) are scattered and poorly readable during the short phase of uniform-straining of the tests because of the early necking of the material. In fact, at true strain levels within 0.05, an acceptable engineering resolution of 0.005 in the measurement of strains delivers an uncertainty in excess of ±50% over a reference value of isotropic materials. Such intrinsic unsteadiness of worsen at lower plastic strains and tends to an indeterminate form 0/0 at first yield.
After necking onset, the DIC-Peak-based Lankford coefficient of the PHS1800 steel continues oscillating without delivering a distinct trend (Figure 9a) or is interrupted prematurely because of the deteriorating/detaching speckle discussed before (Figure 9c). Instead, the Lankford coefficient based on L and w after necking quickly diverges up to unrealistic values because the L-based definition greatly underestimates the axial strain while the w-based definition acceptably estimates the transverse strain, which obviously affects the outcome of Equation (16).
In the pre-necking phase of the AL6181 alloy (Figure 9b,d), the Lankford coefficient predicted by the L-w approach is higher than that based on the DIC-Peak strains; after necking onset, the latter trend of Ryz remains almost constant, although remarkably dispersed. Instead, the former trend rapidly diverges due to the underestimation of the L-based axial strain mentioned above.
The estimates of Ryz based on the power-function fit of Equation (15) are also reported as dashed lines in Figure 9. For the early-necking PHS steel, such an estimate is the only option because the DIC-Peak and the L-w options do not convey useful information. For the later-necking Al alloy, the power law estimate allows us to improve and prolong the moderately accurate predictions of the pre-necking L-w approach beyond necking onset.
4.2. True Curve of Flat Anisotropic Specimens
The extrapolation of after necking onset by way of Equation (14) also allows us to derive the evolution of the neck section accounting for the anisotropic response, as:
Then the post-necking true stress-true strain curves, based on the specimen width, can be improved accounting for the anisotropic response. Taking into account Equations (14) and (17), the true stress and true strain defined in Equations (1) and (2) become:
It is worth noting that for n = 1, Equations (18) and (19) degenerate into Equations (5) and (6) for the w-based true data of isotropic materials.
The true curves derived by the four procedures discussed so far, namely: L-based, W-based, DIC-based and Exponent-based (according to Equations (18) and (19)); are compared to each other in Figure 10 for a selection of representative tests.
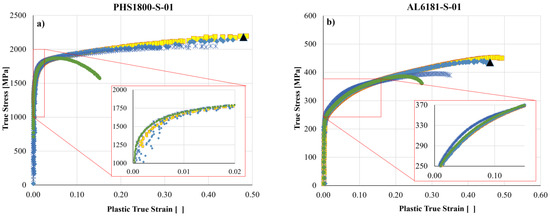
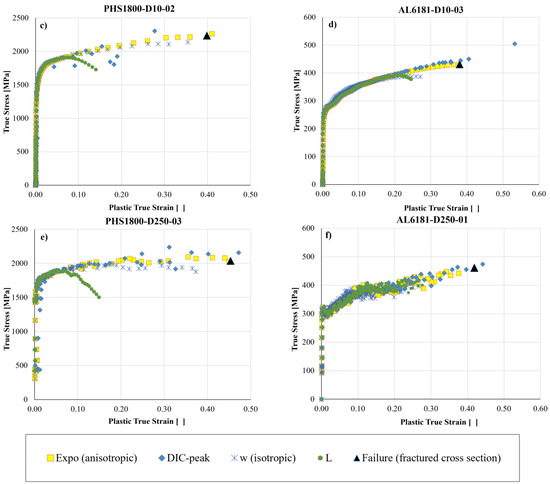
Figure 10.
Comparison of experimental true curves according to different approaches from representative tests at static and dynamic rates on PHS1800 steel (a,c,e) and AL6181 alloy (b,d,f).
Until necking onset, the L-based, DIC-based and Exponent-based true curves of Figure 10 are obviously coincident with each other. The w-based true curves slightly differ from the above three curves because of the neglected anisotropy in estimating cross section (see magnified plots for the static tests).
Over the post-necking phase, the various procedures deliver rather different responses. The L-based true curves obviously stop delivering useful information and quickly fail, independently of the material considered, because the strain based on the gage elongation completely fails to estimate the strain localization due to necking: the L-based estimate of the true strain at failure is 0.15 while the effective value is around 0.45.
The w-based true curves, which in the case of isotropic metals are the most accurate and very simple to determine, rely on the aspect ratio of the cross section remaining constant during the test, which contrasts with the anisotropic response. In fact, such curves are slightly inaccurate for the PHS1800 steel which only exhibits moderate anisotropy (w-based failure strains in Figure 10a,c,e are underestimated slightly more than 10%), but are largely underestimating the post-necking stresses and strains for the AL6181 alloy which exhibits a more pronounced anisotropy (w-based failure strains in Figure 10b,d,f are underestimated of more than 30%).
The dynamic DIC-based true curves of the PHS steel are slightly scattered (Figure 10e) or interrupted before failure (Figure 10c) because the deteriorating surface of the metal causes the painted speckles to detach and spoils the strain measurements. By contrast, the DIC-based true curves of the Al alloy (Figure 10b,d,f) are steady and continuous up to failure, eventually overestimating the failure strain (Figure 10d). The scatter band, only visible in the true curves of the aluminium at 250 s−1 (Figure 10d), is due to electrical noise disturbing the load acquisition during those tests (it also appears in the L-based curve).
The DIC-based true curves are intrinsically affected by difference between the local peak strain on the specimen surface and the effective section-averaged true strain, as depicted in Figure 2. However, all the DIC-based true curves in Figure 10 pass rather close to those of the failure points from measurements on the broken specimens, meaning that for the given alloys and specimen geometries, the error introduced by the above difference is quite small.
This confirms that despite that the error intrinsic in the DIC-based procedure is not predictable or controllable a priori, small-sized metal sheet specimens with low aspect ratio w/t (2 for the PHS steel and 1.5 for the Al alloy), allow us to obtain reasonable accuracy with the procedure at hand. Relatively thinner specimens, such as those prescribed by the usual regulations ( exceeding 10), would certainly deliver overestimated DIC-based true curves, with the typical upward convexity as in [6].
The Exponent-based true curves in Figure 10, obtained by proposed Equations (18) and (19), exhibit steady undispersed trends, for all tests of both metals, and are the only ones unaffected by any conceptual error/approximation throughout the post-necking range, independently of the material hardening/necking/anisotropy (PHS1800 and AL6181 alloys greatly differ from each other in all these viewpoints), and regardless of the width/thickness ratio of the specimen (ranging from 2 to 3 for our experimental campaign).
The only inference delivering the Exponent-based procedure was that the trend of vs. over the post-necking phase follows the same power function, which appropriately describes such experimental relationship before necking and at failure. This is a natural deduction rather than an assumption or hypothesis; therefore, these curves are the most intrinsically accurate ones among those considered and are taken as the reference curves in the next considerations.
Then, the Exponent-based true curves proposed in this work as and advancement for the stress/strain characterization of anisotropic sheet metals, are compared ahead to the standard true curves relying on the L-based procedure, for all the static/dynamic tests of the experimental campaign at hand.
Given that three identical repetitions were run for each material and each strain rate, an assessment of the test repeatability is made in Figure 11 by reporting the true curves from representative static and D250 experiments on the PHS1800 steel, and static and D10 experiments on the AL6181 alloy.
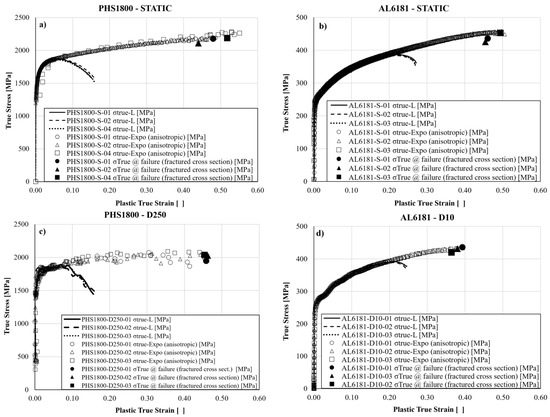
Figure 11.
Repeatability of tests for PHS1800 steel (a,c) and AL6181 alloy (b,d).
Despite the deterioration of the DIC speckle on the PHS steel affected the optical measurements, the corresponding true curves in Figure 11 are quite close to each other; whereas those of the AL6181 alloy are fully overlapped. Thanks to the overall test repeatability evidenced in Figure 11, the data from a single test are taken as representative of the entire corresponding series of three identical test repetitions. Then the L-based and the Exponent-based true curves from all test series are plotted together in Figure 12 for each material in order to assess the differences between the two approaches at the static and dynamic rates investigated.
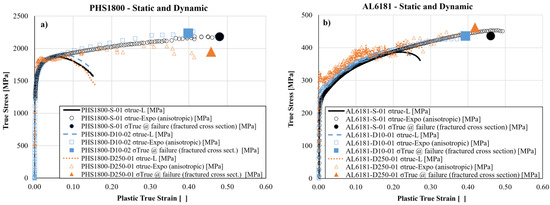
Figure 12.
Summary of L-based and Exponent-based static and dynamic true curves for representative tests of anisotropic PHS1800 (a) and AL6181 (b).
The overview in Figure 12 for all the test series confirms the outcomes of the previous representative tests. In fact, the proposed Exponent-based true curves fully overlap the classical L-based true curves within the necking onset, where both curve series are not affected by any formal/conceptual approximation. Afterward, the Exponent-based curves continue delivering their prediction over the entire post-necking range, simply based on extending the pre-necking trend of the anisotropic deformation and on the thickness/width measurements on the failed cross sections, while the L-based curves fail to convey further realistic stress-strain data.
The true curves of the AL6181-D250 tests exhibit more scatter than other curves, including those of the similar D250 tests made on the PHS steel, because of noise from the electrical network affecting the acquired load signal in the SHTB; in fact, the strain measurements of such AL6181-D250 test, as seen in Figure 5, are as smooth and unscattered as those from other tests.
The Exponent-based procedure does not incorporate any conceptual approximation as the L-based procedure does (neglecting the whole necking effect), as the w-based procedure does (neglecting the anisotropic shrinking of the neck section), and as the DIC-based procedure does (neglecting the unpredictable differences between local strain readings and section-averaged true strains which depend on the specimen aspect ratio and on the material hardening).
Summarizing, the Exponent-based procedure proposed here for deriving the neck evolution and the post-necking true curve is the main outcome of the paper. It has the merit of removing some conceptual inaccuracies intrinsic in the other procedures and of easily delivering the true curves of anisotropic sheet metals extended throughout the post-necking range up to failure, together with a steady robust estimate of the anisotropy Lankford coefficient unaffected by the numerical noise at low plastic strains.
In fact, both post-necking true curves and Lankford coefficients are quite difficult to determine with other means when anisotropic materials exhibit early necking onset and remarkable ductility, such as the alloys considered here (the pre-necking range just covers around 10% of the straining life for the PHS1800 steel and 25% for the AL6181 alloy).
Finally, it is necessary to recall that the true curves of elastoplastic materials are not yet the flow curves expressing their plastic hardening because after necking onset, the former curves include triaxiality contributions which should be corrected (e.g., [18,20]) in order to deliver the latter curves. Furthermore, to model the two materials at hand by finite elements analyses, their anisotropy should also be assessed and modelled, first by repeating the experimental campaign we have discussed so far with specimens machined along other directions, and then by selecting and calibrating a suitable anisotropy model (e.g., refs. [29,30]) to describe the experimental anisotropy.
Both such aspects lie beyond the scopes of the present work, the goal of which was to assess and possibly remove the conceptual approximations of the usual procedures to calculate the true-stress–true-strain curves and the Lankford coefficients from tensile tests on flat specimens of anisotropic metals.
5. Conclusions
The derivation of the true curves of anisotropic sheet metals has been addressed in this paper, focusing on the post-necking phase, which, for modern structural alloys exhibiting early necking and late failure, may nearly cover the entire plastic strain range. Three known procedures have been reviewed, highlighting the conceptual approximations intrinsic in their whole definitions and assessing the errors induced by such approximations.
The most common L-based procedure is known to become of no use after necking onset, delivering greatly underestimated true strains at failure close 0.15 for the PHS steel and 0.25 for the Al alloy.
The w-based procedure, simple and reliable in the case of isotropic materials, is spoiled by the anisotropy throughout the plastic strain range, even before necking onset. It underestimates the failure strain of 10% for the moderately anisotropic PHS steel, and of around 30% for the more remarkably anisotropic Al6181 alloy.
The DIC-based procedure delivers underestimating/overestimating true curves depending on the through-the-thickness gradients of stress and strain and, in turn, on the aspect ratio of the specimen and on the more or less pronounced hardening of the material. For the metals at hand and the adopted specimen dimensions, this procedure was quite accurate (errors around 5%) but wider specimens, of typical test regulations, would deliver larger errors.
A fourth Exponent-based procedure is then proposed, where the exponent of the power law closely approximating the evolution of the normalized thickness/width ratio before necking onset and at failure delivers the Lankford coefficient. The Exponent-based procedure removes the approximations and limits of the three more classical procedures, simply delivering the true curves extended over the post-necking range up to failure (error at failure within few percent with respect to the measures from broken specimens) and ensuring a robust estimate of the Lankford coefficient, unaffected by the numerical instability at low plastic stages of its classical form, which, for early necking materials, poses serious limitations to its whole derivation. For the steel and Al alloy at hand, the post-necking range respectively covers nearly 90% and 75% of their whole straining life.
Author Contributions
Conceptualization, G.M.; methodology, G.M., R.B. and G.B.; software, R.B. and G.B.; validation, all Authors; formal analysis, G.M., R.B. and G.B.; investigation G.M., R.B. and G.B.; resources, D.D.C., M.F. and M.M.T.; writing original draft preparation, G.M., R.B. and G.B; writing review and editing, all Authors; visualization, all Authors; supervision, G.M.; project administration, G.M.; funding acquisition, G.M. All authors have read and agreed to the published version of the manuscript.
Funding
This work has been partially funded by European Union (NextGeneration EU), through the MUR-PNRR project SAMOTHRACE (ECS00000022).
Conflicts of Interest
The authors declare no conflict of interest.
References
- Rossi, M.; Lattanzi, A.; Morichelli, L.; Martins, J.M.P.; Thuillier, S.; Andrade-Campos, A.; Coppieters, S. Testing Methodologies for the Calibration of Advanced Plasticity Models for Sheet Metals: A Review. Strain 2022, 58, e12426. [Google Scholar] [CrossRef]
- Jia, X.; Hao, K.; Luo, Z.; Fan, Z. Plastic Deformation Behavior of Metal Materials: A Review of Constitutive Models. Metals 2022, 12, 2077. [Google Scholar] [CrossRef]
- Pham, Q.T.; Kim, Y.-S. Evaluation on Flexibility of Phenomenological Hardening Law for Automotive Sheet Metals. Metals 2022, 12, 578. [Google Scholar] [CrossRef]
- Joun, M.; Eom, J.G.; Lee, M.C. A New Method for Acquiring True Stress–Strain Curves over a Large Range of Strains Using a Tensile Test and Finite Element Method. Mech. Mater. 2008, 40, 586–593. [Google Scholar] [CrossRef]
- Cortis, G.; Nalli, F.; Sasso, M.; Cortese, L.; Mancini, E. Effects of Temperature and Strain Rate on the Ductility of an API X65 Grade Steel. Appl. Sci. 2022, 12, 2444. [Google Scholar] [CrossRef]
- Abedini, A.; Narayanan, A.; Butcher, C. An Investigation into the Characterization of the Hardening Response of Sheet Metals Using Tensile and Shear Tests with Surface Strain Measurement. Forces Mech. 2022, 7, 100090. [Google Scholar] [CrossRef]
- Habraken, A.M.; Aksen, T.A.; Alves, J.L.; Amaral, R.L.; Betaieb, E.; Chandola, N.; Corallo, L.; Cruz, D.J.; Duchêne, L.; Engel, B.; et al. Analysis of ESAFORM 2021 Cup Drawing Benchmark of an Al Alloy, Critical Factors for Accuracy and Efficiency of FE Simulations. Int. J. Mater. Form. 2022, 15, 61. [Google Scholar] [CrossRef] [PubMed]
- Zhao, K.; Wang, L.; Chang, Y.; Yan, J. Identification of Post-Necking Stress–Strain Curve for Sheet Metals by Inverse Method. Mech. Mater. 2016, 92, 107–118. [Google Scholar] [CrossRef]
- Wu, H.; Zhuang, X.; Zhang, W.; Zhao, Z. Anisotropic Ductile Fracture: Experiments, Modeling, and Numerical Simulations. J. Mater. Res. Technol. 2022, 20, 833–856. [Google Scholar] [CrossRef]
- Peirs, J.; Verleysen, P.; Van Paepegem, W.; Degrieck, J. Determining the Stress–Strain Behaviour at Large Strains from High Strain Rate Tensile and Shear Experiments. Int. J. Impact Eng. 2011, 38, 406–415. [Google Scholar] [CrossRef]
- Tardif, N.; Kyriakides, S. Determination of Anisotropy and Material Hardening for Aluminum Sheet Metal. Int. J. Solids Struct. 2012, 49, 3496–3506. [Google Scholar] [CrossRef]
- Rossi, M.; Pierron, F.; Štamborská, M. Application of the Virtual Fields Method to Large Strain Anisotropic Plasticity. Int. J. Solids Struct. 2016, 97–98, 322–335. [Google Scholar] [CrossRef]
- Lattanzi, A.; Barlat, F.; Pierron, F.; Marek, A.; Rossi, M. Inverse Identification Strategies for the Characterization of Transformation-Based Anisotropic Plasticity Models with the Non-Linear VFM. Int. J. Mech. Sci. 2020, 173, 105422. [Google Scholar] [CrossRef]
- Rossi, M.; Lattanzi, A.; Barlat, F.; Kim, J.-H. Inverse Identification of Large Strain Plasticity Using the Hydraulic Bulge-Test and Full-Field Measurements. Int. J. Solids Struct. 2022, 242, 111532. [Google Scholar] [CrossRef]
- Marth, S.; Häggblad, H.-Å.; Oldenburg, M.; Östlund, R. Post Necking Characterisation for Sheet Metal Materials Using Full Field Measurement. J. Mater. Process. Technol. 2016, 238, 315–324. [Google Scholar] [CrossRef]
- Marth, S.; Djebien, S.; Kajberg, J.; Häggblad, H.-Å. Stepwise Modelling Method for Post Necking Characterisation of Anisotropic Sheet Metal. Modelling Simul. Mater. Sci. Eng. 2021, 29, 085001. [Google Scholar] [CrossRef]
- Maček, A.; Starman, B.; Mole, N.; Halilovič, M. Calibration of Advanced Yield Criteria Using Uniaxial and Heterogeneous Tensile Test Data. Metals 2020, 10, 542. [Google Scholar] [CrossRef]
- Bridgman, P.W. Studies in Large Flow and Fracture; McGraw Hill: New York, NY, USA, 1956. [Google Scholar]
- Choung, J.M.; Cho, S.R. Study on True Stress Correction from Tensile Tests. J. Mech. Sci. Technol. 2008, 22, 1039–1051. [Google Scholar] [CrossRef]
- Mirone, G. Approximate Model of the Necking Behaviour and Application to the Void Growth Prediction. Int. J. Damage Mech. 2004, 13, 241–261. [Google Scholar] [CrossRef]
- Corallo, L.; Revil-Baudard, B.; Cazacu, O.; Verleysen, P. Role of Anisotropy on Strain Localization at High-Strain Rates in Ti6Al4V. Eur. J. Mech.-A/Solids 2023, 97, 104856. [Google Scholar] [CrossRef]
- Shokeir, Z.; Besson, J.; Belhadj, C.; Petit, T.; Madi, Y. Edge Tracing Technique to Study Post-necking Behavior and Failure in Al Alloys and Anisotropic Plasticity in Line Pipe Steels. Fatigue Fract. Eng. Mat. Struct. 2022, 45, 2427–2442. [Google Scholar] [CrossRef]
- Mirone, G.; Barbagallo, R.; Tedesco, M.M.; De Caro, D.; Ferrea, M. Extended Stress–Strain Characterization of Automotive Steels at Dynamic Rates. Metals 2022, 12, 960. [Google Scholar] [CrossRef]
- Mirone, G.; Verleysen, P.; Barbagallo, R. Tensile Testing of Metals: Relationship between Macroscopic Engineering Data and Hardening Variables at the Semi-Local Scale. Int. J. Mech. Sci. 2019, 150, 154–167. [Google Scholar] [CrossRef]
- Mirone, G.; Corallo, D. Stress–Strain and Ductile Fracture Characterization of an X100 Anisotropic Steel: Experiments and Modelling. Eng. Fract. Mech. 2013, 102, 118–145. [Google Scholar] [CrossRef]
- Larour, P.; Freudenthaler, J.; Weissböck, T. Reduction of Cross Section Area at Fracture in Tensile Test: Measurement and Applications for Flat Sheet Steels. J. Phys. Conf. Ser. 2017, 896, 012073. [Google Scholar] [CrossRef]
- Gu, G.H.; Kim, Y.; Kwon, H.; Ahn, S.Y.; Seo, M.H.; Ahn, K.; Kim, H.S. A New Proposal for a Method to Measure Orthogonal R-Value Using a Single Tensile Test with Three-Dimensional Digital Image Correlation. Exp. Mech. 2022, 62, 999–1006. [Google Scholar] [CrossRef]
- Zhang, Z.L.; Ødegård, J.; Søvik, O.P.; Thaulow, C. A Study on Determining True Stress–Strain Curve for Anisotropic Materials with Rectangular Tensile Bars. Int. J. Solids Struct. 2001, 38, 4489–4505. [Google Scholar] [CrossRef]
- Hill, R. A Theory of the Yielding and Plastic Flow of Anisotropic Metals. Proc. R. Soc. Lond. A 1948, 193, 281–297. [Google Scholar] [CrossRef]
- Cazacu, O.; Barlat, F. Generalization of Drucker’s Yield Criterion to Orthotropy. Math. Mech. Solids 2001, 6, 613–630. [Google Scholar] [CrossRef]


Disclaimer/Publisher’s Note: The statements, opinions and data contained in all publications are solely those of the individual author(s) and contributor(s) and not of MDPI and/or the editor(s). MDPI and/or the editor(s) disclaim responsibility for any injury to people or property resulting from any ideas, methods, instructions or products referred to in the content. |
© 2023 by the authors. Licensee MDPI, Basel, Switzerland. This article is an open access article distributed under the terms and conditions of the Creative Commons Attribution (CC BY) license (https://creativecommons.org/licenses/by/4.0/).