Article

Impact of Iron Ore Pre-Reduction Degree on the Hydrogen Plasma Smelting Reduction Process

by
Daniel Ernst
1,*,
Ubaid Manzoor
2,
Isnaldi Rodrigues Souza Filho
2,
Michael Andreas Zarl
1 and
Johannes Schenk
1,3
1
K1-MET GmbH, Stahlstraße 14, A-4020 Linz, Austria
2
Max-Planck-Institut für Eisenforschung GmbH, 40237 Düsseldorf, Germany
3
Department of Metallurgy, Montanuniversitaet Leoben, 8700 Leoben, Austria
*
Author to whom correspondence should be addressed.
Metals 2023, 13(3), 558; https://doi.org/10.3390/met13030558
Submission received: 13 February 2023 / Revised: 27 February 2023 / Accepted: 8 March 2023 / Published: 10 March 2023
(This article belongs to the Section Extractive Metallurgy)

Abstract

:
To counteract the rising greenhouse gas emissions, mainly CO2, the European steel industry needs to restructure the current process route for steel production. Globally, the blast furnace and the subsequent basic oxygen furnace are used in 73% of crude steel production, with a CO2 footprint of roughly 1.8 t CO2 per ton of produced steel. Hydrogen Plasma Smelting Reduction (HPSR) utilizes excited hydrogen states with the highest reduction potentials to combine the simultaneous reduction and smelting of iron ore fines. Due to the wide range of iron ore grades available worldwide, a series of hydrogen plasma experiments were conducted to determine how pre-reduced iron ore and iron-containing residues affect reduction behavior, hydrogen consumption, overall process time, and metal phase microstructure. It was discovered that, during the pre-melting phase under pure argon, wet ore increased electrode consumption and hematite achieved higher reduction levels, due to thermal decomposition. The reduction of magnetite ore yielded the highest reduction rate and subsequent hydrogen conversion rates. Both hematite and magnetite exhibited high utilization rates at first, but hematite underwent a kinetic change at a reduction degree of 80–85%, causing the reduction rate to decrease. In comparison to fluidized bed technology, it is possible to use magnetite directly, and the final phase of the reduction can move along more quickly due to higher temperatures, which reduces the overall process time and raises the average hydrogen utilization. A combination of both technologies can be considered advantageous for exhaust gas recycling.

1. Introduction

Extreme weather events are occurring more frequently and intensely, sea levels and temperatures are rising, mountain glaciers are melting, and oceans are becoming more acidic, impacting many ecosystems [1]. The European energy-intensive industries (EII) are responsible for 15% of total European greenhouse gas emissions (GHG) and had already reduced their impact by 36% between 1990 and 2015 [2]. However, they must continue to decrease their emissions. Among these industries, the iron and steel sector is responsible for 5.7% of the EU’s total emissions, generating 21 megatonnes of greenhouse gas emissions annually [3]. Globally, the steel industry is directly responsible for 2.6 gigatonnes of carbon dioxide equivalent (CO2) emissions per year, representing 7% of the world’s energy system emissions. The industry is highly dependent on coal, which covers around 75% of its energy needs, and blast furnaces (BF) produce 73% of the world’s crude steel production [4]. Primary steel production must be maintained to obtain high material quality, but the carbon-intensive BF production route must be replaced with alternative technologies. Several pathways can mitigate CO2 emissions, including carbon capture and storage (CCS), carbon capture and utilization (CCU), and carbon direct avoidance (CDA). CDA can reduce direct CO2 emissions by over 90% compared with traditional blast furnace methods, by using green hydrogen or electricity instead of carbon [5,6].
The Montanuniversitaet in Leoben, Austria began developing the Hydrogen Plasma Smelting Reduction (HPSR) process in 1992. The process uses a DC-transferred arc between a hollow graphite electrode and melting bath to transform molecular hydrogen into higher excited states, melting iron ore fines in the high-temperature plasma core and reducing them to metallic iron with the high reduction potential of hydrogen species. This single process step replaces carbon as a reducing agent in steel production from iron ore, resulting in water vapor as the only by-product [7,8,9,10,11,12]. In the HPSR process, the type of iron ore or iron-containing residuals affects ore reduction by hydrogen. The process eliminates the prior agglomeration process, and iron ore fines can be directly introduced. The process is compared with fluidized bed reduction, which uses hydrogen as a reducing agent and fine ore as feed material. Because of these benefits, numerous research teams are attempting to improve further this procedure and the associated analytical techniques [13,14,15,16].

Fluidized Bed Reduction as a Comparable Alternative Technology

Spreitzer et al. [17] studied the factors that affect the reduction of iron ore with hydrogen. Higher temperatures and smaller particle sizes promote faster reactions and better gas utilization. Metallic iron can form porous, dense, or whisker structures during fluidized bed reduction, and the type influences process stability. Sticking and defluidization are caused by the formation of iron whiskers at excessively high temperatures, which should be avoided. High-porosity iron ores like limonite and hematite are more reducible than non-porous magnetite. Total pressure affects the final stage of reduction, but not the early and middle stages. These factors are essential for optimizing the efficiency and effectiveness of the reduction process, and understanding their influence is crucial for improving process performance [17].
Researchers conducted a laboratory fluidized bed reactor study with a 400 g hematite sample to show the influence of temperature on reduction progress, and determined three stages of reduction: fast reduction from Fe2O3 to Fe3O4, consistent rate of reduction up to 85%, and decreased reduction rate until metallic iron reduction set in. The results showed a higher reduction rate with increasing temperatures, as Figure 1a depicts [18].
Studies on different types of iron ore revealed that temperature has the most significant influence on the final stage of reduction, during which a decrease in the rate of reduction takes place. The reducibility of hematite and limonite-based ores is nearly equivalent at high reduction temperatures, Figure 1b. However, the limonite ore showed a lower reduction rate at lower temperatures. Stable fluidization was not attainable for magnetite-based ore, due to particle-sticking phenomena as soon as the first metallic iron phase was generated [19].
Magnetite’s non-porous structure makes it difficult to reduce directly, so oxidized magnetite is used instead, which has similar reducibility to natural hematite [17]. Zheng et al. [20] investigated the reduction behavior of magnetite, deep and partially oxidized Fe3O4 in a fluidized bed reactor with an H2/N2 gas mixture. Complete reduction of pure magnetite was achieved at 600 °C within 110 min, but de-fluidization occurred at an RD of 35%. The deep oxidized material showed improved fluidization performance, but a complete reduction could not be achieved. The reduction rate was improved by increasing the temperature and adding >0.25% MgO to enhance fluidization. The reduction behavior of deep and partly oxidized magnetite with 0.5% MgO was compared, and a significant improvement of the reduction rate above RD 80% was observed for the partially oxidized material [20].
More detailed studies showed that the oxidation temperature has more influence on the reduction efficiency compared with the pre-oxidation degree of the partially oxidized material [21].
This study aims to determine how pre-reduced iron ore and iron-containing residuals affect reduction behavior, hydrogen consumption level, overall process time, and microstructure of the metal phase in the Hydrogen Plasma Smelting Reduction process. With this understanding, the highest hydrogen utilization and best steel quality can be obtained by combining pre-reduction states using direct reduction and subsequent processing with hydrogen plasma to crude steel.

2. Equipment and Methods

The laboratory scale HPSR reactor, located at the Montanuniversitaet Leoben, Austria, was employed to reduce different input materials with an H2/Ar plasma, and the microstructure analysis via scanning electron microscopy (SEM) took place at Max-Planck-Institut für Eisenforschung GmbH, Düsseldorf in Germany.

2.1. Laboratory Equipment for Plasma Reduction

The entire laboratory equipment can be divided into three parts. The power supply by Messer Grießheim GmbH in Germany provides, depending on two different power levels, 100 and 160 A DC, respectively, with a maximum output of 16 kW. To avoid transformer overheating and to control the maximum power output, a silicon controlled rectifier (SCR) limits the current depending on the setting of a potentiometer when performing long-term experiments. The analysis components consist of a camera system, “Axis-Q1775”, from Axis Communication AB, Sweden, which is connected to the reactor lid, the “GAM 200” mass spectrometer from Pfeiffer Vacuum Technologies, Vienna to analyze the off gas, and the voltage/current measurement is carried out with a 4-channel analog logger “HOBO UX120-006M”. Before the exhaust gas reaches the mass spectrometer, it is purified with a gumi arabic solution to remove carbon particles and then dried in several stages with silica gel. The plasma reactor consists of a refractory and water-cooled vessel, lid, and electrode holder. It is equipped with a gas supply, hot gas filter, and charging system for continuously feeding material into the reaction zone. We refer the reader to existing publications for more detailed descriptions of all components [22,23].

2.2. Used Materials

A 170-mm hollow graphite electrode with a machined 20 × Ø10 mm step on the tip was used as a cathode, Figure 2. For each trial, 100 g of feeding material was batch-wise charged into a steel crucible (see Figure 2), with a welded ignition pin made of pure iron in the center. The influence of the iron ore’s pre-reduction degree was investigated using five different iron-containing fines whose chemical compositions are shown in Table 1. The used ores were hematitic iron oxide, magnetite ore, and wüstite ore produced out of hematitic iron ore by pre-reduction. In addition, two residues from the steel industry, referred to as EC and EP, with different degrees of metallization and zinc oxide content, were also included. The reduction was carried out with a mixture of hydrogen and argon 5.0, whose flow rates were adjusted via individual mass flow controllers, and their mixing was achieved within the gas tube. The details of the gas purity are stated in Table 2.

2.3. Experimental Plan and Procedure

A total of four trials were carried out, Table 3, to analyze the effects of pre-reduced iron ore and iron-containing industrial residuals on reduction progression, hydrogen utilization, overall process time, and microstructure.
The experimental execution was consistent for all fines. For each sample, 100 g of the input material was weighed and placed in the crucible so that the front surface of the ignition pin just remained free. The charged crucible was then placed in the reactor vessel on top of the anode, and a refractory ring was positioned around it to prevent damage to the anode if the crucible wall melted. Afterwards, the reactor system was assembled, and the gas and the cooling cycles were connected. The system was then purged with argon to remove the remaining oxygen, under a high electrode gap to prevent blowing out of fine material, until an argon content of 99% was reached in the off gas. The gas flow was stopped, then the hollow graphite electrode was moved via a spindle drive motor, to make physical contact with the ignition pin, and the power supply was turned on. The cathode was quickly adjusted to a 20 mm electrode gap when the arc was observed via the camera, and the 1–5 min pre-melting phase took place under 5 L/min Ar. After a homogeneous molten pool was achieved, the gas mixture was adjusted to 60% Ar and 40% H2 at a total flow rate of 5 L/min to start the reduction, until zero hydrogen utilization was detectable in the exhaust gas. When the hydrogen utilization reached zero, the power supply was turned off, and the reactor was purged with argon again.

2.4. Evaluation Methods

To determine the reduction progression via the thermal decomposition within the pre-melting phase and the reduction during hydrogen addition, off-gas analysis was applied. During the experiment, Ar, H2, CO, and CO2 were measured at intervals of 4.5 s. First, the absolute volume of each species was calculated via the Ar flow rate to establish the degree of reduction. This is possible because argon is an inert gas and does not participate in any reactions, and is not lost via leakage.
V A r = t i n t   V ˙ A r
V H 2 o u t = c H 2 V A r c A r
V CO = c CO V A r c A r
V C O 2 = c C O 2 V A r c A r
With the volume of the remaining hydrogen content in the off gas and the injected hydrogen in the reaction zone regulated via a mass flow controller, the volume of the used H2 and the produced water vapor can be calculated as follows:
V H 2 red = ( V ˙ H 2 i n t i n t ) V H 2 o u t
The mass of oxygen removed in the form of H2O, CO, or CO2 species is determined via the molar mass of oxygen and molar volume at standard conditions:
m O = m O , V + X = C O ;   C O 2 ;   H 2 O n · V X V m · M O
Three terminologies are used to describe the total reduction degree (RD), see Equation (7). RDOre refers to the initial state of the iron ore in terms of pure Fe2O3. Therefore, pure hematite, magnetite, and wüstite have RDOre values of 0%, 11.1%, and 33.3%, respectively. The oxygen removal due to thermal decomposition during pre-melting and, therefore, the change in the reduction degree is specified as ΔRDPreRed. During the injection of hydrogen, there is a further change in the reduction degree in the main reduction phase, represented by ΔRDred.
The ratio of the amount of oxygen removed and the oxygen content in the batch-wise charged iron ore can be used to infer the change in the degree of reduction for each species, here indicated as X. In the pre-melting phase, only CO and CO2 remove the oxygen of the thermal decomposition, and the hydrogen species is additionally involved during the main reduction phase.
R D = R D O r e + Δ R D P r e R e d + Δ R D r e d
RD Ore = ( 1 O F e 1.5 · F e ) 100 % = ( 1 m O , O r e M O 1.5 · m F e M F e ) 100 %
Δ R D X = m O , X M O   1.5 · m F e M F e 100 %
Δ R D P r e R e d = X = C O ;   C O 2 Δ R D X
Δ R D r e d = X = C O ;   C O 2 ;   H 2 O Δ R D X
The utilization degree of hydrogen is obtained from the H2 used for the reduction and the volume of hydrogen introduced.
η H 2 = V H 2 red V H 2 o u t + V H 2 r e d · 100 %
Due to measurement deviations from the mass spectrometer, even after prior calibration, as well as operator misinterpretations, the degree of reduction may be marginally higher than 100%. Small deviations (1–2%) are typically corrected by revising the evaluation. Higher deviations (e.g., 20%) require extensive investigation and a reattempt at the experiment.

2.5. Microstructural Characterization

The reduced samples, after solidification, were cut and embedded and metallographically prepared for high-resolution scanning electron microscopy (SEM). Representative regions of the materials were imaged using a Zeiss Merlin SEM (backscattered electrons mode). Energy-dispersive X-ray spectroscopy (EDX) was employed to assess the corresponding local chemistry of the constituents, at an acceleration voltage of 15 kV.

3. Results and Discussion

3.1. Reduction Progression

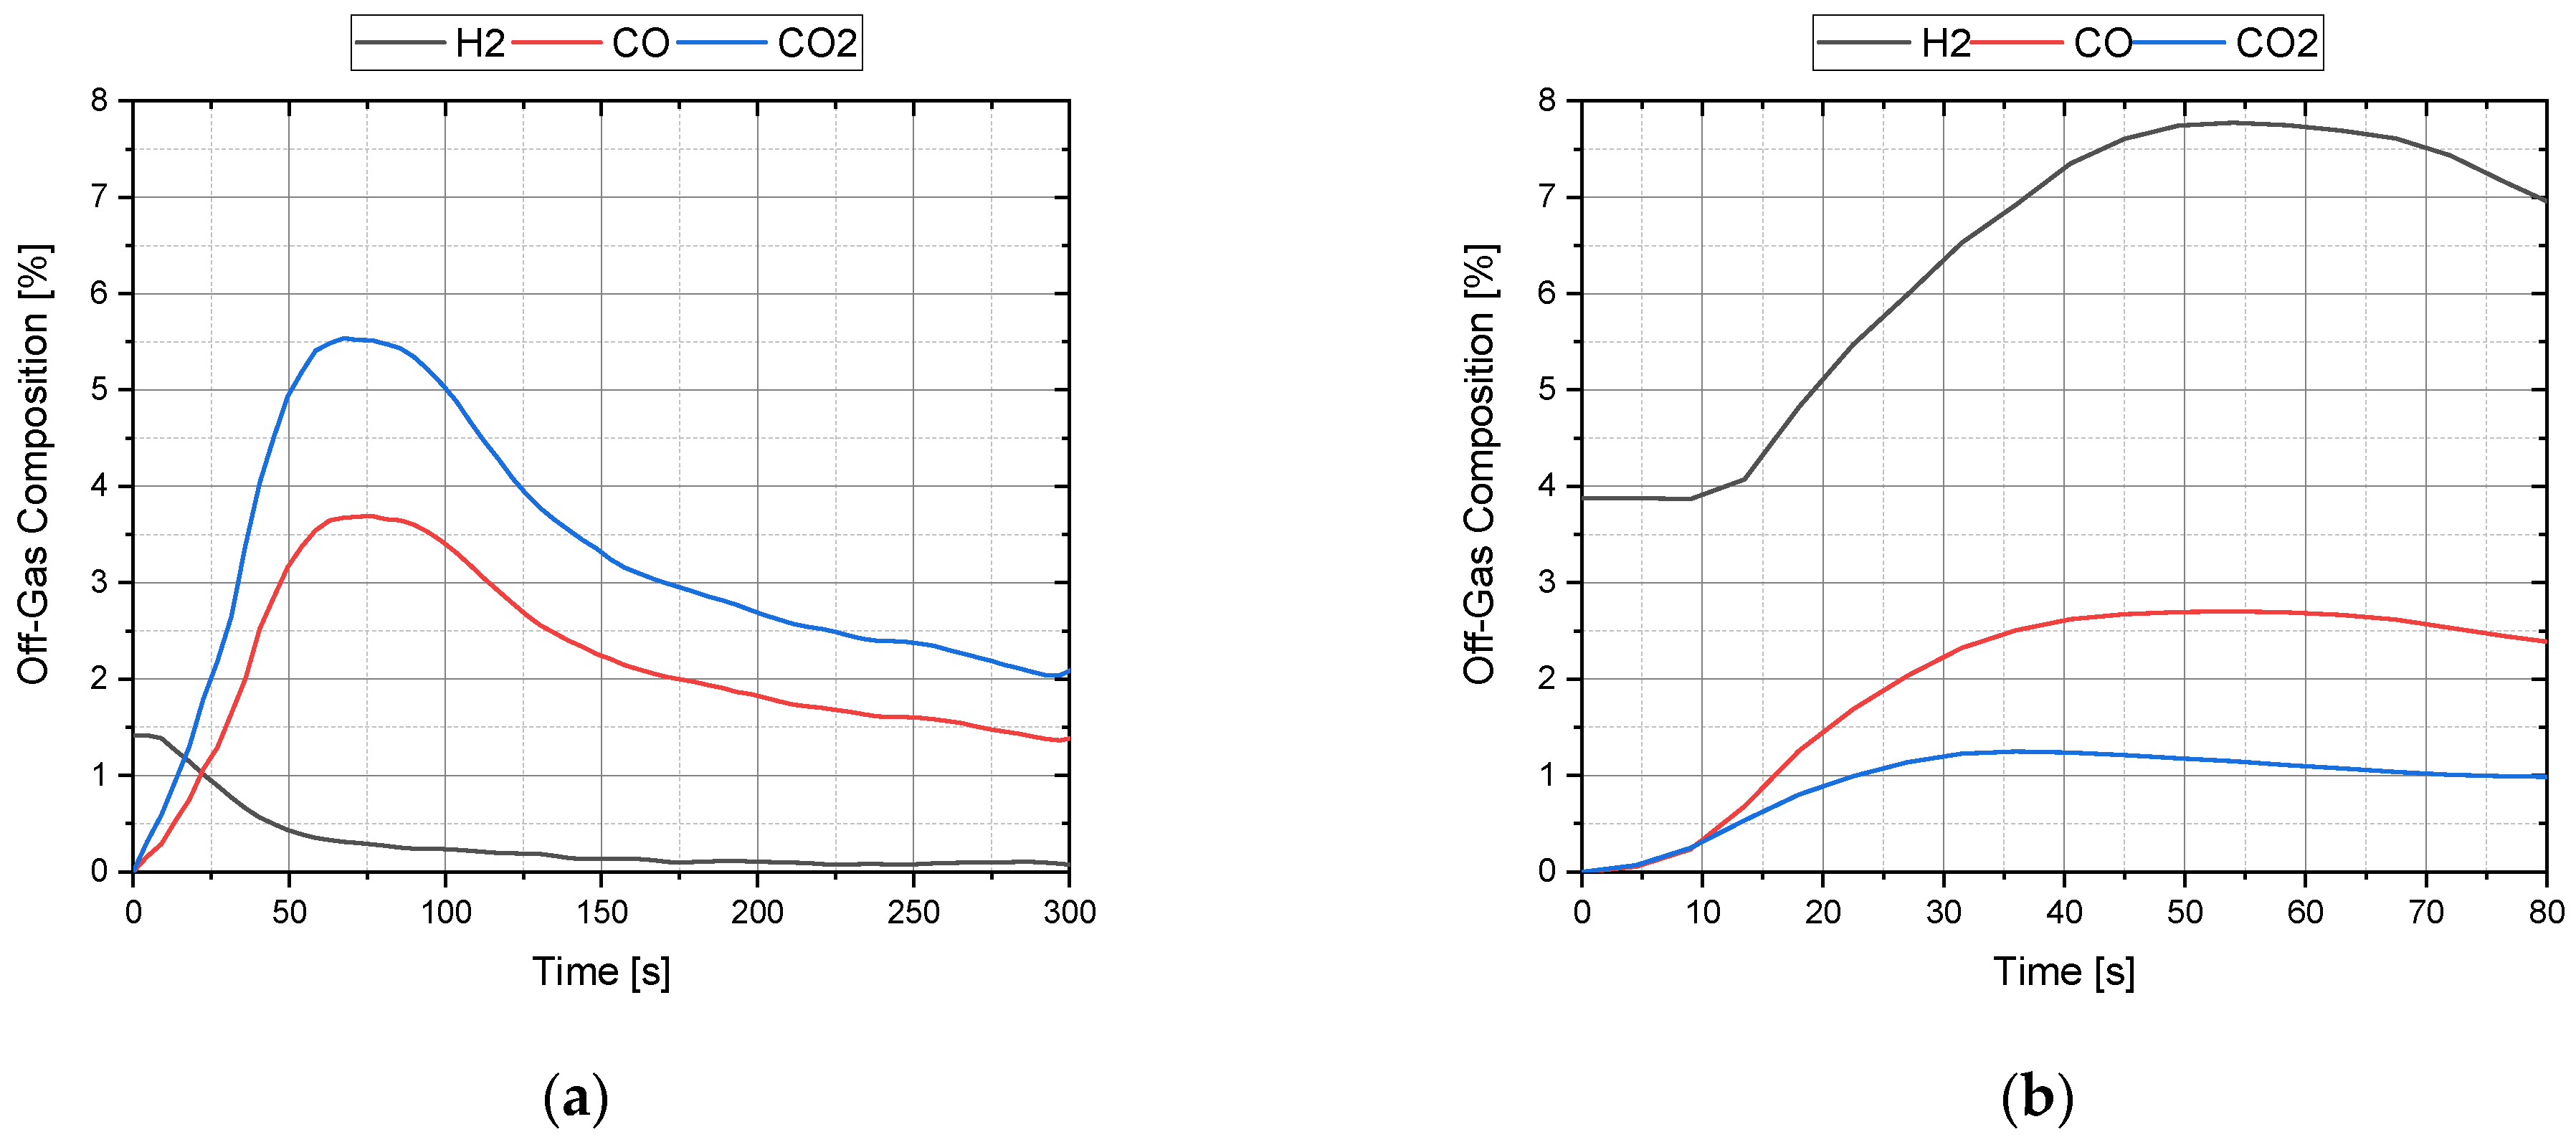
After the arc was ignited, the oxidic material was melted under pure argon. Due to the low oxygen partial pressure and the thermal decomposition caused by the melting process, pre-reduction occurs in this phase. Since no hydrogen is present, the released oxygen reacts with the graphite electrode to form CO and CO2, see Figure 3a. Additionally, as can be seen for Ex. 4 in Figure 3b, the remaining moisture in the charged material is vaporized as water vapor. This reacts via heterogeneous water–gas shift reaction to carbon monoxide with the HGE (Equation (13)), and further in the colder regions of the exhaust nozzle to carbon dioxide (Equation (14)), indicated by an increase of the hydrogen content in the exhaust gas. The CO, CO2, and H2 content diminishes when the thermal decomposition and moisture removal from the feeding material is completed, until nearly only argon is found in the exhaust gas. The remaining measured gas consists exclusively of argon. Due to the axis scaling and to enable better readability, Ar is not shown in Figure 3.
C + H 2 O C O + H 2 Δ H R = 131.2   kJ / mol
CO + H 2 O C O 2 + H 2 Δ H R = 41.1   kJ / mol
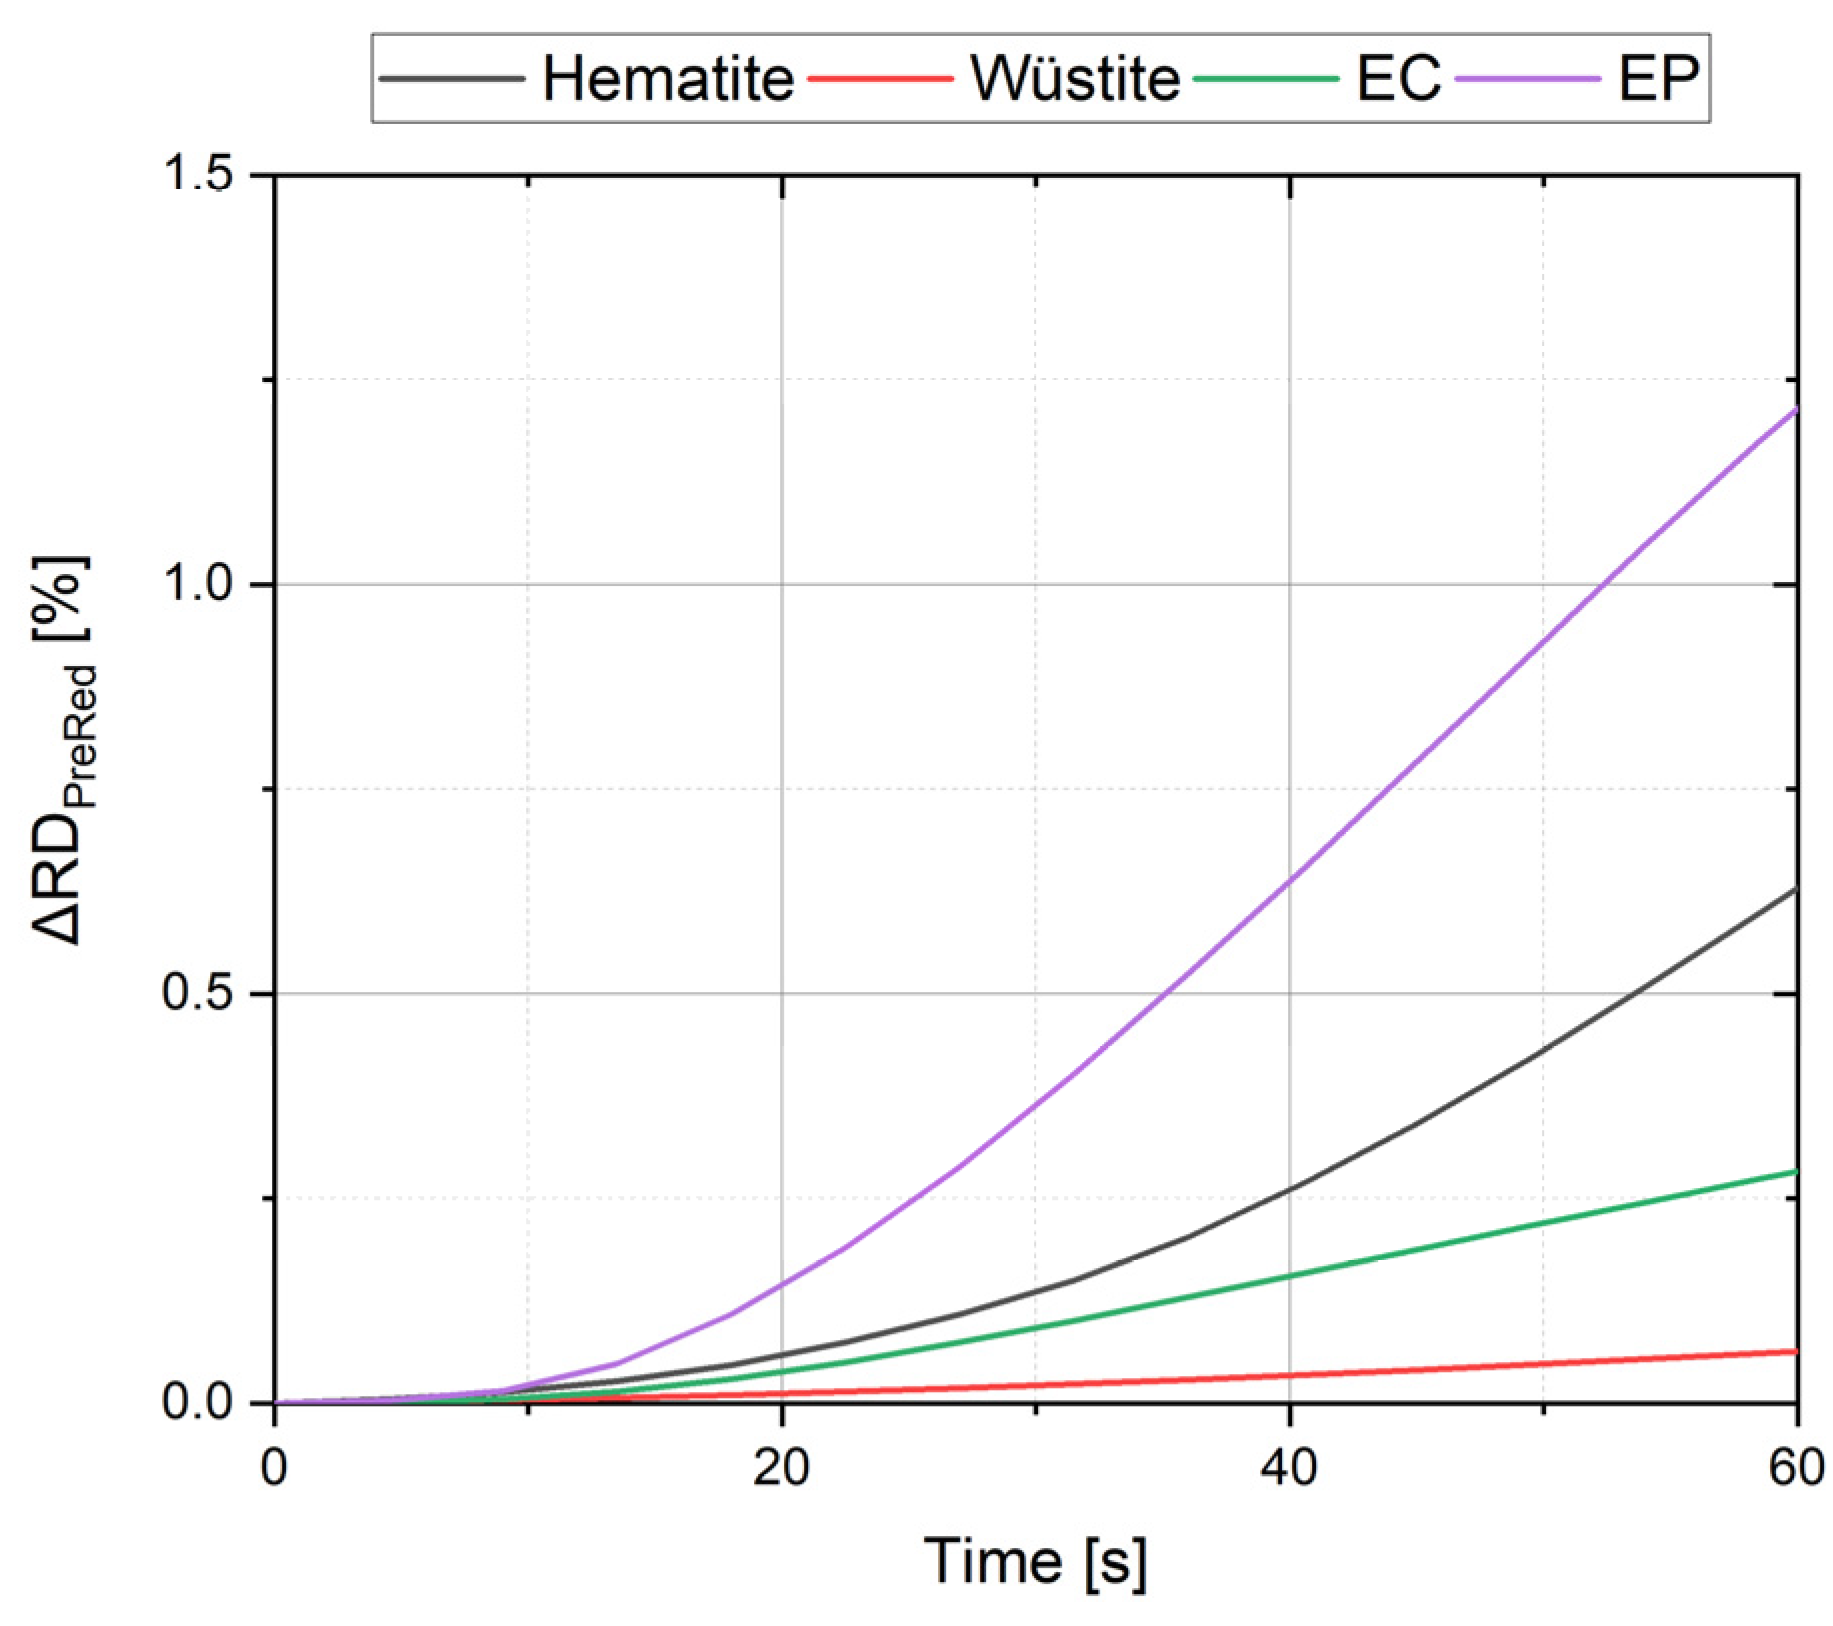
Figure 4 shows the progression of the pre-reduction degree for the first minute of pre-melting under pure argon. Due to technical issues, the pre-melting period of the magnetite iron ore could not be measured. A steep progression of the pre-reduction degree for the EP residual was evident, due to high CO and CO2 formation in this phase. It is suspected that splashes of oxide melt occurred on the electrode tip during contact ignition. As the tip quickly heated up, the carbon reduced the oxide splashes to metallic iron within a few seconds, leading to a rapid increase in the degree of reduction. A further explanation could involve compounds which were not determined in the chemical analysis and which decompose to CO2 and CO during the melting process.
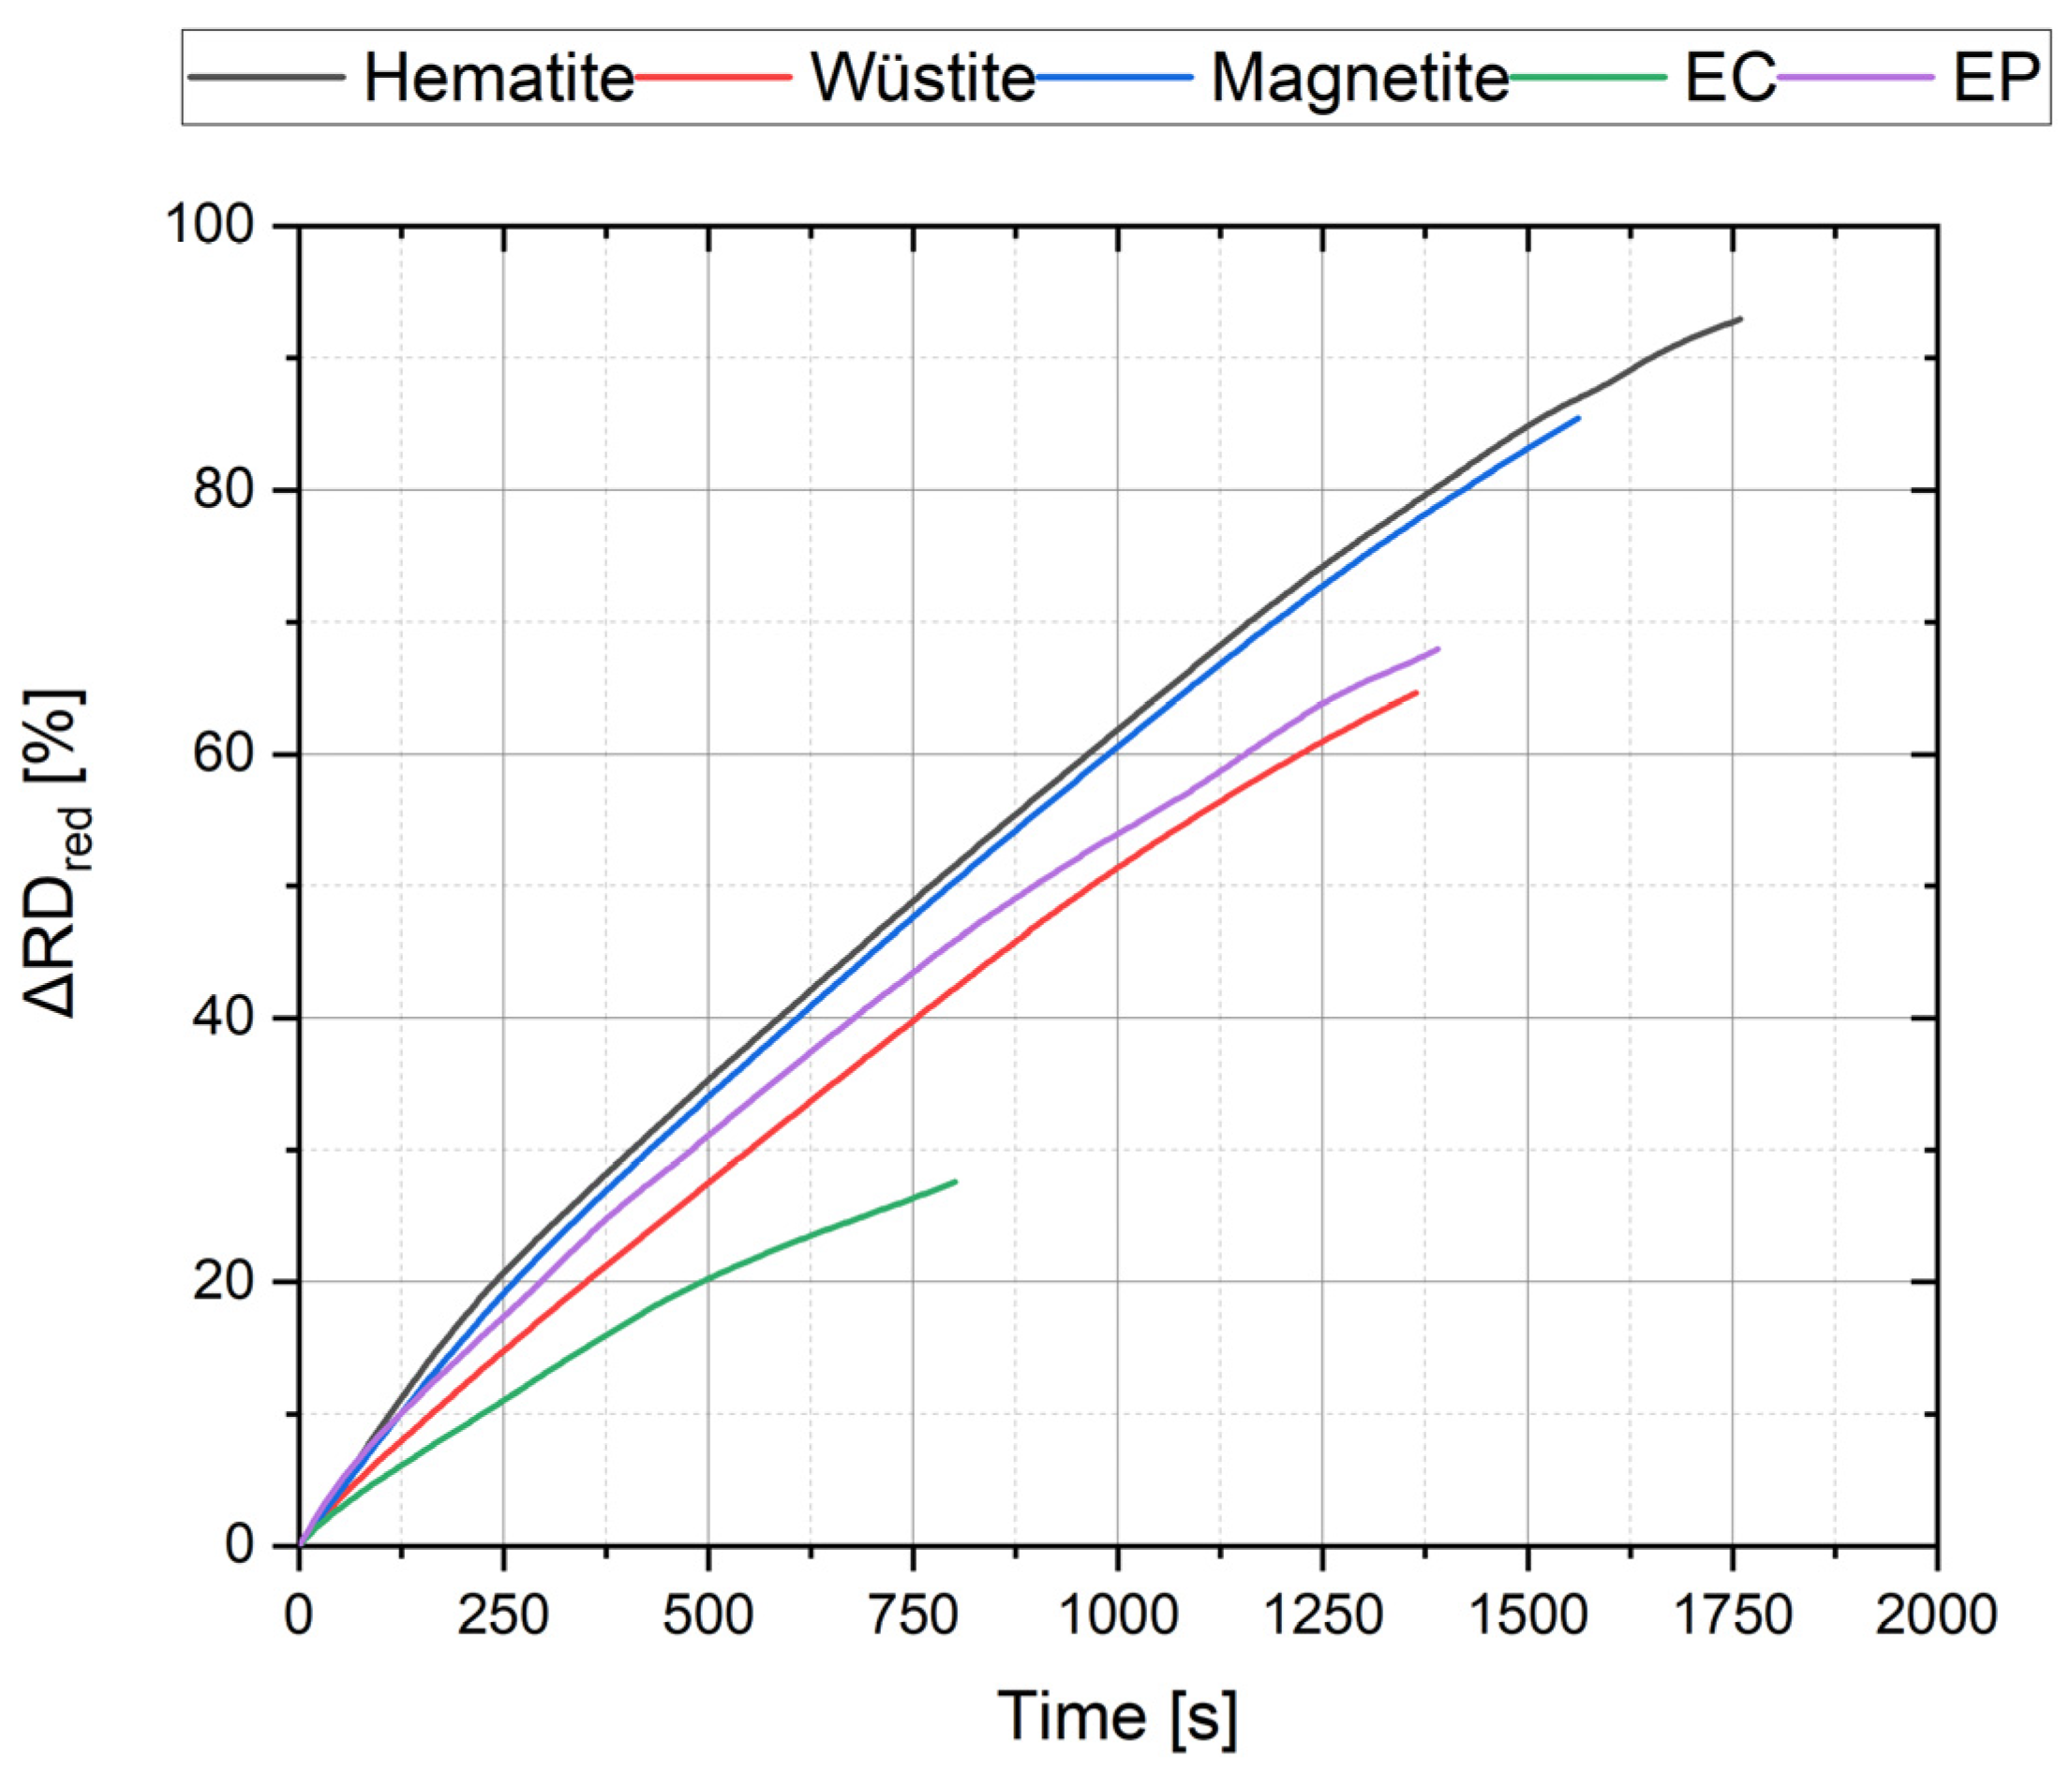
The focus of these investigations concerns the main reduction phase with hydrogen in the plasma zone. Therefore, Figure 5 illustrates the curves of the reduction phase, during hydrogen injection, for the different feedstocks. As expected, the hematite iron ore, with the highest total oxygen content, showed the steepest reduction progression. Meanwhile, due to the high metallic iron content and low oxygen content, the EC residual showed a flattened reduction course. Contrary to expectations, the magnetite-based iron ore showed a correspondingly steep trend. Since only the reduction rate during the hydrogen supply was plotted, and for comparison of the kinetics, the portion of pre-reduction during the melting process and the reduction rate of the initial state were neglected, RD of 100% cannot be achieved here.
As evident in Section 2.1, the materials differ in terms of their chemical composition, and thus also in total oxygen content at the same input quantity. Therefore, the average oxygen removal rate per minute can be calculated for a reduction degree of 100% (see Table 4).
The comparison reveals that magnetite ore had the highest average oxygen removal rate and the EC residual with the lowest oxygen content showed the lowest removal rate until a complete reduction is achieved. These mean values correlate very well with the determined reduction rates over the entire experiment, Figure 6a. As visible in Figure 5, the reduction is relatively constant between RD 30–80%, and in this range the magnetite ore had the highest reduction rate. Consequently, the hydrogen conversion rate follows the same characteristic, as in Figure 6b.
At the beginning of the reduction phase, an apparent hydrogen utilization of 100% is shown by injecting hydrogen through the hollow graphite electrode. This is due to the mixing of Ar and H2 in the reactor volume and the resulting low hydrogen content in the measured exhaust gas. Between hematite, magnetite, and wüstite there is a noticeable difference in the progression of the reduction rate and utilization degree after this phase. The reduction from hematite to magnetite and from magnetite to wüstite was much faster than the reduction of FeO to metallic iron, indicated by the higher oxygen removal rate. When the progression of the hematitic ore is examined, the more or less constant range is reached after a reduction degree of 33.3%, which corresponds to a complete conversion to FeO. The thermal decomposition of hematite to magnetite (15), the phase transition of magnetite from solid to liquid (16), and the reduction from magnetite to wüstite (17) require energy to proceed. The reduction of liquid wüstite with hydrogen (18), on the other hand, demonstrates exothermic behavior.
3   Fe 2 O 3 ( s ) T = 1779   K 2   F e 3 O 4 ( s ) + 1 2 O 2 Δ H R = 83.7   kJ / mol
Fe 3 O 4 ( s ) T = 1869   K F e 3 O 4 ( l ) Δ H R = 138.0   kJ / mol
Fe 3 O 4 ( l ) + H 2 T = 1973   K 3   F e O ( l ) + H 2 O Δ H R = 9.5   kJ / mol
F e O ( l ) + H 2 T = 1973   K F e ( l ) + H 2 O Δ H R = 9.0   kJ / mol
Figure 7 illustrates the total reduction trend of hematite, magnetite, wüstite, and residual materials, based on pure Fe2O3. The intersection of the ordinate is formed by the reduction degree of the feeding material (RDore) and the pre-reduction degree due to thermal decomposition during pre-melting (ΔRDPreRed). The further course of the curves is composed of the change of the reduction degree during the main reduction phase (ΔRDred) related to pure Fe2O3.
The figure also shows a high reduction rate for the hematitic ore, represented by the steep progression at the beginning. However, the slope decreases after an RD of 20%. Between 80% and 90%, the reduction rate continues to decrease for all feeding materials, indicating a change in kinetics. The flat progression of both residues EC and EP is due to the already present metallic iron and, thus, lower oxygen content in the melt.

3.2. Comparison and Integration with Fluidized Bed Reduction

As mentioned in the introduction, fluidized bed technology represents an alternative process for carbon-free reduction with hydrogen. Therefore, comparing reduction behavior is necessary to research a possible combination of both process technologies. The oxygen removal rate in the HPSR process is known to be closely correlated with both the oxygen input and the plasma gas’s H2 content. The fluidized bed reduction depends additionally strongly on the grain size and porosity of the material. Due to entirely different process requirements for stable reduction conditions and reaction types (gas–liquid and gas–solid), a side-by-side evaluation is hardly feasible. As a result, precisely comparing the reduction rate, overall process time, and necessary specific hydrogen volume per gram of iron ore is not practical in this case. To be able to do this, the experiments must be carried out as far as possible with identical parameters and input materials. Nevertheless, estimations and conclusions can be made by analysis of the reduction progression. Table 5 shows the process parameter for the compared trial.
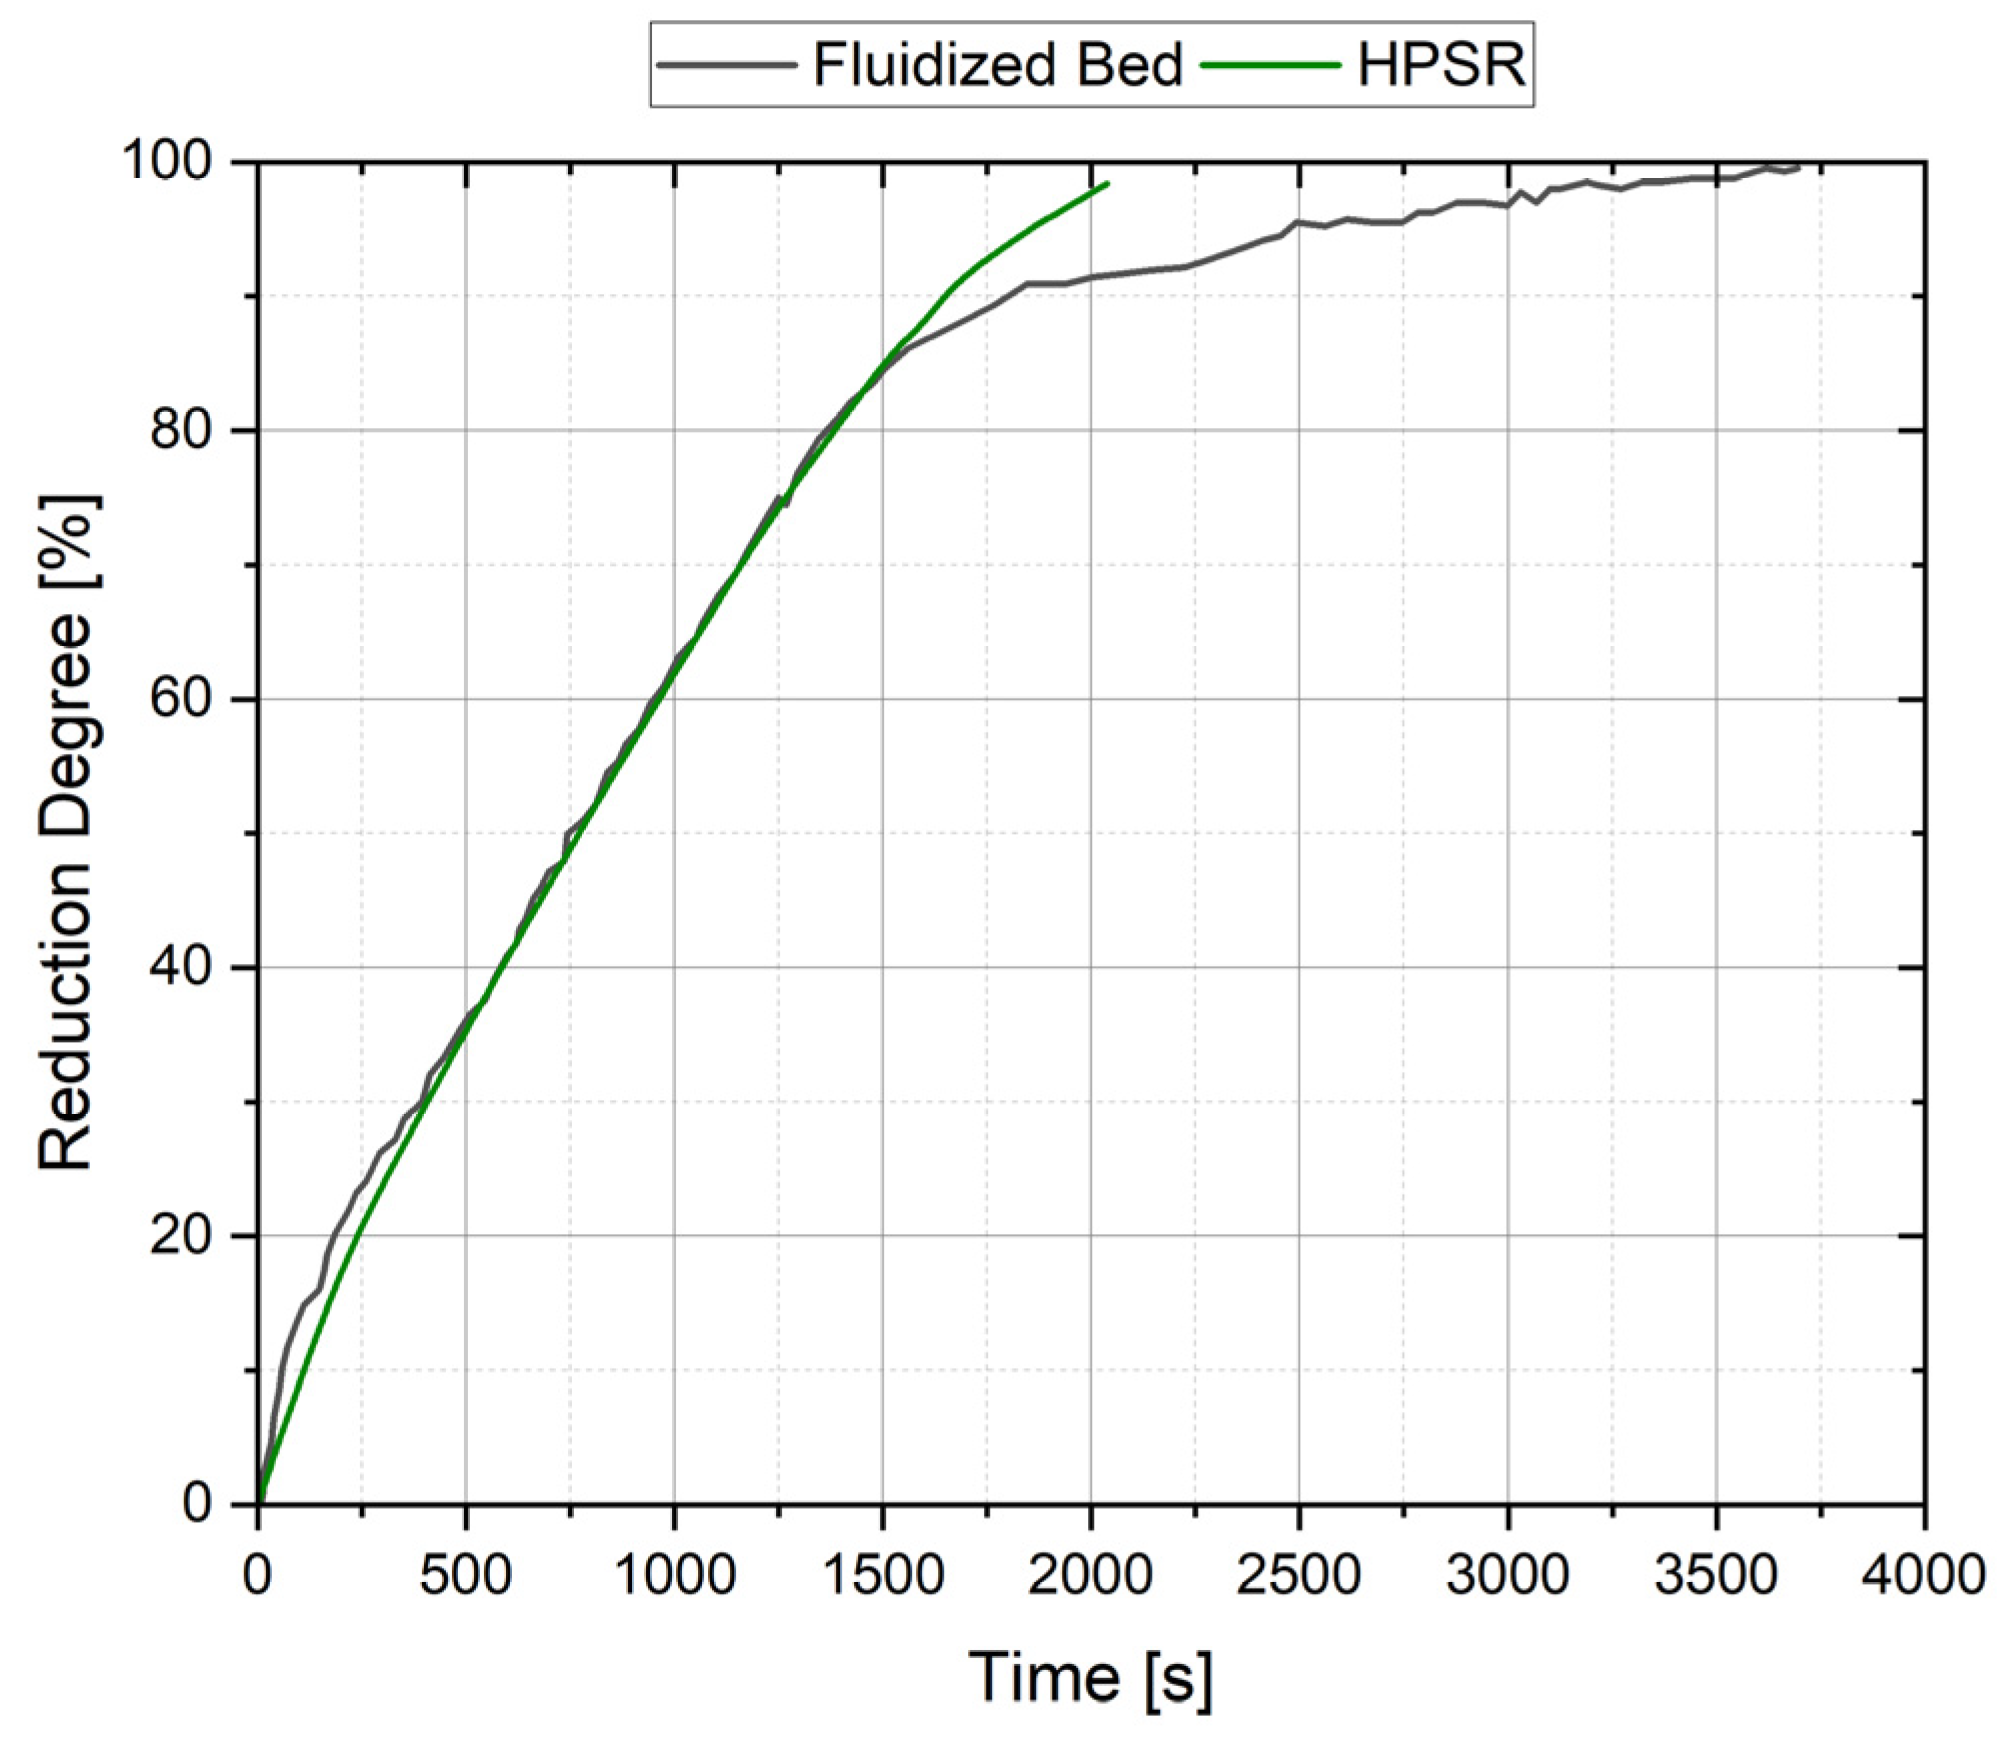
Figure 8 shows the reduction progressions over time for each of the H2 reduction technologies. In the initial phase, both processes show similar reduction behavior. Minor variances can be attributed to the different amounts of iron ore, oxygen input, and hydrogen content in the gas. The second reduction phase has a similar course and shows an almost consistent reduction rate of up to 85%. It is evident that the final stage, leading up to the reduction to metallic iron, is where the technologies diverge furthest. The third stage, where a slowing of the rate of reduction occurs, is most affected by temperature. As a result, higher reduction rates can be achieved in the HPSR process due to the higher temperatures in the melting pool (1973 K) and the focal spot (3298 K). Therefore, a much higher average degree of hydrogen utilization for the reduction phase is achievable.
However, reducing iron ore fines in hydrogen plasma offers some advantages. The product in the continuous HPSR process is liquid iron which can be used directly for secondary metallurgical treatments. Due to their high specific particle surface, metallic iron fines produced via the fluidized bed method have a high oxidation potential, which makes storage and subsequent processing difficult. Additionally, magnetite iron ore reduction is possible using plasma technology without prior oxidation to avoid the non-porous structure resulting in dense iron formation on the particle surface. It furthermore prevents contact with the reducing agent, the particle sticking and the subsequent defluidization phenomena.
The fluidized bed and HPSR reduction combination is auspicious, especially for industrial-scale plants. Pre-reduction via a fluidized bed with unreacted hydrogen from the HPSR off gas would significantly increase the efficiency of the overall process. In addition, long process times in the final stage could be avoided due to the high temperature and associated high rate of reduction to metallic iron.

3.3. Microstructural Examination

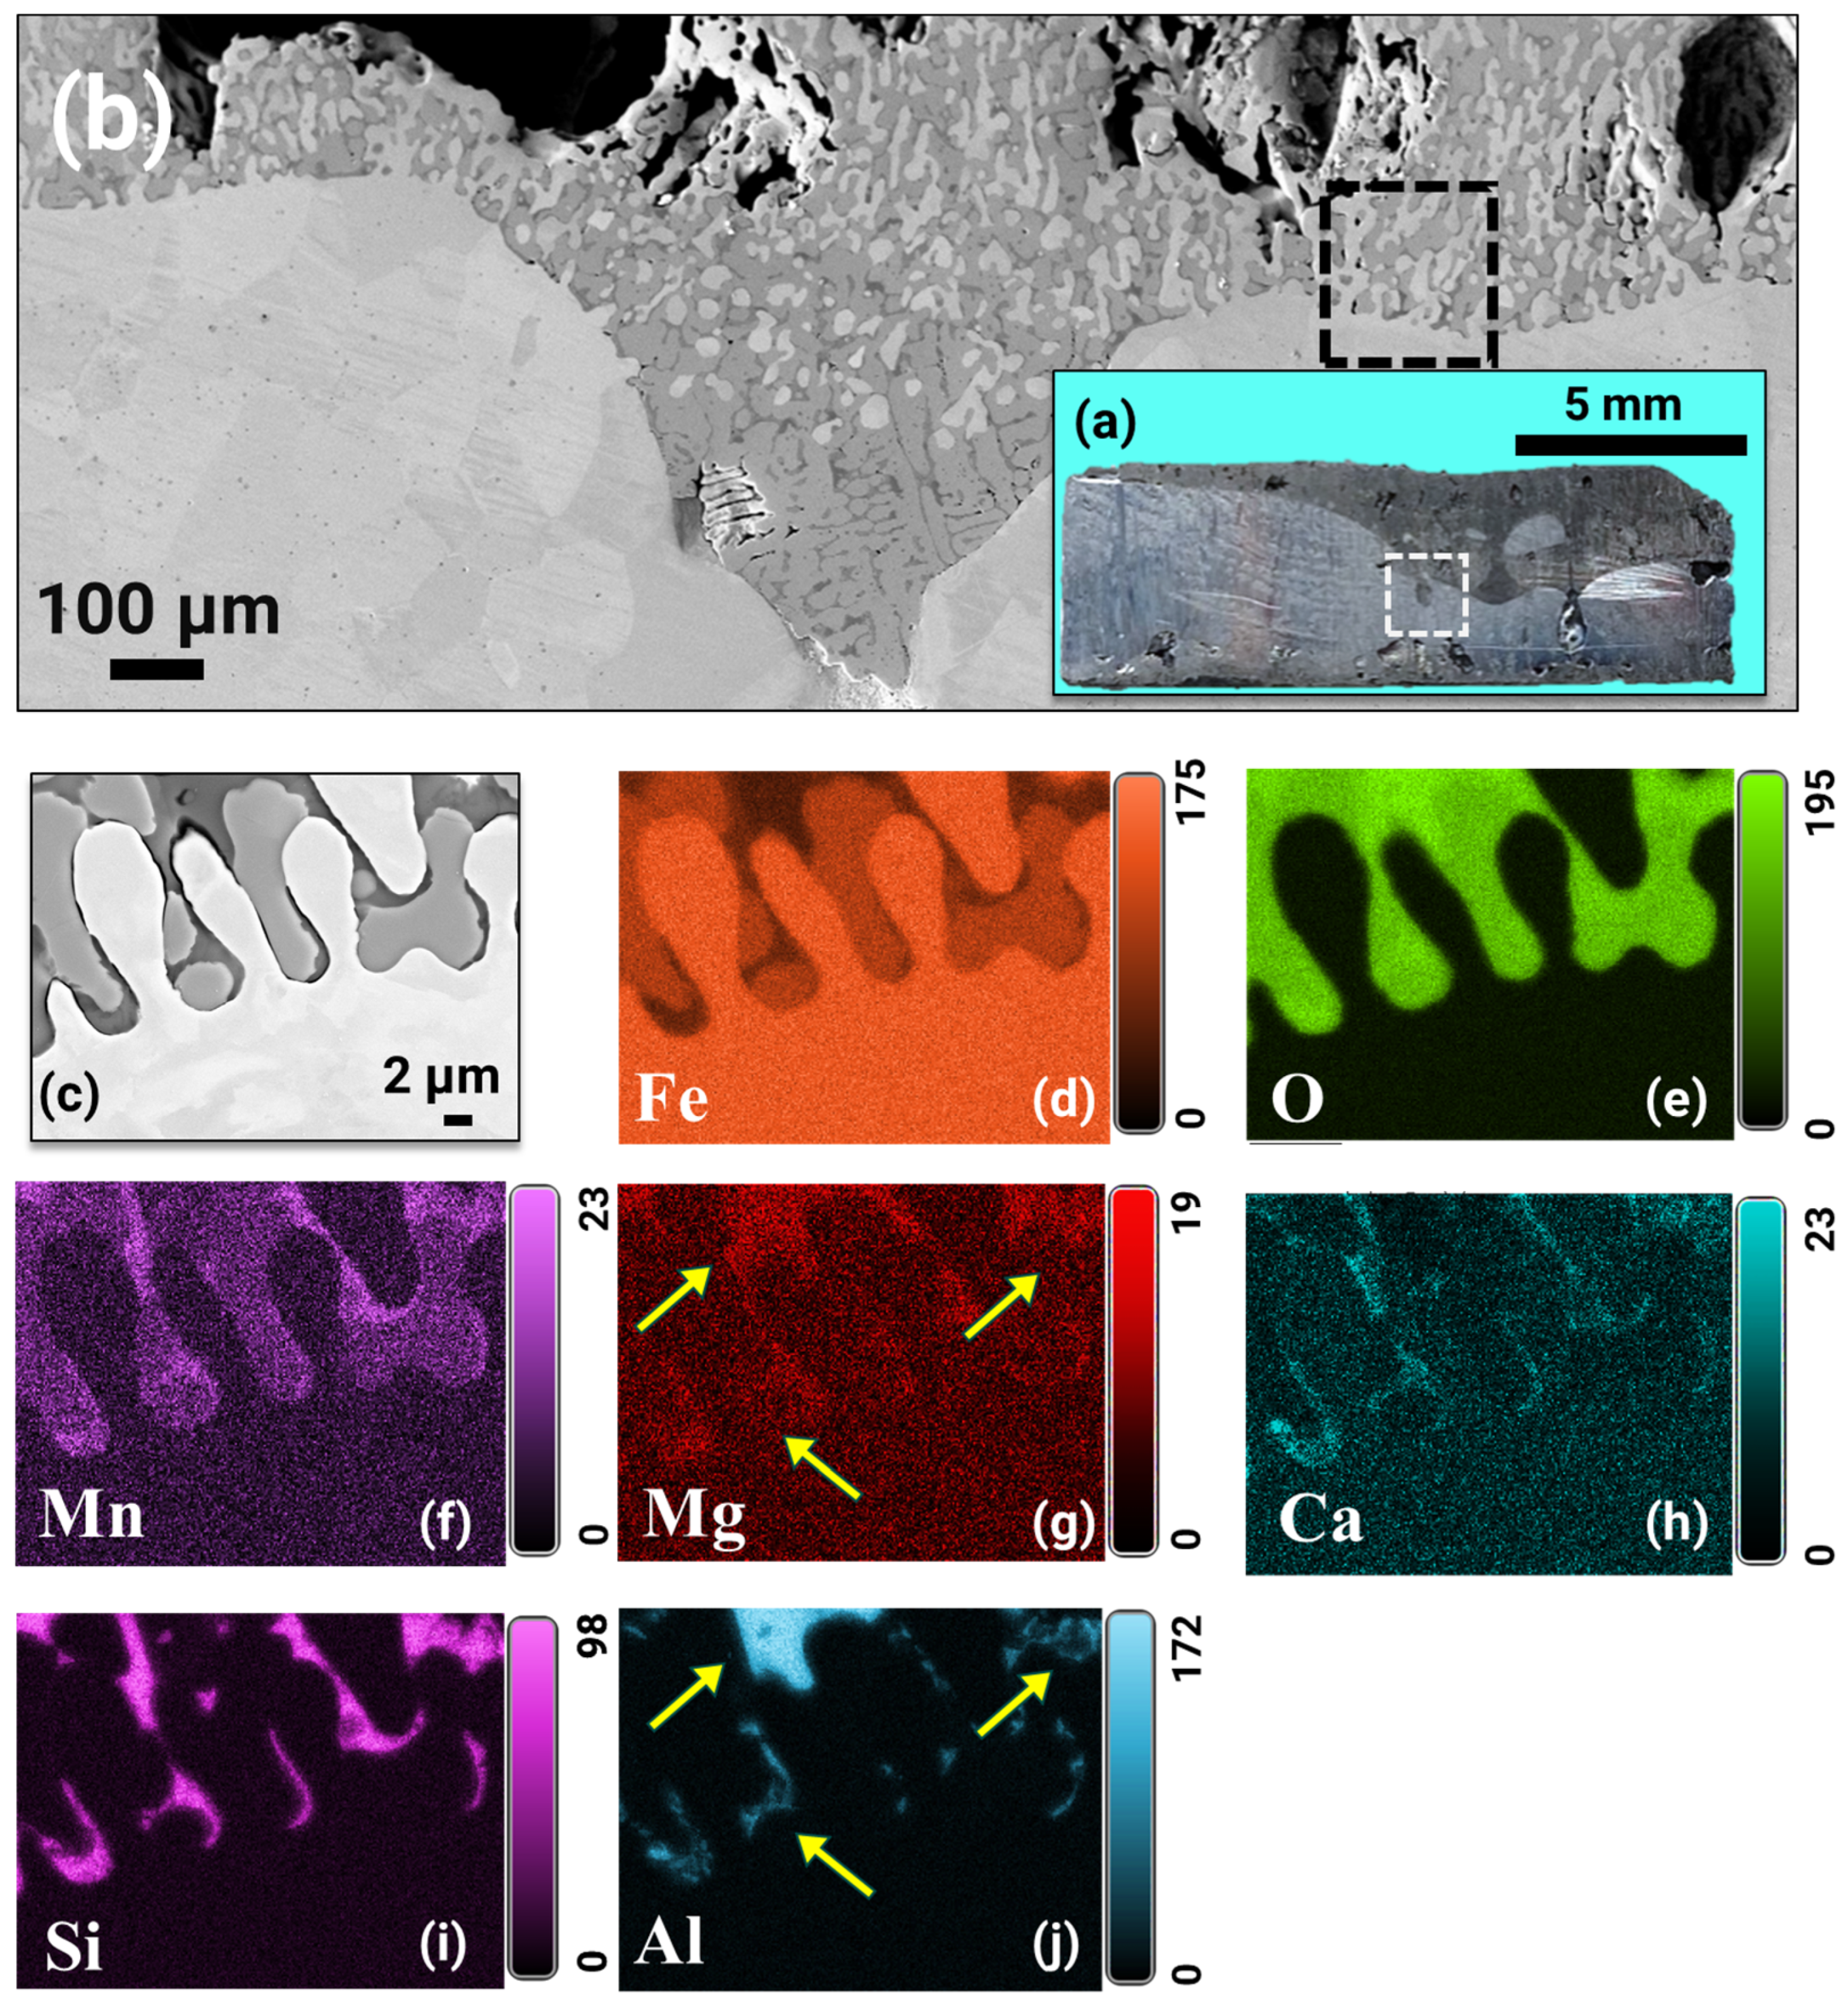
Figure 9a shows the cross section of the Hematite ore reduced and smelted via hydrogen plasma. The solidified domains near the interface between the reduced iron and slag were examined by secondary electron imaging, as shown in Figure 9b. This figure shows the entrapment of some bright-looking iron splatters within the unreduced oxides, the latter solidified in the form of dendrites. The presence of pure iron domains inside the oxide constituents can be explained by the intense turbulence effects imposed by the arc on the melt—a fact that prevents local mass separation between oxidic and metallic liquid portions. This process makes the non-coalesced and micron-sized iron domains solidify inside the oxide dendrites before sinking and incorporating into the larger and coalesced iron macro-portion already sitting in the bottom of the processed specimen [24].
The local chemical partition between unreduced oxides and iron (Figure 9c) was further probed with the aid of energy-dispersive X-ray spectroscopy (EDX), and the obtained results are displayed in Figure 9d–j. These figures reveal that the oxide phases are composed of unreduced iron oxides, to a certain extent enriched with Mn (Figure 9f), and other gangue-related variants (Si, Ca, Al, Mn, Mg) located mainly in the interdendritic zones. The Si and Ca oxides had similar spatial distribution inside the slag, a fact that suggests that they possibly solidified as Ca silicates. Al seems to have bonded with Mg oxides, as pointed out by the yellow arrows in Figure 9g,j. These elements are contained initially in the Hematite ore and apparently self-produce a protective slag during reduction, revealing another essential advantage of simultaneous smelting and reducing in hydrogen plasma reactors for iron ores containing gangue impurities. The reduced iron regions visualized in Figure 9c had a purity of at least ~98 wt.%, as estimated by point EDX.
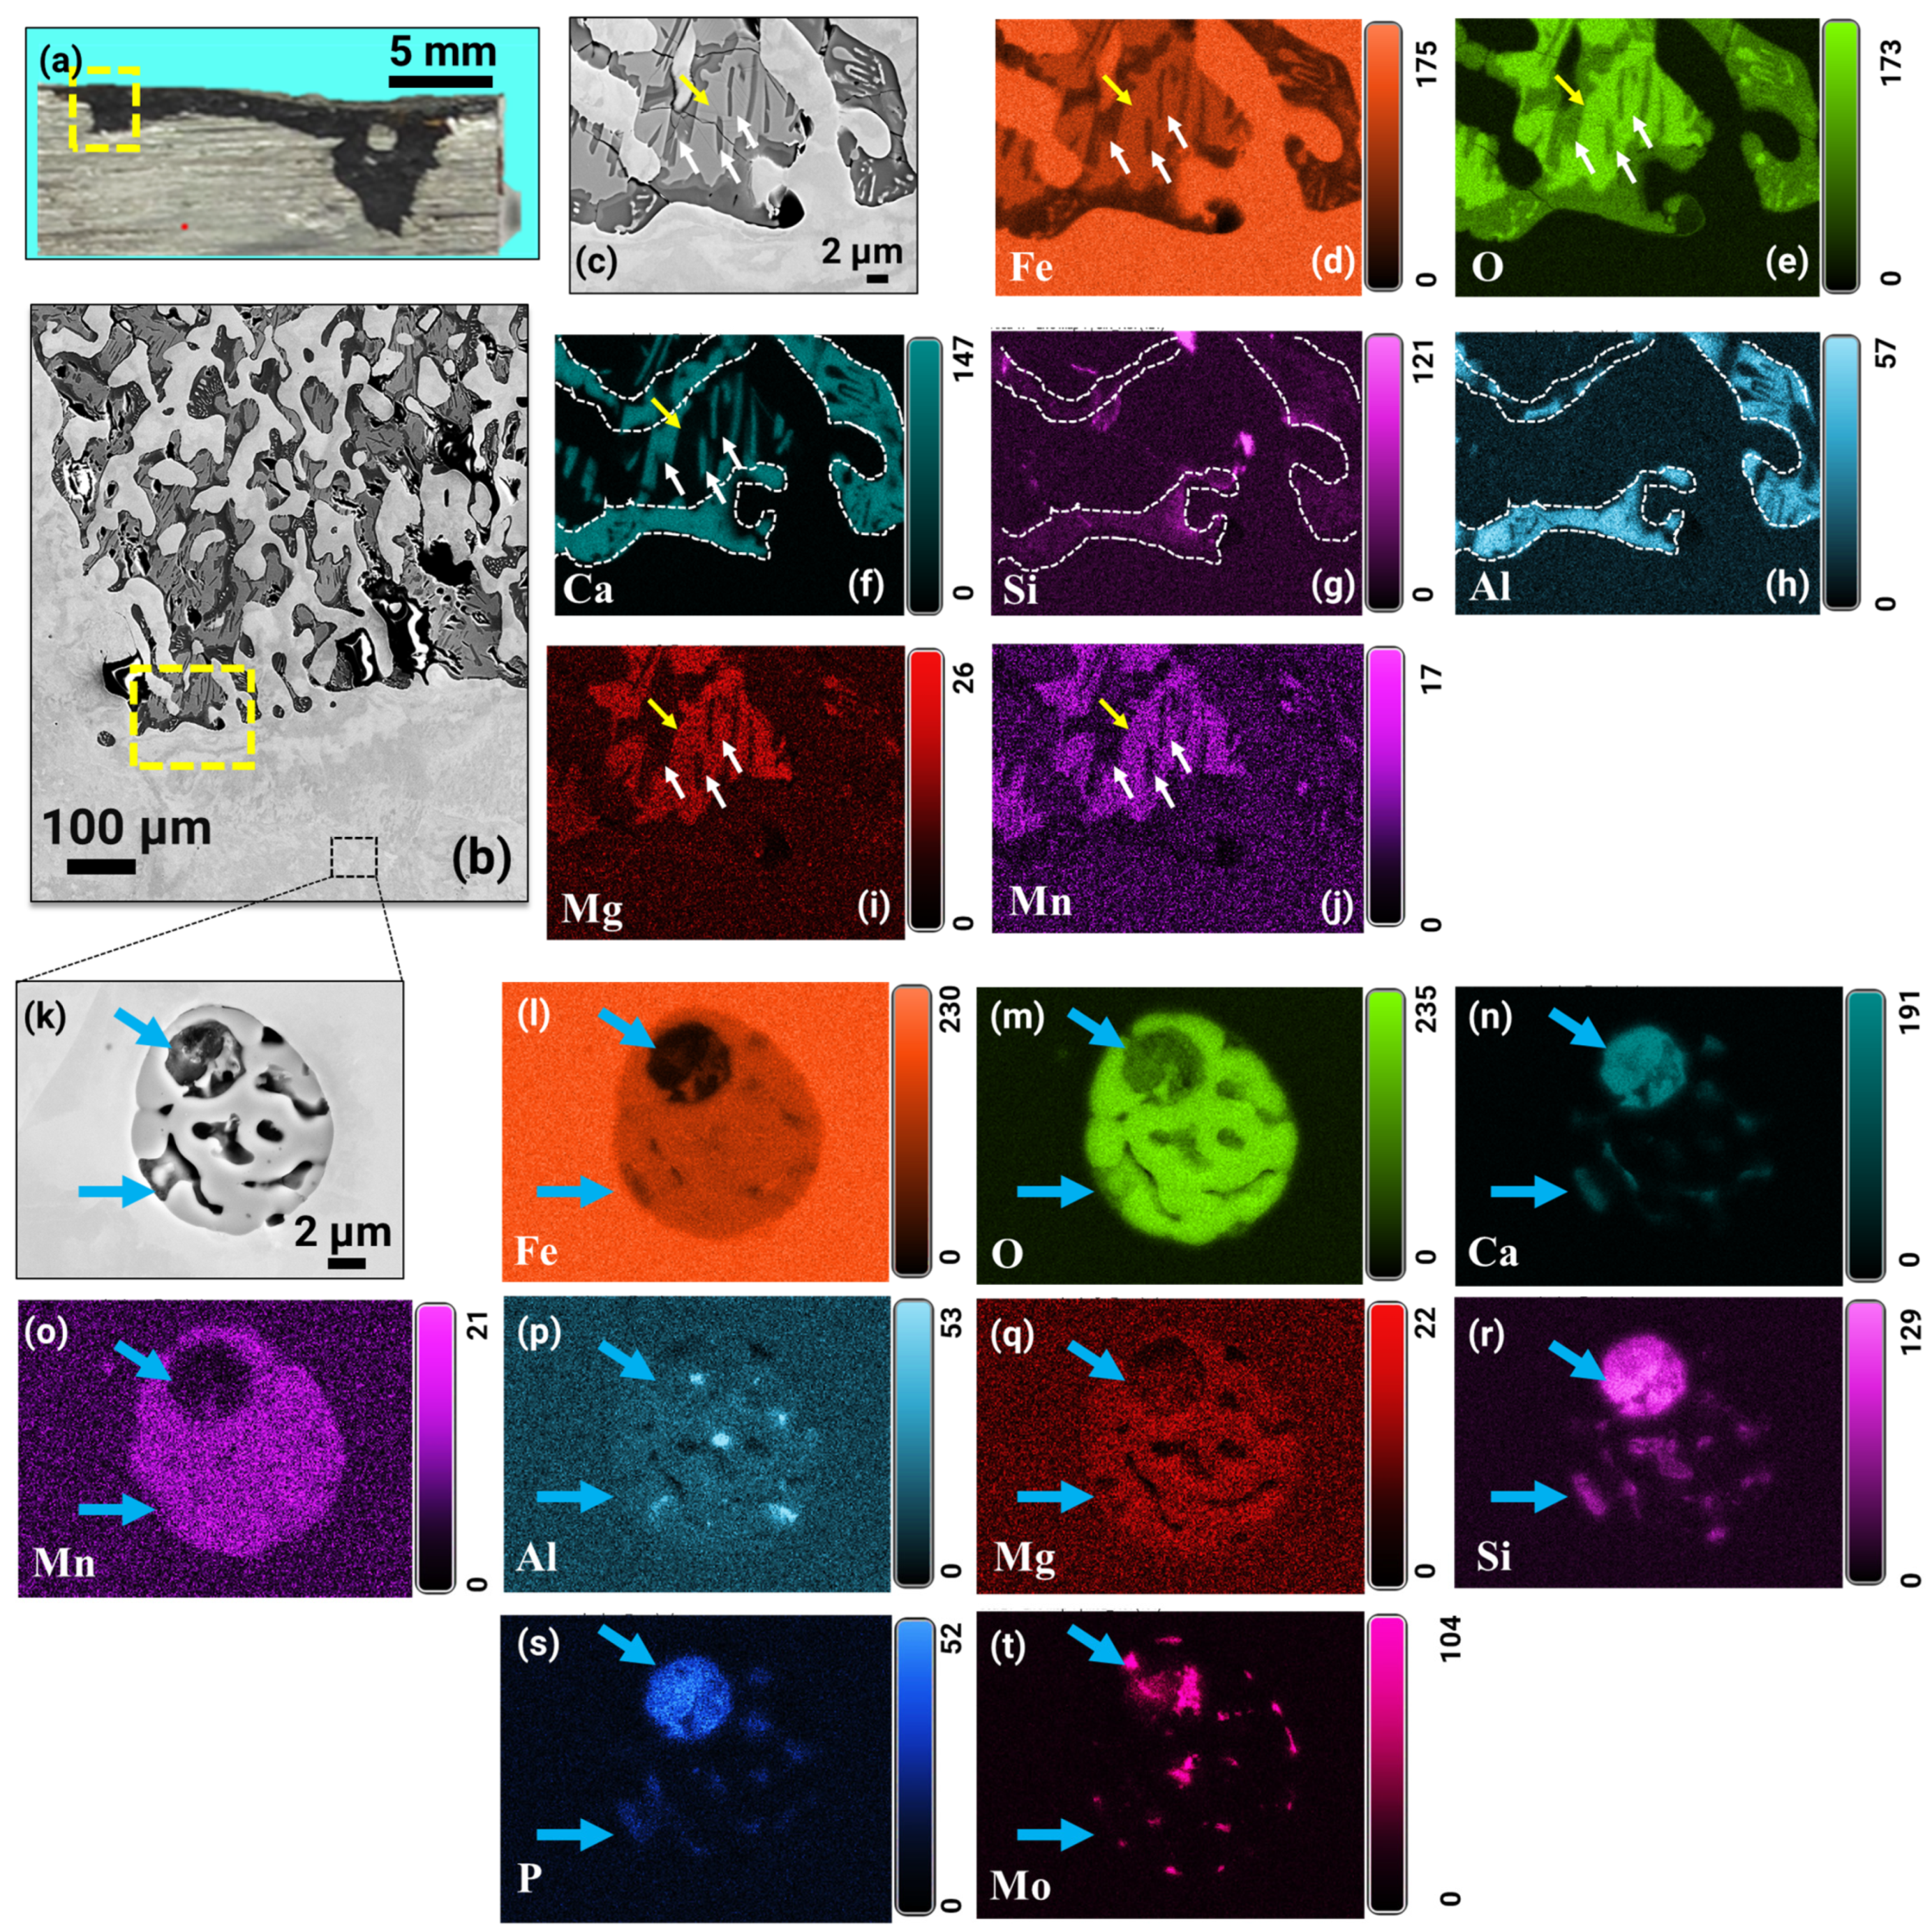
Figure 10a shows an overview of the EC sample reduced and smelted via hydrogen plasma. The yellow frame in this figure highlights the region selected for analysis via SEM, and the corresponding microstructure is depicted in Figure 10b. This figure suggests that, similarly to the C1 sample, there is a pronounced slag–metal separation. Figure 10c shows the microstructure of the solidified domains around the slag–metal interface. The local chemistry was determined using EDX, and the corresponding elemental distribution maps are shown in Figure 10d–j. The yellow arrows in the figure show that iron oxides are doped with Mn (Figure 10i) and Mg (Figure 10j) but devoid of other elements. The oxides enriched in Ca, Si, and Al combine in varying amounts to form complex constituents. To clearly distinguish these regions, yellow dotted lines have been drawn around them, as shown in Figure 10f,g,h, respectively. As well as being present in these regions, Ca oxides can also exist independently, i.e., without mixing with any other slag constituent. These regions are immersed inside the iron oxide regions, as indicated by the white arrows in Figure 10c–j.
The metallic iron portion has micron-sized oxide particles randomly dispersed within its microstructure. This can also be attributed to a likely combination of the strong turbulence imposed by the plasma arc on the melt and the fast solidification of the sample after switching off the arc. To determine the elemental composition of these particles, EDX analysis was employed for a representative example (Figure 10k); the obtained results are shown in Figure 10l–t. The elemental distribution maps shown in Figure 10m–t suggest that these particles have similar chemistry to the slag portion. In other words, the iron oxide domains of such particles are doped with Mg and Mn, as depicted in Figure 10o,q, respectively. The dark-looking constituents inside the investigated particle (indicated by the arrows in Figure 10k) are mainly composed of Si, Ca, and P oxides (Figure 10k–t). The interface between the particle and the iron matrix is decorated with Mo-oxides, as shown in Figure 10t.
The local chemical analysis reported in Figure 10 shows that, after reduction with hydrogen plasma, the residual EC is devoid of Zn, although it originally contains 0.89 wt.% ZnO (Table 1). To understand the possible mechanisms behind its evaporation, the melting and boiling points of ZnO and Zn were compared with the possible temperature distribution inside the melt in direct contact with the hydrogen plasma. ZnO melts and evaporates at 1975 °C and 2360 °C, respectively. Zn has much lower melting (420 °C) and boiling (907 °C) temperatures, compared to its oxide form. In light of this, the following chemical reaction could be plausibly expected to occur:
  • ZnO(s) + H2 → Zn(g) + H2O(g) at T = 907–1975 °C, i.e., solid domains enriched in ZnO would be reduced by hydrogen stemming from the atmosphere before the material is completely melted, and the product metallic Zn rapidly evaporates. This temperature range could plausibly exist within regions of the samples that are not in direct contact with the arc.
  • ZnO(l) + H2 → Zn(g) +H2O at T = 1975–2360 °C, i.e., molten ZnO domains would be reduced by hydrogen stemming from the plasma arc and the metallic Zn evaporated rapidly. The temperature range can be found in the outer zone of the arc (i.e., where the material is in direct contact with the colder domains of the arc).
  • ZnO(g) + H2 → Zn(g) + H2O at T > 2360 °C. In this scenario, fast evaporation of ZnO would occur and the reduction of the vapor oxide proceeds in the gas phase. Temperatures above 2360 °C can be expected in the focal spot of the plasma arc.
  • Similar local chemical analysis, as displayed in Figure 9 and Figure 10, was conducted for all samples. However, no substantial differences were observed in their microstructure and local chemistry.

4. Conclusions and Outlook

This study shows that differences in types of iron ore and iron-containing residuals affect the reduction behavior of a hydrogen-argon plasma smelting reactor, revealing influences on various process phases and confirming advantages compared with alternative reduction technologies based on hydrogen and iron ore fines.

4.1. Reduction Behavior

  • Analysis of the pre-melting phase shows that moisture significantly influences electrode consumption. The heterogeneous and homogeneous water–gas shift reaction erodes the graphite in addition to the released oxygen of the thermal decomposition of the iron ore.
  • Higher pre-reduction degrees and reduction rates for the hematitic ore compared to the wüstite ore were achievable due to the decomposition of Fe2O3. This was also determined for the residual materials EC and EP.
  • The iron ore with the highest total oxygen content, hematite, had the steepest reduction progression. This is consistent with previously published results by Ernst et al. [25] in which high oxygen removal rates were found at high oxygen inputs via iron ore.
  • Contrary to expectations, the iron ore based on magnetite exhibited a very similar trend and showed the highest average oxygen removal rate, which correlates well with the determined reduction rate over the whole experiment and indicates a high hydrogen utilization rate.
  • The EC residual exhibited a flattened reduction course as a result of the high metallic iron content and low oxygen content.
  • High utilization degrees were achieved at the beginning of hydrogen reduction for hematite and magnetite.
  • The equilibrium conversion in the reduction of hematite to wüstite is higher than that of wüstite to metallic iron. This is also reflected in the higher reduction rates during this process phase. The reduction progression of hematite and magnetite iron ore showed high oxygen removal rates at the beginning of the process.
  • From an RD of 80–85%, a decrease was observed for all materials, indicating kinetics change during this final reduction phase. The reduction rate then depends only on oxygen transport in the melt to the reduction interface, and no longer on hydrogen transport to the reaction zone.

4.2. Comparison and Combination with Fluidized Bed Reduction

  • Due to the partially different experimental parameters and feed material properties, a direct comparison of the experimental results is not reasonable.
  • The reduction progression shows similar behavior in the first and second phases and differs in the final phase, where the HPSR process shows much higher reduction rates due to its higher temperatures, resulting in lower process times.
  • A combination of both would be beneficial for recycling the unused H2 into the fluidized bed to pre-reduce the iron ore to increase H2 utilization further.
  • Unlike the fluidized bed technology, the HPSR process allows the reduction of magnetite iron ore without the need for pre-oxidizing to prevent the formation of a non-porous structure, and complex further processing and storage is eliminated due to the molten product.

4.3. Microstructure Analysis

  • Microstructural analysis combined with local chemistry inspection revealed that all processed samples (after their solidification) displayed similar constituents, independently on their original chemical composition.
  • In all cases, self-forming slags were observed atop the reduced iron. The slag domains were formed by complex Ca, Mg, Mn, Al, and Si oxides.
  • The product iron was nearly devoid of substitutional elements, but minor particles were found within its microstructure due to the strong turbulence imposed on the melt by the arc, together with the fast solidification rates imposed by the crucible. The combination of these facts hindered local mass separation between oxidic and metallic liquids.
  • The evaporation of Zn from the residual EC was observed and possible underlying mechanisms that drive its evaporation were proposed.
  • The results provide evidence indicating the advantage of using hydrogen plasma reduction to process low-grade iron-bearing materials, a route that permits the simultaneous extraction and purification of iron in a single step.

4.4. Outlook

For further experiments in the subject area including other types of iron ore and ferrous residues and the behavior of other oxidic compounds in the hydrogen plasma should be investigated. The same feed material utilized in the trials and roughly the same process parameters should be employed in a side-by-side comparison with a fluidized bed reactor. A series of experiments should be carried out including pre-reduction via a fluidized bed and final reduction with an HPSR reactor. Thereby, different pre-reduction degrees and iron ore grades can be used.

Author Contributions

Conceptualization, D.E., I.R.S.F. and M.A.Z.; methodology, D.E. and M.A.Z.; validation, D.E.; formal analysis, D.E.; investigation, D.E., I.R.S.F. and U.M.; resources, D.E.; data curation, D.E.; writing—original draft preparation, D.E. and I.R.S.F.; writing—review and editing, J.S. and M.A.Z.; visualization, D.E.; supervision, J.S.; project administration, J.S.; funding acquisition, J.S. All authors have read and agreed to the published version of the manuscript.

Funding

This research was funded by the COMET program Fundamentals of hydrogen reduction, K1-MET project number 12204396; Austrian Research Promotion Agency (853393) In addition, this research work is partially financed by the industrial partners voestalpine Stahl GmbH and voestalpine Stahl Donawitz GmbH and the scientific partner Montanuniversität Leoben.

Institutional Review Board Statement

Not applicable.

Informed Consent Statement

Not applicable.

Data Availability Statement

Data available on request due to restrictions, e.g., privacy or ethical. The data presented in this study are available on request from the corresponding author.

Acknowledgments

The authors gratefully acknowledge the SuSteel project’s funding by The Austrian Research Promotion Agency (FFG) and the funding support of K1-MET GmbH metallurgical competence center. The K1-MET competence center’s research program is supported by COMET (Competence Center for Excellent Technologies), the Austrian program for competence centers. The Federal Ministry funds COMET for Climate Action, Environment, Energy, Mobility, Innovation and Technology, the Federal Ministry for Digital and Economic Affairs, the provinces of Upper Austria, Tyrol, and Styria, and the Styrian Business Promotion Agency (SFG).

Conflicts of Interest

The authors declare no conflict of interest.

Abbreviations

V A r Absolute volume Ar per measuring interval [Nl]
V ˙ A r Flow rate Ar [Nl/min]
t i n t Measuring interval [min]
V C O , V C O 2 ,   V H 2 o u t Absolute volume of CO, CO2, H2 in off-gas per measuring interval [Nl]
c C O , c C O 2 , c H 2 ,   c A r Gas concentration of CO, CO2, H2, and Ar in the off-gas [vol.%]
V ˙ H 2 i n Flow of H2 [Nl/min]
V H 2 red Absolute volume of H2 for the reduction per measuring interval [Nl]
m O Total mass of the removed oxygen [g]
m O , V Mass of the removed oxygen in the previous period [g]
M O = 16   g / mol Molar mass of oxygen [g/mol]
n Stochiometric factor; n = 1   for CO and H2, n = 2   for CO2
V X Volume of the species X per measuring interval [Nl]
V m = 22.41   L / mol Molar volume of ideal gases for standard conditions [L/mol]
m F e Iron mass in the feeding material [g]
M F e = 56   g / mol Molar mass of iron [g/mol]
m O , O r e Oxygen mass in the feeding material ore [g]
m O , X Mass of the oxygen removed in the form of H2O, CO or CO2 in the pre-reduction and main reduction phase
M O = 16   g / mol Molar mass of oxygen [g/mol]
RD Total reduction degree [%]
R D O r e Reduction degree of the feed material in terms of pure Fe2O3 [%]
Δ R D X Change in reduction degree by forming the species X (H2O, CO or CO2) [%]
Δ R D P r e R e d Change in reduction degree during pre-melting [%]
Δ R D r e d Change in reduction degree within the main reduction phase [%]
η H 2 Gas utilization rate for hydrogen [%]

References

  1. Semenza, J.C.; Menne, B. Climate change and infectious diseases in Europe. Lancet Infect. Dis. 2009, 9, 365–375. [Google Scholar] [CrossRef] [PubMed]
  2. European Commission. Masterplan for a Competitive Transformation of EU Energy-Intensive Industries Enabling a Climate-Neutral, Circular Economy by 2050. Available online: https://data.europa.eu/doi/10.2873/854920 (accessed on 25 October 2022).
  3. Carbon Market Watch. Decarbonising Steel: Options for Reforming the EU’S Emissions Trading System. Available online: https://carbonmarketwatch.org/wp-content/uploads/2022/03/CMW_Decarbonising-Steel_v02.pdf (accessed on 25 October 2022).
  4. Iron and Steel Technology Roadmap. 2020. Available online: https://www.iea.org/reports/iron-and-steel-technology-roadmap (accessed on 25 October 2022).
  5. Kolbe, N.; Cesário, F.; Ahrenhold, F.; Suer, J.; Oles, M. Carbon Utilization Combined with Carbon Direct Avoidance for Climate Neutrality in Steel Manufacturing. Chem. Ing. Tech. 2022, 94, 1548–1552. [Google Scholar] [CrossRef]
  6. Eurofer The European Steel Association. Low Carbon Roadmap: Pathways to a CO2-Neutral European Steel Industry [Online]. 2019. Available online: https://www.eurofer.eu/assets/Uploads/EUROFER-Low-Carbon-Roadmap-Pathways-to-a-CO2-neutral-European-Steel-Industry.pdf (accessed on 25 October 2022).
  7. Bäck, E. Schmelzreduktion von Eisenoxiden mit Argon-Wasserstoff-Plasma. Ph.D. Thesis, Montanuniversität Leoben, Leoben, Austria, 1998. [Google Scholar]
  8. Sormann, A. Untersuchung zur Schmelzreduktion von Eisenoxiden mit Wasserstoff als Reduktionsmittel. Ph.D. Thesis, Montanuniversität Leoben, Leoben, Austria, 1992. [Google Scholar]
  9. Plaul, J.F. Schmelzreduktion von hämatitischen Feinerzen im Wasserstoff-Argon-Plasma. Ph.D. Thesis, Montanuniversität Leoben, Leoben, Austria, 2005. [Google Scholar]
  10. Badr, K. Smelting of Iron Oxides Using Hydrogen Based Plasmas. Ph.D. Thesis, Montanuniversität Leoben, Leoben, Austria, 2007. [Google Scholar]
  11. Seftejani, M.N. Reduktion von Hämatit mittels Wasserstoffplasma-Schmelzreduktion. Ph.D. Thesis, Montanuniversität Leoben, Leoben, Austria, 2020. [Google Scholar]
  12. Zarl, M.A. Ermittlung der Grundlagen für die Skalierung von Plasma-Schmelzreduktionsreaktoren für die Eisenherstellung. Ph.D. Thesis, Montanuniversität Leoben, Leoben, Austria, 2021. [Google Scholar]
  13. Raabe, D.; Klug, M.J.; Ma, Y.; Büyükuslu, Ö.; Springer, H.; Souza Filho, I. Hydrogen Plasma Reduction of Iron Oxides. In Advances in Pyrometallurgy; Fleuriault, C., Steenkamp, J.D., Gregurek, D., White, J.F., Reynolds, Q.G., Mackey, P.J., Hockaday, S.A., Eds.; Springer Nature: Cham, Switzerland, 2023; pp. 83–84. ISBN 978-3-031-22633-5. [Google Scholar]
  14. Pauna, H.; Ernst, D.; Zarl, M.; Aula, M.; Schenk, J.; Huttula, M.; Fabritius, T. Hydrogen plasma smelting reduction process monitoring with optical emission spectroscopy—Establishing the basis for the method. J. Clean. Prod. 2022, 372, 133755. [Google Scholar] [CrossRef]
  15. Dalaker, H.; Hovig, E.W. Hydrogen Plasma-Based Reduction of Metal Oxides. In Advances in Pyrometallurgy; Fleuriault, C., Steenkamp, J.D., Gregurek, D., White, J.F., Reynolds, Q.G., Mackey, P.J., Hockaday, S.A., Eds.; Springer Nature: Cham, Switzerland, 2023; pp. 85–94. ISBN 978-3-031-22633-5. [Google Scholar]
  16. Behera, P.R.; Bhoi, B.; Paramguru, R.K.; Mukherjee, P.S.; Mishra, B.K. Hydrogen Plasma Smelting Reduction of Fe2O3. Metall. Mater. Trans. B 2019, 50, 262–270. [Google Scholar] [CrossRef]
  17. Spreitzer, D.; Schenk, J. Reduction of Iron Oxides with Hydrogen—A Review. Steel Res. Int. 2019, 90, 1900108. [Google Scholar] [CrossRef]
  18. Spreitzer, D.; Schenk, J. Iron Ore Reduction by Hydrogen Using a Laboratory Scale Fluidized Bed Reactor: Kinetic Investigation—Experimental Setup and Method for Determination. Metall. Mater. Trans. B 2019, 50, 2471–2484. [Google Scholar] [CrossRef]
  19. Spreitzer, D.; Schenk, J. Fluidization behavior and reducibility of iron ore fines during hydrogen-induced fluidized bed reduction. Particuology 2020, 52, 36–46. [Google Scholar] [CrossRef]
  20. Zheng, H.; Spreitzer, D.; Wolfinger, T.; Schenk, J.; Xu, R. Effect of Prior Oxidation on the Reduction Behavior of Magnetite-Based Iron Ore During Hydrogen-Induced Fluidized Bed Reduction. Metall. Mater. Trans. B 2021, 52, 1955–1971. [Google Scholar] [CrossRef]
  21. Zheng, H.; Daghagheleh, O.; Wolfinger, T.; Taferner, B.; Schenk, J.; Xu, R. Fluidization behavior and reduction kinetics of pre-oxidized magnetite-based iron ore in a hydrogen-induced fluidized bed. Int. J. Miner. Metall. Mater. 2022, 29, 1873–1881. [Google Scholar] [CrossRef]
  22. Zarl, M.A.; Farkas, M.A.; Schenk, J. A Study on the Stability Fields of Arc Plasma in the HPSR Process. Metals 2020, 10, 1394. [Google Scholar] [CrossRef]
  23. Zarl, M.A.; Ernst, D.; Cejka, J.; Schenk, J. A New Methodological Approach to the Characterization of Optimal Charging Rates at the Hydrogen Plasma Smelting Reduction Process Part 1: Method. Materials 2022, 15, 4767. [Google Scholar] [CrossRef] [PubMed]
  24. Souza Filho, I.R.; Ma, Y.; Kulse, M.; Ponge, D.; Gault, B.; Springer, H.; Raabe, D. Sustainable steel through hydrogen plasma reduction of iron ore: Process, kinetics, microstructure, chemistry. Acta Mater. 2021, 213, 116971. [Google Scholar] [CrossRef]
  25. Ernst, D.; Zarl, M.A.; Cejka, J.; Schenk, J. A New Methodological Approach on the Characterization of Optimal Charging Rates at the Hydrogen Plasma Smelting Reduction Process Part 2: Results. Materials 2022, 15, 4065. [Google Scholar] [CrossRef] [PubMed]
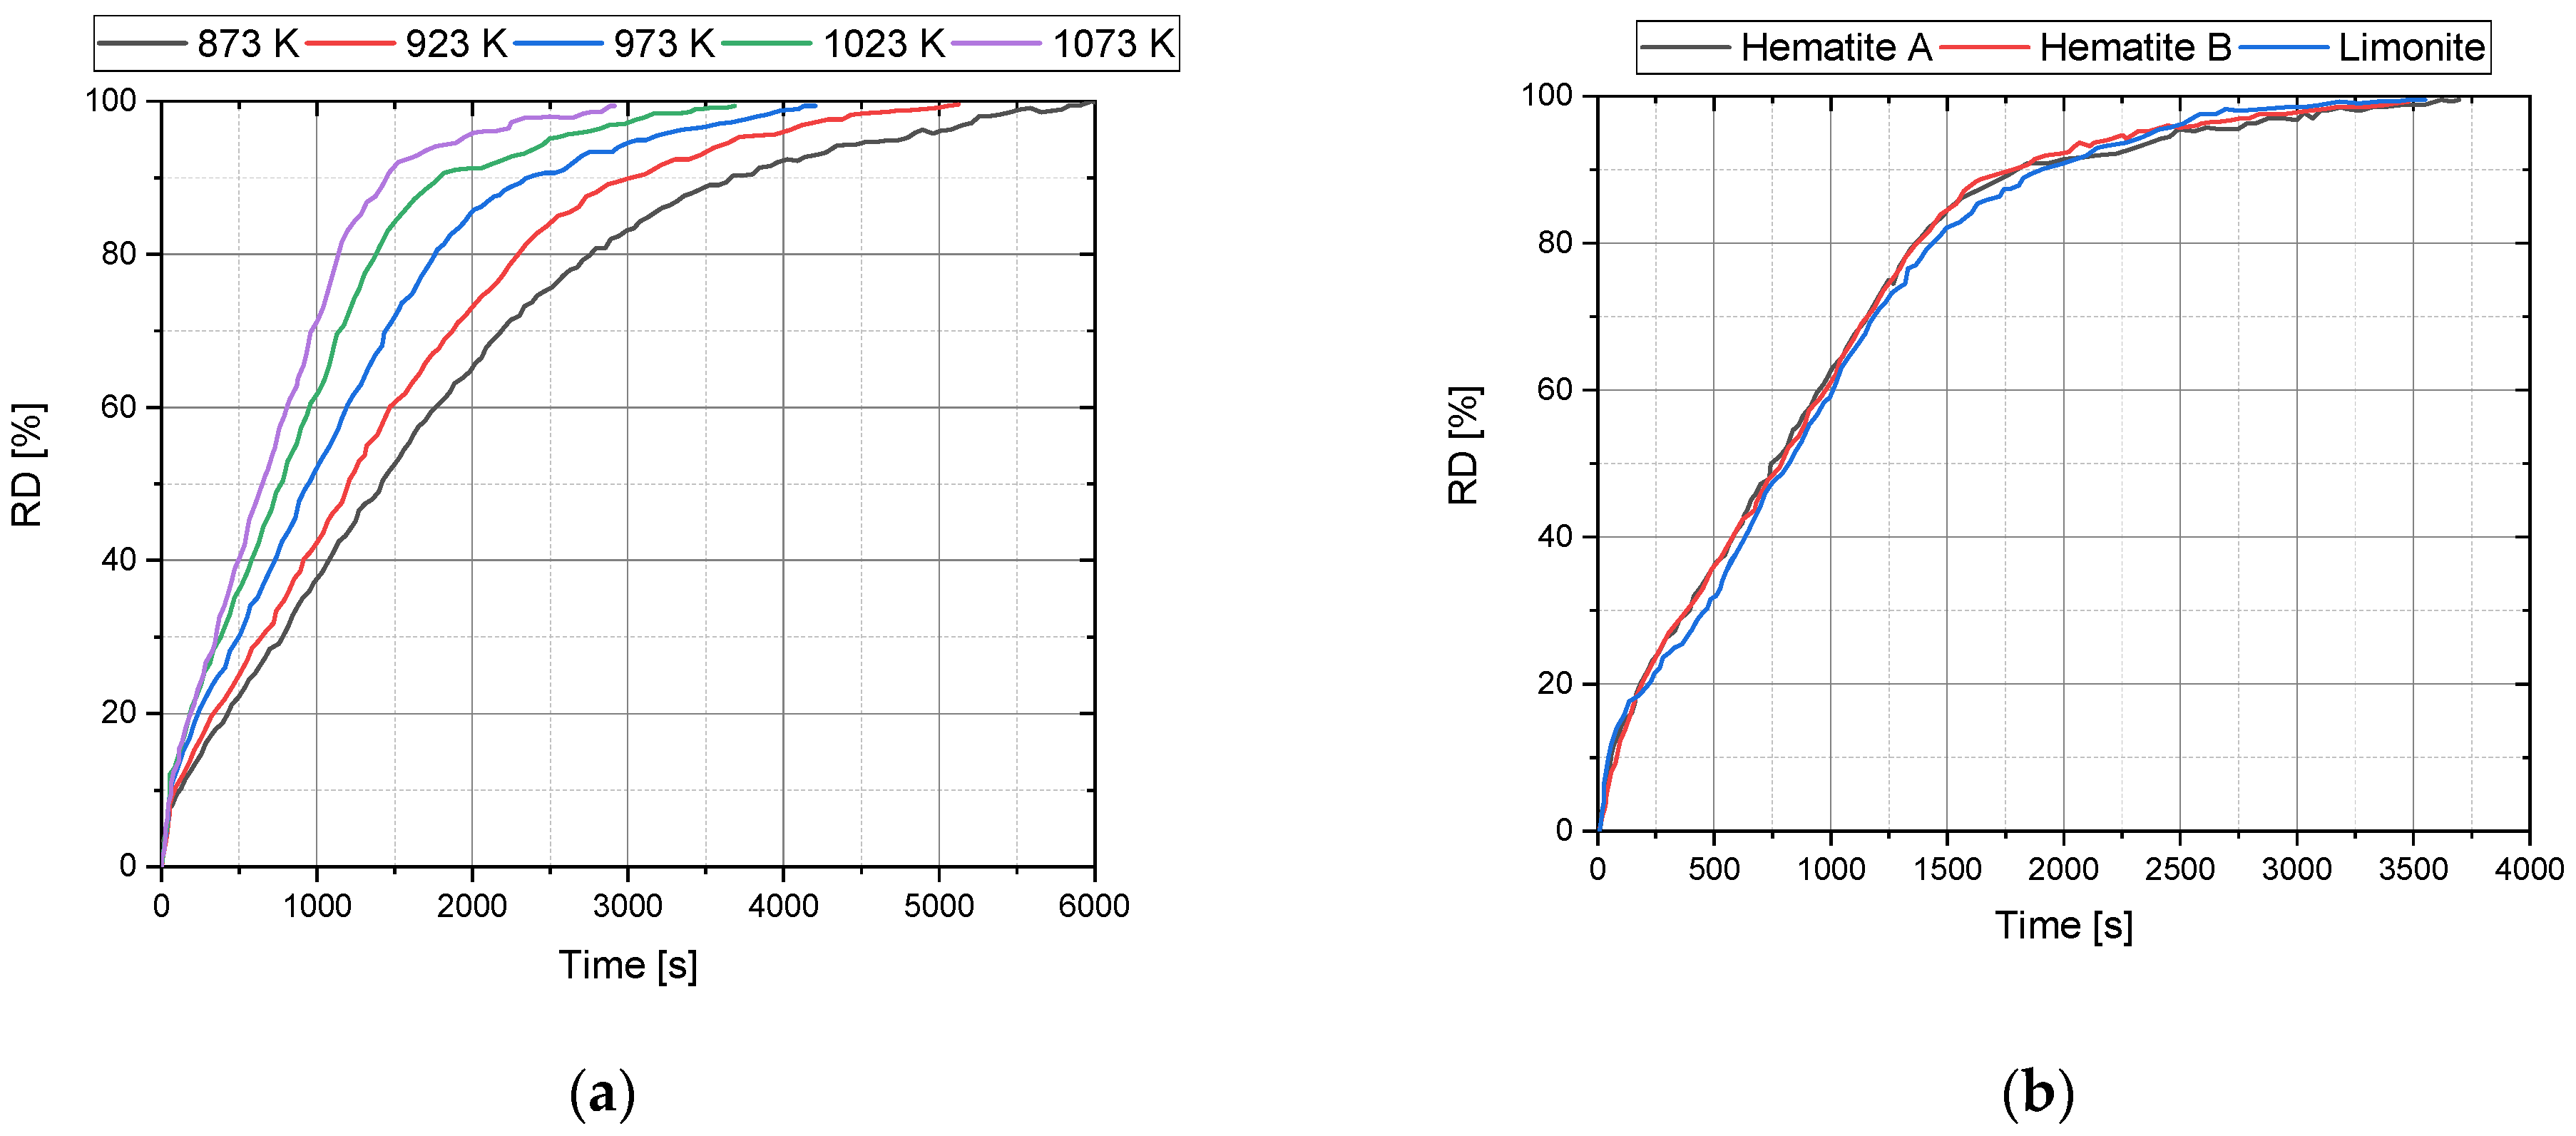
Figure 1. Reduction progress of hematite iron ore at different temperatures (a) and hematite and limonite-based ore at 1023 K (b). Adapted with permission from Ref. [19]. Copyright 2020, Elsevier.
Metals 13 00558 g001
Figure 2. Drawing of the hollow graphite electrode and the steel crucible with an ignition pin.
Metals 13 00558 g002
Figure 3. Off-gas composition at the pre-reduction phase for Ex. 1 (a) and Ex. 4 (b).
Metals 13 00558 g003
Figure 4. Change in the degree of reduction for the first minute within pre-melting.
Metals 13 00558 g004
Figure 5. Change in the degree of reduction during hydrogen injection (ΔRDred) for various charged materials.
Metals 13 00558 g005
Figure 6. Reduction rate (a) and hydrogen utilization (b) over the reduction degree for various charged materials.
Metals 13 00558 g006
Figure 7. Total reduction degree (RD) during hydrogen injection for various charged materials based on pure Fe2O3.
Metals 13 00558 g007
Figure 8. Reduction degree over time for both technologies.
Metals 13 00558 g008
Figure 9. Microstructural characterization of the reduced and smelted Hematite ore sample: (a) an overview of the cross section of the solidified sample. The red frame in this figure highlights the area chosen for microstructural inspection. (b) SE image of the area indicated by the red frame in (a), revealing details of the microstructure of the domains near the interface between iron and unreduced oxides. (c) Enlarged view of the area delimited by the frame in (b), displaying details of the interface between iron and unreduced oxides. The corresponding local chemistry is given in the form of elemental distribution maps for (d) Fe, (e) O, (f) Mn, (g) Mg, (h) Ca, (i) Si and (j) Al.
Metals 13 00558 g009
Figure 10. Microstructural characterization of the reduced and smelted EC ore sample. (a) Overview of the processed specimen. The red frame in this figure indicates the area probed using SEM. (b) SE image of the area marked by the red frame in (a). (c) Enlarged view of the solidified domains across the slag–metal interface. The spatial elemental distribution maps for the area probed under EDX are shown in (c), corresponding to (d) Fe, (e) O, (f) Ca, (g) Si, (h), Al, (i) Mg and (j) Mn. (k) SE image of a typical oxide found inside the iron. The elemental distribution maps show the local chemical partitioning inside this particle for (l) Fe, (m) O, (n) Ca, (o) Mn, (p) Al, (q) Mg, (r) Si, (s) P, and (t) Mo.
Metals 13 00558 g010
Table 1. Chemical composition of the feeding material.
ElementHematite 1
(wt.%)
Magnetite 2
(wt.%)
Wüstite
(wt.%)
EC
(wt.%)
EP
(wt.%)
Fetot65.8169.7669.1673.7062.10
Femet---45.5011.80
Fe2O392,8366.290.0411.5447.02
FeO1.0730.0388.9625.9022.40
SiO21.692.326.541.691.25
Al2O31.010.041.960.500.20
CaO-0.151.099.116.68
ZnO---0.893.39
1 LOI = 2.79% 2 LOI = −3.0%.
Table 2. Purity and residuals of the process gases.
Product NamePurity
[%]
O2
[ppm]
H2O
[ppm]
N2
[ppm]
Hydrogen 5.0≥99.999≤2≤5≤3
Argon 5.0≥99.999≤2≤3≤5
Table 3. Experimental plan (sorted by RDOre).
Experiment NumberInput Material
[-]
Iron Ore Type
[-]
Batch-Wise Charged Mass
[g]
Electrode Gap
[mm]
Hydrogen
Content during Reduction
[%]
RDOre
[%]
Ex. 1HematiteHematite10020–30403.2
Ex. 2MagnetiteMagnetite10020–304013.8
Ex. 5EPResidual99.620–304030.4
Ex. 3WustiteWüstite99.320–304035.1
Ex. 4ECResidual100.320–304071.7
Table 4. Oxygen budget.
Iron Ore Type
[-]
Batch-Wise Charged Mass
[g]
Oxygen via FeO
[g]
Oxygen via Fe2O3
[g]
Total Oxygen
[g]
Reduction Time
[s]
Average
Oxygen
Removal Rate
[gOxygen/min]
Hematite 11000.23127.07227.317640.93
Magnetite 299.36.42819.15525.581566.00.98
Wüstite10019.2170.01219.231363.50.85
Residual EC100.35.63.3688.97805.50.67
Residual EP99.64.80913.62818.4413950.79
1 LOI = 2.79% 2 LOI = −3.0%.
Table 5. Feedstock properties and process parameters of both tests.
ParameterHPSRFluidized Bed [19]
Iron ore typeHematiteHematite
Fe tot
[%]
65.8163.60
Grain size
[µm]
25–125250–500
Sample mass
[g]
100400
Temperature
[K]
1973–32981023
H2-content
[%]
4065
Total flow rate
[Nl/min]
525.9
Specific H2 input
[Nl H2/kg Ore]
2042.1
Disclaimer/Publisher’s Note: The statements, opinions and data contained in all publications are solely those of the individual author(s) and contributor(s) and not of MDPI and/or the editor(s). MDPI and/or the editor(s) disclaim responsibility for any injury to people or property resulting from any ideas, methods, instructions or products referred to in the content.