Abstract
The conventional theoretical forming limit diagram (FLD) based on the plane stress state has defects due to the neglect of the stress in the thickness direction of the sheet. It is urgent to study the FLD which considers the stress in the thickness direction. Through the finite element simulation, it is further confirmed that the stress in the thickness direction will be induced in the deformation process. At the same time, the effect of the induced stress in the thickness direction on FLD is not the same as that always applied stress in the thickness direction during the deformation process. Based on the Modified Maximum Force Criterion (MMFC) instability theory, C-H instability theory, Mises and Hill48 yield criterion, the effects of the two stresses on FLD are compared. The induced stress in the thickness direction also affects the sensitivity of the coefficient of normal anisotropy , but does not significantly change the effect of the stress-strain index on Forming Limit Curves (FLC). The theoretical calculations of the three materials TRIP780, AA5182, and 5754O are compared with the experimental data, which proves that the FLD which considers induced stress in the thickness direction is more accurate than the FLD of the plane stress.
1. Introduction
Forming limit is an important performance index and process parameter in sheet metal forming. It reflects the maximum degree of deformation that can be achieved before tensile instability during processing, which is one of the main basis for process and mold design. A forming limit diagram (FLD) has been developed to determine the sheet forming limit. FLD can not only distinguish between safety points and failure points but also avoid failure problems in the actual forming process. Therefore, it is widely used in industrial production and promotes the development of sheet metal forming technology.
Keeler [1] (pp. 25–48) and Goodwin [2] (pp. 380–397) first proposed the FLD composed of ultimate strain, which consists of primary strain and secondary strain (two perpendicular directions along the plane of the sheet). Hiller [3] (p. 282) and Negroni [4] (p. 387) et al. proved that FLD is related to strain path according to Swift instability criterion. Korhonen [5] (pp. 303–309) assumed that instability is related to the previous strain history and the strain increment ratio at the time of instability. The Swift instability criterion is used in the positive strain ratio zone, and the Hill instability criterion is used in the negative strain ratio zone to establish the FLD. Lee and Kobayashi [6] (pp. 277–290) used the M-K criterion to analyze the forming limit under complex strain paths and found that only considering the initial necking belt orientation perpendicular to the direction of the maximum principal stress would result in a high FLD.
FLD and its associated analytical and experimental techniques have been widely used for 40 years. Traditional FLD predictions are based on plane stress loading conditions, and the effects of stress in the thickness direction are often ignored. However, the sheet will establish non-negligible normal stress in the thickness direction during the deformation process. For example, normal stress becomes more significant in processes such as bulging. Therefore, in the study of sheet-forming properties, it is necessary to consider the influence of stress in the thickness direction, and further research is urgently needed.
Gotoh et al. [7] (pp. 123–132) proposed an analytical expression. Due to the presence of compressive stress in the thickness direction, the plane strain forming limit in the strain space is improved. They theoretically proved that the out-of-plane stress (even if only one-tenth of the yield stress) can increase the forming ultimate strain. Therefore, it can be used to delay the fracture of the specimen during the stamping process. Smith et al. [8] (pp. 1567–1583) developed a new model that takes into account the effects of compressive stress, so the predicted forming performance is much more accurate than predicted by the Gotoh model. Nurcheshmeh and Green [9] (pp. 213–226) extended the M-K model to a three-dimensional stress state for predicting FLC with different through-thickness stress values. Allwood and Shoule [10] (pp. 1207–1230) proposed a more general forming limit diagram, including positive stress in the thickness direction and shear stress in the thickness direction. Matin and Smith [11] (pp. 671–690) improved the existing model and discussed the effect of stress in thickness direction on FLD. Mozhdeh Erfanian and Ramin Hashemi [12] (pp. 316–326) continuously applied constant stress in the thickness direction, and analyzed the influence of normal stress through the thickness on different forming limit diagrams.
With the development of computer technology and the maturity of finite element technology, the actual forming process of the sheet can be simulated. The results show that even in simple uniaxial tension and biaxial tension tests, the stress in the thickness direction appears during the deformation process. It indicates that stress in the thickness direction is universal. And the appearance of the stress in the thickness direction is induced as the sheet is deformed. This is different from the artificially applied stress in the normal direction, the results may be very different.
In the engineering stress-strain curve, when the engineering stress reaches the maximum value, the material will not immediately fail but will continue to deform. The applied stress remains constant at the maximum level until localized necking occurs. When the loading force is reduced, the sample is broken. Therefore, the maximum force criterion is not a sufficient condition for predicting fracture, and more factors should be included to improve accuracy. Based on this point of view, Hora proposed the revised maximum force criterion (MMFC) [13,14,15,16,17,18]. The MMFC model takes into account the factors of additional tensile stress caused by material necking, which delays localized necking or cracking. Since the model takes into account more factors, its prediction of sheet metal forming is more accurate. Moreover, when predicting the theoretical forming limit (FLD), the model only applies the yield criterion and the stress-strain relationship that the material satisfies, and does not require too many material parameters, so it is also more streamlined.
Through computer simulation, it is proved that the sheet material will induce stress in the thickness direction during the deformation process. The forming limit is calculated based on the MMFC instability criterion and the induced stress thickness direction. The traditional forming limit model is extended to a three-dimensional stress state to predict the forming limit curve of sheet metal based on induced stress in the thickness direction.
2. Finite Element Simulation to Verify the Existence of Stress in the Thickness Direction
To verify that the material will induce stress in the thickness direction during the deformation process, the finite element simulation of uniaxial tension and hemispherical bulging is carried out. The equivalent plastic strain (PEEQ) results obtained by the finite element simulation are shown in Figure 1 and Figure 2. The material used for the simulation is Trip 780, and the thickness of the sheet is 1 mm. In order to confirm the actual conditions of sheet deformation, a solid element is selected which is more precise.
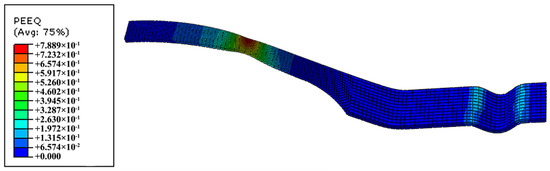
Figure 1.
Simulation result of equivalent strain in uniaxial tension.

Figure 2.
Simulation result of the bulging simulation.
According to the simulation results, the main stresses S11, S22 and S33 in the three directions where necking occurs are extracted, and the schematic diagram of the stress changing with time is drawn, as shown in Figure 3. Before point A, the sheet is always in a state of uniaxial stress, that is, it is only affected by the principle stress S11. When the stress curve reaches point A, the stress S33 in the thickness direction appears inside the sheet. Then the sheet continues to deform. When the curve reaches point B, the minor stress in the direction of vertical principle stress also appears, and the sheet is in a triaxial stress state. The principal stress in the three directions of the neck point is also extracted, as shown in Figure 4. With the deformation of the sheet, the stress S33 in the thickness direction appears after the curve reaches point A. It can be concluded that the sheet is not only affected by plane stress during the deformation process, and the stress in the thickness direction is induced as the deformation progresses.

Figure 3.
Schematic diagram of stress change at the necking point.

Figure 4.
Schematic diagram of the stress change at the necking point.
The tensile stress in the thickness direction is induced during the deformation of the sheet, which is caused by the mutual restraint between the particles. The thickness of the sheet becomes thinner in the process of deformation. When the deformation reaches a certain extent, the sheet locally becomes thinner. This thinning trend is limited by nearby materials, which induces stress in the thickness direction.
And when the ratio of thickness to width of the sheet metal is constant, the stress in the thickness direction appears first than the minor stress in the sheet. Therefore, the forming limit diagram which considers plane stress only has an error.
3. Theoretical Basis
3.1. C-H Instability Criterion
According to C-H instability theory, the process of metal sheet material from initial deformation to fracture needs to go through yield, dispersed instability stage, concentrated instability stage, and fracture stage. The main failure stage of material strength mainly occurs in concentrated instability stage. For uniaxial tension, when the material deformation reaches the concentrated instability stage, the deformation mainly occurs in the main strain direction, while the compressive strain increment in the width direction gradually decreases, and this trend becomes more and more obvious as the deformation increases. When , concentrated instability occurs, that is, the material is about to fracture, which is the theoretical basis of C-H instability criterion.
3.1.1. Solution of Relevant Parameters of Sheet Metal Yield Function
Applying the Hosford criterion, when , , the yield criterion degenerates to the isotropic Mises yield criterion; When it becomes anisotropic quadratic Hill48 yield criterion. The Hosford criterion expression is:
Set ,, so:
Set , including:
The stress change of sheet metal under external force is:
where:
Because:
So, it is concluded that:
Set:
Because Drucker formula:
The following formula is obtained:
The scale factor can be obtained by the following method. During deformation, the shaping work per unit volume of sheet metal can be expressed as:
where is the stress tensor. Therefore:
From formula Equation (4), we can get:
By combining Equation (5) formula and Equation (3) formula, we can get:
Taking the above results into formula Equation (3), we can get:
Corresponding results:
Including:
The hardening law of sheet metal is:
The deformation resistance of the material can be obtained from the differential Equation (7):
The deformation resistance of the material during stable deformation is equal to the stress increment, that is, the formula Equation (8) is equal to the Equation (2):
3.1.2. Calculation of the Limit Strain of Considered Dispersion Instability
According to the Considered instability criteria:
If the sheet ratio is loaded, i.e., ,then:
Substitute Equations (7) and (8) into Equation (9) and note the relationship Equation (6). The limit strain expression satisfying the Considered criterion can be obtained:
3.1.3. Calculation of Limit Strain of Concentrated Instability
According to the C-H instability criterion, assuming that the strain path begins to drift to the plane strain state when the load is kept constant at the maximum level during the deformation of the material, that is, the secondary strain gradually approaches zero, and then the sheet metal will have concentrated instability, then:
Substitute the first item in Equation (10) into Equation (9) to get:
The formula Equations (1) and (6) can be obtained as follows:
In the drift stage, the limit strain value of concentrated instability can be obtained by gradually integrating Equations (11) and (12) with iterative method. If approaches 0 infinitely (truncation error is specified in this paper), the operation is terminated:
3.2. MMFC Instability Criterion
The MMFC instability criterion states that the material does not immediately become unstable when the stress reaches the maximum value. At this time, the strain ratio begins to change, the material is unstable when . The detailed calculation process can refer to the literature [19] (pp. 267–279). And the main theoretical basis is: Stress is a function of strain ratio . Therefore, the stress increment can be expressed as
The original maximum force condition is:
Substitute Equation (13) into Equation (14) to get Equation (15):
In the case of , is zero and remains the same, that is, the state of uniform deformation. During the deformation process, the stress increases with the influence of work hardening, the hardening rate gradually decreases for most metal materials. When the condition is reached, will change correspondingly to keep the stability of the equilibrium state.
Set
Set as the strain increment ratio, and as the stress ratio, where is the medium that introduces the stress in the thickness direction. In general, as long as the yield function is given. Then and can be calculated accordingly as
Equation (15) is converted to
Then the correction formula of the maximum force criterion is obtained.
3.3. Mises Yield Criterion
R. Von Mises obtained the Mises yield criterion by revised and refining Treaca’s conclusions. The Mises yield criterion can be expressed as:
The principal stress state expression is:
3.4. HILL48 Yield Criterion
According to the Mises yield criterion, Hill proposed a yield criterion with the ability to describe anisotropy. That is, by adding some parameters to the yield function, the position of the material’s actual yield point can be more accurate. The equivalent stress is expressed as:
where , , are the principal axes of three orthogonal directions, where , , , , , and are anisotropic parameters. The corresponding principal stress state expression is:
Assume that the material only has differences in the thickness direction.
Set . Then the yield criterion [20] (pp. 45–53) can be written as
Set ,,
4. Calculation Results and Discussion
4.1. Always Apply Stress in the Thickness Direction during Sheet Deformation
For a typical steel TRIP780, the hardening curve is described by the swift model [21] (pp. 2370–2378). Table 1 is the coefficient of the constitutive equation.

Table 1.
Swift constitutive equation coefficient.
The Swift constitutive equation expression is:
The FLD of introducing the stress in the thickness direction by the proportional method is shown in Figure 5 and Figure 6. The shown in the figure is the ratio of the stress in the thickness direction to the principal stress, which is a negative value, that is, compressive stress in the thickness direction is introduced; is a positive value, that is, the tensile stress is introduced in the thickness direction; means no stress in the thickness direction. The value of increases, indicating that the stress in the thickness direction increases.
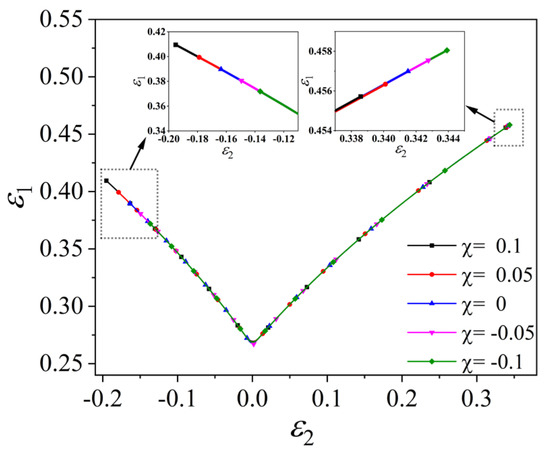
Figure 5.
FLD of material TRIP780 based on Mises yield criterion and MMFC instability criterion.

Figure 6.
FLD of material TRIP780 based on Hill48 yield criterion and MMFC instability criterion.
Compared with the plane stress state, the height of FLC does not change significantly after the stress in the thickness direction was introduced, but the length of the curve changes significantly. In the tension and compression zone on the left side, the compressive stress in the thickness direction increases, the FLC becomes shorter, and the ultimate strain of the corresponding strain state decreases; In the biaxial tension zone on the right side, the compressive stress in the thickness direction increases, and the FLC becomes longer, indicating that the ultimate strain of the corresponding strain state increases. When the tension stress in the thickness direction is introduced, the conclusion is reversed.
The FLD of introducing the stress in the thickness direction by the constant method is shown in Figure 7 and Figure 8. is always constant during material deformation, and the greater the value of , the greater the stress in the thickness direction.

Figure 7.
FLD of material TRIP780 based on Mises yield criterion and MMFC instability criterion.

Figure 8.
FLD of material TRIP780 based on Hill48 yield criterion and MMFC instability criterion.
The changing trend of the FLC is similar to the proportional method when the stress in the thickness direction is introduced by the constant method. As the compressive stress in the thickness direction increases, the curve of the tension and compression zone on the left side becomes shorter, and the curve of the biaxial tension zone on the right side becomes longer; However, when the compressive stress in the thickness direction increases in a form of constant, the curve shifts slightly to the lower right as a whole, and resulting in the curve on the left side increases slightly and a small increase in the forming limit; The curve on the right side drops slightly and the range of forming limits is also slightly reduced. When the tension stress in the thickness direction is introduced, the conclusion is reversed. And in the biaxial tension zone on the right side, the curve gradually closes.
4.2. Sheet Material Is Induced Stress in the Thickness Direction during Deformation
4.2.1. Induced Stress in Thickness Direction Based on MMFC Instability Model
Due to the principle of volume invariably, the deformation of the sheet in the planar direction is maintained by thinning in the thickness direction during the uniaxial tension or biaxial tension experiments. When the thickness of the material begins to thin, due to the mutual restraint between the particles, there will be a force to prevent the thinning. Moreover, when the material begins to neck, this force that opposes thinning will be very obvious, that is, the induced tensile stress in the thickness direction.
After the material becomes load instability, the flow constraint force between the material particles is increasing, and the strain state gradually drifts to the plane strain state, that is, the strain increment ratio gradually approaches zero. Therefore, the stress ratio α is not loaded according to the initial stress ratio at this stage but changes at any time. According to the change of the ratio of the minor stress to the principal stress, the relationship between and is established and then accumulates the sum.
For the material TRIP780, the Swift constitutive equation is used, and the stress in the thickness direction is considered to solve the theoretical FLD, as shown in Figure 9 and Figure 10.
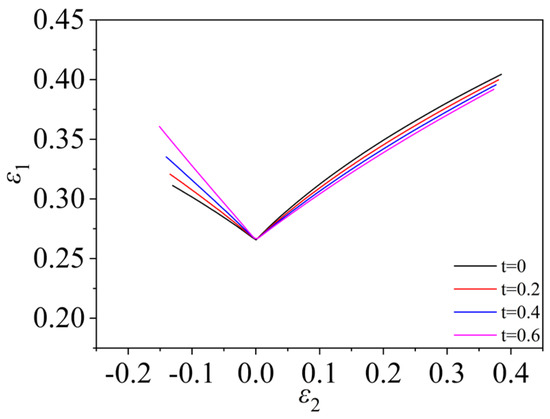
Figure 9.
FLD of material TRIP780 based on Hill48 yield criterion and MMFC instability criterion.

Figure 10.
FLD of material TRIP780 based on Mises yield criterion and MMFC instability criterion.
Compared with applying the stress in the thickness direction all the time in the deformation process, the FLC which considers the induced stress in the thickness direction has changed significantly. As can be seen from the figure, the plane strain point of the FLC does not change. In the tension and compression zone, when the given multiple increases (the same loading time, larger stress in the thickness direction is induced inside the sheet), the FLC is significantly increased, and the range of forming limits is increased; the curve gradually becomes longer as increases. The curve is the longest when , indicating that the ultimate strain of the corresponding strain state increases.
4.2.2. Induced Stress in Thickness Direction Based on C-H Instability Model
The C-H instability criterion [22] considers when , , the material is about to break. It is assumed that the stress in the thickness direction is induced in the concentrated instability phase. The intermediate process of iterative calculation is:
When is less than a certain value, the operation is stopped (this article specifies the truncation error ). The main strain value at this time is the ultimate strain value when the sheet material is localized necking:
Figure 11 is a FLD based on the C-H instability criterion and the Hill48 yield criterion when considering the induced stress in the thickness direction. Figure 12 is a FLD based on the C-H instability criterion and the Mises yield criterion when considering the induced stress in the thickness direction. Compared with MMFC instability criterion, the overall change trend of FLD based on C-H model is similar. The curve of the tension and compressed zone increases as increases, so the forming limit increases; The curve of the biaxial tension zone decreases as increases and becomes shorter; However, on the left side, the slope of the FLC which is based on the C-H instability model rises very small, so the curve change is not obvious; while the slope of the curve on the right side is more obvious.
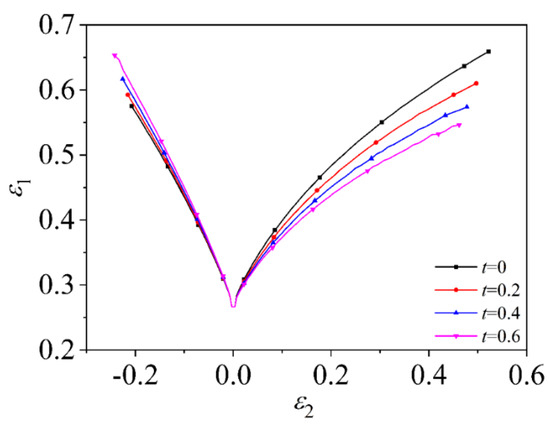
Figure 11.
FLD of material TRIP780 based on Hill48 yield criterion and C-H instability criterion.

Figure 12.
FLD of material TRIP780 based on Mises yield criterion and C-H instability criterion.
4.2.3. Effect of Strain Hardening Exponent on Forming Limit
The strain hardening index is the strain-strengthening ability of the material during deformation. The larger the value of , the stronger the strain-hardening ability. Figure 13 and Figure 14 show the FLD for different values of based on the Mises yield criterion and the MMFC instability criterion. The forming limit curve shifts upwards significantly as the value of increases and the range of forming limits increases. Considering the induced stress in the thickness direction does not significantly change the effect of the on the forming limit, only affecting the overall change of the curve, as shown in Figure 15.

Figure 13.
FLD for different values of at = 0.4.
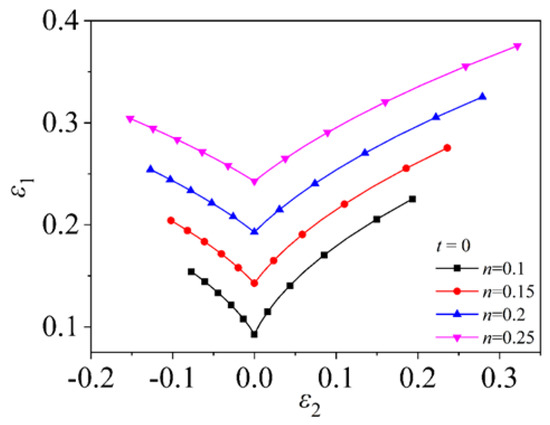
Figure 14.
FLD for different values of at = 0.0.
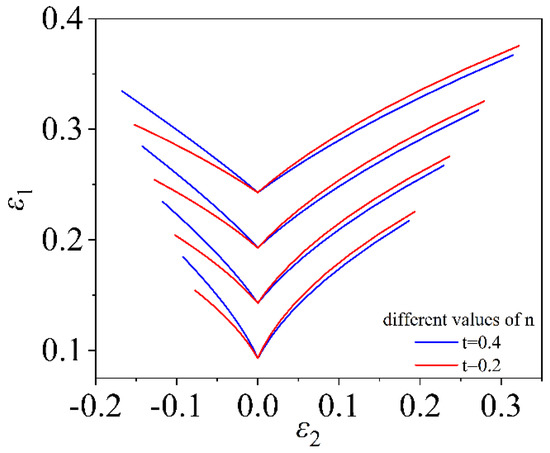
Figure 15.
FLD for different values of at = 0.0 and 0.4.
4.2.4. The Effect of Coefficient of Normal Anisotropy on Forming Limit
The coefficient of normal anisotropy reflects the difference between the plane direction and the thickness direction of the sheet during the deformation process. After considering the induced stress in the thickness direction, the effect of the on the FLD has changed significantly.
For the MMFC instability criterion, when the thickness direction stress is not considered, the change of the hardly changes the slope of the curve, but significantly affects the length of the curve. The FLC of the tension and compression zone increases with the increase in , and the curve of the biaxial tension zone becomes shorter as the increases, as shown in Figure 16. For this, the C-H instability criterion shows the same. The difference is that the significantly affects the slope of the biaxial tension zone on the right side of the curve, as shown in Figure 17. The value of increases and the slope decreases, indicating that the normal anisotropy is more pronounced, and the easier the material reaches the forming limit.

Figure 16.
FLD for different values based on MMFC instability criterion and Hill48 yield criterion at = 0.

Figure 17.
FLD for different values based on C-H instability criterion and Hill48 yield criterion at = 0.
When considering the induced stress in the thickness direction, the slope of the FLC based on the MMFC criterion also changes significantly. The slope of the curve on the left side increases with the increase in ; the curve on the right-side increases with the value of decreasing, as shown in Figure 18. Based on the C-H criterion, the sensitivity of the value to the forming limit curve decreases with the induced stress in the thickness direction. By comparing Figure 17 and Figure 19, it can be seen that the slope of the curve on the right side is closer considering the induced stress in the thickness direction.

Figure 18.
FLD for different values based on MMFC instability criterion and Hill48 yield criterion at = 0.4.

Figure 19.
FLD for different values based on C-H instability criterion and Hill48 yield criterion at = 0.4.
5. Verification of the Forming Curve after Induced Thick Stress
5.1. Forming Curve Verification of Material TRIP780
In order to verify whether the forming limit under the induced stress in the thickness direction is closer to the experimental results, the FLD of the material TRIP780 and the material AA5182 were calculated and compared with the experimental data which using the Swift constitutive equation and the modified Voce constitutive equation and the more accurate anisotropic yield criterion Hill48 yield criterion. The constitutive equation coefficients and the forming limit experimental data are taken from the data published by NUMISHEET 2013.
The mechanical properties of the material TRIP780 are shown in Table 2.
Table 2.
Mechanical properties of material TRIP780.
The modified Voce constitutive equation expression is as:
The coefficients of the constitutive equation are shown in Table 3.
Table 3.
Modified Voce constitutive equation coefficient of material TRIP780.
The stress-strain curve of the material TRIP780 is obtained according to the constitutive equation of the material, and the forming limit curves with different constitutive equations are as follows:
As shown in Figure 20, the two stress-strain relationships coincide with each other during the uniform deformation stage, and they diverge after the non-uniform deformation point. As the number of deformations increases, it can be seen that the slope of the Swift stress-strain relationship is higher than the modified Voce. In other words, the hardening rate of the material based on the Swift stress-strain relationship is higher than the hardening rate of the material based on the modified Voce relationship. Higher material hardening rates may result in higher forming limits. Therefore, the forming limit calculated based on the Swift relationship is higher than the forming limit based on the modified Voce relationship.
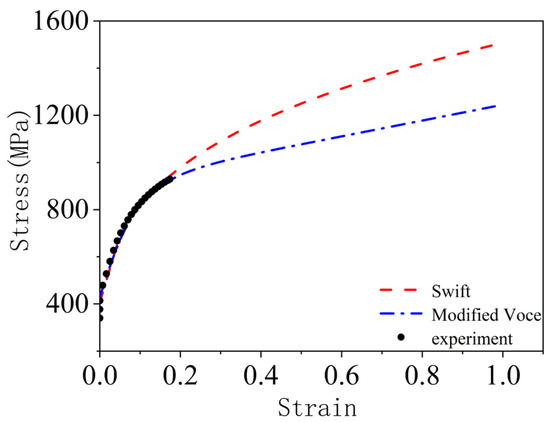
Figure 20.
Stress-strain curve of material TRIP780.
As shown in Figure 21 and Figure 22, considering the induced stress in thickness direction during the deformation process, as the value of t increases, and the forming limit curve gradually moves closer to the experimental data. It is shown that after considering the induced stress in the thickness direction, the material forming is indeed closer to the actual forming conditions, and the accuracy of the theoretical forming limit curve is improved.

Figure 21.
FLD of material TRIP780 based on Swift constitutive equation and MMFC instability criterion.

Figure 22.
FLD of material TRIP780 based on modified Voce constitutive equation and MMFC instability criterion.
5.2. Forming Curve Verification of Material AA5182
The mechanical properties of the material AA5182 are shown in Table 4.
Table 4.
Mechanical properties of material AA5182.
Table 5.
Swift constitutive equation coefficients of material AA5182.
Table 6.
Modified Voce constitutive equation coefficients of material AA5182.
The stress-strain curve of material AA5182 is obtained according to the constitutive equation of the material, and the forming limit curves with different constitutive equations are as follows:
As shown in Figure 23, both modified Voce and Swift stress-strain relations can accurately describe the curve of the elastic deformation region during uniaxial tension. However, the FLD calculated based on the modified Voce constitutive equation is different from that based on the stress-strain relation of Swift. Since the experimental data of the non-uniform deformation stage cannot be obtained, the material constants of the two stress-strain relations can only be obtained by fitting the experimental data of the uniform deformation process [22]. Therefore, the accuracy of modified Voce and Swift stress-strain relationship in describing the deformation behavior of non-uniform deformation cannot be guaranteed. However, the calculation process of forming limits includes uniform and non-uniform deformation processes. Further comparison of the modified Voce and Swift flow stress-strain relationships is shown in Figure 24 and Figure 25. For material AA5182, the forming limit of the material can be more accurately described based on the modified Voce constitutive equation; The Swift constitutive equation has a higher hardening rate, which causes the FLC to deviate greatly from the actual experimental data. It can be seen from Figure 25 that the theoretical prediction of FLC is better than the experimental data after considering the induced stress in the thickness direction during the deformation process.
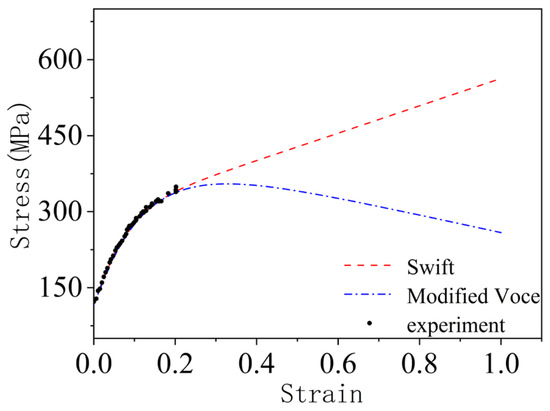
Figure 23.
Stress-strain curve of material AA5182.
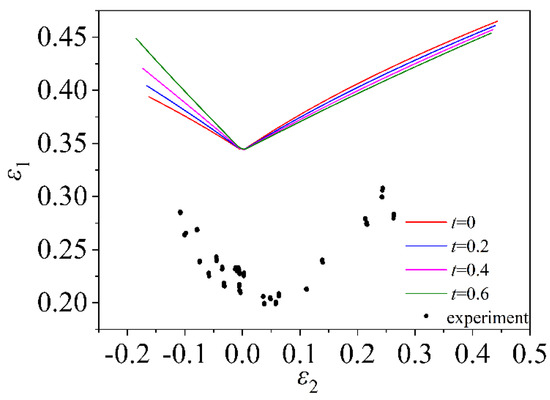
Figure 24.
FLD of material AA5182 based on Swift constitutive equation and MMFC instability criterion.

Figure 25.
FLD of material AA5182 based on modified VOCE constitutive equation and MMFC instability criterion.
5.3. Forming Curve Verification of Material 5754O
The mechanical properties of the material 5754O are shown in Table 7.
Table 7.
Mechanical properties of material 5754O.
Table 8.
Swift constitutive equation coefficients of material 5754O.
Table 9.
Voce constitutive equation coefficients of material 5754O.
The stress-strain curve of material 5754O is obtained according to the constitutive equation of the material, and the forming limit curves with different constitutive equations are as follows.
The stress-strain curve is shown in Figure 26. For material 5754O, the Voce stress-strain relationship with a low hardening rate is used to solve the theoretical FLD. As shown in the Figure 27, it is further confirmed that the FLC which considers the induced stress in the thickness direction is more consistent with the experimental data, and the accuracy of the FLD under the induced stress in the thickness direction is verified.

Figure 26.
FLD of material 5754O based on Swift constitutive equation and MMFC instability criterion.

Figure 27.
FLD of material 5754O is obtained based on VOCE constitutive equation and MMFC instability criterion.
6. Conclusions
- (1)
- In this paper, solid element is used to simulate the bulging test of hemispherical punch, and the principal stresses S11, S22 and S33 in three directions are extracted from the finite element simulation results. It is confirmed that the thick stress is induced during the plastic deformation of sheet metal.
- (2)
- When solving the theoretical forming limit, the conclusion that the stress in the thickness direction is always applied to the sheet and the stress in the thickness direction is induced during the deformation of the sheet is not exactly the same. In this paper, the study of induced thick stress shows that the influence of induced stress in thickness direction on FLD during deformation process is not only reflected in the length of the curve but also affects the height. The FLC of the tension and compression zone is significantly increased compared with the plane strain state, and as the strain increases, the degree of elevation also increases. The FLC decreases in the biaxial tension zone, and the degree of decrease gradually becomes stable with the increase in strain. Appropriate methods should be used in the project to predict the theoretical limit curve of the sheet metal.
- (3)
- This study shows that the induced stress in the thickness direction does not significantly change the effect of on FLD, but significantly changes the sensitivity of to FLD. The method of always applying stress in the thickness direction does not significantly change the effect of and values on FLD, but only changes the overall change of the curve. In addition, FLC increases with the increase in value, which is the effect of value itself on FLD. The larger the value, the longer the FLC. This result is also consistent with the results of other theoretical models.
- (4)
- Even with a more accurate anisotropic yield function, the stress-strain relationship plays an important role in forming limits [22]. The two flow stress-strain relationships described in this paper, Swift stress-strain relationship and modified Voce stress-strain relationship can accurately describe the deformation behavior of uniform strain, but the resulting forming limits are very different. Therefore, in calculating the sheet forming limit, in addition to choosing the appropriate yield criterion, an appropriate stress-strain relationship should be used.
- (5)
- The stress in the thickness direction must be induced during the deformation of the sheet. By comparing the theoretical calculation of the three materials TRIP780, AA5182 and 5754O with the experimental data, it is found that the FLC which considers the induced stress in the thickness direction is more consistent with the experimental data, and the prediction accuracy is higher. It is proved that the FLD which only considers the plane stress state is defective, so it is important to consider the induced stress in the thickness direction when predicting the theoretical FLD.
Author Contributions
Conceptualization, H.W.; Methodology, H.W.; Software, Z.W.; Formal analysis, H.W. and Z.W.; Data curation, Z.W.; Writing—original draft, Z.W.; Writing—review & editing, H.W. All authors have read and agreed to the published version of the manuscript.
Funding
This research was funded by [R&D Program of Beijing Municipal Education Commission] grant number [KZ200010009041] and [Beijing Municipal University Youth Top Talents Training Program] grant number [CIT&TCD201704014].
Institutional Review Board Statement
Not applicable.
Informed Consent Statement
Not applicable.
Data Availability Statement
Not applicable.
Conflicts of Interest
The authors declare no conflict of interest.
References
- Keeler, S.P.; Backofen, W.A. Plastic instability and fracture in sheets stretched over rigid. Punches Trans. ASM 1965, 56, 25–48. [Google Scholar]
- Goodwin, G.M. Application of strain analysis to sheet metal forming problems in the press shop. SAE Trans. 1968, 77, 380–397. [Google Scholar]
- Hillier, M.J. Instability Strains in Plane Sheet Under Biaxial Stress. J. Appl. Mechs. 1966, 33, 282. [Google Scholar] [CrossRef]
- Negroni, F.; Kobayasi, S.; Thomsen, E.G. Plastic instability in simple stretching of sheet metal. Trans. ASME Ser. B 1968, 2, 387. [Google Scholar] [CrossRef]
- Korhonen, A.S. On the theories of sheet metal necking and forming limits. J. Eng. Mater. Technol. Trans. ASME 1978, 100, 303–309. [Google Scholar] [CrossRef]
- Lee, S.H.; Kobayashi, S. Effects of strain paths on the stretching limit strains of sheet metal with Planar anisotropy. In Proceedings of the 3rd North American Metal Working Research Conference, Pittsburg, PA, USA, 5–7 May 1975; pp. 277–290. [Google Scholar]
- Gotoh, M.; Chung, T.; Iwata, N. Effect of out-of-plane stress on the forming limit strain of sheet metals. JSME Int. J. Ser. A 1995, 38, 123–132. [Google Scholar] [CrossRef]
- Smith, L.M.; Averill, R.C.; Lucas, J.P.; Stoughton, T.B.; Matin, P.H. Influence of transverse normal stress on sheet metal formability. Int. J. Plast. 2003, 19, 1567–1583. [Google Scholar] [CrossRef]
- Nurcheshmeh, M.; Green, D.E. Influence of out-of-plane compression stress on limit strains in sheet metals. Int. J. Mater. Form. 2012, 5, 213–226. [Google Scholar] [CrossRef]
- Allwood, J.M.; Shouler, D.R. Generalised Forming Limit Diagrams Showing Increased Forming Limits with Non-Planar Stress States. Int. J. Plast. 2009, 25, 1207–1230. [Google Scholar] [CrossRef]
- Matin, P.H.; Smith, L.M. Practical Limitations to the Influence of Through-Thickness Normal Stress on Sheet Metal Formabiliaty. Int. J. Plast. 2005, 21, 671–690. [Google Scholar] [CrossRef]
- Erfanian, M.; Hashemi, R. A comparative study of the extended forming limit diagrams considering strain path through-thickness normal and shear stress. Int. J. Mech. Sci. 2018, 148, 316–326. [Google Scholar] [CrossRef]
- Hora, P.; Tong, L.; Reissner, J. A Prediction Method for Ductile Sheet Metal Failure Using FE-Simulation; NUMISHEET: Dearborn, MI, USA, 1996; pp. 252–256. [Google Scholar]
- Hora, P. Mathematical Prediction of FLC Using Macroscopic Instability Criteria Combined with Micro Structural Crack Propagation Models; ETH: Quebec, QC, Canada, 2003; pp. 364–366. [Google Scholar]
- Hora, P.; Tong, L. Numerical Prediction of FLC Using the Enhanced Modified Maximum Force Criterion (eMMFC); FLC Zurich 06: Zurich, Switzerland, 2006; pp. 31–36. [Google Scholar]
- Krauer, J.; Hora, P.; Tong, L. Forming limits prediction of metastable materials with temperature and strain induced martensite transformation. In Proceedings of the 9th International Conference on Numerical Methods in Industrial Forming Processes (NUMIFORM 2007), Porto, Portugal, 17–21 June 2007; pp. 1263–1268. [Google Scholar]
- Hora, P.; Tong, L. Theoretical prediction of the influence of curvature and thickness on the enhanced modified maximum force criterion. In Proceedings of the 7th International Conference and Workshop on Numerical Simulation of 3D Sheet Metal Forming Processes (NUMISHEET 2008), Interlaken, Switzerland, 1–5 September 2008; pp. 205–210. [Google Scholar]
- Hora, P.; Eberle, B.; Volk, W. Numerical methods for a robust user-independent evaluation of Nakajima test for the FLC determination. In Proceedings of the International Deep Drawing Research Group 2009 (IDDRG 2009), Golden, CO, USA, 1–3 June 2009; pp. 437–444. [Google Scholar]
- Hora, P.; Tong, L.; Berisha, B. Modified maximum force criterion, a model for the theoretical prediction of forming limit curves. Int. J. Mater. Form. 2013, 6, 267–279. [Google Scholar] [CrossRef]
- Wang, H.; Wan, M.; Yan, Y.; Wu, X. Influence of parameter solving method on the ability of anisotropic behavior of yield criterion. J. Mech. Eng. 2013, 24, 45–53. [Google Scholar]
- Wang, H.; Wan, M.; Yan, Y. Effect of flow stress-strain relation on forming limit of 5754O aluminum alloy. Trans. Nonferr. Met. Soc. China 2012, 22, 2370–2378. [Google Scholar] [CrossRef]
- Chen, G. Study on Tensile Deformation Damage, Instability and Forming Limit of Sheet Metal. Ph.D. Thesis, Beihang University, Beijing, China, 1991. [Google Scholar]
Disclaimer/Publisher’s Note: The statements, opinions and data contained in all publications are solely those of the individual author(s) and contributor(s) and not of MDPI and/or the editor(s). MDPI and/or the editor(s) disclaim responsibility for any injury to people or property resulting from any ideas, methods, instructions or products referred to in the content. |
© 2023 by the authors. Licensee MDPI, Basel, Switzerland. This article is an open access article distributed under the terms and conditions of the Creative Commons Attribution (CC BY) license (https://creativecommons.org/licenses/by/4.0/).