Article

Research on Sinter Quality Prediction System Based on Granger Causality Analysis and Stacking Integration Algorithm

College of Metallurgy and Energy, North China University of Science and Technology, Tangshan 063210, China
*
Author to whom correspondence should be addressed.
Metals 2023, 13(2), 419; https://doi.org/10.3390/met13020419
Submission received: 21 November 2022 / Revised: 9 February 2023 / Accepted: 12 February 2023 / Published: 17 February 2023

Abstract

:
Sinter ore quality directly affects the stability of blast furnace production. In terms of both physical and chemical properties, the main indicators of sinter quality are the TFe content, alkalinity, and drum index. By analyzing the massive historical data on the sinter production of a steel company, this study proposes a sinter quality prediction system based on Granger causality analysis and a stacking integration algorithm. First, based on real historical data of sintering production in steel enterprises (including coal gas pressure, ignition temperature, combustion air pressure, etc.), data preprocessing of raw data was carried out using a combination of feature engineering and the sintering process. Second, Pearson correlation analysis, Spearman correlation analysis, and Granger causality analysis were used to screen out the characteristic parameters with a strong influence on the target variable of sinter quality (drum Index, TFe, alkalinity). Third, a prediction model for sinter quality parameters was developed using a stacking integration algorithm pair for training. Finally, a program development tool was used to realize the establishment and online operation of a sinter ore quality prediction system. The test results showed that the predicted goodness of fit of the model for the TFe content, alkalinity (R), and drum index were 0.942, 0.958, and 0.987, respectively, and the model calculation time met the actual production requirements. By establishing a suitable model and running the program online, the real-time prediction of the main indicators of sinter quality was realized to guide production promptly.

1. Introduction

At this stage, China's black smelting technology is still dominated by the "sintering-blast furnace-converter" process. The CO2 emissions of sintering and blast furnace(BF), which consume the most energy, account for about 80% of the CO2 emissions of the iron and steel industry [1]. In the main three-step process, the former always provides raw materials for the latter, so sintering production is crucial. Although some Chinese steel enterprises have vigorously increased the proportion of pellets in the charge structure of BF, the proportion of sinter is still as high as about 75% [2]. Therefore, the quality of the sinter is still the key to the overall production level and emission level: high-quality sinter can effectively reduce the energy consumption of each part and play a positive role in the heat supply and fuel consumption in the furnace. In the sinter-production process, the staff mainly pays attention to the location of the burning through point (BTP). Stable control of BTP requires improving the utilization efficiency of the sintering machine and the quality of the sinter minerals, which can effectively reflect the sintering thermal state, which is one of the important signs when judging whether the sintering process is normal. In addition, the physicochemical properties of sinter quality are also of concern at the production site.
The sintering process has the characteristics of time delay and nonlinearity [3,4,5,6]. Although some mechanistic models simulate part of the sintering process, they cannot be adapted to the production environment due to the instability of the sintered material and the frequent changes in the production pattern. The data-driven prediction model regards the sintering system as a black box model and has achieved good results in the monitoring of BTP and the prediction of sinter quality. Wang Qingyao established an artificial-neural-network-based online prediction model for the sintered ore drum index using the predictive power of the Elman model to improve its prediction model’s guidance [7,8]. Xin Zicheng applied the BP neural network algorithm to the prediction of low-temperature reduction pulverization performance of vanadium and titanium sinter ore to explore the relationship between the input samples and the output samples. The results showed that the BP neural network model applied to the study of the reduction pulverization performance of sintered ore, and the average relative error was 5.7%, which satisfied the requirement of prediction accuracy in production [9]. Yi Zhengming proposed a quality prediction model applying momentum term and change learning rate to improve the BP neural network to achieve the prediction and output of the TFe index of sintered ore [10]. Li developed a prediction model for BF production using the superposition algorithm and demonstrated that the process parameters of different regions of the BF were predicted using the superposition algorithm to achieve better results in both classification and regression models [11]. Chen analyzed the correlation of a telemetry data time series using the Granger causality model and established a causality model to detect anomalies and determine the causes of anomalies through causality under normal conditions [12]. Some other scholars have used an intelligent approach to achieve the development and application of predictive models with different parameters [13,14,15].
The existing technology of the prediction model for sinter quality can only predict a single project and has not yet realized a model-establishment mechanism that can meet the prediction of multiple sinter physicochemical properties. Moreover, the sinter quality contains many parameters, and the dimensions of different parameters are different, resulting in the model's prediction accuracy.
Therefore, this study combined the advantages of mechanistic analysis and the black box model to obtain the causal relationships and lag time windows between sintering variables and BTP, sintering variables, and sintering quality using correlation analysis and causality analysis. This result is then applied to the integrated learning model to build a quality state prediction model for the sintering system.

2. Data Foundation and Model Algorithm

2.1. Production Data

Taking a 360 m2 sintering machine in a domestic steel company as the research object, the time range included the actual production data of the sintering process from January 2018 to December 2019. The sintering data were divided into four parts: raw material data, operation data, status data, and quality-inspection data. The specific names of some parameters are shown in Table 1. It can be seen in Table 1 that the raw material data include the amount of sintering raw materials used and the chemical composition content of raw materials. Among them, the composition of SiO2 and MgO in raw materials all have a great influence on the quality of sintered ore. The operation data are human-operated sintering machine parameters, which cover important operating parameters of the whole sintering production process, such as trolley material thickness, coal gas pressure, exhaust gas temperature of north bellows, ring cooler speed, etc. The status data indicate the operating and working status of the sintering machine, including significant status parameters of the whole sintering production process such as BTP, air box exhaust gas temperatures, air box vacuum degree, etc. The quality-inspection data refer to the physical and chemical properties of the sinter ore, including alkalinity, drum Index, FeO, etc. Based on the characteristics of different data types, sintering production data are stored in different databases. The quality-inspection data are stored in the Oracle database, and other data are stored in the SQL Server database. Based on the difference in data sources and production processes, the generation frequency of sintering production data is different. The generation frequency of raw material data and quality-inspection data is related to the detection frequency of the production site, and there is no obvious rule. The operation data and status data are automatically generated by the equipment in the sintering production process, and the frequency is 1 second/iteration, but to facilitate subsequent data processing and analysis, the collection frequency of these two types of data is set at 1 hour/iteration.

2.2. Data Processing

Sintering production data are a multivariate and heterogeneous type of data with different characteristics and varying quality due to various production conditions. It is necessary to preprocess the original sintering production data to meet the data quality requirements of subsequent causal analysis and predictive model input function.

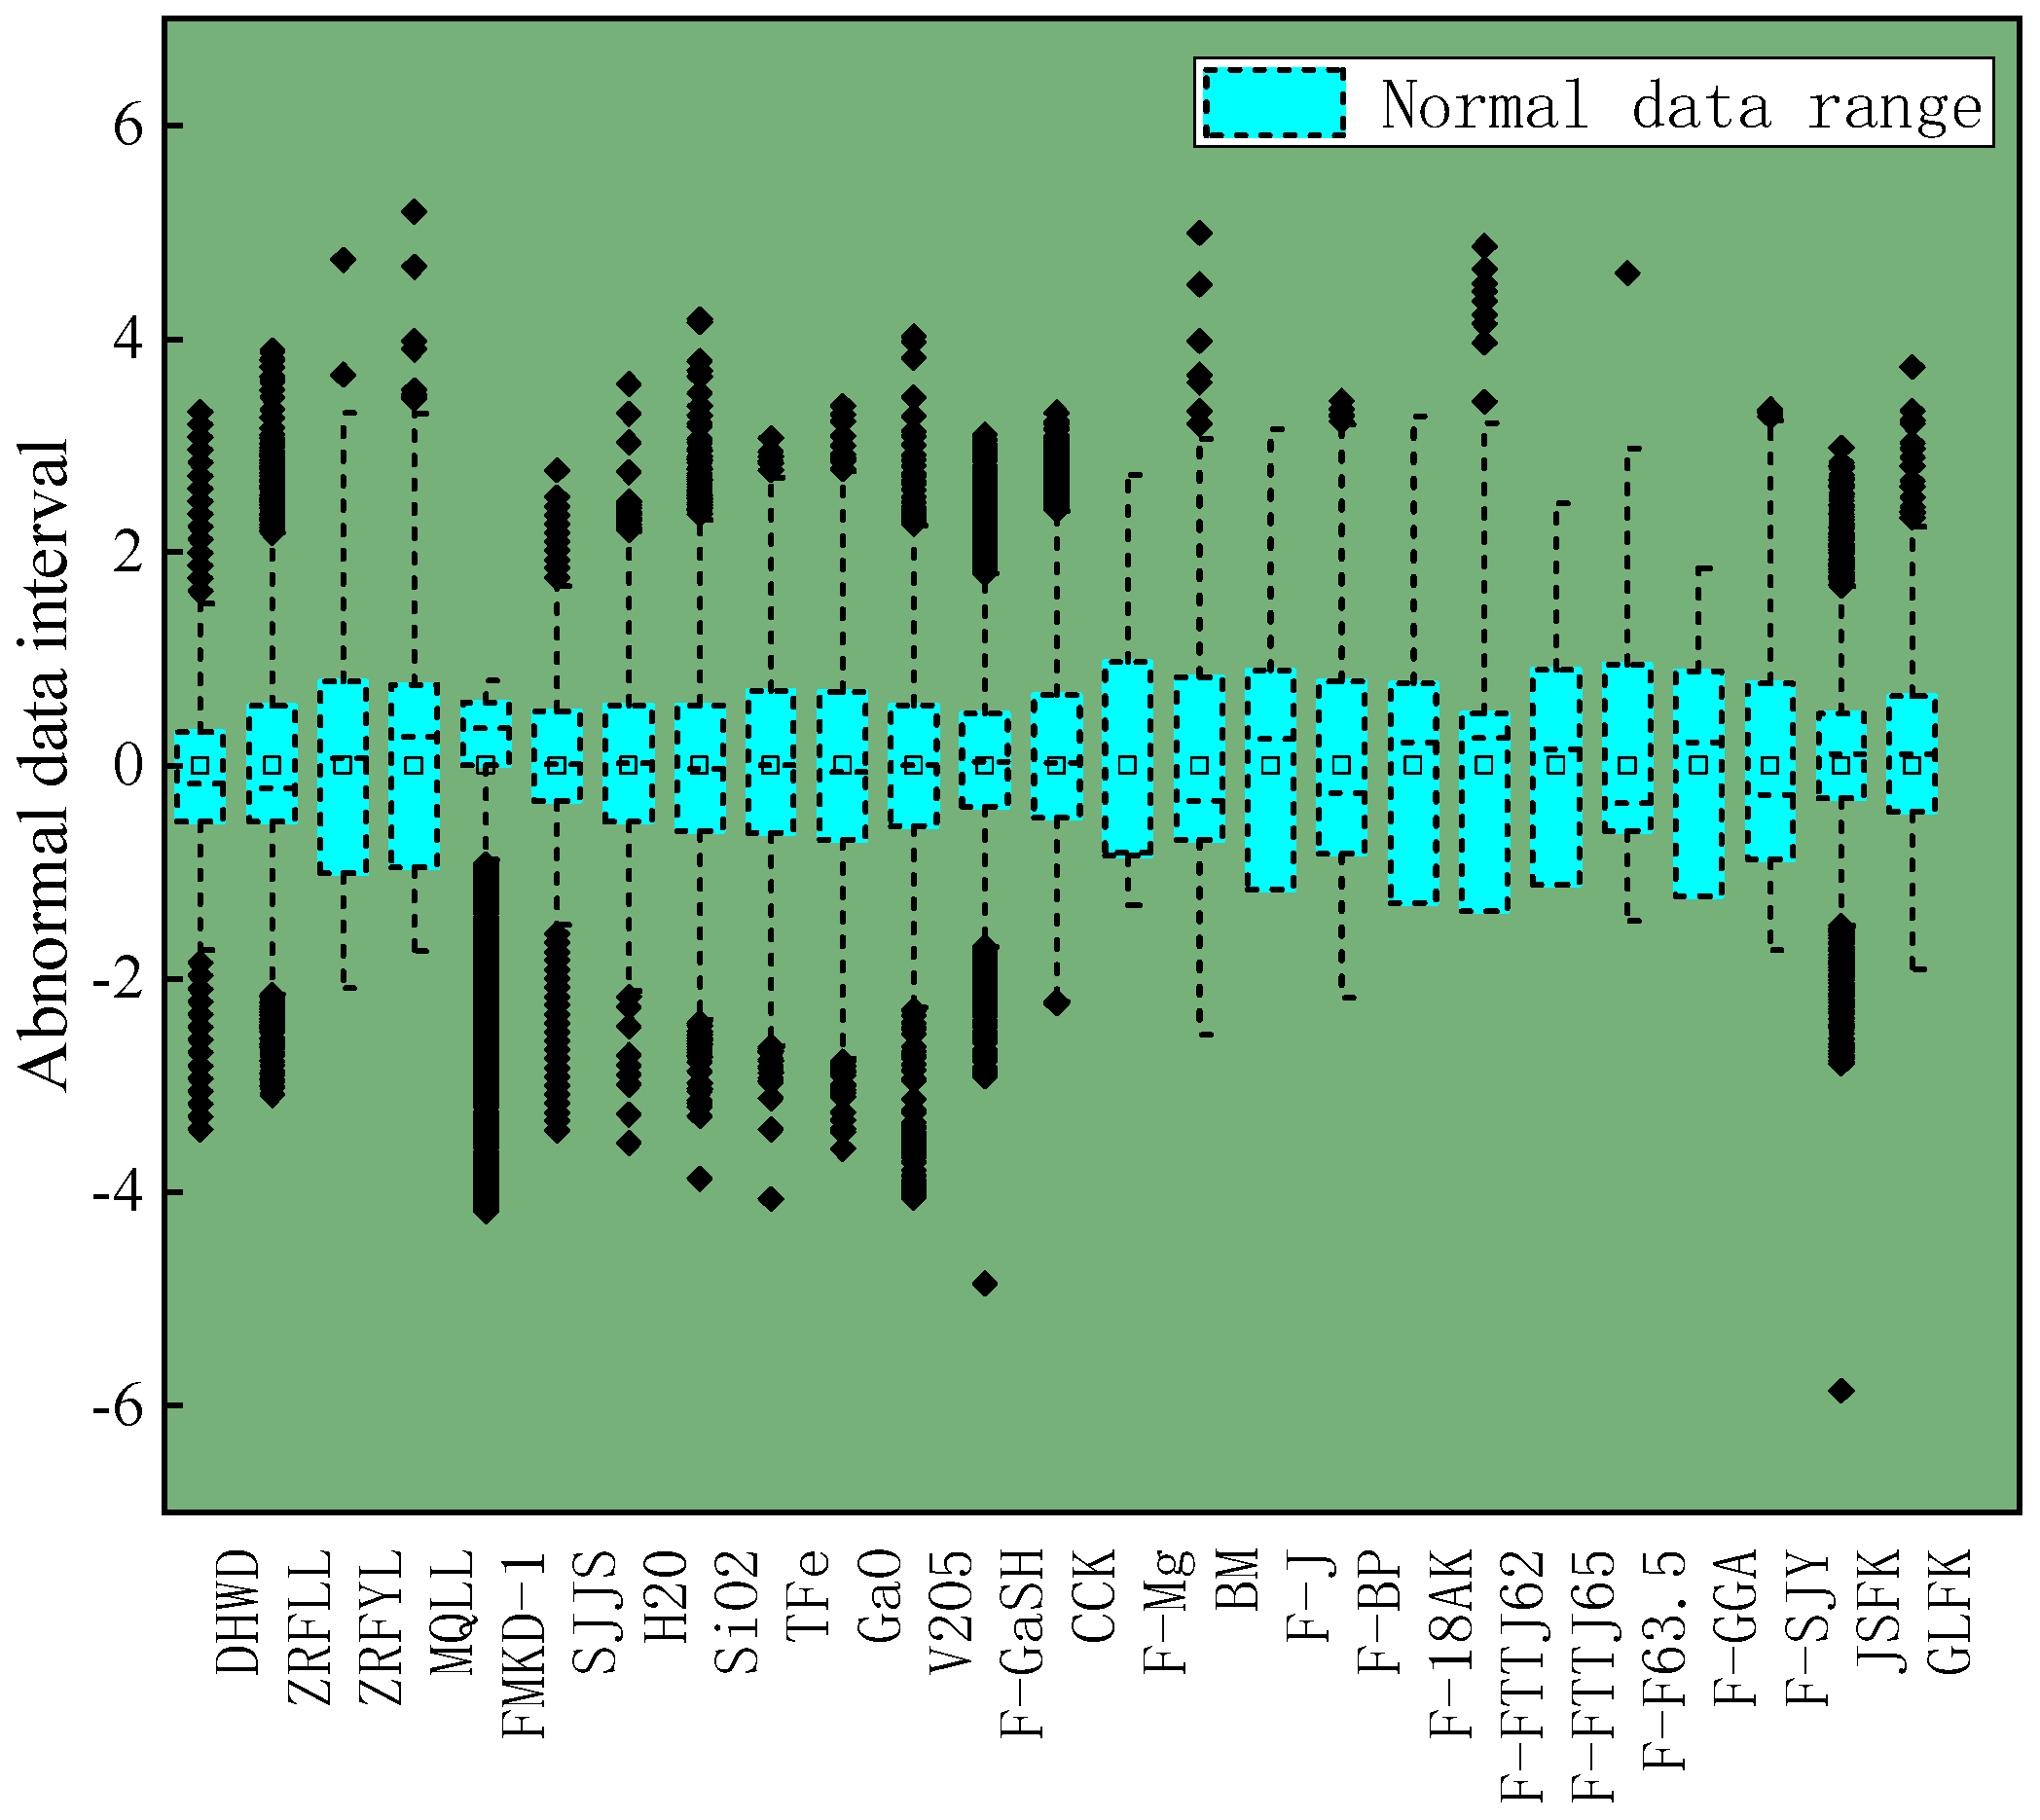
2.2.1. Abnormal Data Processing

The relative size of the missing value capacity of the data is related to the historical period of subsequent data utilization, so the percentage of missing data is determined by the total amount of data for subsequent analysis. Separate treatment is required according to different missing categories.

Missing Data Values

The relative size of the missing value capacity of the data is related to the historical period of subsequent data utilization, so the percentage of missing data is determined by the total amount of data for subsequent analysis. Separate treatment is carried out according to different missing categories.
First, the missing proportion of all the data is counted, and the feature parameters with a missing proportion greater than 50% are directly deleted.
Second, the device generates class data divided into short-term deletion and long-term deletion according to the length of the deletion time. The short-term deletion state is defined as the missing data in the interval of 1 to 8 h, which is filled by linear interpolation and multiple regression. The multiple regression method uses the Pearson correlation method to find the top n feature parameters with high correlation with the target feature (n is an artificially set critical value, set to the value of 5 in this study). The Pearson correlation coefficient is calculated as follows.
r = i = 1 n x i x ¯ y i y ¯ i = 1 n x i x ¯ 2 i = 1 n y i y ¯ 2
In the formula:
r —Pearson correlation coefficient;
x i and y i —two characteristic parameters;
x ¯ and y ¯ —the mean of the two characteristic parameters, respectively.
The value range of r is [–1, 1], and the larger the absolute value, the stronger the linear correlation between the feature parameters. Using the non-missing data information, the linear relationship between the target feature and all related variables is obtained through the multiple linear regression equation to fill in the short-term missing values of the target feature.
Quality-inspection data mainly include physical and chemical testing data of raw materials, fuels, and finished products in the BF production process. Because the distribution of such data has corresponding periodicity (the fluctuation range is limited in a period of time), the principle of proximity is adopted to fill the data with real values.

Data Noise Value

The data are screened using the box plot method. This method has better resistance for screening abnormal data by depicting the discrete distribution state of the data. The edges of the box plot are defined as follows.
Upper   limit = Q 3 + 1.5 I Q R
Lower   limit = Q 1 1.5 I Q R
I Q R = Q 3 Q 1
In the formula:
Q 1 . and Q 3 —the first and third quartiles of the dataset, respectively;
I Q R . —the interquartile distance, which represents the distance between the upper quartile and the lower quartile.
The intervals in the upper and lower limits belong to the normal data areas, and all data beyond the upper and lower limits are deleted if there is no special demand. The results of the box plot calculation for some parameters are shown in Figure 1. The distribution state of different parameters is different, and the outlier range of parameters is slightly different according to the actual production characteristics.

Data Standardization

The sintering production process contains a variety of data parameters, the dimensional units between different data parameters vary greatly, and different dimensional and dimensional units will adversely affect the results of data analysis. The minimum and maximum values in the actual production data are not all values with practical effects, and to eliminate the influence of dimensions between parameters, the data are standardized using the Z-Score. The logic of Z-Score normalization is to normalize the original value x i of the covariate a to the target value y i so that it conforms to the standard normal distribution. The Z-Score expression is as follows.
y i = x i μ / σ
u = 1 n 1 n x i
σ = 1 n 1 i = 1 n ( x i x ¯ ) 2
The raw sintering production data, after the above-mentioned missing value processing, outlier processing, and normalization, are used for the data preprocessing of BF production data and can obtain the initial feature dataset suitable for data analysis and model prediction.

2.2.2. Data Frequency Unification

Since the second-level and minute-level data in the sintering production process are not much more useful for analyzing the prediction of sintering parameters than the hourly level, and to facilitate the later data processing and analysis and reduce the pressure on the model calculation, the frequency of data (characteristic parameters and target parameters) collation was set as an hourly frequency in this study. The recording of equipment information was characterized by storing equipment signal data at a frequency of seconds based on the PLC control system. As required, the frequency of the data needs to be reduced to the hourly level. This approach averages the data within the whole hourly interval, which smooths the data overall while reducing the data volume. The record of sintering feeding information is determined by the number of fabrics, and the amount of sintering feeding in the hours is accumulated to obtain the feeding information with a uniform frequency. The quality-inspection data mainly include the physical and chemical information of raw materials and fuels in the sintering production process, and the frequency of recording is 2–4 times for each shift. The time of entering into the data system is not fixed, and the method of processing the whole hourly frequency involves updating the data according to the data entry time; that is, the latest data are determined as the next hourly value.
According to the above processing method, all sintering data points are sorted using Python tools to obtain hour-level frequency production datasets.

2.2.3. Data Derivation

In the daily production process of sintering, a large number of processed derivative data are required to guide production, by including the vertical sintering speed and air permeability index. Although some derived data exist in the database records, they are all recorded by field staff after manual calculation based on transient data, with poor quality and irregular frequency, which cannot guarantee the needs of data analysis. The hour-level derivative characteristic parameters are established by using the real-time sintering data and sintering ironmaking metallurgical theory to facilitate subsequent data analysis and application.

2.3. Feature Selection

Feature selection involves selecting an optimal subset from a raw data feature space, which can improve practicability, stability, and accuracy. The filtered mode is independent of subsequent learners, and the dataset is filtered before training the learner. In this study, the correlation and causality of the data were used to analyze the influencing factors of sinter quality to screen the characteristic parameters of the predictive model.
For correlation analysis, Pearson’s coefficient was utilized as a measure of the linear correlation between two parameters, and Spearman’s coefficient was utilized as a measure of the nonlinear correlation between two parameters.
X and Y are two sets of independent and identically distributed data, the number of its elements is N , and the two sets of random variables taken in the i ( 1 i N ) values are X i , Y i . By sorting X and Y simultaneously in descending or ascending order, two sets of elemental rows, x and y, are obtained, where elements x i and y i are the rows of X i in X and the rows of Y i in Y , respectively. The differences between the corresponding elements in the set x , y form the ranked difference set d, where d i = x i y i , ( 1 i N ). The Spearman correlation coefficient between X and Y can be calculated from x , y , or d . r s is calculated as shown below.
r s = i = 1 N ( x i x ¯ ) ( y i y ¯ ) i = 1 N ( x i x ¯ ) 2 i = 1 N ( y i y ¯ ) 2
The Spearman’s correlation coefficient takes values in the range of [−1, 1], and the larger the absolute value of r s , the stronger the correlation. When the Spearman correlation coefficient r s > 0, the two groups of variables under discussion are considered to have a positive correlation. When the Spearman correlation coefficient r s < 0, the two groups of variables under discussion are considered to have a negative correlation.
For causal analysis, Granger causal analysis was used to analyze the sinter quality parameters. The Granger causality test is used to test whether one set of time series is the cause of another set of time series. If A is said to be the Granger cause of B , it means that the change in A is one of the causes of the change in B .
If the prediction of variable Y is better than the prediction of Y using the past information of Y alone, i.e., variable X helps to explain the future change in variable Y , then variable X is considered to be the Granger cause of variable Y . Sintering production is a process of continuous production, and its production parameters are characterized by nonlinearity, coupling, and time lag, which meet the conditions of the Granger causality test. It is worth noting that the conclusion that the Granger causality test does not hold does not mean that there is no causal relationship between X and Y . Therefore, if the same parameter is selected by these multiple methods, it is more likely to have a good interpretation. The steps of Granger’s causality test are as follows [16,17].
(1)
Regress the current y on all lags of y and whatever other variables (if such a variable exists), i.e., y on the lags of y t 1 , y t 2 ,..., y t q and other variables, but do not include the lag x in this regression, which is a constrained regression. This regression then yields the constrained residual sum of squares RSSR.
(2)
Completing a regression with a lag term x , i.e., adding the lag term x to the previous regression equation, is an unconstrained regression, from which the regression yields the unconstrained residual sum of squares RSSUR.
(3)
The null hypothesis is that H0: α 1 = α 2 = … = α q = 0, i.e., the lag term x is not part of this regression.
(4)
To test this hypothesis, an F-test was used.
F = ( R S S R R S S U R ) / q R S S U R / ( n k )
This test follows an F-distribution with degrees of freedom q and ( n k ) . n is the sample size; q is equal to the number of lagged terms x , i.e., the number of parameters to be estimated in the regression equation with constraints; and k is the number of parameters to be estimated in the unconstrained regression.
(5)
The null hypothesis is rejected if the critical F α value of F-value speculation is calculated at the selected level of significance α , such that the lagged x term belongs to this regression, indicating that x is the cause of y .
The above three commonly selected parameters are used as input parameters to satisfy the necessity of multi-angle relationship analysis while adding some manual empirical data.

2.4. Model Principle
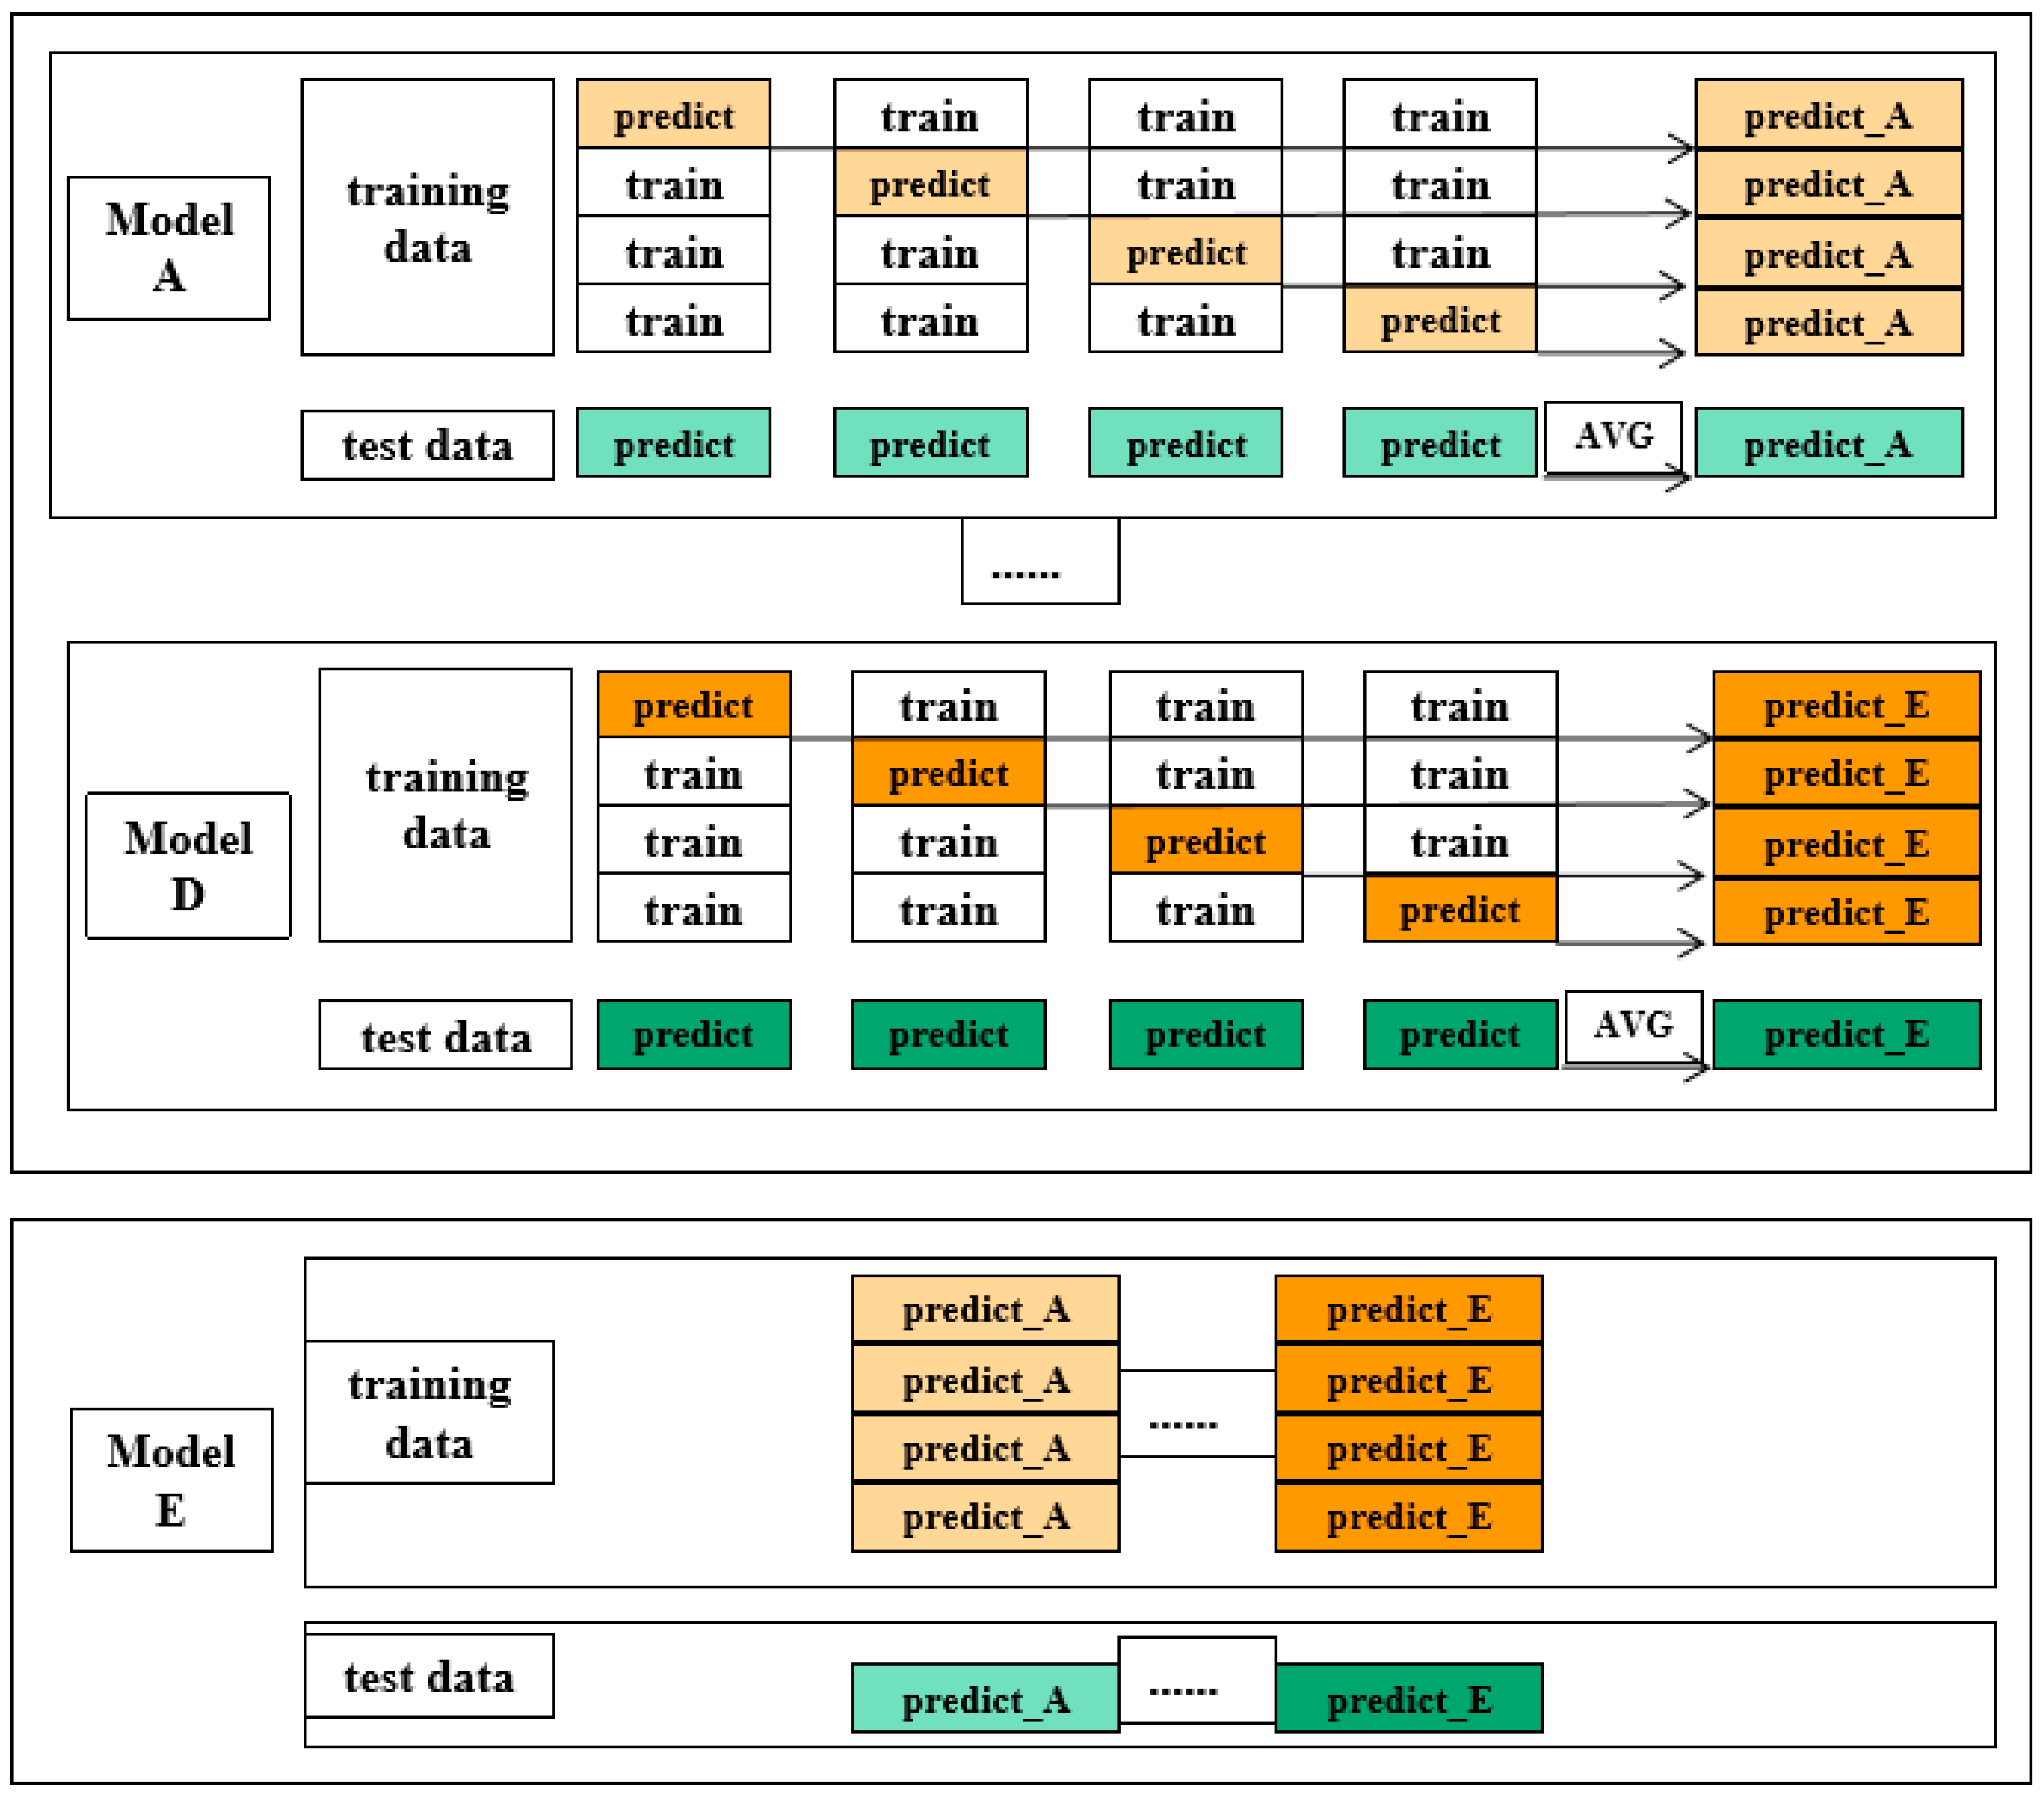
The sintering production process is complex, and the feature-selection results are selected based on multiple methods, so it is unknown which method is more efficient for model prediction. Additionally, in the data-mining process, the generalization of a single model is often weak, while the model fusion method can combine the advantages of multiple models and improve prediction accuracy. Therefore, we selected multiple base models to make preliminary predictions of the selected parameters and used the stacking learning method as the combination strategy of the base model to make a secondary prediction of the prediction results of the previous stage and obtain the optimal prediction results. In this study, support vector machines, random forests, GBDT, and neural networks were selected as the base models as the first layer learners. A linear regression algorithm was used as the second layer learner. To illustrate the superiority of stacking models, this paper used support vector machines, random forests, GBDT, and neural networks as control models to compare the prediction results of the above single models and integrated models for validation.
As a stacking model that relies on the results of multiple base models, the stacking model generally outperforms a single strong model [18,19]. The main principles are shown in Figure 2.
(1)
Divide the training set data into five parts; each part should include a validation set and a test set. Use one as the validation set and the rest as the training set.
(2)
Iterating through the five base models proposed will produce one prediction for each part of the test set; each sample will produce five prediction results, and the average of the five results can be taken. The prediction results of each model on the training set can be combined as the new features of the next layer.
(3)
The learning model can fit the dataset after combining new features and target parameters, and the learned model can be used for prediction tests to obtain the best results.

3. Model Building

3.1. Sintering State Division

The sintering process detection parameter data can be regarded as containing only a certain data point, so the problem of dividing and identifying the sintering state is the classification of data points. On short time scales, only using the value of BTP as the basis for the condition classification will omit some important information. Therefore, the burning through temperature (BTT) is used as a supplementary parameter to participate in the division of the sintering state. The BTT is the highest point temperature of the fitted curve for different airbox exhaust gas temperatures. As the mixture is completely burned through, it brings a significant amount of heat to the exhaust gas, leading to an increase in the exhaust gas temperature of the blast box. Then, the level of the maximum temperature (BTT) generated when the mixture is burned through can also reflect the sintering process’s working condition. In normal working conditions, the BTP is in the desired range, and the BTT is greater than the expected threshold. In the underburning condition, the BTP is greater than the desired upper bound, or the BTT is less than the desired threshold. Under the overburning condition, the BTP is less than the expected lower bound, and the BTT is greater than the expected threshold. Considering the BTP as an important factor affecting the sinter quality, a method for predicting the sinter quality based on the BTP is proposed. The desired range of BTP is determined by the sintering machine design process and ranges from the location of the No. 20 to No. 21 bellows. The flue gas temperature threshold of BTP is determined by the production process experience and is in the range of 320 °C to 360 °C. The specific definitions of the sintering states are shown in Table 2.
Taking the drum index and TFe as examples, the distribution of the drum index in different sintering states is shown in Table 3. Taking the drum index as an example, the fine adjustment of the proportion of raw materials, the change in the working parameters of the sintering machine, and various physical and chemical reactions in the sintering process lead to differences in the quality of the sinter. In the range of parameters covered in this study, the three sintering states account for different proportions, and most of them belong to the normal sintering state. In addition, the degree of adaptation of different sinter quality parameters to the sintering state is different. By comparing the amount of data for the quality parameters in the same state, it can be seen that the transfer index is more sensitive to the change in the sintering state. Meanwhile, by analyzing the distribution ranges of sintered ore quality parameters in different sintering states, it can be seen that the distribution ranges of drum index and total iron content are in an abnormal state and far from the normal distribution range in the abnormal sintering state. Therefore, underburning and overburning can seriously affect the quality of the sintered ore. The accuracy of sinter quality prediction cannot be guaranteed due to the small number of parameters and the wide parameter distribution in the abnormal sintering condition. Therefore, the prediction of sinter quality should be kept within the range of normal data. In this study, only the sintered ore quality under normal sintering conditions is predicted.

3.2. Feature Selection Results

Take the drum index as an example, the top 10 parameters with numerical absolute value ranking were presented by Pearson correlation analysis, Spearman correlation analysis, and Granger causality analysis, as shown in Table 4. In the Granger causality test results, the smoothness test and cointegration relationship test were completed for the final selected data, which are consistent with the operation of the Granger causality test.
As seen in Table 4, there are differences in the feature parameters obtained by the three different feature selection methods, of which there are four identical parameters, accounting for 40%. Different parameters were selected by different feature-selection methods, and the parameters selected by two or more methods were used as input parameters for the prediction model. Meanwhile, as seen in the sintering mechanism analysis, the influencing factors with a strong correlation with the drum index are mainly vanadium and titanium iron concentrates, lime powder, fuel, return mines, blast volume, airbox exhaust gas temperatures, BTP, and mixed material CaO content. The characteristic importance score of the nine-roller velocity on the drum index is also relatively high, indicating that the fabric speed of the mixture on the sinter also influences the drum index. In addition, an important influence of the drum index is the amount of carbon assigned, but this is not provided in the original dataset.
The final feature-selection results for TFe and alkalinity are shown in Table 5. As can be seen in Table 5, there are differences in the input characteristic parameters when predicting different sinter quality parameters.

3.3. Evaluation Function

Model prediction effects were demonstrated using evaluation metrics, such as mean absolute error (MAE) and mean square error (MSE). Indicators are defined as shown in Equations (10) and (11).
MAE = 1 m i = 1 m y i y ^ i 2
MSE = 1 m i = 1 m y i y ^ i 2
In the above formula, m is the sample size, y i is the true value, y ^ i is the predicted value, and y ¯ i is the mean value.
MAE indicates the mean of the absolute error between the predicted and true values. MSE indicates the degree of deviation between the true and predicted values of the sample as a whole.
The following two criteria were used to evaluate the drum index forecasting model in this study: the root mean square error (RMSE) and the coefficient of determination (R2). The evaluation methods are Equation (12) and Equation (13), respectively.
RMSE = 1 m i = 1 m y i y ^ i 2
R 2 = 1 - i y i - y ^ i 2 i y ¯ i - y ^ i 2
RMSE indicates the deviation between the predicted and true values. The smaller its value is, the better the fit is. The R2 coefficient indicates the quotient of the sum of squared residuals and the total sum of squares subtracted from 1. The range of values is [0, 1], and the larger the R2, the better the model fit.

4. Prediction Model Results

Clean input datasets were obtained using the above data preprocessing methods and feature-selection methods. The input datasets were arranged in chronological order, and the top 90% of the data for each of the three target parameters were selected as the training set for model optimization and training, while the remaining 10% of the data was used as the test set for model prediction result analysis. The prediction model for different sinter quality parameters was based on the stacking algorithm. The optimal combination of hyperparameters adapted to different prediction models was determined by grid search and five-fold cross-validation, then each prediction model was adjusted to the optimal state, and RMSE was applied to optimize the loss function. The predicted results for the three different sinter quality parameters are shown in Figure 3. As can be seen in Figure 3, an accurate prediction of sinter quality parameters can be achieved using the stacking algorithm. The prediction error of TFe is distributed within ±1.5, the prediction error of alkalinity is distributed within ±0.15, and the prediction error of drum index is distributed within ±0.6. The error range of each parameter can meet the actual production requirements. At the same time, the prediction error distribution of different parameters shows that the prediction error of TFe is higher than that of alkalinity and the drum index, which is mainly due to the influence of the production environment during the production of sintered ore. The fluctuation range of TFe of sintered ore is relatively large, resulting in a slightly larger error distribution of the model than the other two parameters, but it can still meet the practical needs of guiding sinter production.
To further validate the superiority of the stacking integrated model, different prediction models were developed for the three sinter quality parameters using the base learner as a control group. The evaluation parameters of each model are shown in Table 6. The R2 of the Stacking model is much higher than that of the other models. Although the modeling time for the Stacking model is slightly longer than the other models, it is acceptable because it is a stacked model. Therefore, using the Stacking model achieves better performance than other models and can be used as an online sinter ore quality prediction model.

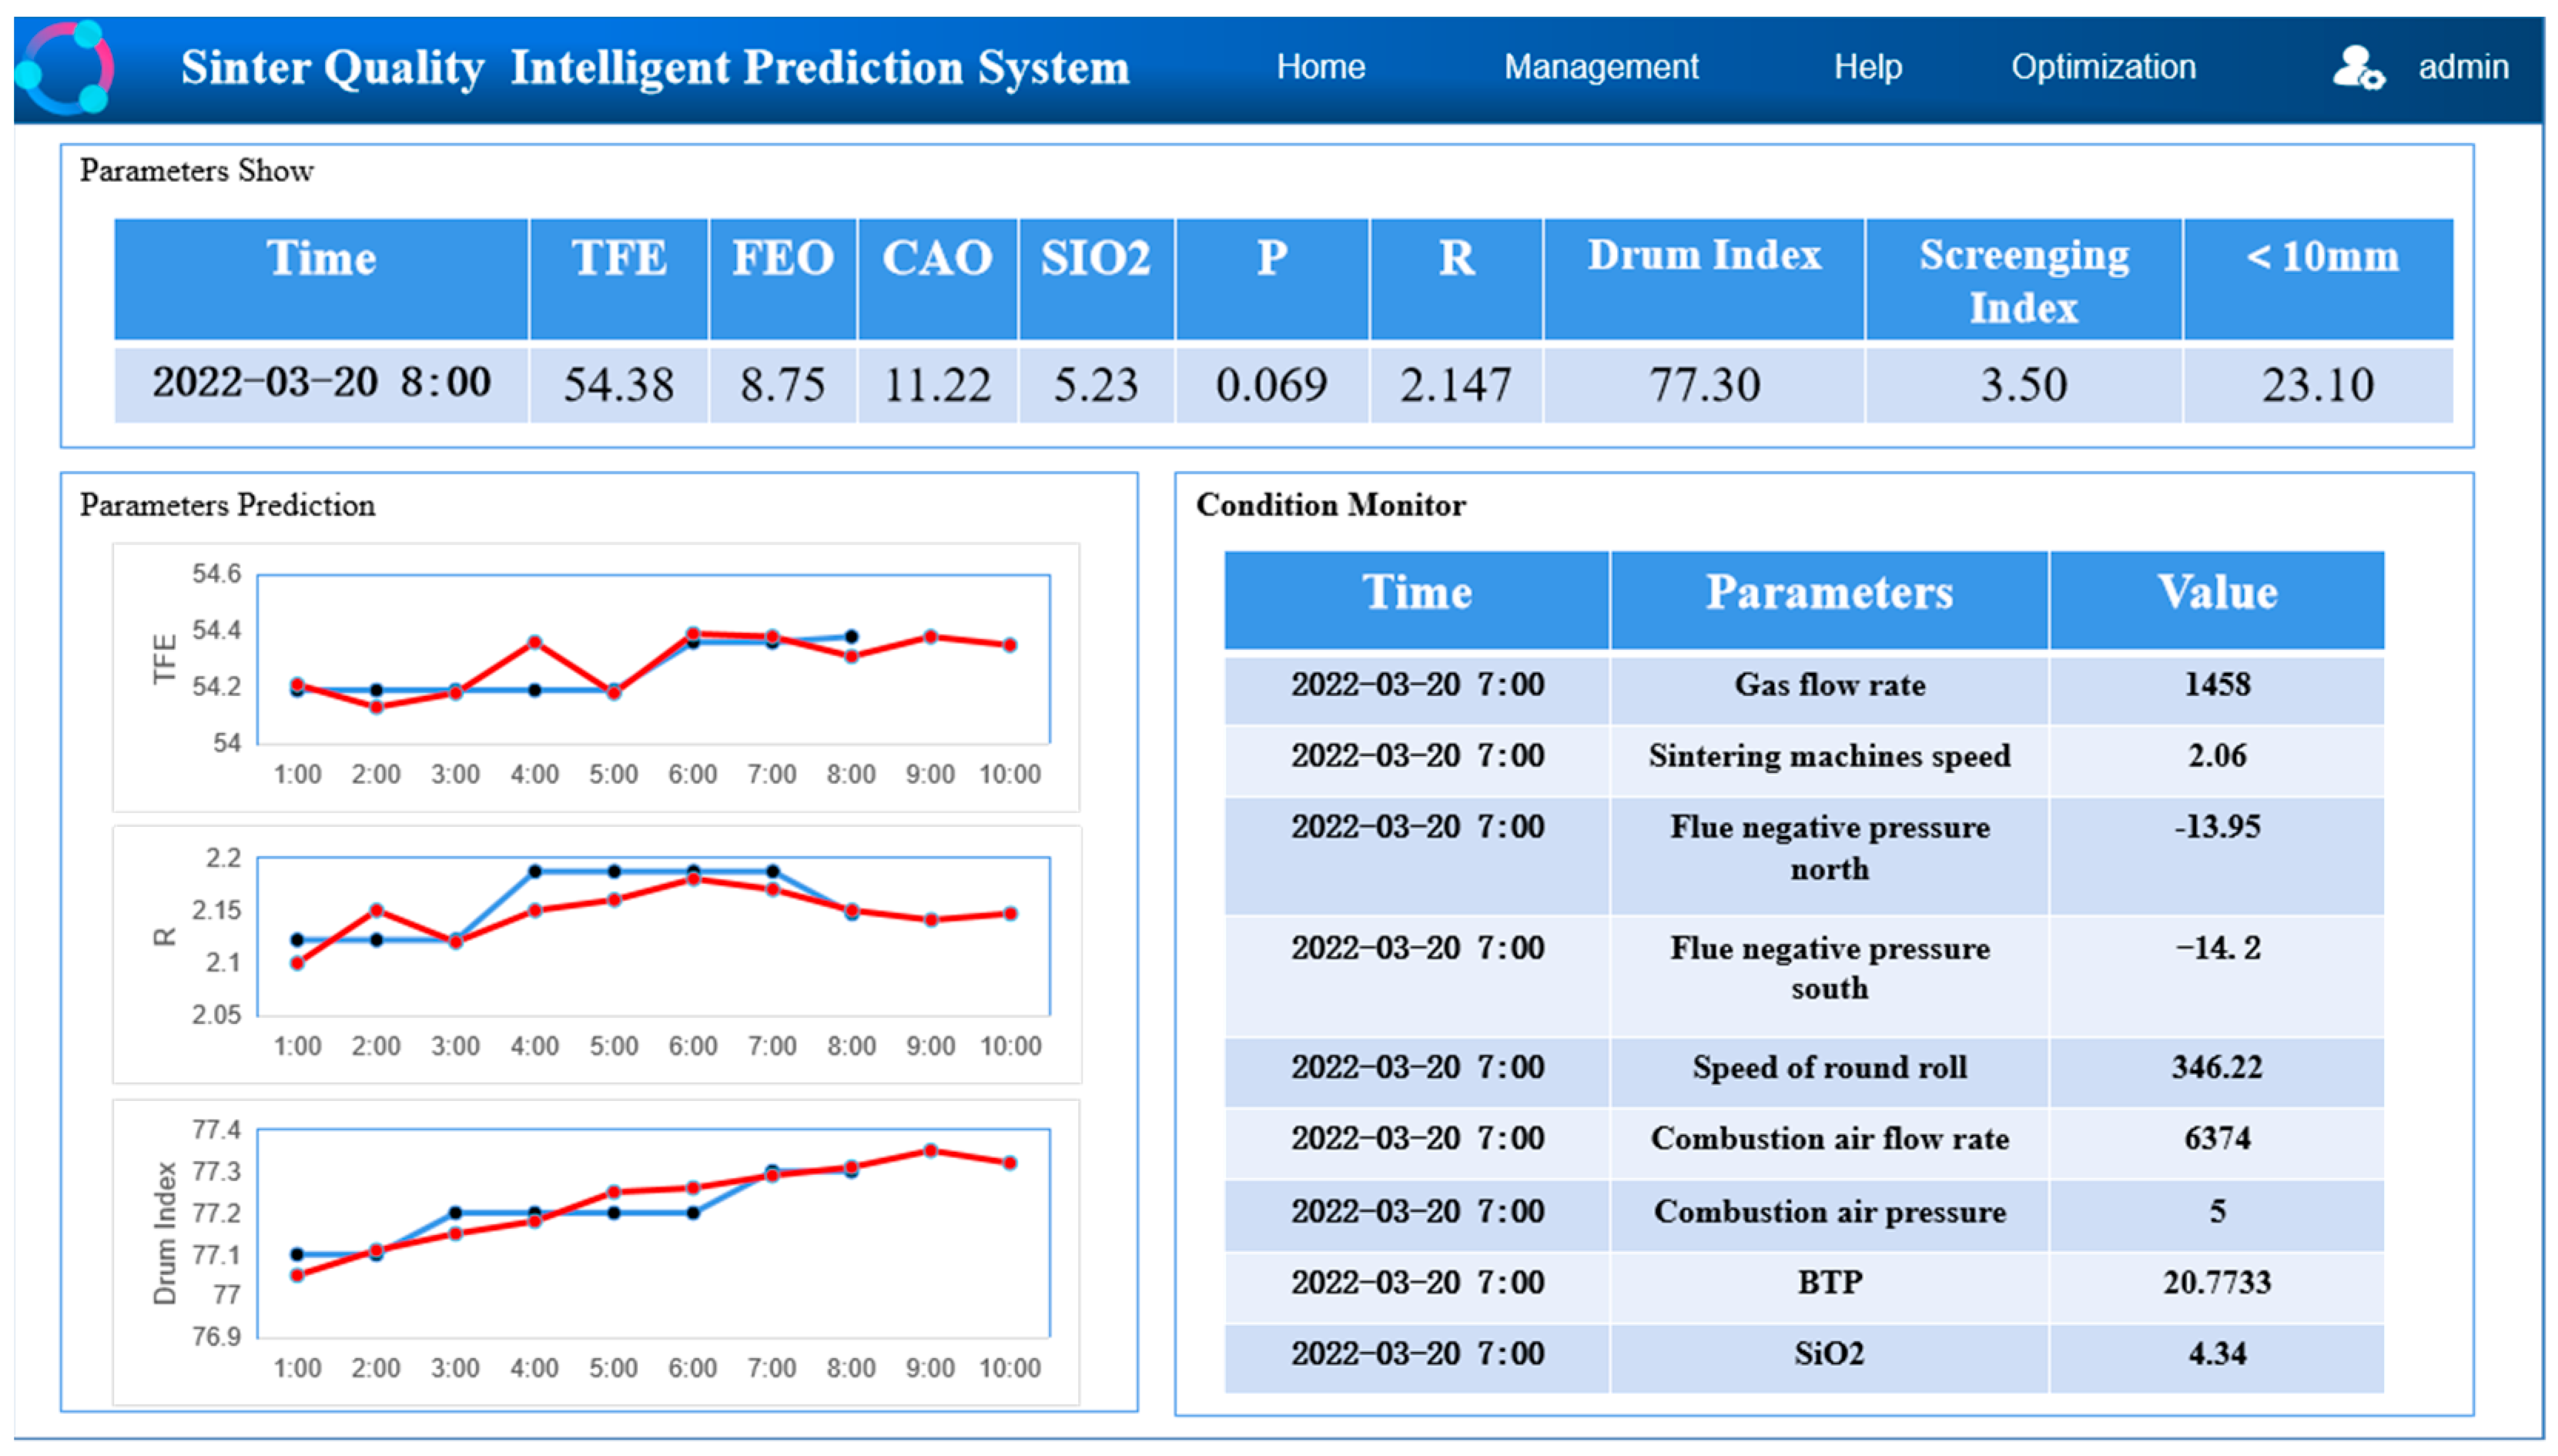
5. Sinter Quality Prediction System Implementation

The sinter quality prediction system mainly relies on a Linux server, Webstorm2021, Xshell7, and other software as the development environment, and its establishment can mainly be divided into the following steps.
(1)
Front-end design. The front-end page was developed using the react open-source framework released by Facebook, which helps to create an interactive UI. During the development phase, the framework supports many developers in receiving adequate technical support, and the design process components can be reused. Once the design is complete, if a panel needs to be added or deleted, it can be easily modified in a widget and indexed simply. The framework has sufficient superiority both from the design and maintenance points of view.
(2)
Back-end design. The back end is developed using an Express framework based on the Node platform. Using Express greatly reduces the number of code functions, and the logic is more concise, improving development efficiency and reducing engineering maintenance costs. The development process registers routes with web pages to provide path requests to different modules, avoiding the massive path problem. In addition, middleware modules developed for specific routes can be reused, solving the problem of interleaved references to complex logic. In front- and back-end interaction, we can combine redux to globally control the state in react and use ajax to read data from the server and store data in the action of redux
(3)
Database design. The database is MYSQL, where multiple tables, such as user tables, are connected by foreign keys, and suitable indexes are also created within the tables to speed up the table query process.
(4)
Deployment. The project is deployed on a Linux server; the front-end is deployed through the nginx proxy server while being able to ensure load balancing. The back end is deployed on the server by packaging the project into a jar package, so the front and back ends can be deployed separately.
The sinter quality prediction system built according to the above process is shown in Figure 4. The system interface mainly includes sinter quality parameter display, sinter quality index prediction, and core parameter monitoring. The parameter display function provides manual monitoring results and the timing of sinter quality. The parameter prediction function provides the predicted results of the sinter quality for the next two hours and displays the historical monitoring results and predicted results in the form of line graphs, making it easy for the operator to intuitively grasp the trend of sinter quality changes and the accuracy of prediction. The status parameter monitoring module is used to display most of the parameters of the BF ironmaking process that are of interest to the operator, such as the hot air pressure and top gas pressure. The creation of this module has greatly improved work efficiency. On the one hand, it is convenient for the field operator to view the status of each parameter in real-time. On the other hand, it enables timely adjustment of the solution strategy according to the trend of the forecast results.

6. Conclusions

To fully utilize the production data of the sintering system, deeply explore the value of the data, and guide production on time, this study combined big data and machine learning to establish an intelligent prediction system for sintered ore quality. The following conclusions were obtained.
(1)
To address the problems of different storage methods, large differences in scale levels and outliers in sintering data, data collection, extraction, integration, standardization, and outlier processing for the sintering system were completed by using a database, Excel, and Python language under the principles of close integration with the sintering process and ensuring data reliability, comprehensiveness, and timeliness. The data collection, extraction, integration, standardization, and outlier processing for the sintering system were completed by using a database, Excel, and Python language. The sintering sample set of Chenggang was constructed in a time-based and standardized format spanning 2 years.
(2)
The Pearson correlation coefficient, Spearman correlation coefficient, and Granger causality coefficient were used to analyze the correlation between the sinter ore quality and sintering process production parameters from different perspectives and realize the feature selection of the prediction model by combining the experience of sintering experts. The selected characteristic parameters are the actual data of the sintering process, including airbox exhaust gas temperatures, fuel ratio, Sintering machine speed, etc. And the selected input parameters can meet the requirements of online calculation of the prediction model.
(3)
A sinter quality prediction model was established using a stacking integrated learning algorithm, which could accurately predict the indices of TFe, R, and the drum index of sinter ore. The prediction errors of different parameters could meet the accuracy requirements for guiding production.
(4)
Based on Webstorm2021 and Xshell7 as the development environment, the sinter quality prediction system was built and tested online using the existing platform of the plant. The results showed that the operation status was stable during the test period, and the prediction results met the expected results.

Author Contributions

Conceptualization, X.L. (Xin Li) and R.L.; methodology, X.L. (Xin Li); software, X.L. (Xin Li), X.L. (Xiaojie Liu) and H.L. (Hongyang Li); validation, X.L. (Xin Li), X.L. (Xiaojie Liu), H.L. (Hongwei Li) and Z.Z.; formal analysis, X.L. (Xin Li); investigation, X.L. (Xin Li); resources, X.L. (Xin Li); data curation, X.L. (Xin Li); writing—original draft preparation, X.L. (Xin Li); writing—review and editing, X.L. (Xin Li); visualization, X.L. (Xin Li); supervision, Z.Z., Q.L. and L.W.; project administration, X.L. (Xin Li); funding acquisition, X.L. (Xin Li). All authors have read and agreed to the published version of the manuscript.

Funding

This research was funded by Hebei Basic Research Projects of Higher Education Institutions (NO. JQN2020032), National Nature Science Foundation of China (NO. 52004096), Hebei Province High-end Iron and Steel Metallurgical Joint Research Fund Project (NO. E2020209208).

Institutional Review Board Statement

Not applicable.

Informed Consent Statement

Not applicable.

Data Availability Statement

Not applicable.

Acknowledgments

Thanks to the North China University of Science and Technology for training and educating, thanks to my teacher Liu Ran for his careful guidance. And thanks to classmates in my team for their companionship.

Conflicts of Interest

The authors declare no conflict of interest.

References

  1. Zhang, J.W.; Niu, L.Q. The practical exploration and enlightenment of Shougang Group’s green and low-carbon development in the century. N. Econ. Guide 2021, 2, 41. [Google Scholar]
  2. Wu, W.N.; Lu, Q.; Wan, X.Y. Effect of base characteristics of iron ore fines on the strength of sintering drums in Chengde Steel. Iron Steel 2013, 48, 12. [Google Scholar]
  3. Kawaguchi, T.; Yoshinaga, M. Development and application of an integrate simulation model for iron ore Sintering. Ironmak. Proceeding 1987, 12, 99–106. [Google Scholar]
  4. Hamada, K.; Matoba, Y.; Murai, T.; Ueno, Y.; Sato, K. Control system of chemical composition of iron ore sinter. Trans. Iron Steel Inst. Jpn. 1986, 84, 409–419. [Google Scholar]
  5. Peng, Q.K. Simulation Model of Sinter Bed Temperature Field and Experts System of Sinter Quality Optimization; Central South University: Changsha, China, 2011. [Google Scholar]
  6. Zhao, D.K.; Wang, J.; Wang, H. Control system of quality supervision and operating guidance in sintering production based on expert system. Metall. Ind. Autom. 2004, 2, 26–29. [Google Scholar]
  7. Wang, Q.Y. Research on Prediction Model of Tumbler Strength Based on the Online Inspection of Sinter Composition; Wuhan University of Science and Technology: Wuhan, China, 2017. [Google Scholar]
  8. Wang, Q.Y.; Liu, Q. Research on online prediction of sinter quality based on Elman Neural Network. Instrum. Tech. Sens. 2017, 98–100, 104. [Google Scholar]
  9. Xin, Z.C.; Li, J.; Liu, W.X. Forecast for low temperature reduction disintegration properties of vanadium-titanium sinter based on BP Neural Network. Iron Steel Vanadium Titan. 2017, 38, 94–99. [Google Scholar]
  10. Wang, D. Application Research Based on GA-FWA in Prediction of Sintering Burning through Point; Liaoning University of Science and Technology: Anshan, China, 2019. [Google Scholar]
  11. Li, H.Y.; Li, X.; Liu, X.J.; Bu, X.; Li, H.; Lyu, Q. Prediction of blast furnace parameters using feature engineering and Stacking algorithm. Ironmak. Steelmak. 2022, 49, 283–296. [Google Scholar] [CrossRef]
  12. Chen, S.; Jin, G.; Peng, S.; Zhang, L. Anomaly Detection Method Based on Granger Causality Modeling. In Proceedings of the International Conference on Wireless and Satellite Systems, Nanjing, China, 17–18 September 2020; Springer: Cham, Switzerland, 2021; pp. 145–151. [Google Scholar]
  13. Najjar, I.R.; Sadoun, A.M.; Fathy, A.; Abdallah, A.W.; Elaziz, M.A.; Elmahdy, M. Prediction of Tribological Properties of Alumina-Coated, Silver-Reinforced Copper Nanocomposites Using Long Short-Term Model Combined with Golden Jackal Optimization. Lubricants 2022, 10, 277. [Google Scholar] [CrossRef]
  14. Sadoun, A.M.; Najjar, I.M.R.; Fathy, A.; Abd Elaziz, M.; Al-qaness, M.A.; Abdallah, A.W.; Elmahdy, M. An enhanced Dendritic Neural Algorithm to predict the wear behavior of alumina coated silver reinforced copper nanocomposites. Alex. Eng. J. 2023, 65, 809–823. [Google Scholar] [CrossRef]
  15. Sadoun, A.M.; Wagih, A.; Fathy, A.; Essa, A.R.S. Effect of tool pin side area ratio on temperature distribution in friction stir welding. Results Phys. 2019, 15, 102814. [Google Scholar] [CrossRef]
  16. Cao, Y.F. A Comment on Granger Causality Test. J. Quant. Tech. Econ. 2006, 1, 155–160. [Google Scholar]
  17. Liu, J.; Zhao, H.Y.; Liu, J.C.; Pan, L.; Wang, K. Medium-term load forecasting based on cointegration-Granger causality test and seasonal decomposition. Autom. Electr. Power Syst. 2019, 43, 73–80. [Google Scholar] [CrossRef]
  18. Cui, G.Q. Feature Selection and Regression Prediction in Complex Dataset; Shanghai Jiao Tong University: Shanghai, China, 2017. [Google Scholar]
  19. Song, J.; Wang, W.L.; Li, D. Injection molding part size prediction method based on Stacking ensemble learning. J. South China Univ. Technol. (Nat. Sci. Ed.) 2022, 50, 19–26. [Google Scholar]
Figure 1. Box diagram of some parameters of BF.
Metals 13 00419 g001
Figure 2. Stacking model flow chart.
Metals 13 00419 g002
Figure 3. Prediction results of three different sinter quality parameters. (a) TFe prediction result. (b) TFe prediction error distribution. (c) Alkalinity prediction result. (d) Alkalinity prediction error distribution. (e) Drum index forecast results. (f) Drum index prediction error distribution.
Metals 13 00419 g003aMetals 13 00419 g003b
Figure 4. Sinter quality prediction system interface function.
Metals 13 00419 g004
Table 1. Process parameters of the sintering machine.
Parameter TypeParameter NameAbbreviationsParameter NameAbbreviations
Raw material parameters63.5%Vanadium powderVP63.5Calcium lime powder/(t·h−1)GSHF
Steelmaking dust ash/(t·h−1)SDAMagnesium lime powder/(t·h−1)MSHF
Sintering return mines/(t·h−1)SRMBlast furnace return mines/(t·h−1)BFRM
Iron ore powder with vanadium_SiO2IOPV_SiO2Iron ore powder with vanadium_MgOIOPV_MgO
Mixes Composition parametersMixes_(water)/%M-H2OMixes_(FeO)/%M-FeO
Mixes_(SiO2)/%M-SiO2Mixes_(CaO)/%M-CaO
Operating parametersTrolley material thickness/mmTMTCoal gas pressure/kPaCGP
Coal gas flow/(m3·h−1)GGFIgnition temperature/°CIT
Combustion air flow/(m3·h−1)CAFCombustion air pressure/kPaCAP
No. 1Damper opening/%1DONo. 2Damper opening/%2DO
Sintering machine speed/(m·min−1)SMSRing cooler speed/(m·min−1)RCS
Exhaust gas temperature of
north bellows/°C
EGTNBNegative pressure of south pipe/kPaNPSP
No. 2Blast volume/(m3·h−1)2BVRound roll speedRRS
Status ParametersBurning through point/No.BTPBurn through temperature/°CBTT
No. 1Airbox exhaust gas temperatures/°C1AEGTNo. 2Airbox exhaust gas temperatures/°C2AEGT
No. 3Airbox exhaust gas temperatures/°C3AEGTNo. 5Airbox exhaust gas temperatures/°C5AEGT
No. 7Airbox exhaust gas temperatures/°C7AEGTNo. 22Airbox exhaust gas temperatures/°C22AEGT
No. 1Air box vacuum degree/kPa1ABVDNo. 2Air box vacuum degree/kPa3ABVD
No. 3Air box vacuum degree/kPa3ABVDNo. 5Air box vacuum degree/kPa5ABVD
No. 7Air box vacuum degree/kPa7ABVDNo. 22Air box vacuum degree/kPa22ABVD
Sintered Ore Quality parametersDrum index/%DIScreening index/%SI
Particle size less than 10 mm/%PSLT10mmFe/%TFe
FeO/%FeOAlkalinityR
SiO2/%SiO2CaO/%CaO
Table 2. The specific definitions of the sintering states.
DefinitionBTPSintering TemperatureRelationship
overburningBTP < No. 20360 °C < TAND
normalNo. 20 ≤ BTP ≤ No. 21320 °C ≤ T ≤ 360 °CAND
underburningNo. 21 < BTPT < 320 °COR
Table 3. Distribution of drum index in different sintering states.
Data Volume Share of Drum IndexDrum Index
Distribution Range
TFe
Distribution Range
Overburning7.25%[75.7, 78.7][53.5, 56.5]
Normal86.30%[76.8, 77.5][54.5, 55.8]
Underburning6.45%[74.8, 78.5][54.5, 55.8]
Table 4. Results obtained by different feature selection methods.
NO.PearsonValueSpearmanValueGranger
Causality
Value
Drum
Index
1Screening index−0.437Screening
index
−0.500Blast volume0.621
2No. 1Air box
vacuum degree
+0.2871Air box vacuum degree+0.344No. 5Air box vacuum degree0.589
3CaO+0.279Particle size less than 10 mm−0.323Titanium iron concentrates0.531
4BTP−0.270Sintering
return mines
+0.287No. 1Damper opening0.498
5Magnesium lime powder−0.270No. 5Air box vacuum degree−0.278Vanadium titanium iron powder0.456
6Mixed material
CaO content
+0.255No. 11Air box vacuum degree−0.278BTP0.448
7No. 5Air box
vacuum degree
−0.254Titanium iron concentrates+0.278Sintering
return mines
0.431
8No. 3Air box
vacuum degree
+0.243BTP−0.266Screening index0.402
9lime powder+0.243Mixed material CaO content−0.265Lime powder0.387
10Particle size less than 10 mm−0.225No. 2Damper opening0.243Mixed material CaO content0.377
Table 5. Final feature selection results for TFe and alkalinity.
TFeAlkalinity
1Mixes_(SiO2)7Mixed material SiO2 content1Trolley material thickness7Water addition rate of second mix
2Mixes_(CaO)8Fuel ratio2Sintering
machine speed
8FeO
3Mixes_(MgO)9No. 2Damper opening3Water addition rate of first mix9CaO
4Mixes_(Al2O3)10Ring cooler speed4Mixture
temperature
10Coal powder
proportion
5Percentage of returned mine11Blast volume5Mixed material SiO2 content11BTP
6BTP12Moisture rate6Mixed material CaO content12Blast volume
Table 6. Evaluation results of prediction models for three sinter quality parameters.
Sinter Quality ParametersEvaluation IndicatorsSVMRandom
Forest
GBDTNeural NetworkStacking
TFeMSE0.3320.0750.3680.0680.038
RMSE0.5760.2740.6070.2610.195
MAE0.4470.1770.4700.1680.058
R20.4980.8270.4430.8270.942
Test time/s13.86620.14528.5088.38735.138
AlkalinityMSE0.0030.0020.0030.0020.001
RMSE0.0520.0470.0590.0300.010
MAE0.0460.0320.0350.0210.002
R20.5120.6210.4870.5830.958
Test time/s2.2215.0951.4450.1546.081
Drum indexMSE0.1700.0070.0650.0120.003
RMSE0.4120.0840.2550.0950.054
MAE0.2770.0310.1980.0450.005
R20.2680.8700.7200.8210.987
Test time/s16.96914.3265.0776.01634.441
Disclaimer/Publisher’s Note: The statements, opinions and data contained in all publications are solely those of the individual author(s) and contributor(s) and not of MDPI and/or the editor(s). MDPI and/or the editor(s) disclaim responsibility for any injury to people or property resulting from any ideas, methods, instructions or products referred to in the content.

