Article

Binary Aluminum Alloys from 1-ethyl-3-methylimidazolium-based Ionic Liquids for Cathodic Corrosion Protection

Electrochemistry and Electroplating Group, Department of Electrical Engineering and Information Technology, Technische Universität Ilmenau, Gustav-Kirchhoff-Str. 6, 98693 Ilmenau, Germany
*
Author to whom correspondence should be addressed.
Metals 2023, 13(2), 377; https://doi.org/10.3390/met13020377
Submission received: 8 January 2023 / Revised: 3 February 2023 / Accepted: 9 February 2023 / Published: 13 February 2023

Abstract

:
Aluminum cannot provide continuous cathodic corrosion protection under ambient conditions due to the formation of an insulating oxide layer and therefore it should be alloyed. Binary aluminum alloys with Cr, Zn and Sn from AlCl3/1-ethyl-3-methylimidazolium chloride ([EMIm]Cl) containing CrCl2, ZnCl2 or SnCl2 have been deposited and their morphology and composition were investigated using SEM/EDS. The corrosion behavior of alloys with 2–4 wt% Cr, Zn or Sn was investigated using potentiodynamic polarization in 3.5 wt% NaCl solution, neutral salt spray test (NSS) and environmental exposure (EE). Pure aluminum provides excellent corrosion protection of steel in a chloride-containing environment, but not under ambient conditions. AlCr alloys show poor corrosion protection while AlZn alloys provide excellent corrosion protection in the NSS test and superior cathodic protection in the EE test compared to aluminum. AlSn alloys are highly active at even low tin contents and dissolve rapidly in chloride-containing electrolytes. However, a slightly improved cathodic protection in the EE test compared to pure aluminum has been observed. The results prove the necessity of alloying aluminum to achieve effective cathodic corrosion protection under mild atmospheric conditions.

1. Introduction

The electrochemical deposition of aluminum and its alloys has enormous potential for various industrial applications. Due to their low density, high thermal and electrical conductivity, good corrosion resistance and attractive appearance, these materials are nowadays widely used.
Aluminum is one of the most promising candidates for the replacement of Cd for cathodic protection of steel [1,2,3]. It offers excellent passive corrosion protection due to its effective self-passivation. However, a cathodic corrosion protection with pure aluminum is not possible [4,5]. The passivation layer, consisting of a dense, electrically non-conductive Al2O3 layer (ca. 10 nm), interrupts the local electric circuit and thus prevents a sacrificial corrosion protection. Standard methods, such as immersion tests and neutral salt spray tests, cannot reliably reflect the performance of aluminum for cathodic corrosion protection. High chloride concentrations cause the oxide layer to break down and activate the material. An apparently good cathodic protection is the result, which is not present under mild environmental conditions. The formation of the oxide layer can be hindered by alloying. Unfortunately, this also results in higher corrosion of the alloys [4]. Potentially suitable alloying elements are zinc [4,5,6,7,8], chromium [9,10,11,12] and tin [4]. Aluminum zinc alloys, AlZn [11,13,14,15], and aluminum chromium alloys, AlCr [9,10,11,12,16,17,18], have been successfully deposited from ionic liquids, ILs, and molten salts. To the best knowledge of the authors, there are no reports regarding the deposition of aluminum–tin alloys, AlSn, from ILs. Only the deposition of tin on Au, Pt, and glassy carbon from Lewis-basic and Lewis-acidic mixtures of AlCl3/1-ethyl-3-methylimidazolium chloride ([EMIm]Cl) at +350 mV to +600 mV vs. Al/Al3+ reference electrode [19] have been reported. However, the deposition AlSn from mixtures of ethylene glycole/choline chloride [20], organic solvents [21], and molten salts [17,22] was reported.
A detailed investigation of the structure and the corrosion behavior of these aluminum alloys, especially relating to cathodic corrosion protection, is still missing.
Aluminum has a rather negative standard electrode potential (−1.66 V vs. NHE [23]) and cannot be deposited from aqueous solutions. Non-aqueous electrolytes offer broad electrochemical windows (>3 V), allowing the electrochemical deposition of reactive metals, e.g., Al, Nb and Ta. The first electrochemical process for aluminum deposition on an industrial scale was the SIGAL process [24,25,26], followed by the REAL process [27,28]. Despite their successful scale-up, these processes are expensive and require special equipment as well as high maintenance efforts, because they are based on volatile and easily inflammable compounds. Furthermore, they have a rather limited potential as electrolytes for the deposition of alloys.
The deposition of metals and alloys from ILs has been intensively investigated during the last decades. ILs have been shown to be promising electrolytes for the deposition of aluminum and its alloys [29]. A low vapor pressure, non-flammability, good electrical conductivity, and high solubility for many metal salts are only some of their attractive properties [30,31,32].
The electrochemical deposition of aluminum from imidazolium-based ILs, such as mixtures of AlCl3 and 1–ethyl–3–methylimidazolium chloride, [EMIm]Cl, is only possible from Lewis-acidic electrolytes, according to (Equation (1)) [33,34,35,36].
4Al2Cl7 + 3 e → Al + 7 AlCl4
This work focuses on the deposition of binary aluminum alloys with Cr, Zn and Sn from AlCl3/[EMIm] ILs (molar ration 2:1) on low alloyed steel in order to address technical applications of corrosion protection. The effect of applied current density and bath composition on the resulting alloy composition is studied. The microstructure of the deposits, their morphology, and the corrosion behavior in 3.5% NaCl solution, in neutral salt spray test (5 wt% NaCl solution) and under environmental conditions are investigated. The results are discussed with respect to the suitability of the alloys for cathodic corrosion protection under atmospheric conditions. The discussed results will contribute as the basis for optimization of suitable alloys for cathodic corrosion protection. Therefore, this work aims to contribute to the replacement of cadmium with environmentally friendly electrodeposited aluminum alloy coatings with high performance.

2. Experimental

[EMIm]Cl (>98%, Iolitec, Germany) was dried under vacuum (<1 mbar) for 24 h at 60 °C using Schlenk technique prior to use. The water content after the drying procedure was below 30 ppm, as measured by Karl–Fischer titration. Anhydrous AlCl3 (granules, 99.9%, abcr, Germany) and anhydrous ZnCl2, SnCl2 (powder, 98%, abcr, Germany) and CrCl2 (powder, 97%, abcr, Germany) were used as received.
The electrolyte preparation and all electrochemical deposition experiments were carried out at room temperature in a purified argon atmosphere inside an OMNILAB glove box (Vacuum Atmospheres Co., USA) with both the moisture and oxygen contents < 0.5 ppm. The electrolytes were prepared by slow addition of AlCl3 to [EMIm]Cl while keeping the temperature below 80 °C. They were stirred for 24 h, to give in a slightly yellowish melt. In comparison to AlCl3 powder, granules adsorb less water due to a lower surface area and hence cause less hydrolysis while preparing the electrolyte. At the same time, the granules dissolve more slowly, resulting in a lower heat production. The molar ratio of [EMIm]Cl to AlCl3 was 1:2. This mixture is denoted as [EMIm]Al2Cl7 in the following. In order to deposit the binary aluminum alloys AlMe (Me = Cr, Zn, Sn), 10 mmol L−1 or 50 mmol L−1 of the respective metal salt were dissolved in [EMIm]Al2Cl7. The respective electrolytes are denoted as [EMIm]Al2Cl7–10Me and [EMIm]Al2Cl7–50Me (Me = Cr, Zn, Sn) in the following sections. In case of [EMIm]Al2Cl7 with CrCl2, the melt changed its color towards purple, becoming more intense with increasing amount of dissolved chromium salt. The color change can be attributed to the formation of chromium chloride species in the melt [37]. Over time, purple particles precipitated from the electrolyte. Most probably, these are CrCl3 that forms when Cr2+ ions are oxidized by oxygen traces. While CrCl3 is barely soluble in the Lewis acidic [EMIm]Al2Cl7, the solubility of CrCl2 increases with the Lewis acidity of the present IL, similar to other ILs and inorganic molten salts [9,38].
Aluminum ring anodes (material thickness 2 mm, 99.0%, Goodfellow) were used as counter electrodes (CE) and an aluminum wire of 1 mm diameter (99.999%, Alfa Aesar) introduced in a glass tube for increased mechanical stability was used as a reference electrode (RE).
The steel substrates (Table 1) were cut into pieces of (1 × 5 × 0.09) cm3 and (0.5 × 5 × 0.09) cm3, ground with SiC emery paper (500 and 1200 grit), degreased (HSO Superclean Uni–I, 100 g L−1 at 70 °C for 15 min) and pickled (1:1 HCl, 5 min, 25 °C and 10% H2SO4, 5 min, 25 °C) outside the glovebox. The samples were thoroughly rinsed with bi-distilled water after each step and in the end with ethanol and dried in air at (90 ± 5) °C for 2 h. Afterwards, the steel substrates were transferred into the glove box and electrochemically etched in [EMIm]Al2Cl7 at 1.1 V for 7 min [36]. SP 300 and VSP potentiostats/galvanostats (BioLogic, France) were used for deposition and potentiodynamic polarization experiments.
The deposition experiments were carried out at cathodic current densities of 5 to 15 mA cm−2 at 25 to 30 °C. The layer thickness was in the range of 5 to 10 µm, calculated by Faraday’s law, assuming a current efficiency of 100% [39]. After the deposition, the samples were rinsed in 1–ethyl–3–methylimidazolium bis(trifluoromethylsulfonyl)imide, [EMIm][TFSA], taken out of the glove box, and rinsed with acetone, water, and again acetone, and dried in air.
The morphology and composition were investigated with a scanning electron microscope (SEM, Hitachi S4800) with adapted energy dispersive X-ray spectroscopy (EDS).
Potentiodynamic polarization experiments were carried out in the range of ±200 mV with respect to the open circuit potential (OCP) at a scan rate of 0.1 mV s−1 in 3.5 wt% NaCl solution at ambient temperature. The corrosion potentials of the aluminum alloys were compared to the average corrosion potentials of the bare steel substrate, a commercial Cd coating and commercial aluminum sacrificial anode materials (Grillo-Werke AG, Germany), type 40Al and 60Al (Table 2). All potentials in this set of experiments are given with respect to the Ag/AgCl RE.
The neutral salt spray (NSS) test based on DIN EN ISO 9227 was carried out in a salt spray cabinet (HK 400, H. Köhler GmbH, Germany) spraying NaCl solution (5 wt%) at 35 °C for 10 min followed by a pause of 50 min. Bare steel substrates and substrates coated with Al, AlCr (≈3 wt% Cr), AlZn (≈4 wt% Zn) and AlSn (≈2 wt% Sn) were used. The deposition was performed in [EMIm]Al2Cl7–10Me (Me = Cr, Zn, Sn) at a cathodic current density of 7–8 mA cm−2 for 1 h, resulting in an average layer thickness of approximately 10 µm (calculated using Faraday’s law). The layer thickness for AlZn and AlCr alloys was confirmed by cross sections. However, this was not possible for AlSn coatings due to the high reactivity of the alloys, that corroded rapidly in contact with water during the preparation. Furthermore, the porosity of the deposited coatings could not be reliably confirmed via cross sections because the coatings are highly pliable compared to the steel substrate. Consequently, pores get filled by smearing during the preparation, which makes the layers appear compact. The edges and uncoated areas of the samples were covered with PVC varnish (Enthone Stop–Off No. 1). The progress of corrosion was monitored every 24 h by visual inspection during a break between two spraying intervals.
The environmental exposure (EE) test (based on DIN 55665) was carried out on the roof top of IMN MacroNano® building of the Technische Universität Ilmenau (50°41′03.4” N, 10°56′23.2” E), with the samples oriented toward the south and a tilt of about (15 ± 2)° in relation to the horizontal plane. The set of samples for the EE test was prepared as described for the NSS and additionally scratched 15 mm down to the substrate along the long sample side. The corrosion process was monitored by visual inspection every 24 h (for 6 weeks), twice a week (for the following 4 weeks) and once a week (the following time) from June 2019 to July 2020. The red rust coverage was determined from photographs using ImageJ/FIJI 1.46.

3. Results and Discussion

3.1. Morphology and Composition

3.1.1. AlCr Alloys

Layers containing small amounts of Cr are dull and dark gray. With increasing Cr content, the layers appear shiny (Figure 1, left). Despite a few small defects, the AlCr coatings deposited from [EMIm]Al2Cl7–10Cr have a dense, structured morphology (Figure 1a,b), causing their dull appearance. The deposits get slightly smoother with increasing current density. Deposition from [EMIm]Al2Cl7–50Cr leads to very smooth deposits (Figure 1c,d), resulting in a shiny appearance. There are grain-like particles on the surface of the deposits, as also reported by Ali et al. [10]. The Cr content in the particles, measured via EDS, is slightly higher than in the surrounding matrix. The number of particles decreases by a factor of three from approximately 0.16 µm−2 (Figure 1c) to 0.05 µm−2 (Figure 1d), while their average diameter increases by ca. 30% from ca. 0.88 µm (Figure 1c) to 1.12 µm (Figure 1d) with increasing current density. The surface area, covered by the particles, decreases by a factor of two as the Cr content decreases.
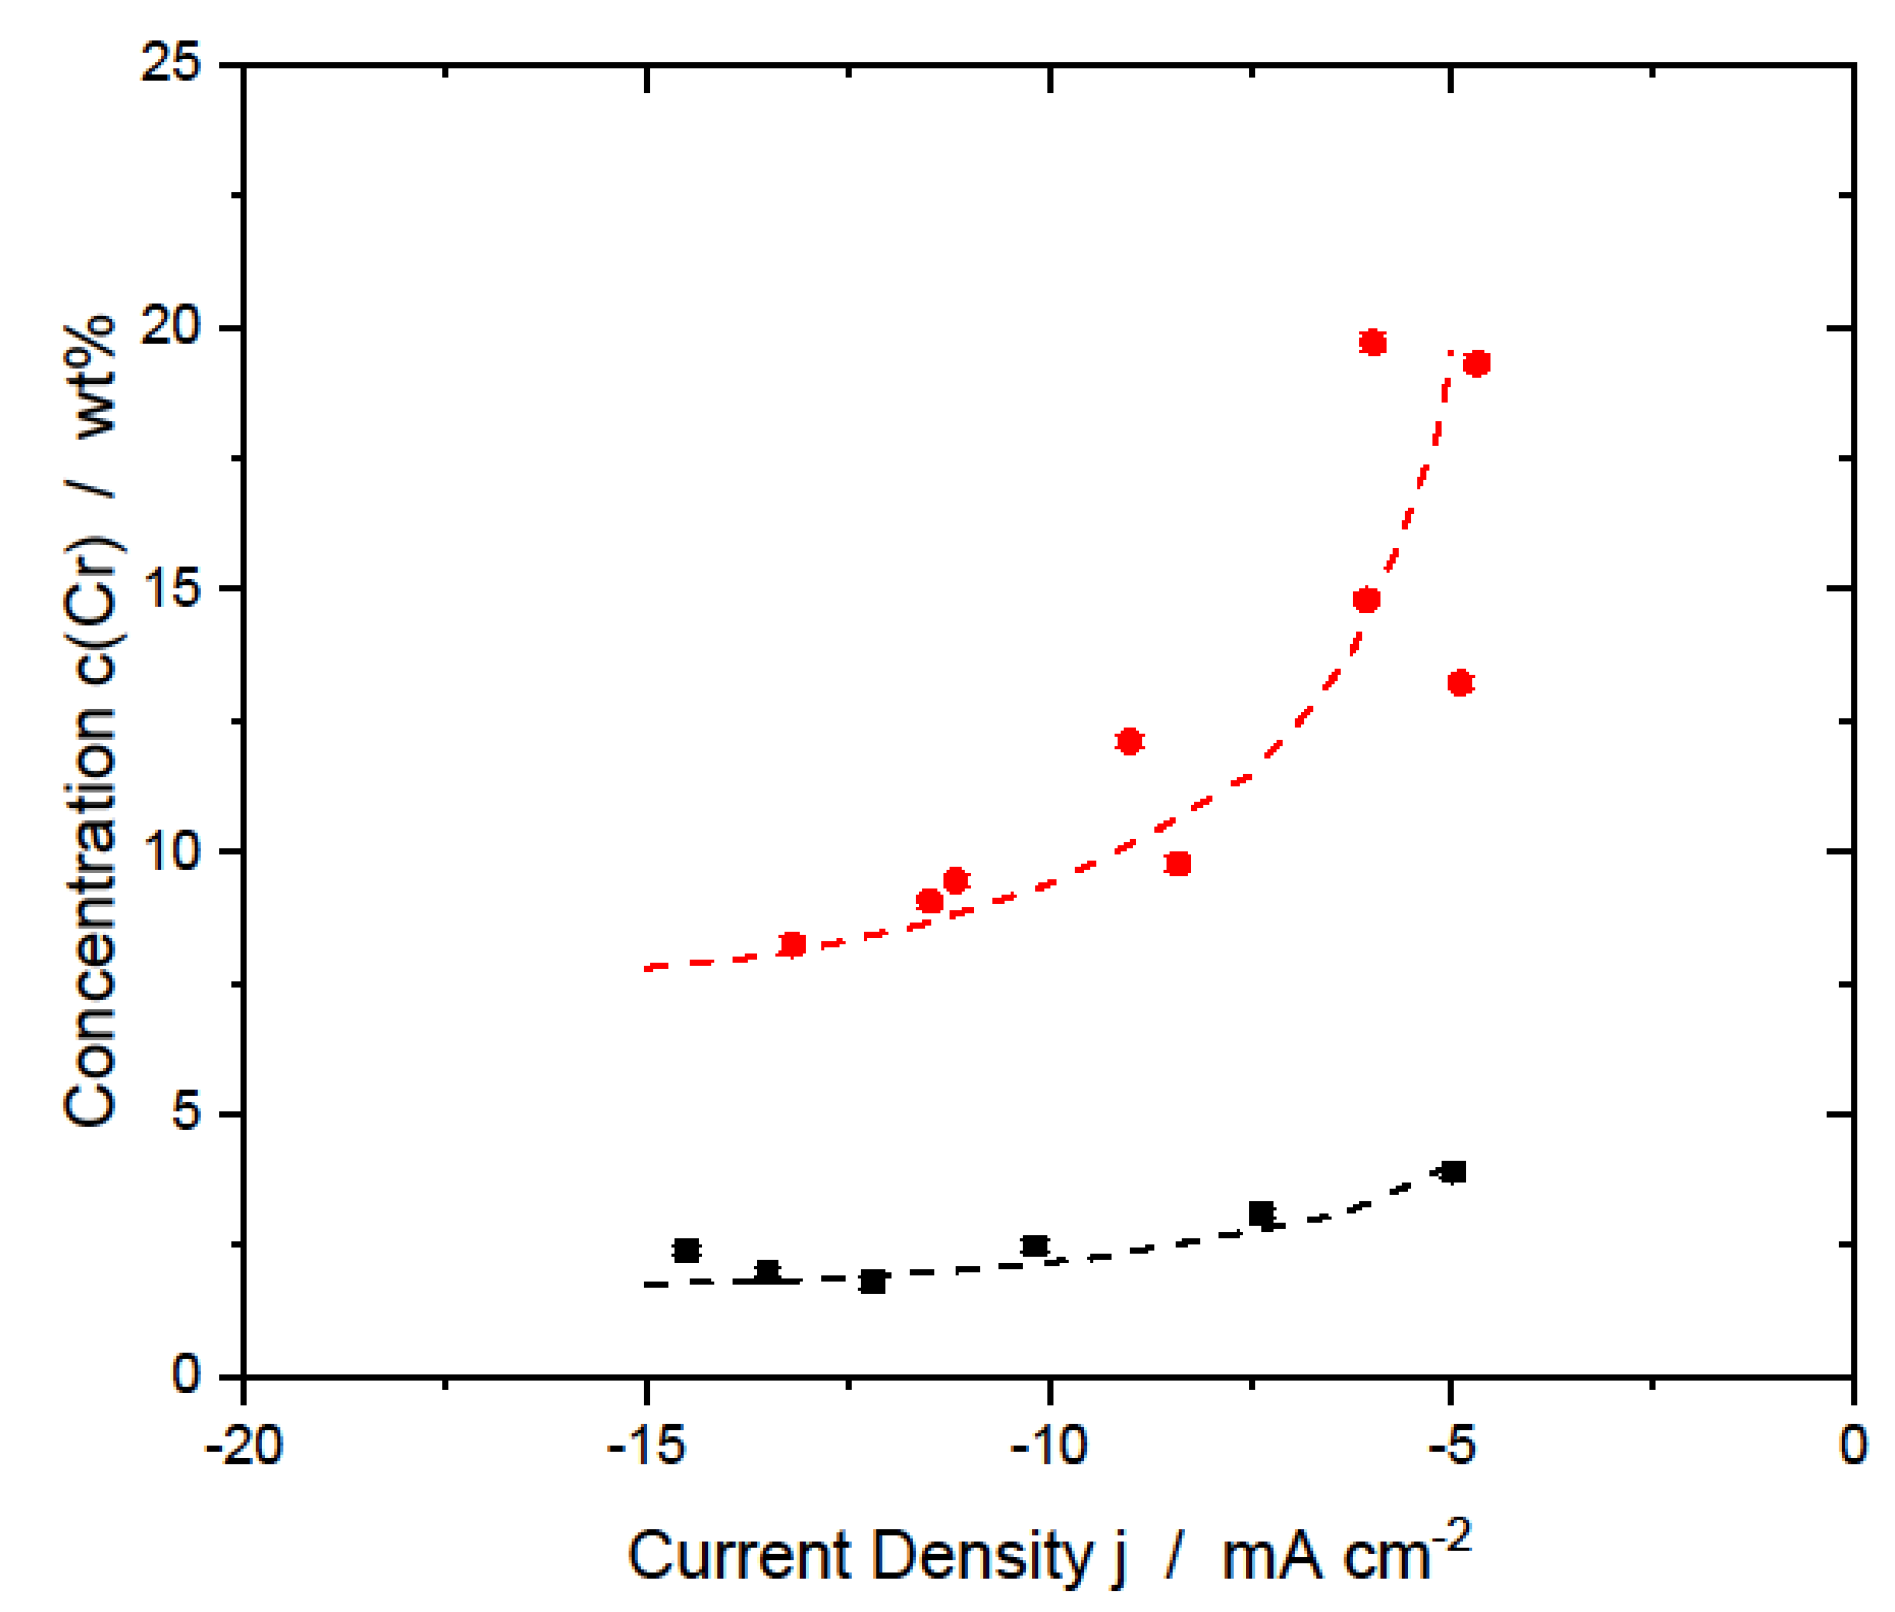
The Cr content of the layers, deposited from both [EMIm]Al2Cl7–10Cr and [EMIm]Al2Cl7–50Cr, decreases with increasing cathodic current density in the range of 5 mA cm−2 to 15 mA cm−2 (Figure 2), which is the result of the more positive standard electrode potential of Cr compared to Al. For [EMIm]Al2Cl7–50Cr, the deviation of the Cr content between two separate depositions is lower for more cathodic current densities. In the low cathodic current density range, the Cr content decreases more strongly with increasing current density than at high cathodic current densities. This effect was not observed for [EMIm]Al2Cl7–10Cr. However, it might be the result of diffusion limitation of the Cr ions and depletion of these close to the electrode surface. Similar results were reported by Moffat et al. [9]. The Cr is evenly distributed over the surface, represented by error bars that lie within the markers in Figure 2. The Cr content ranges from 8 wt% to 20 wt% in layers deposited in [EMIm]Al2Cl7–50Cr, while deposition in [EMIm]Al2Cl7–10Cr results in a Cr content between 1.8 wt% and 4 wt%. In agreement with the observations regarding the number and size of Cr-rich particles (Figure 1c,d), the Cr content of layers deposited at −15 mA cm−2 is half as high as in layers deposited at −5 mA cm−2.
The layers typically contain (3 ± 1) wt% carbon, up to 12 wt% oxygen and up to 1.6 wt% chlorine. While the carbon content seems to be independent on the Cr chloride concentration in the electrolyte, the oxygen content is lower, and the chlorine concentration is slightly higher in layers deposited from [EMIm]Al2Cl7–50Cr. Carbon impurities most probably originate from incorporation of [EMIm]+ or cleaning of the samples with acetone after the deposition. Oxygen impurities might be the result of exposure to air. Cr-rich AlCr alloys are known to have good oxidation stability [10], explaining the lower oxygen content in layers deposited in [EMIm]Al2Cl7–50Cr. Since the Cr content in these layers is generally higher and the layers are more compact, a high chlorine concentration cannot be explained by incorporation from the electrolyte. However, the variation of the chlorine content in the layers is rather small.

3.1.2. AlZn Alloys

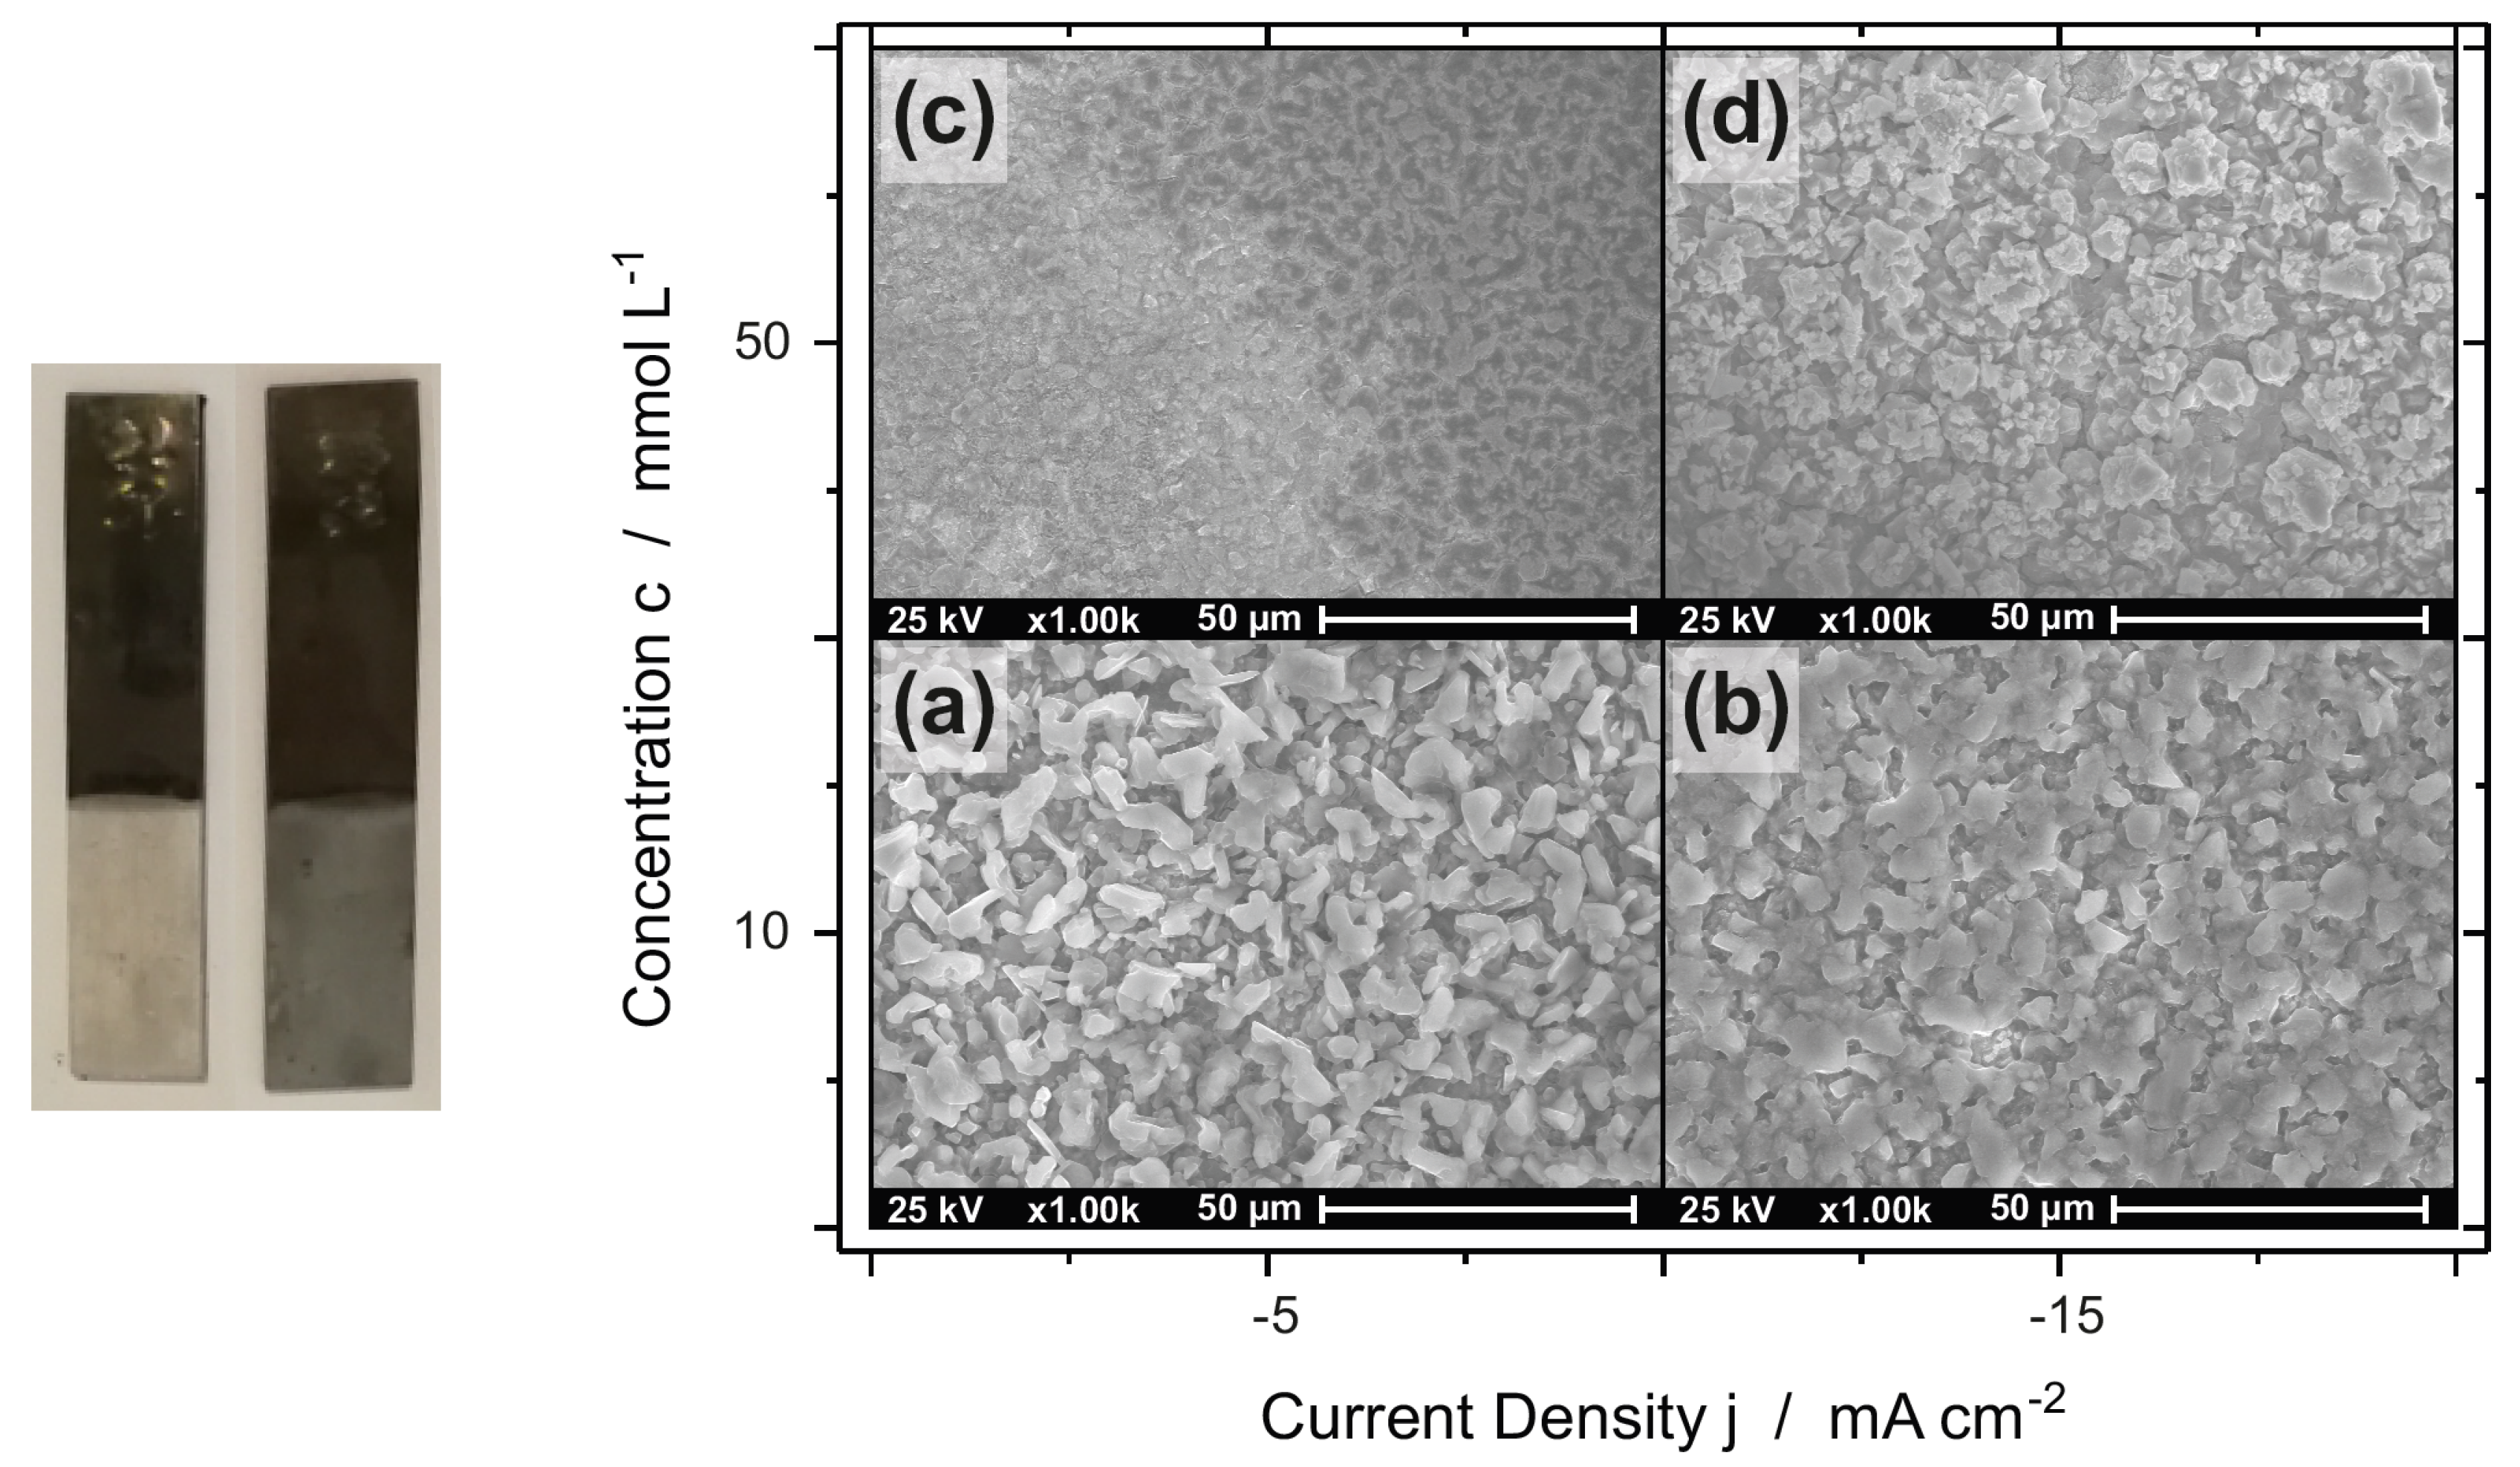
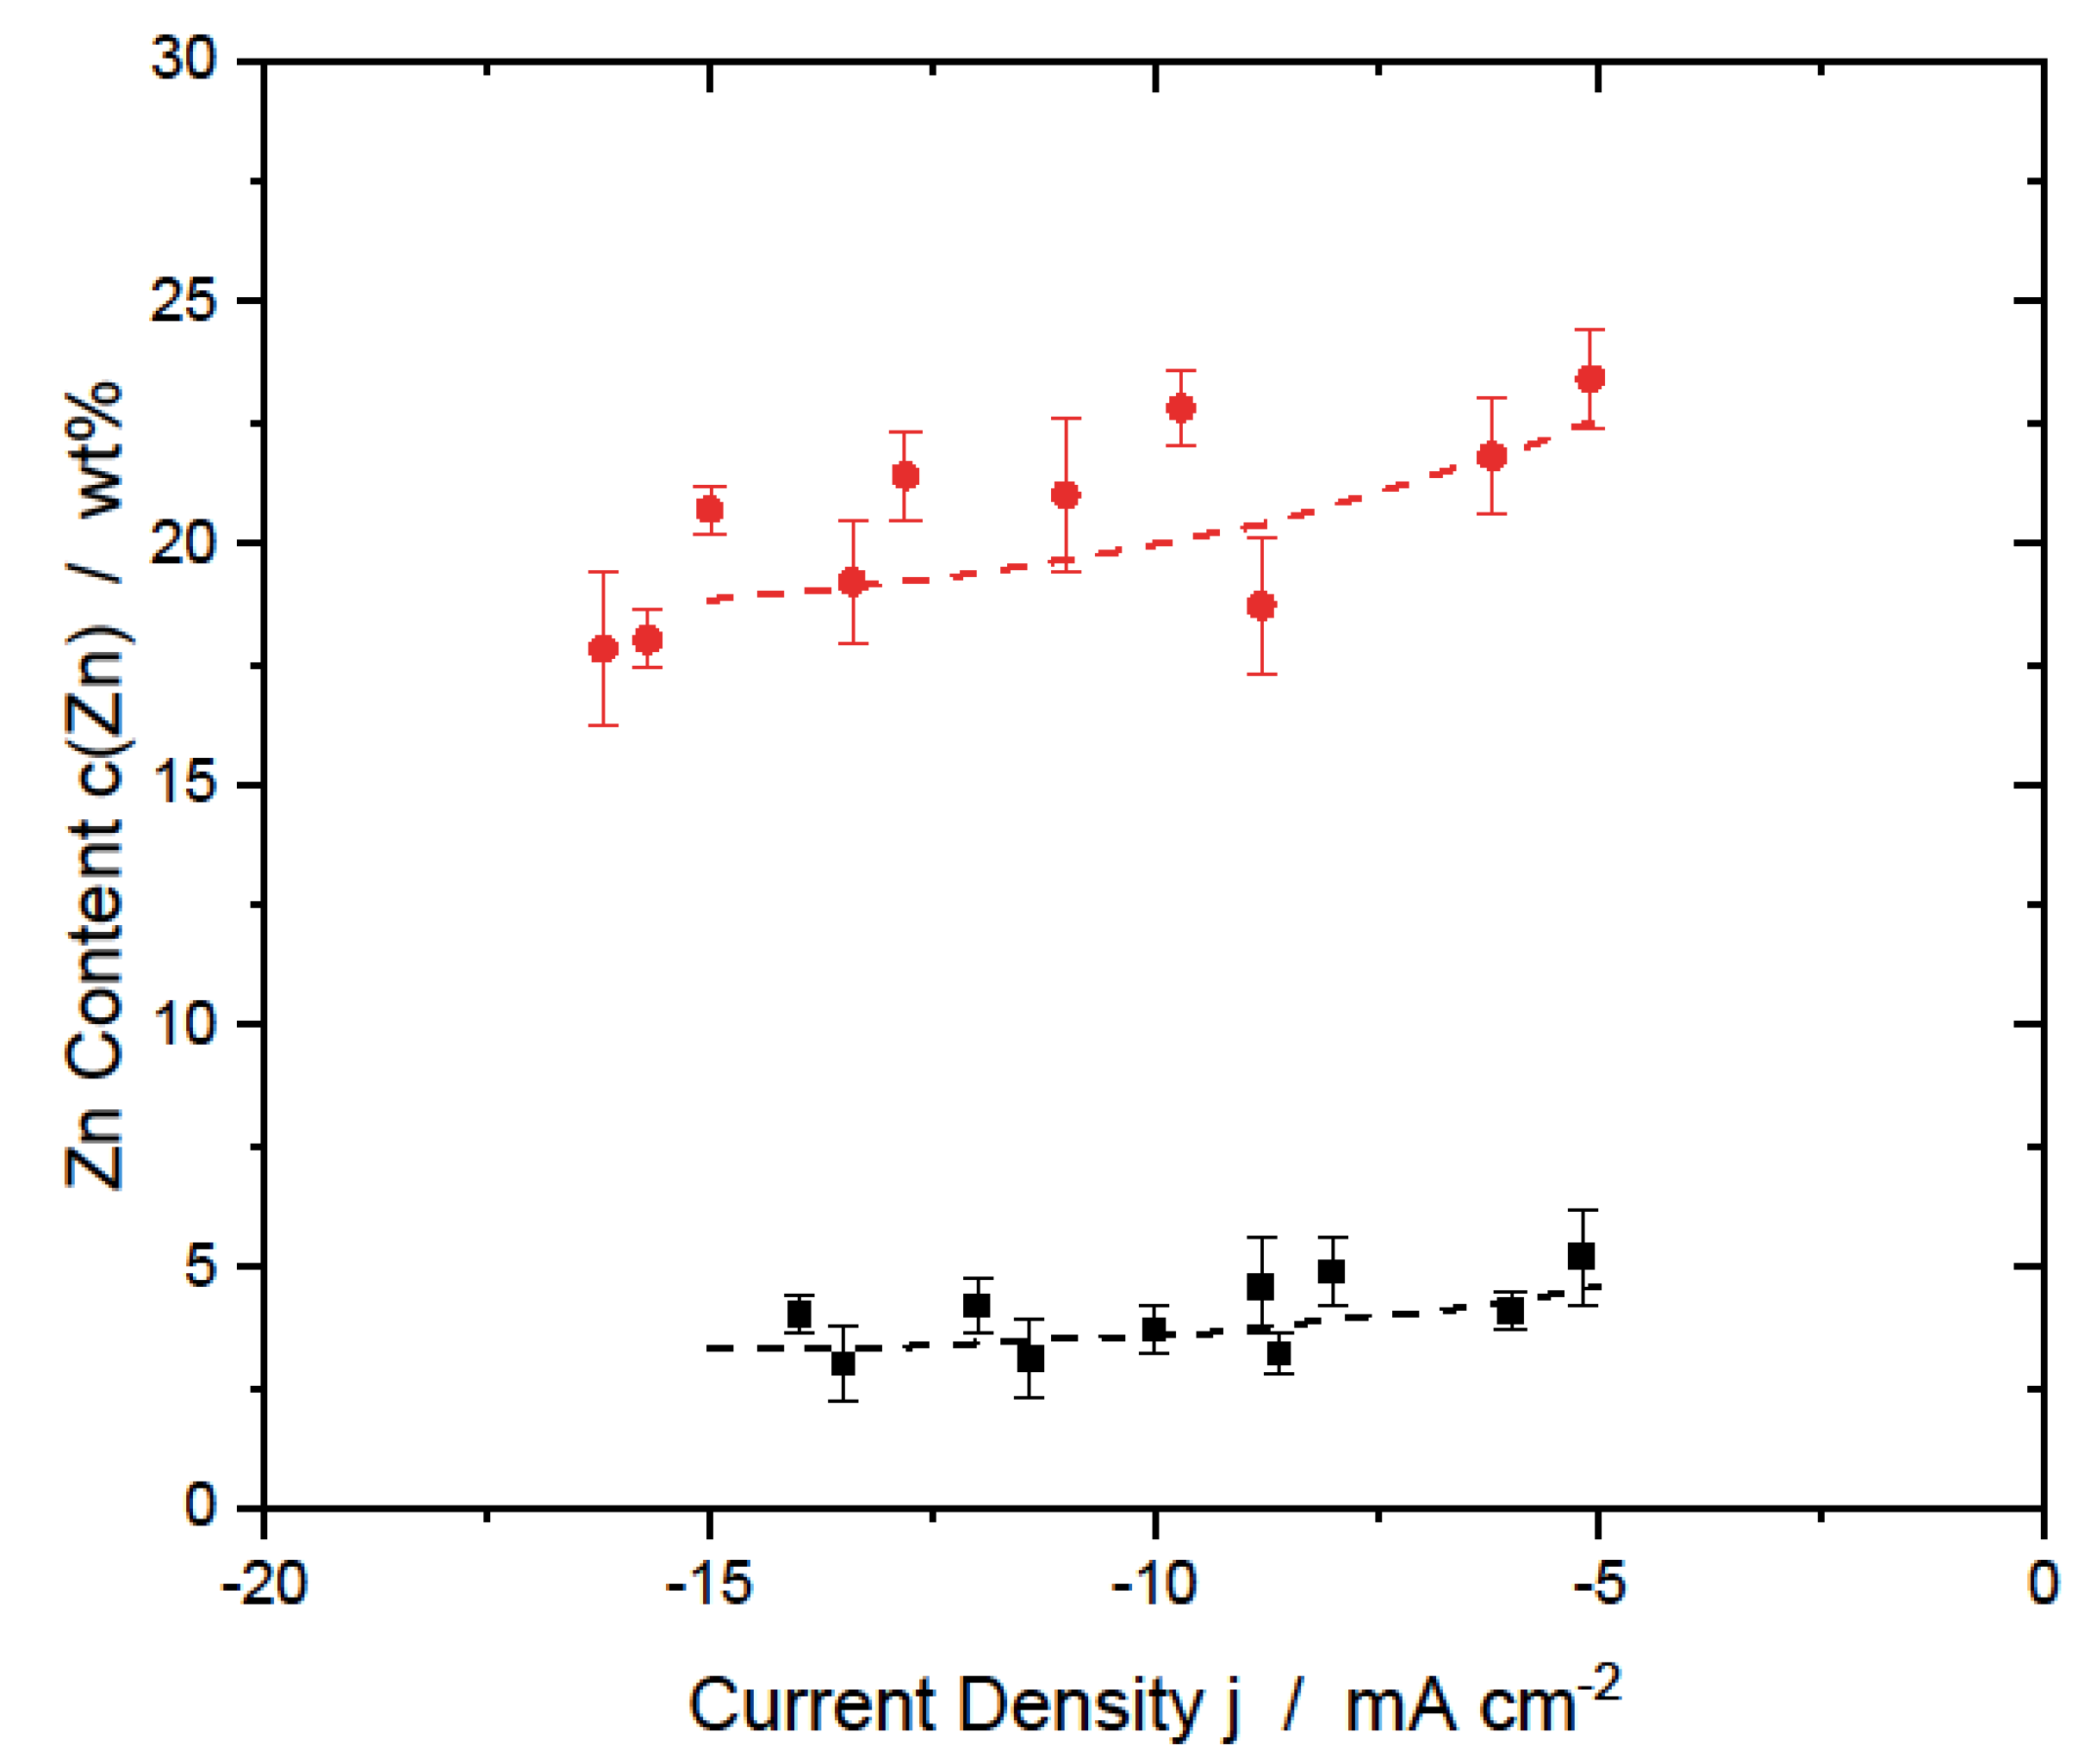
The AlZn coatings have a dull white (low Zn content) to gray (high Zn content) appearance (Figure 3 left) and their morphology strongly depends on the applied current density and the Zn concentration in the electrolyte (Figure 3 right). While a layer, deposited from [EMIm]Al2Cl7–10Zn at 5 mA cm−2, has a coarse, flake-like structure (Figure 3a), the morphology changes towards a dense layer with a structured surface and smaller grains for [EMIm]Al2Cl7–50Zn (Figure 3c). Increasing the cathodic current density to 15 mA cm−2 leads to coalescing flake-like grains (Figure 3b). When depositing in [EMIm]Al2Cl7–50Zn at −15 mA cm−2, the layer is dense with polyhedral-like grains on the surface (Figure 3d). The highly structured morphology explains the dull appearance of the layers. The Zn content in the layers decreases linearly with increasing cathodic current density for both [EMIm]Al2Cl7–10Zn and [EMIm]Al2Cl7–50Zn in the range of −5 to −15 mA cm−2 (Figure 4). Similar to AlCr layers, this is the result of the more positive standard electode potential of Zn compared to Al. As the concentration of ZnCl2 in the electrolyte increases from 10 mmol L−1 to 50 mmol L−1, the deposits contain four to eight times more Zn. For [EMIm]Al2Cl7–10Zn, the Zn content varies between 2.2 wt% and 6.2 wt% while for [EMIm]Al2Cl7–50Zn values of 16.2 wt% to 24.4 wt% were found. However, the deviation of the Zn content in the deposit increases with the Zn concentration in the electrolyte (Figure 4). A higher content of Zn in the layer can be expected when cathodic current densities below 5 mA cm−2 are applied as observed by Cross et al. [15], who investigated the range of −2 to −6 mA cm−2, and by Pan et al. [13], who reported a decreasing Zn content when applying constant cathodic potentials in the range of 0 to −300 mV vs. Al/Al3+. In this range, the Zn content was reported to be around 35 wt% while the Zn concentration of the electrolyte was 200 mmol L−1, which supports our findings. In the layers deposited from [EMIm]Al2Cl7–10Zn, Zn is rather evenly distributed. When depositing from [EMIm]Al2Cl7–50Zn, Zn-rich crystals can be found at the surface (Figure 3d). Pan et al. [13] reported similar findings but used an electrolyte with a Zn concentration of 200 mmol L−1, which might result in the growth of nearly pure Zn crystals.
If the deposits remain in the electrolyte at OCP, the surface takes a grayish color comparable to the Zn-rich sample in Figure 3 (left), indicating cementation of Zn according to Equation (2).
3 Zn2+ + 2 Al → 3 Zn + 2 Al3+
Besides Al and Zn, the layers contain impurities, namely chlorine, carbon, and oxygen. While chlorine impurities originate from the electrolyte precursors, carbon, and oxygen come possibly from the incorporation of [EMIm]+ or its decomposition products as well as contaminations after the deposition (e.g., cleaning with acetone) and oxidation in contact with air, respectively. The chlorine content generally decreases with increasing current density and is typically in the range of 0.6 to 0.1 wt%. The oxygen content seems to be independent of the current density and is in the range of some wt%, while the carbon content slightly increases with increasing current density, which might indicate a stronger decomposition of the cation at more cathodic potentials.

3.1.3. AlSn Alloys

For low cathodic current densities, the AlSn layers are dark gray, very brittle, and porous. At cathodic current densities above 10 mA cm−2 the coatings have a bright appearance, similar to pure Al coatings (Figure 5), suggesting low Sn contents.
SEM images reveal that the layers deposited at cathodic current densities below 10 mA cm−2 have a strongly corrugated, porous surface morphology (Figure 5a,c). Deposition at cathodic current densities above 10 mA cm−2 leads to layers that are more compact. However, they have a grain-like structure (Figure 5b) or exhibit cracks (Figure 5d) in case of [EMIm]Al2Cl7–10Sn and [EMIm]Al2Cl7–50Sn, respectively.
The Sn content in the deposits decreases strongly with increasing current density (Figure 6). At ca. −5 mA cm−2, the amount of Sn in the layers was up to 50 wt% and 15 wt% for [EMIm]Al2Cl7–50Sn and [EMIm]Al2Cl7–10Sn, respectively. The content decreased to 0.3 wt% for both electrolytes at −15 mA cm−2. Among the three alloying elements, Sn has the most positive standard electrode potential. Hence, the dependence of the Sn content on the current density is strongest among these metals. A strong increase of the Sn content could be observed if the sample was not directly removed from the electrolyte after the deposition process finished. This is most probably due to cementation of Sn. This process is driven by the large difference in the redox potentials of Al, ca. 0 V, and Sn, ca. >600 mV compared to other systems such as Al and Cr or Al and Zn in these electrolytes. The cementation of Sn can proceed according to Equation (3).
3 Sn2+ + 2 Al → 3 Sn + 2 Al3+
A similar process was reported by Noda et al. [40] for the deposition of InSn from 1–ethyl–3–methylimidazolium tetrafluoroborate. SEM images and EDS data prove that a strongly corrugated morphology is associated with a high Sn content (Figure 5). Due to the strong dependence of the Sn content and morphology on the current density, the deposition of a homogeneous, dense AlSn coating seems challenging. The inhomogeneous distribution of the current density at a complex-shaped substrate might cause a strong deviation of the Sn content over the substrate surface.
In all deposits, the carbon content was between 2 wt% and 5 wt%, independent of the electrolyte and deposition parameters. The chlorine content was 0.1 to 0.5 wt% for depositions from [EMIm]Al2Cl7–10Sn for all current densities. The layers deposited from [EMIm]Al2Cl7–50Sn contained up to 1.7 wt% of chlorine, probably because of incorporation of electrolyte in the porous layer (Figure 5c,d). The oxygen content was around 10 wt% for deposits from the electrolyte with low Sn concentration and up to 20 wt% in case of a high Sn concentration.

3.2. Corrosion Behavior

3.2.1. Potentiodynamic Polarization

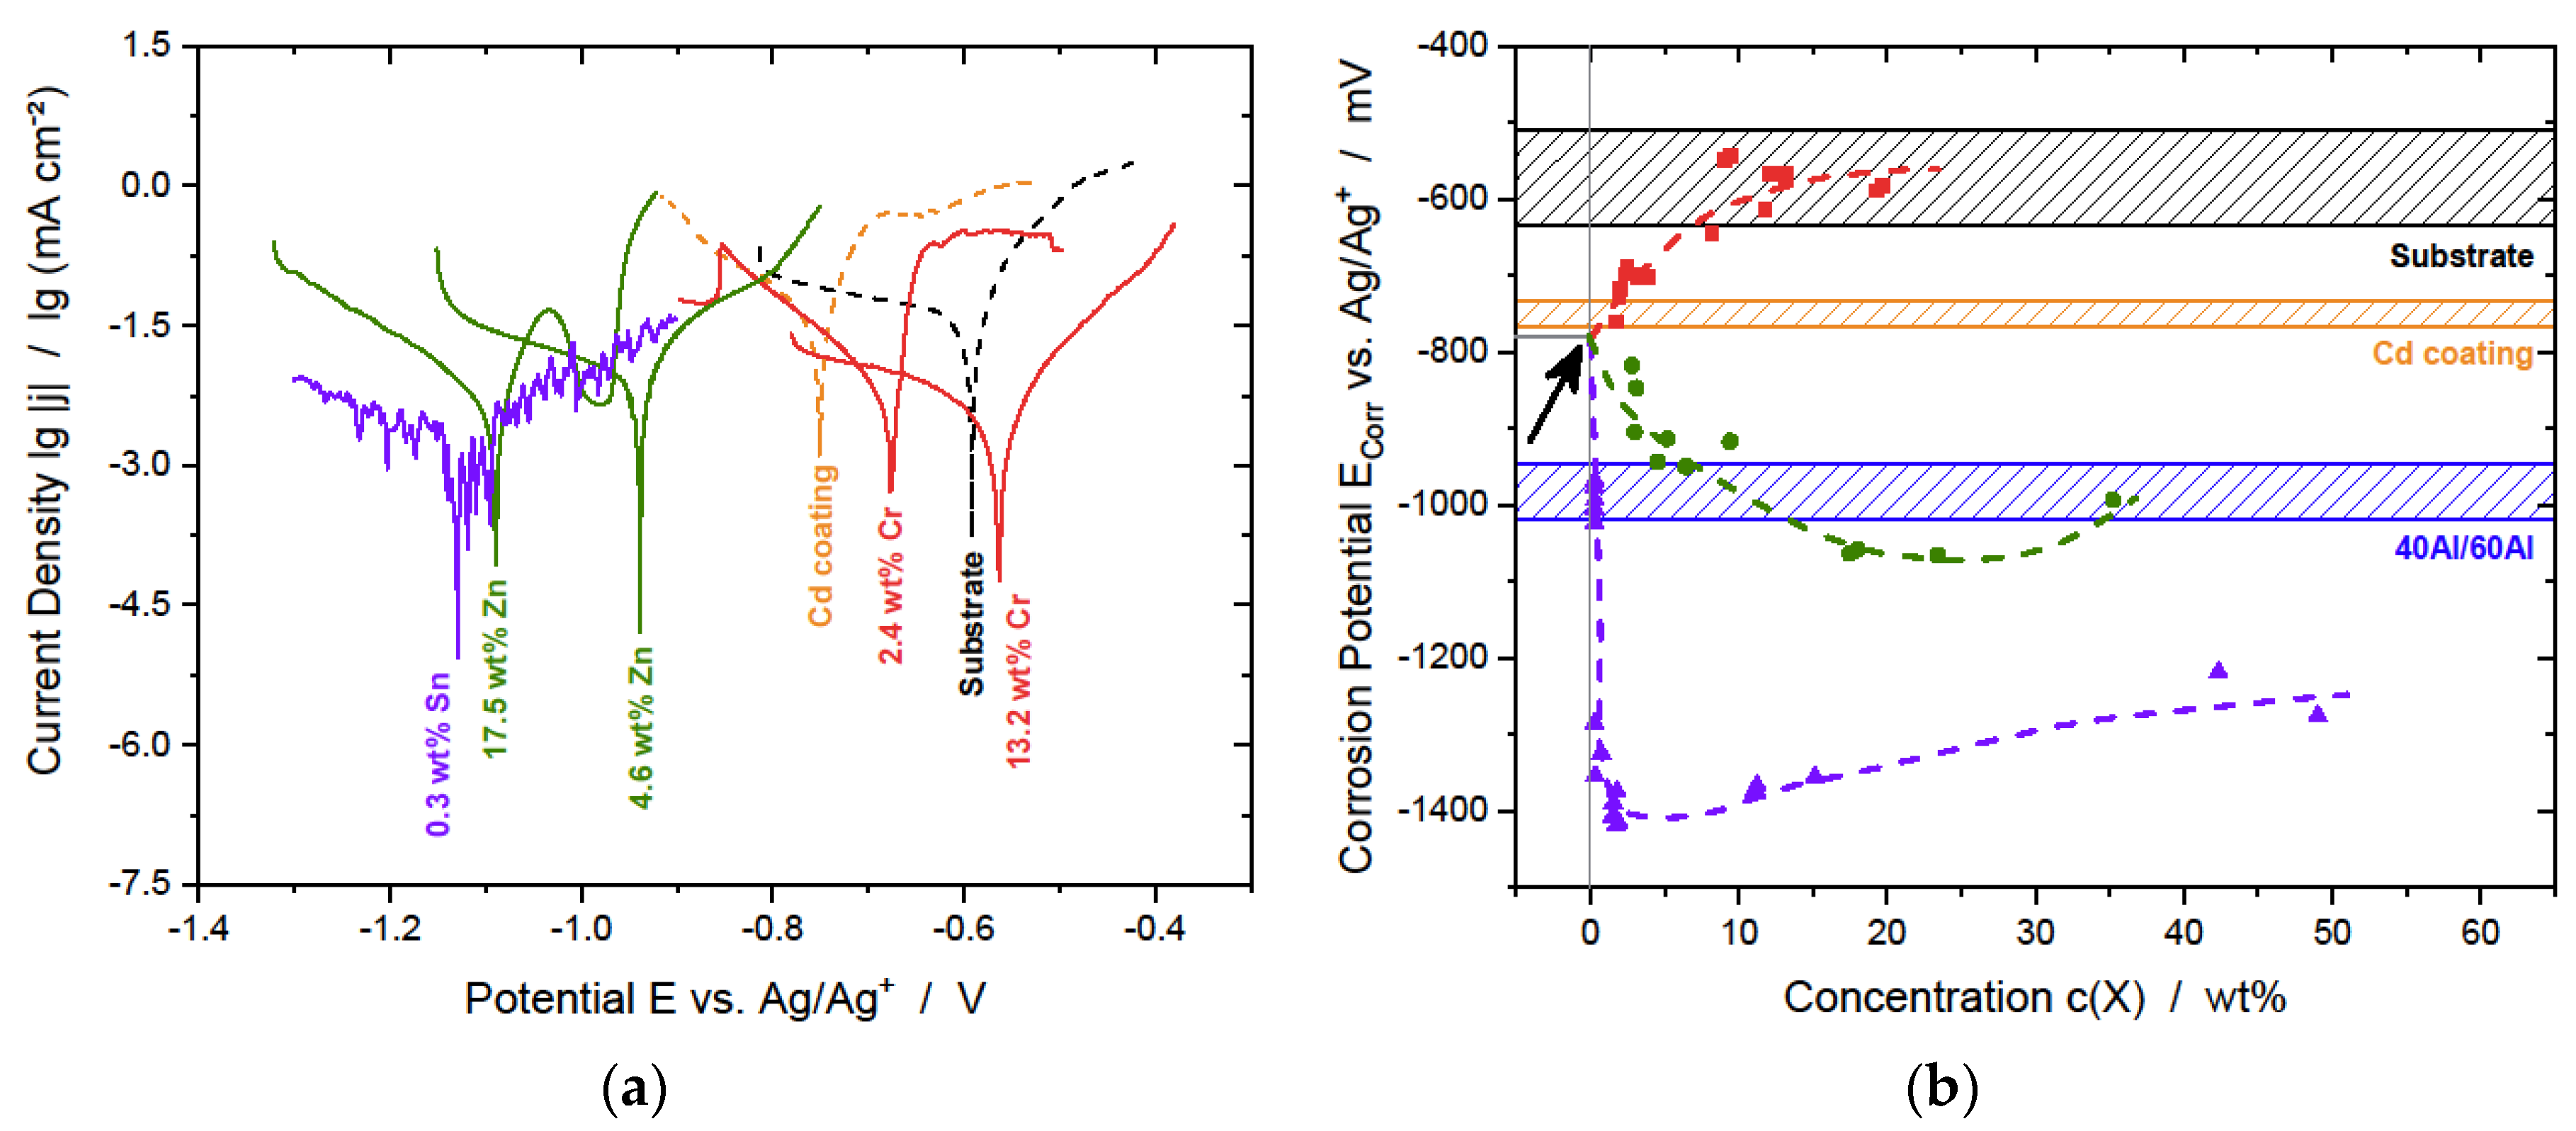
The Tafel plots show a shift of the corrosion potential of the binary Al alloys depending on the concentration of the alloying element (Figure 7a). The corrosion potential of the steel substrate, Cd coatings, 40Al and 60Al typically ranges from −510 to −625 mV, −730 to −700 mV and −945 to −1020 mV vs. Ag/AgCl reference, respectively (Figure 7b).
Starting from a corrosion potential of about −780 to −800 mV, the corrosion potentials of the deposits increase with the Cr content and decrease with the Zn and Sn content, respectively (Figure 7a,b, black arrow). The starting value corresponds the corrosion potential of pure Al in 3.5 wt% NaCl solution, as similarly reported by Ispas et al. [41]. This corrosion potential is slightly more negative than that of Cd, which is one of the reasons why Al is a promising replacement for Cd.
Increasing the Cr content leads to an increase of the corrosion potential of approximately 20 mV wt%−1 for low Cr contents. Alloys of approximately 2 to 3 wt% Cr have corrosion potentials comparable to Cd and show uniform surface corrosion. Therefore, AlCr alloys with low Cr content might be suitable for cathodic corrosion protection of steel. The corrosion potential of AlCr alloys reaches the lower limit of the corrosion potential of steel (ca. −630 mV vs. Ag/AgCl reference) for Cr contents of 5 to 10 wt%. Further increasing the Cr content does not lead to significant changes in the corrosion potential. On the one hand, the Cr content needs to be below 5 wt% to provide cathodic corrosion protection.
On the other hand, pitting corrosion was observed for Cr contents above 5 wt%. The measured corrosion potentials for Cr concentrations above this value probably represent mixed corrosion potentials of the coating and the steel substrate.
Despite a more positive standard potential of Zn compared to Al [23], the corrosion potentials of binary Al alloys with Zn decrease with an average rate of 15 mV wt%−1 until approximately 20 wt% Zn (Figure 7). Beyond this concentration, the corrosion potential increases slightly. This is the result of the increasing Zn content and increasing effect of the corrosion potential of the Zn phase. Comparable to the corrosion potentials of 40Al and 60Al, the corrosion potential of AlZn coatings ranges from −800 to −1000 mV for less than 10 wt% Zn and −1000 to −1100 mV for more than 10 wt% Zn. The corrosion proceeded uniformly for all AlZn alloys independent from the Zn content.
As in the case of AlZn alloys, the corrosion potential of AlSn alloys decreases strongly with increasing Sn content. However, even low amounts of Sn result in an increased reactivity of the material. When simply immersed in the NaCl solution, alloys with more than 1 wt% Sn spontaneously dissolve under gas evolution. Consequently, the measurement of the corrosion potential was challenging and the resulting Tafel plots show an extreme signal-to-noise ratio (Figure 7a). The corrosion potential decreases with an average rate of 700 mV wt%−1 for alloys with a Sn content of up to 1 wt% and a minimum corrosion potential of about −1400 mV can be observed. Beyond this concentration, the corrosion potential appears to increase slightly, comparable to AlZn coatings. However, the coatings are highly active and dissolve rapidly, resulting in Tafel plots with a noisy signal. The values given in Figure 7b represent a rough estimation from OCP and potentiodynamic polarization experiments. For a corrosion-protection coating the Sn content needs to be below 0.7 wt%. Unfortunately, such low Sn content in the coating will be difficult to control (Figure 6), especially in case of complex shaped substrates.

3.2.2. Neutral Salt Spray Test

The bare steel substrate showed severe red rust over the whole surface after 24 h (Figure 8, red bars). However, Al coatings efficiently protected the steel substrate in NSS, as reported before [42,43,44]. The surface changed its color from light gray (day 0) towards dark gray (day 15) without any signs of corrosion of the substrate. The first red rust appeared in specific spots, scattered over the surface (day 33). AlCr coatings turn from light gray (day 0) towards dark gray (day 1), comparable to pure Al coatings. However, the first traces of red rust appear after three days and spread within a few more days all over the surface. AlZn coatings show a comparable behavior to pure Al coatings over the whole testing period. Turning from light gray (day 0) towards dark gray (day 15) within the first weeks, the first traces of red rust appear after approximately 30 days and then spread rapidly over the sample surface. The AlSn coatings are as reactive as seen in the potentiodynamic polarization experiments. The coating rapidly changes its color from gray (day 0) to dark gray with a lot of dark spots on the surface (day 2). Red rust appeared very suddenly (day 4) and spread rapidly over the surface.

3.2.3. Environmental Exposure Test

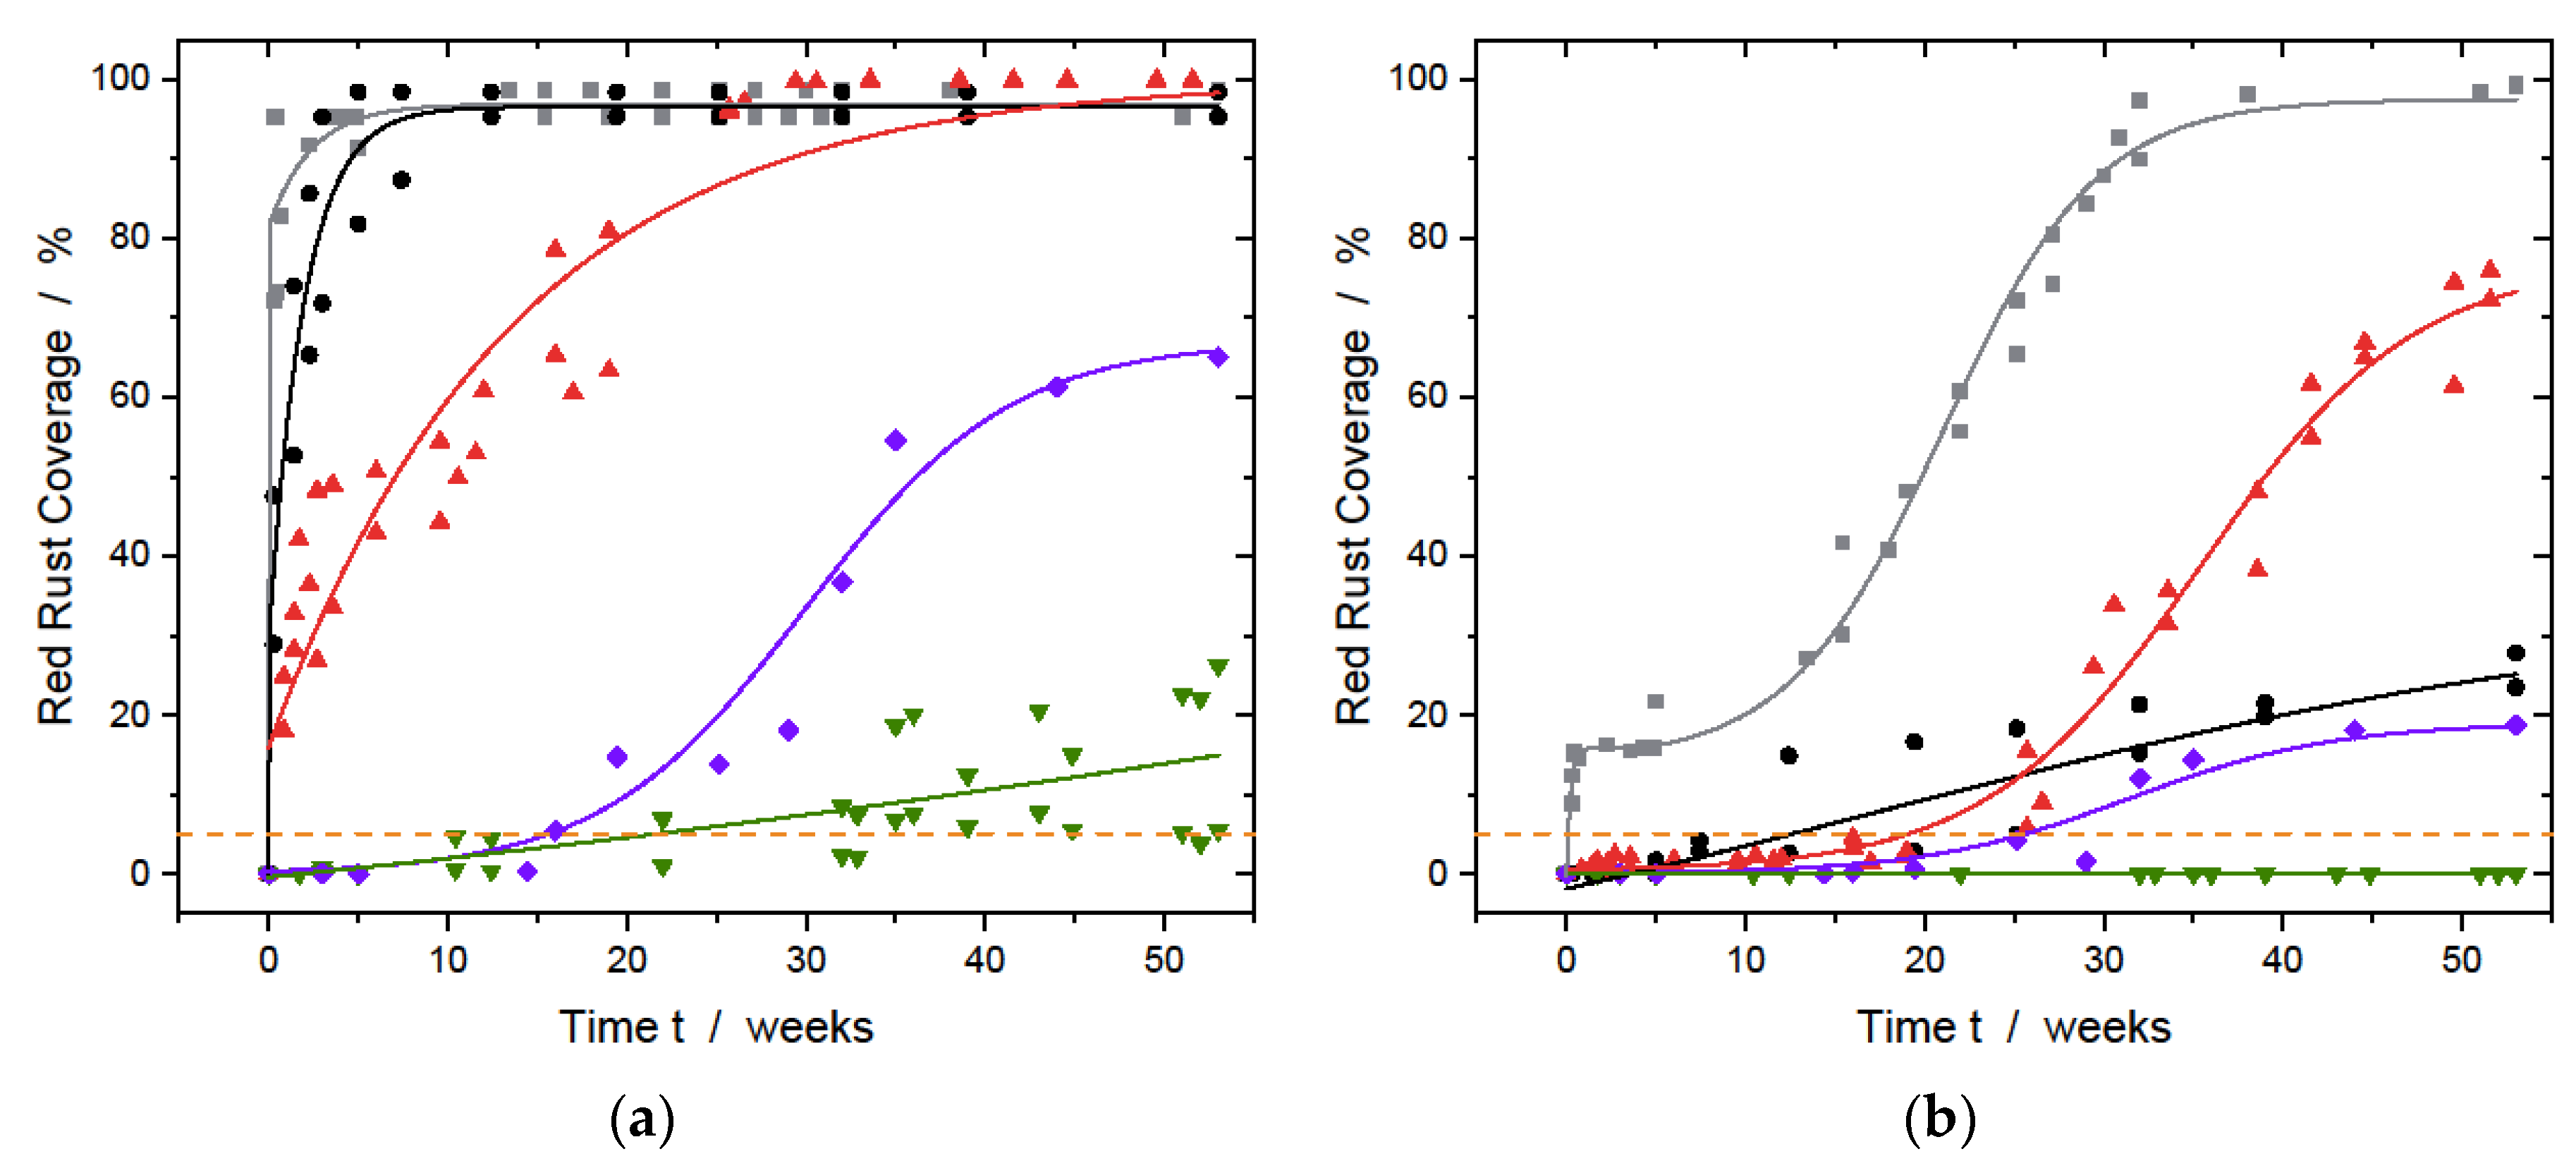
One has to keep in mind that the results of environmental exposure strongly depend on the local weather and the seasonal conditions. Therefore, the results have to be interpreted on a comparative basis. In contrast to the NSS and for the sake of better comparability, a red rust coverage of about 5% was chosen as a criterion for the onset of corrosion (Figure 8 and Figure 9).
The uncoated steel substrate showed first signs of red rust within the first two days of exposure (Figure 8 and Figure 9a). While the scratched area is fully covered with red rust after a few days (Figure 9a), the red rust coverage of the whole exposed surface area increases to about 20% in the first days, keeps constant for five to ten weeks, and strongly increases to 100% over the following 20 weeks (Figure 9b).
The Al coatings, which efficiently protected the substrate in NSS, showed red rust in the scratch region after two days of exposure. The formation of red rust in the scratch is delayed by a few days in comparison to the uncoated steel substrate (Figure 8 and Figure 9a). Consequently, it can be assumed that there is no significant cathodic corrosion protection of the steel substrate by aluminum under the present environmental conditions. During the following weeks several small corrosion sites appeared on the coated surface (Figure 9b). Their number and size continuously increased, proving that pure Al coatings can delay surface corrosion.
AlCr coatings were able to delay the formation of red rust in the scratched area six to eight times longer when compared to Al coatings (Figure 8 and Figure 9a). After six days the first red rust was observed. Therefore, a slight improvement of the cathodic protection by AlCr coatings can be assumed. However, in the following weeks additional corrosion sites appeared, not only in the scratched area but all over the coated surface (Figure 9b), probably due to defects in the layer. While the scratched area is fully covered with red rust after 35 to 40 weeks, 75 to 80% of the intact area is covered after more than 50 weeks.
Besides a change in their appearance, from light gray and slightly shiny towards matte-gray and slightly stained, no traces of red rust could be observed after several weeks of exposure for AlZn coatings. On average, a red rust coverage of more than 5% in the scratched area was reached after more than 20 weeks. However, the onset of corrosion was observed after more than 20 and after 55 weeks for different exposed samples (Figure 9a). The variation might be the result of slight variations of the Zn content. For all samples, the maximum red rust coverage in the scratched area was less than 25% after 55 weeks (Figure 9a). Furthermore, the coated surface area did not show any corrosion during the whole exposure time (Figure 8 and Figure 9b). In combination with the results of the NSS test, AlZn alloys show a strongly improved cathodic corrosion protection and are therefore highly promising candidates for cathodic corrosion protection of steel.
AlSn coatings show a strong discoloration during the first days, comparable to the NSS test. The first signs of red rust in the scratched area appears after some weeks (Figure 8 and Figure 9a). After 15 weeks of exposure, red rust forms rapidly and covers more than 60% of the scratched area after approximately 40 weeks (Figure 9a). Corrosion sites appear all over the surface after 25 weeks, which is the result of the porous morphology of the coatings (Figure 5). However, the red rust coverage of the coated surface is less than 20% after more than 55 weeks (Figure 9b), indicating an improvement of the cathodic corrosion protection compared to Al and AlCr coatings.
In summary, the cathodic corrosion protection is lowest for Al and slightly higher for AlCr. AlSn coatings are able to delay the formation of red rust even longer, while AlZn coatings showed the best cathodic corrosion protection among the tested Al alloys (Figure 8).

4. Conclusions

Binary Al alloys with different concentrations of Cr, Zn, and Sn were deposited from [EMIm]Al2Cl7 at room temperature. It could be shown that the addition of the respective metal salts strongly influences the deposition overpotential as well as the peak currents, influencing the deposition rates for given deposition parameters. SEM/EDS prove that the alloy composition can be controlled via the current density. An increase of the cathodic current density leads to a decrease of the concentration of the alloying element in the deposits for all investigated alloys. Higher cathodic currents typically lead to smoother deposits. While AlCr alloys have a dull grayish to shiny appearance, AlZn alloys are light gray, getting darker with increasing Zn content. AlSn alloys deposited at low cathodic current densities are very porous. Compact deposits can only be deposited at high cathodic current densities and low Sn concentrations in the electrolyte. While an increasing Cr content results in a more anodic corrosion potential, increasing Zn and Sn contents lead to more cathodic corrosion potentials. The latter seems to be contradictory to the more positive standard electrode potentials of Zn and Sn compared to Al but indicates that the formation of a protective Al oxide layer is hindered. AlCr alloys with Cr contents of ca. 4 wt% show a poor corrosion protection in the NSS test and the EE test. In case of AlZn, an improved cathodic corrosion protection could be observed in the NSS test and the EE test, with times to red rust of more than 55 weeks. This indicates effective suppression of self-passivation. The oxidation of Zn causes the evolution of OH- ions increasing the pH value locally which might be the reason for the breakdown of the Al2O3 passive layer explaining the good corrosion performance of AlZn layers. To confirm this theory further experiments will be necessary and will be part of future investigations. AlSn alloys are highly reactive and rapidly dissolve in contact with chloride-containing electrolytes. However, low amounts of Sn can improve the cathodic protection of the steel. In comparison of the investigated alloys, AlZn alloys are the most promising candidates for the development of cathodic corrosion protection coatings with high performance.

Author Contributions

Conceptualization, R.B.; methodology, R.B.; validation, R.B., A.I. and A.B.; formal analysis, R.B.; investigation, R.B.; resources, R.B.; data curation, R.B.; writing—original draft preparation, R.B.; writing—review and editing, R.B., A.I. and A.B.; visualization, R.B.; supervision, A.B.; project administration, R.B. and A.B.; funding acquisition, R.B., A.I. and A.B. All authors have read and agreed to the published version of the manuscript.

Funding

This research was funded by the German Federal Ministry of Economic Affairs and Energy (Bundesministerium für Wirtschaft und Energie) grant number 20W1523H and 20W1921C and the APC was funded by MDPI.

Conflicts of Interest

The authors declare no conflict of interest.

References

  1. Bielewski, M. Corrosion Fatigue and Environmentally Assisted Cracking in Aging Military Vehicles (le fatigue-corrosion et la fissuration en milieu ambiant des vehicules militaires vieillissants); NATO Research and Technology: Neuilly-sur-Seine, France, 2011; Volume 140, pp. 1–22. [Google Scholar]
  2. Mason, R.; Neidbalson, M.; Klingenberg, M.; Khabra, P.; Handsy, C. Update on alternatives for cadmium coatings on military electrical connectors. Met. Finish. 2010, 108, 12–20. [Google Scholar] [CrossRef]
  3. Legg, K. Cadmium Replacement Alternatives for the Joint Strike Fighter; Report(3105JSF3); Rowan Technology Group: Libertyville, IL, USA, 2000. [Google Scholar]
  4. von Baeckmann, W.; Schwenk, W.; Prinz, W. (Eds.) Handbuch des Kathodischen Korrosionsschutzes: Theorie und Praxis der Elektrochemischen Schutzfahren; VCH: Weinheim, Germany, 1989. [Google Scholar]
  5. Seré, P.; Zapponi, M.; Elsner, C.; Di Sarli, A. Comparative corrosion behaviour of 55Aluminium–zinc alloy and zinc hot-dip coatings deposited on low carbon steel substrates. Corrosion Sci. 1998, 40, 1711–1723. [Google Scholar] [CrossRef]
  6. Laverde, D.; Zubillaga, J.C.; Gil-Sevillano, J.; Villanueva, E. The influence of the primer layer on mechanical damage and loss of corrosion protection of deformed painted Zn-0.16% Al and Zn-5% Al galvanized sheet steel. Corrosion Sci. 1995, 37, 79–95. [Google Scholar] [CrossRef]
  7. Shih, H.; Hsu, J.; Sun, C.; Chung, S. The lifetime assessment of hot-dip 5% Al–Zn coatings in chloride environments. Surf. Coat. Technol. 2002, 150, 70–75. [Google Scholar] [CrossRef]
  8. Prosek, T.; Persson, D.; Stoulil, J.; Thierry, D. Composition of corrosion products formed on Zn–Mg, Zn–Al and Zn–Al–Mg coatings in model atmospheric conditions. Corrosion Sci. 2014, 86, 231–238. [Google Scholar] [CrossRef]
  9. Moffat, T.P. Electrodeposition of Al-Cr metallic glass. J. Electrochem. Soc. 1994, 141, L115–L117. [Google Scholar] [CrossRef]
  10. Ali, M.R.; Nishikata, A.; Tsuru, T. Electrodeposition of aluminum-chromium alloys from AlCl3-BPC melt and its corrosion and high temperature oxidation behaviors. Electrochim. Acta 1997, 42, 2347–2354. [Google Scholar] [CrossRef]
  11. Simanavičius, L.; Staknas, A.; Šarkis, A. Codeposition of aluminum with some metals from AlBr3–dimethylethylphenylammonium bromide solutions containing acetylacetonate of selected metal. Electrochim. Acta 2000, 46, 499–507. [Google Scholar] [CrossRef]
  12. Ueda, M.; Ebe, H.; Ohtsuka, T. Electrodeposition of Al-Cr-Ni layer by pulse electrolysis in AlCl3-EMIC molten salt. Electrochemistry 2005, 73, 739–741. [Google Scholar] [CrossRef]
  13. Pan, S.-J.; Tsai, W.-T.; Chang, J.-K.; Sun, I.-W. Co-deposition of Al–Zn on AZ91D magnesium alloy in AlCl3–1-ethyl-3-methylimidazolium chloride ionic liquid. Electrochim. Acta 2010, 55, 2158–2162. [Google Scholar] [CrossRef]
  14. Sato, Y.; Azumi, K. Al–Zn co-electrodeposition by a double counter electrode electrodeposition system from an AlCl3–1-ethyl-3-methylimidazolium chloride ionic liquid bath. Surf. Coat. Technol. 2016, 286, 256–261. [Google Scholar] [CrossRef]
  15. Cross, S.R.; Schuh, C.A. Ternary alloying additions and multilayering as strategies to enhance the galvanic protection ability of Al-Zn coatings electrodeposited from ionic liquid solution. Electrochim. Acta 2016, 211, 860–870. [Google Scholar] [CrossRef]
  16. Tsuda, T.; Hussey, C.L.; Stafford, G.R. Progress in surface finishing with lewis acidic room-temperature chloroaluminate ionic liquids. ECS Trans. 2006, 3, 217–231. [Google Scholar] [CrossRef]
  17. Gu, Y.; Liu, J.; Qu, S.; Deng, Y.; Han, X.; Hu, W.; Zhong, C. Electrodeposition of alloys and compounds from high-temperature molten salts. J. Alloys Compd. 2017, 690, 228–238. [Google Scholar] [CrossRef]
  18. Tsuda, T.; Stafford, G.R.; Hussey, C.L. Electrochemical surface finishing and energy storage technology with room-temperature haloaluminate ionic liquids and mixtures. J. Electrochem. Soc. 2017, 164, H5007–H5017. [Google Scholar] [CrossRef]
  19. Xu, X.-H.; Hussey, C.L. The Electrochemistry of Tin in the Aluminum Chloride-1-methyl-3-ethylimidazolium Chloride Molten Salt. J. Electrochem. Soc. 1993, 140, 618. [Google Scholar] [CrossRef]
  20. Simka, W.; Puszczyk, D.; Nawrat, G. Electrodeposition of metals from non-aqueous solutions. Electrochim. Acta 2009, 54, 5307–5319. [Google Scholar] [CrossRef]
  21. Platis, F.S.; Capuano, G.A. Electrodeposition of Aluminum-Tin Alloys from Organic Electrolytes. Electrochem. Soc. 1987, 134, 2425–2429. [Google Scholar] [CrossRef]
  22. Ueda, M.; Inaba, R.; Ohtsuka, T. Composition and structure of Al–Sn alloys formed by constant potential electrolysis in an AlCl3–NaCl–KCl–SnCl2 molten salt. Electrochim. Acta 2013, 100, 281–284. [Google Scholar] [CrossRef]
  23. Lide, D.R. (Ed.) CRC Handbook of Chemistry and Physics: A Ready-Reference Book of Chemical and Physical Data; CRC Press: Boca Raton, FL, USA, 1996. [Google Scholar]
  24. Ziegler, K.; Lehmkuhl, H.Z. Die elektrolytische abscheidung von aluminium aus organischen komplexverbindungen. Anorg. Allg. Chem. 1956, 283, 414–424. [Google Scholar] [CrossRef]
  25. Lehmkuhl, H.; Mehler, K.; Landau, U. Advances in Electrochemical Science and Engineering; Gerischer, H., Tobias, C.W., Eds.; Wiley-VCH: Weinheim, Germany, 1993; p. 163. [Google Scholar]
  26. Zhao, Y.; VanderNoot, T.J. Electrodeposition of aluminium from nonaqueous organic electrolytic systems and room temperature molten salts. Electrochim. Acta 1997, 42, 3–13. [Google Scholar] [CrossRef]
  27. Ishibashi, N.; Yoshio, M. Electrodeposition of aluminium from the NBS type bath using tetrahydrofuran—benzene mixed solvent. Electrochim. Acta 1972, 17, 1343–1352. [Google Scholar] [CrossRef]
  28. Yoshio, M.; Ishibashi, N. High-rate plating of aluminium from the bath containing aluminium chloride and lithium aluminium hydride in tetrahydrofuran. J. Appl. Electrochem. 1973, 3, 321–325. [Google Scholar] [CrossRef]
  29. Abbott, A.P.; MacFarlane, D.R.; Endres, F. (Eds.) Electrodeposition from Ionic Liquids; Wiley-VCH: Weinheim, Germany, 2017. [Google Scholar]
  30. Fox, D.M.; Gilman, J.W.; Morgan, A.B.; Shields, J.R.; Maupin, P.H.; Lyon, R.E.; de Long, H.C.; Trulove, P.C. Flammability and thermal analysis characterization of imidazolium-based ionic liquids. Ind. Eng. Chem. Res. 2008, 47, 6327–6332. [Google Scholar] [CrossRef]
  31. Wang, Y.-P.; Gao, X.-H.; Chen, J.-C.; Li, Z.-W.; Li, C.-L.; Zhang, S.-C. Imidazolium-organic solvent–alkali metal salt mixtures as nonflammable electrolytes incorporated into PVDF–PEG polymer electrolyte. J. Appl. Polym. Sci. 2009, 113, 2492–2498. [Google Scholar] [CrossRef]
  32. Ali, M.R.; Abbott, A.P.; Ryder, K.S. Electrodeposition of Al-Mg Alloys from Acidic AlCl3-EMIC-MgCl2 Room Temperature Ionic Liquids. J. Electrochem. 2015, 21, 172. [Google Scholar]
  33. Wilkes, J.S.; Levisky, J.A.; Wilson, R.A.; Hussey, C.L. Dialkylimidazolium chloroaluminate melts: A new class of room-temperature ionic liquids for electrochemistry, spectroscopy and synthesis. Inorg. Chem. 1982, 21, 1263–1264. [Google Scholar] [CrossRef]
  34. Hussey, C.L.; Scheffler, T.B.; Wilkes, J.S.; Fannin, A.A. Chloroaluminate equilibria in the aluminum chloride-1-methyl-3-ethylimidazolium chloride ionic liquid. J. Electrochem. Soc. 1986, 133, 1389–1391. [Google Scholar] [CrossRef]
  35. Lai, P.K.; Skyllas-Kazacos, M. Electrodeposition of aluminium in aluminium chloride/1-methyl-3-ethylimidazolium chloride. J. Electroanal. Chem. 1988, 248, 431–440. [Google Scholar] [CrossRef]
  36. Böttcher, R.; Valitova, A.; Ispas, A.; Bund, A. Electrodeposition of aluminium from ionic liquids on high strength steel. Trans. Inst. Met. Finish. 2019, 97, 82–88. [Google Scholar] [CrossRef]
  37. Cotton, F.A.; Wilkinson, G. Advanced Inorganic Chemistry; Wiley: New York, NY, USA, 1980. [Google Scholar]
  38. Liu, J.S.Y.; Chen, P.Y.; Sun, I.W.; Hussey, C.L. Electrochemical Studies of Chromium (III) and Chromium (II) Chloride Complexes in Basic Aluminum Chloride-1-Methyl-3-ethylimidazolium Chloride Room Temperature Molten Salts. J. Electrochem. Soc. 1997, 144, 2388–2392. [Google Scholar] [CrossRef]
  39. Böttcher, R.; Ispas, A.; Bund, A. On the electrodeposition of tantalum from three different ionic liquids with the bis (trifluoromethyl sulfonyl) amide anion. Electrochem. Commun. 2020, 115, 106720. [Google Scholar] [CrossRef]
  40. Noda, M.; Morimitsu, M.; Matsunaga, M. Electrodeposition of In-Sn alloys in EMI-BF4-Cl ambient temperature melts with current pulses. ECS Trans. 2007, 3, 249–252. [Google Scholar] [CrossRef]
  41. Ispas, A.; Vlaic, C.A.; Camargo, M.K.; Bund, A. Electrochemical deposition of aluminum and aluminum-manganese alloys in ionic liquids. ECS Trans. 2016, 75, 657–665. [Google Scholar] [CrossRef]
  42. Caporali, S.; Fossati, A.; Lavacchi, A.; Perissi, I.; Tolstogouzov, A.; Bardi, U. Aluminium electroplated from ionic liquids as protective coating against steel corrosion. Corrosion Sci. 2008, 50, 534–539. [Google Scholar] [CrossRef]
  43. Chang, J.-K.; Chen, S.-Y.; Tsai, W.-T.; Deng, M.-J.; Sun, I.-W. Improved corrosion resistance of magnesium alloy with a surface aluminum coating electrodeposited in ionic liquid. J. Electrochem. Soc. 2008, 155, C112–C116. [Google Scholar] [CrossRef]
  44. Chang, J.-K.; Chen, S.-Y.; Tseng, C.-H.; Tsai, W.-T.; Deng, M.-J.; Sun, I.-W. Electrodeposition of Al on magnesium alloy from aluminum chloride/1-ethyl-3-methylimidazolium chloride ionic liquids. Electrochemistry 2009, 77, 585–587. [Google Scholar] [CrossRef] [Green Version]
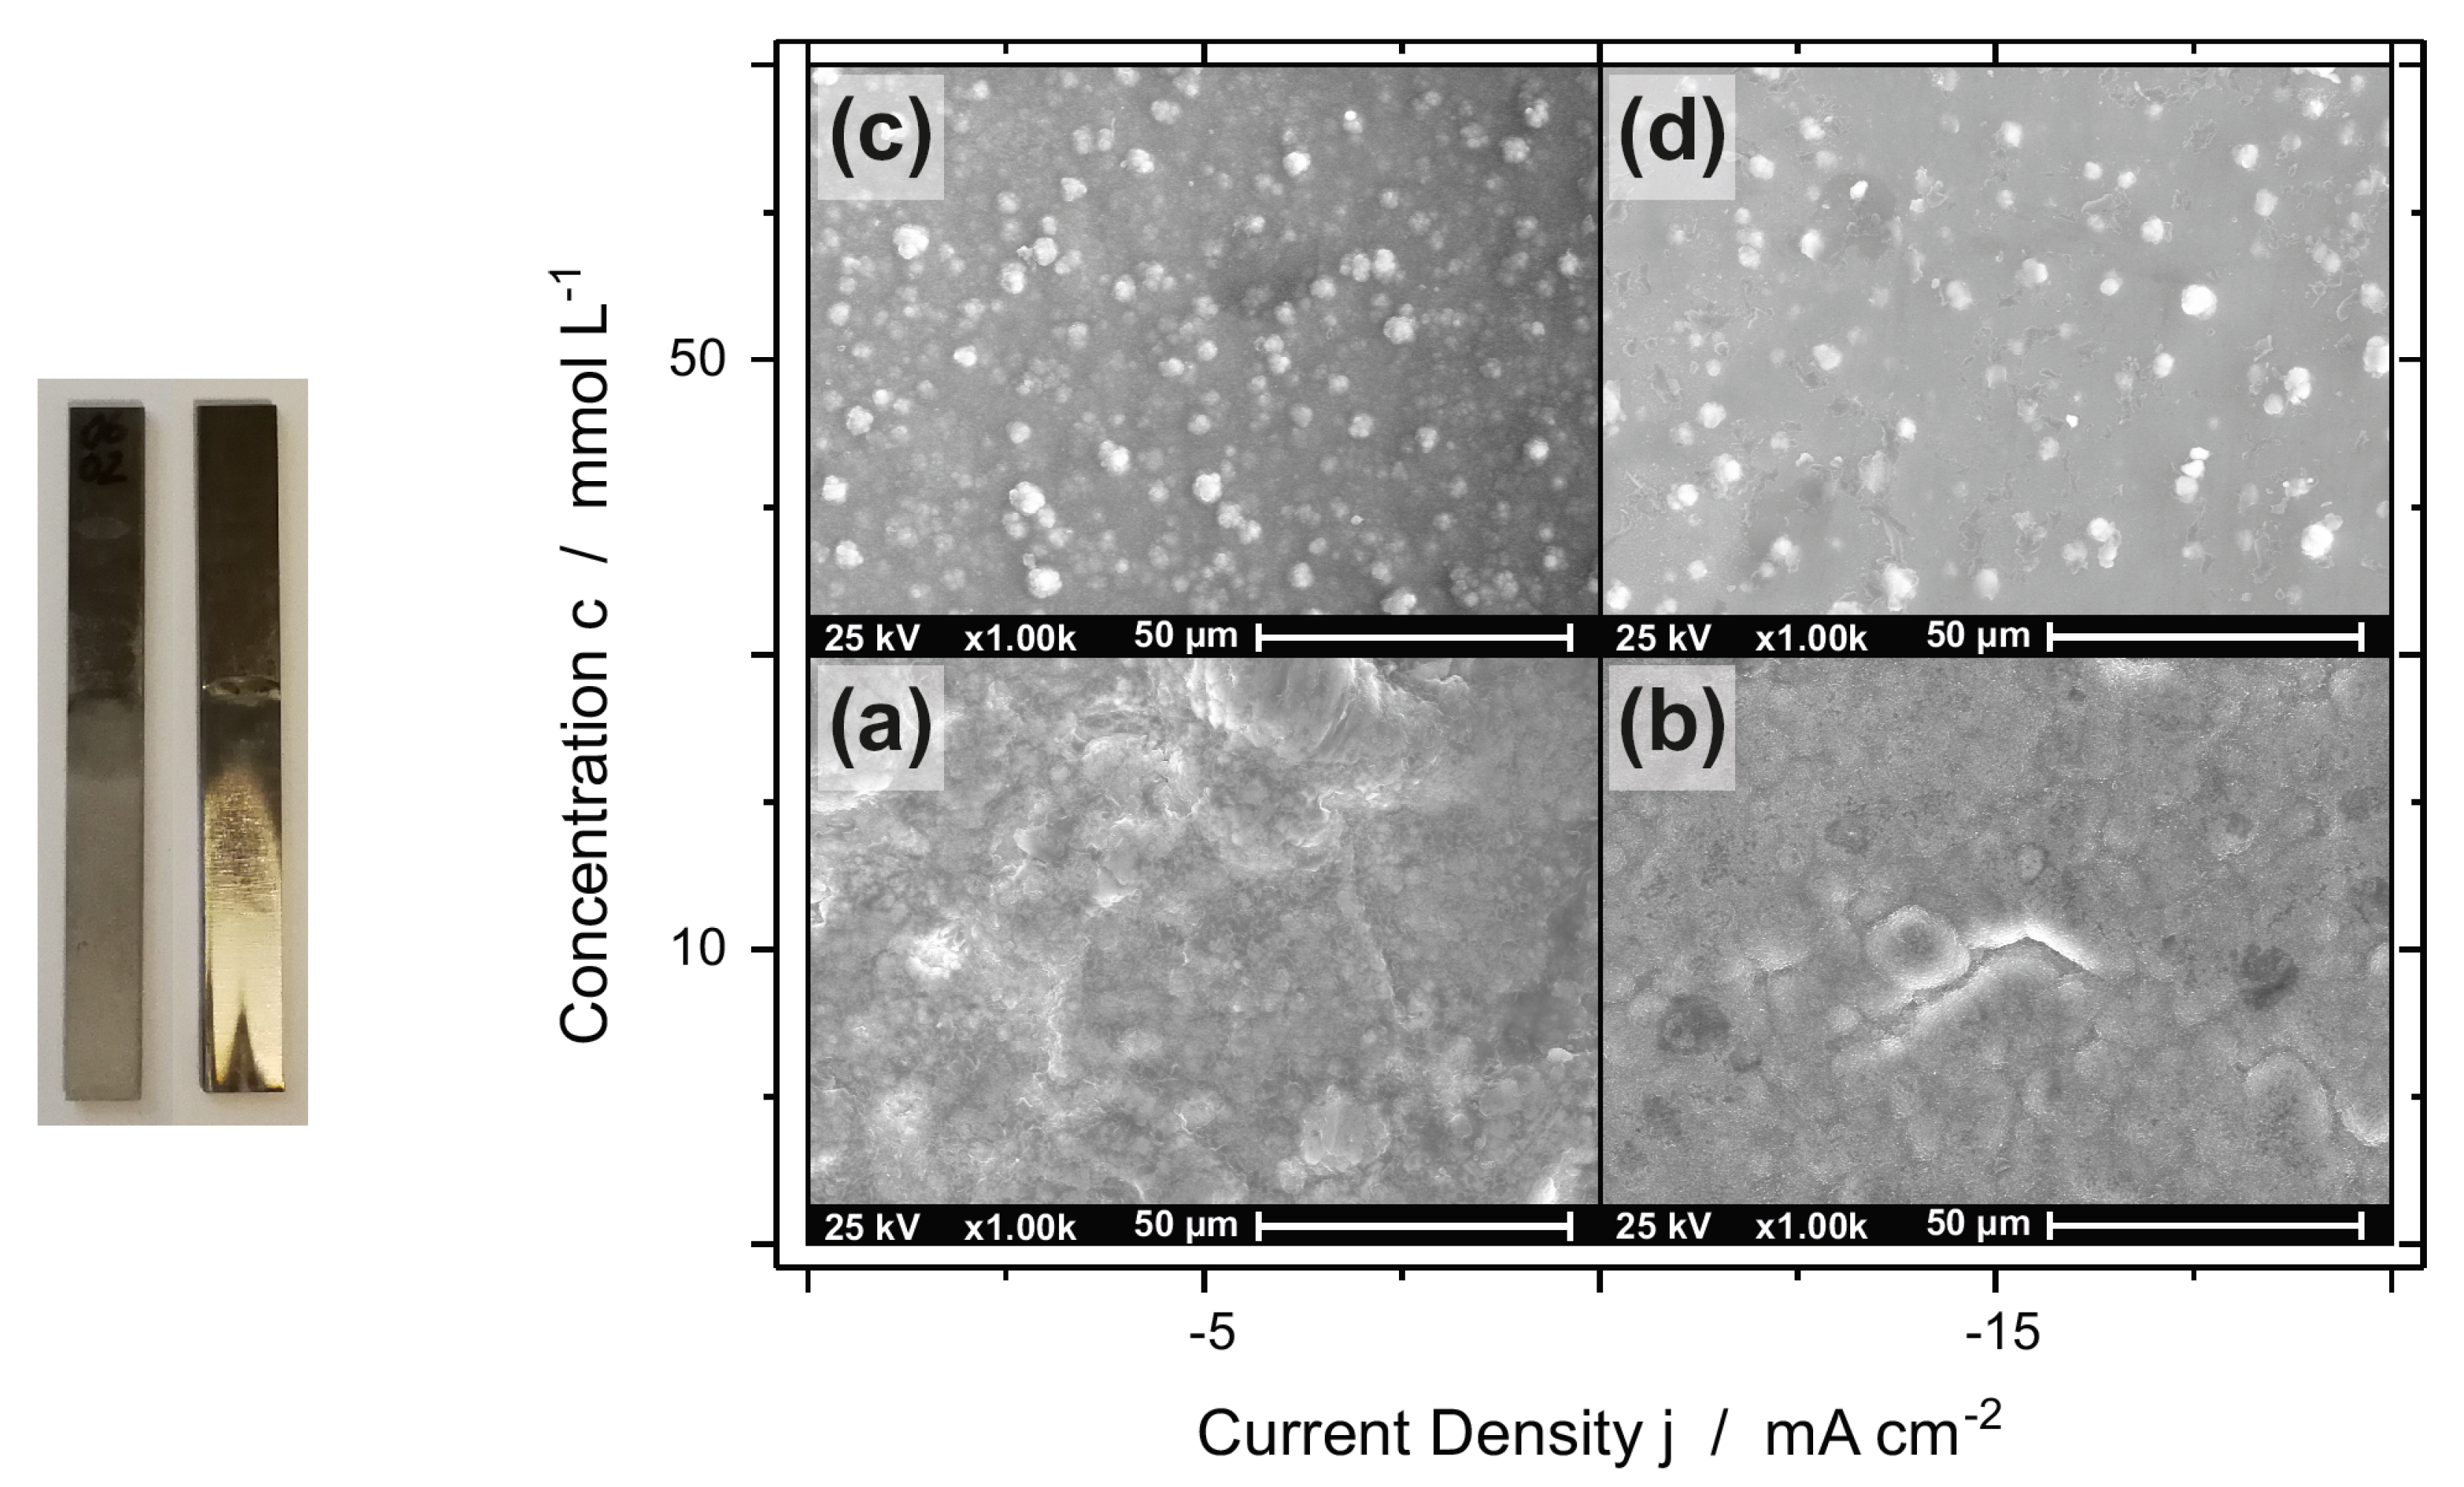
Figure 1. Photographs of AlCr coatings on steel with increasing Cr content (left to right: 3 wt% and 10 wt%) and SEM images of AlCr alloys of ca. 10 µm thickness on steel substrate, deposited at −5 mA cm−2 (a,c) and −15 mA cm−2 (b,d) from [EMIm]Al2Cl7–10Cr (a,b) and [EMIm]Al2Cl7–50Cr (c,d).
Metals 13 00377 g001
Figure 2. Cr content of the AlCr deposits (EDS) vs. current density for [EMIm]Al2Cl7–10Cr (■) and [EMIm]Al2Cl7–50Cr (). The dashed lines are just for eye-guidance and have no physical meaning.
Metals 13 00377 g002
Figure 3. Photographs of AlZn coatings on steel with increasing Zn content (left to right: 3.0 wt% and 23.4 wt%) and SEM images of AlZn alloys on steel substrate, deposited at −5 mA cm−2 (a,c) and −15 mA cm−2 (b,d) from [EMIm]Al2Cl7–10Zn (a,b) and [EMIm]Al2Cl7–50Zn (c,d).
Metals 13 00377 g003
Figure 4. Zn content of the AlZn deposits (EDS) vs. current density for [EMIm]Al2Cl7–10Zn (■) and [EMIm]Al2Cl7–50Zn (). The dashed lines are just for eye-guidance and have no physical meaning.
Metals 13 00377 g004
Figure 5. Photographs of AlSn coatings on steel with increasing Sn content (left to right: 0.3 wt% and 15.2 wt%) and SEM images of AlSn alloys on steel substrate, deposited at −5 mA cm−2 (a,c) and −15 mA cm−2 (b,d) from [EMIm]Al2Cl7–10Sn (a,b) and [EMIm]Al2Cl7–50Sn (c,d).
Metals 13 00377 g005
Figure 6. Sn content of the AlSn deposits (EDS) vs. current density for [EMIm]Al2Cl7–10Sn (■) and [EMIm]Al2Cl7–50Sn (). The dashed lines are just for eye-guidance and have no physical meaning.
Metals 13 00377 g006
Figure 7. (a) Tafel plots of AlCr (), AlZn (), AlSn () as well as Cd () and steel substrate (▬) as reference (0.1 mV s−1, 3.5 wt% NaCl, 25 °C) and (b) corrosion potential vs. concentration of Cr (), Zn () and Sn () in binary Al alloys and comparison to the corrosion potential of the steel substrate (black area), Cd (orange area) and sacrificial anode materials Al40 and Al60 (blue area). The dashed lines are just for eye-guidance and have no physical meaning. The black arrow marks the corrosion potential of the Al alloys for c(X) = 0.
Metals 13 00377 g007
Figure 8. Time to red rust in neutral salt spray test (, red) and environmental exposure test (scratch: , green; whole surface: , purple) for uncoated steel substrates and steel coated with Al, AlCr, AlZn, and AlSn. The values for the environmental exposure represent the time to a red rust coverage of 5%.
Metals 13 00377 g008
Figure 9. Red rust coverage over time of steel sheets without coating () and with Al (●), AlCr (), AlZn () and AlSn coating (♦) for (a) the scratched area and (b) the whole sample surface. The lines represent the respective qualitative trend lines of the red rust coverage over time. The horizontal dashed lines (- - -) mark a red rust coverage of 5%.
Metals 13 00377 g009
Table 1. Elemental composition of the steel substrates (1.7734.4) in wt% based on the material data sheet.
CMnSiPSAl
0.071.600.15<0.015<0.0100.020
0.152.100.300.050
TiCrBMoVFe
0.0100.500.00150.100.12balance
0.0501.000.00400.300.20
Table 2. Elemental composition of 40Al and 60Al in wt% according to supplier.
TypeFeCuMnZnTiInAl
40Al0.084<0.0010.2232.940.0360.028balance
60Al0.1300.0010.3373.830.0330.035Balance
Disclaimer/Publisher’s Note: The statements, opinions and data contained in all publications are solely those of the individual author(s) and contributor(s) and not of MDPI and/or the editor(s). MDPI and/or the editor(s) disclaim responsibility for any injury to people or property resulting from any ideas, methods, instructions or products referred to in the content.