Article

Fatigue-Damage Initiation at Process Introduced Internal Defects in Electron-Beam-Melted Ti-6Al-4V

by
Robert Fleishel
1,*,
William Ferrell
2 and
Stephanie TerMaath
1
1
Mechanical, Aerospace, and Biomedical Engineering, University of Tennessee, Knoxville, TN 37996, USA
2
Material Science and Engineering, University of Tennessee, Knoxville, TN 37996, USA
*
Author to whom correspondence should be addressed.
Metals 2023, 13(2), 350; https://doi.org/10.3390/met13020350
Submission received: 7 January 2023 / Revised: 3 February 2023 / Accepted: 6 February 2023 / Published: 9 February 2023
(This article belongs to the Special Issue Deformation, Fracture and Microstructure of Metallic Materials)

Abstract

:
Electron Beam Melting (EBM) is a widespread additive manufacturing technology for metallic-part fabrication; however, final products can contain microstructural defects that reduce fatigue performance. While the effects of gas and keyhole pores are well characterized, other defects, including lack of fusion and smooth facets, warrant additional investigation given their potential to significantly impact fatigue life. Therefore, such defects were intentionally induced into EBM Ti-6Al-4V, a prevalent titanium alloy, to investigate their degradation on stress-controlled fatigue life. The focus offset processing parameter was varied outside of typical manufacturing settings to generate a variety of defect types, and specimens were tested under fatigue loading, followed by surface and microstructure characterization. Fatigue damage primarily initiated at smooth facet sites or sites consisting of un-melted powder due to a lack of fusion, and an increase in both fatigue life and void content with increasing focus offset was noted. This counter-intuitive relationship is attributed to lower focus offsets producing a microstructure more prone to smooth facets, discussed in the literature as being due to lack of fusion or cleavage fracture, and this study indicates that these smooth flaws are most likely a result of lack of fusion.

1. Introduction

Electron Beam Melting (EBM), also referred to as Selective Electron Beam Melting (SEBM) or electron beam powder bed fusion (E-PBF), is a common powder-bed-based additive manufacturing (AM) technology for the fabrication of metallic parts [1,2,3,4]. To manufacture a part, metallic powder is spread over a baseplate. Then an electron beam, generated via a tungsten filament, is used to melt the powder to previously deposited layers or the baseplate in the case of the first layer. EBM is performed in a vacuum, allowing for an elevated chamber temperature higher than that in most selective laser melting (SLM) methods [5,6,7,8]. This higher temperature reduces the need for heat treatment to relieve stress in the components [9]. Other advantages of EBM include deep penetration and low reflection into the powder, a high melt rate, low internal stress, energy efficiency, high packing density of parts, and the ability to build parts with no or limited support. In particular, Ti-6Al-4V, a widely used titanium alloy in its wrought form, has seen extensive application in EBM manufacturing.
Depending on process settings and conditions, the EBM process can produce parts containing varying defect types and distributions. It is established that fatigue life in metallic materials can be influenced by such microstructural attributes due to free surface and stress concentration effects [10]. Therefore, the phase transformations and generation of defects during the EBM process for titanium alloys have been previously investigated [5,7,11,12,13,14]. These studies identified common defect types, including voids and incomplete melting and/or fusion of powder (lack of fusion). Voids are formed due to trapped gas caused by gas release during the powder melting (gas pores) or trapped gas at the beam tip during high intensity (keyhole pores). An additional defect type, smooth facets [15,16], have been observed on fracture surfaces in multiple studies and are typically attributed to brittle fracture across similarly oriented grain boundaries. Increases in defect generation and porosity were linked to deviations of individual processing parameters from optimal values and decreasing electron beam energy density. Beam energy density is a measure of the beam power acting on a unit of area on the part surface [17]. Beam energy density is thus affected by the beam power, scanning speed, hatch spacing, and beam width.
Fatigue testing of EBM Ti-6Al-4V has been previously conducted through stress-based fatigue testing [7,15,16,18,19,20], linear elastic fracture mechanics crack-growth-rate testing [11,21], and short crack analysis [18]. The investigations typically focused on optimizing material performance through process-parameter settings. These studies generally noted that the fatigue performance of EBM Ti-6Al-4V is influenced by both the defect population and changes in microstructure due to varying processing conditions. All of the common types of defects previously listed were identified as potential fatigue-damage-initiation sites. Lack of fusion and smooth facet defects were shown to be reduced or eliminated with optimized processing conditions. Therefore, gas and keyhole pores were identified as the primary defects of concern in dictating the material’s fatigue performance and were the focus of most studies.
As a result, lack of fusion and smooth-facet defects are not as well characterized, even though their presence may significantly reduce fatigue life. Fatigue specimens containing smooth facet flaws have been found to result in lower fatigue lives, such as outliers in fatigue data sets [16], with large flaws being particularly harmful [14,22,23]. Un-melted powder and smooth facets are probabilistically less likely to result from optimized fabrication than gas or keyhole pores. However, these defects can occur due to processing deviations or aleatoric uncertainty, requiring the inclusion of their effects on fatigue life in damage-tolerance analysis, material qualification, and part certification.
Therefore, the objective of this paper is to intentionally induce these less characterized defects generated by the EBM of Ti-6Al-4V and investigate their effects on fatigue life. While the primary objective is to evaluate the reduction in fatigue life due to these larger and less common defects, the relationship of defect morphology to material failure is also explored. Specimens were printed, using EBM, under three different focus offsets (FOs) that are outside the range of typical printing. The FOs were selected to produce the less common defects of un-melted powder and smooth facets. Stress-controlled fatigue testing was performed to populate an S-N graph. Micrograph characterization and fractography of failed specimens provided information on the microstructural defects and crack-initiation sites.

2. Materials and Methods

2.1. Material Information

Ti-6Al-4V is a classic alpha/beta dual-phase titanium alloy with widespread engineering applications, particularly in aerospace. Extensive characterization of Ti-6Al-4V has been performed in the past decade for process and material development specific to the EBM process [12,15,18,19,21,24,25,26] and is the material investigated in this study due to its prevalent use.

2.2. Defect Generation

Defect generation in EBM is strongly influenced by the energy density of the electron beam. Energy density can be controlled by changing the focus offset (FO) of the electron beam, while keeping other processing parameters (such as beam power, scanning speed, etc.) unchanged [13]. The FO alters the current through the electromagnet/coil that the electron beam passes through prior to focusing on the powder layer. Changing the amount of current through this coil magnet offsets the focus plane of the electron beam, effectively changing the beam area and consequently the energy density, melt depth, and melt width [27,28,29,30]. Therefore, a higher FO produces a wider beam and lower energy density. The relationship between FO and thermal distribution, as well as melt pool size, has been modeled [30], as thermal distribution is an important component in printing quality. The FO parameter in this paper will be referred to in units of electrical current (mA). Note that because the effects of this coil are dependent on the machine configuration, such as the number of wraps and the coil gauge, the effects of FO and range for optimal properties are machine dependent.
A change in FO creates differing types and patterns of defect formation that subsequently result in varying material behavior. Lower FOs lead to a smaller beam area and deeper melt depth, and higher FOs lead to a wider beam area and a shallower melt depth (Figure 1). When the FO is low, the spot size is small, leaving the part susceptible to void formation between electron beam passes, as well as a deeper melt pool, which can impact the previously built layers by re-melting them. This deeper melt pool often results in a keyhole-type weld between the layers. If the FO is high, the spot size becomes large, and the melt-pool overlap is reduced. This wide but shallow melt pool typically results in a conduction-type weld between layers of material. In this case, there is a possibility that the melt plane is above some of the un-melted powder. As a result, high FOs have demonstrated significant increases in un-melted-powder defects [13].

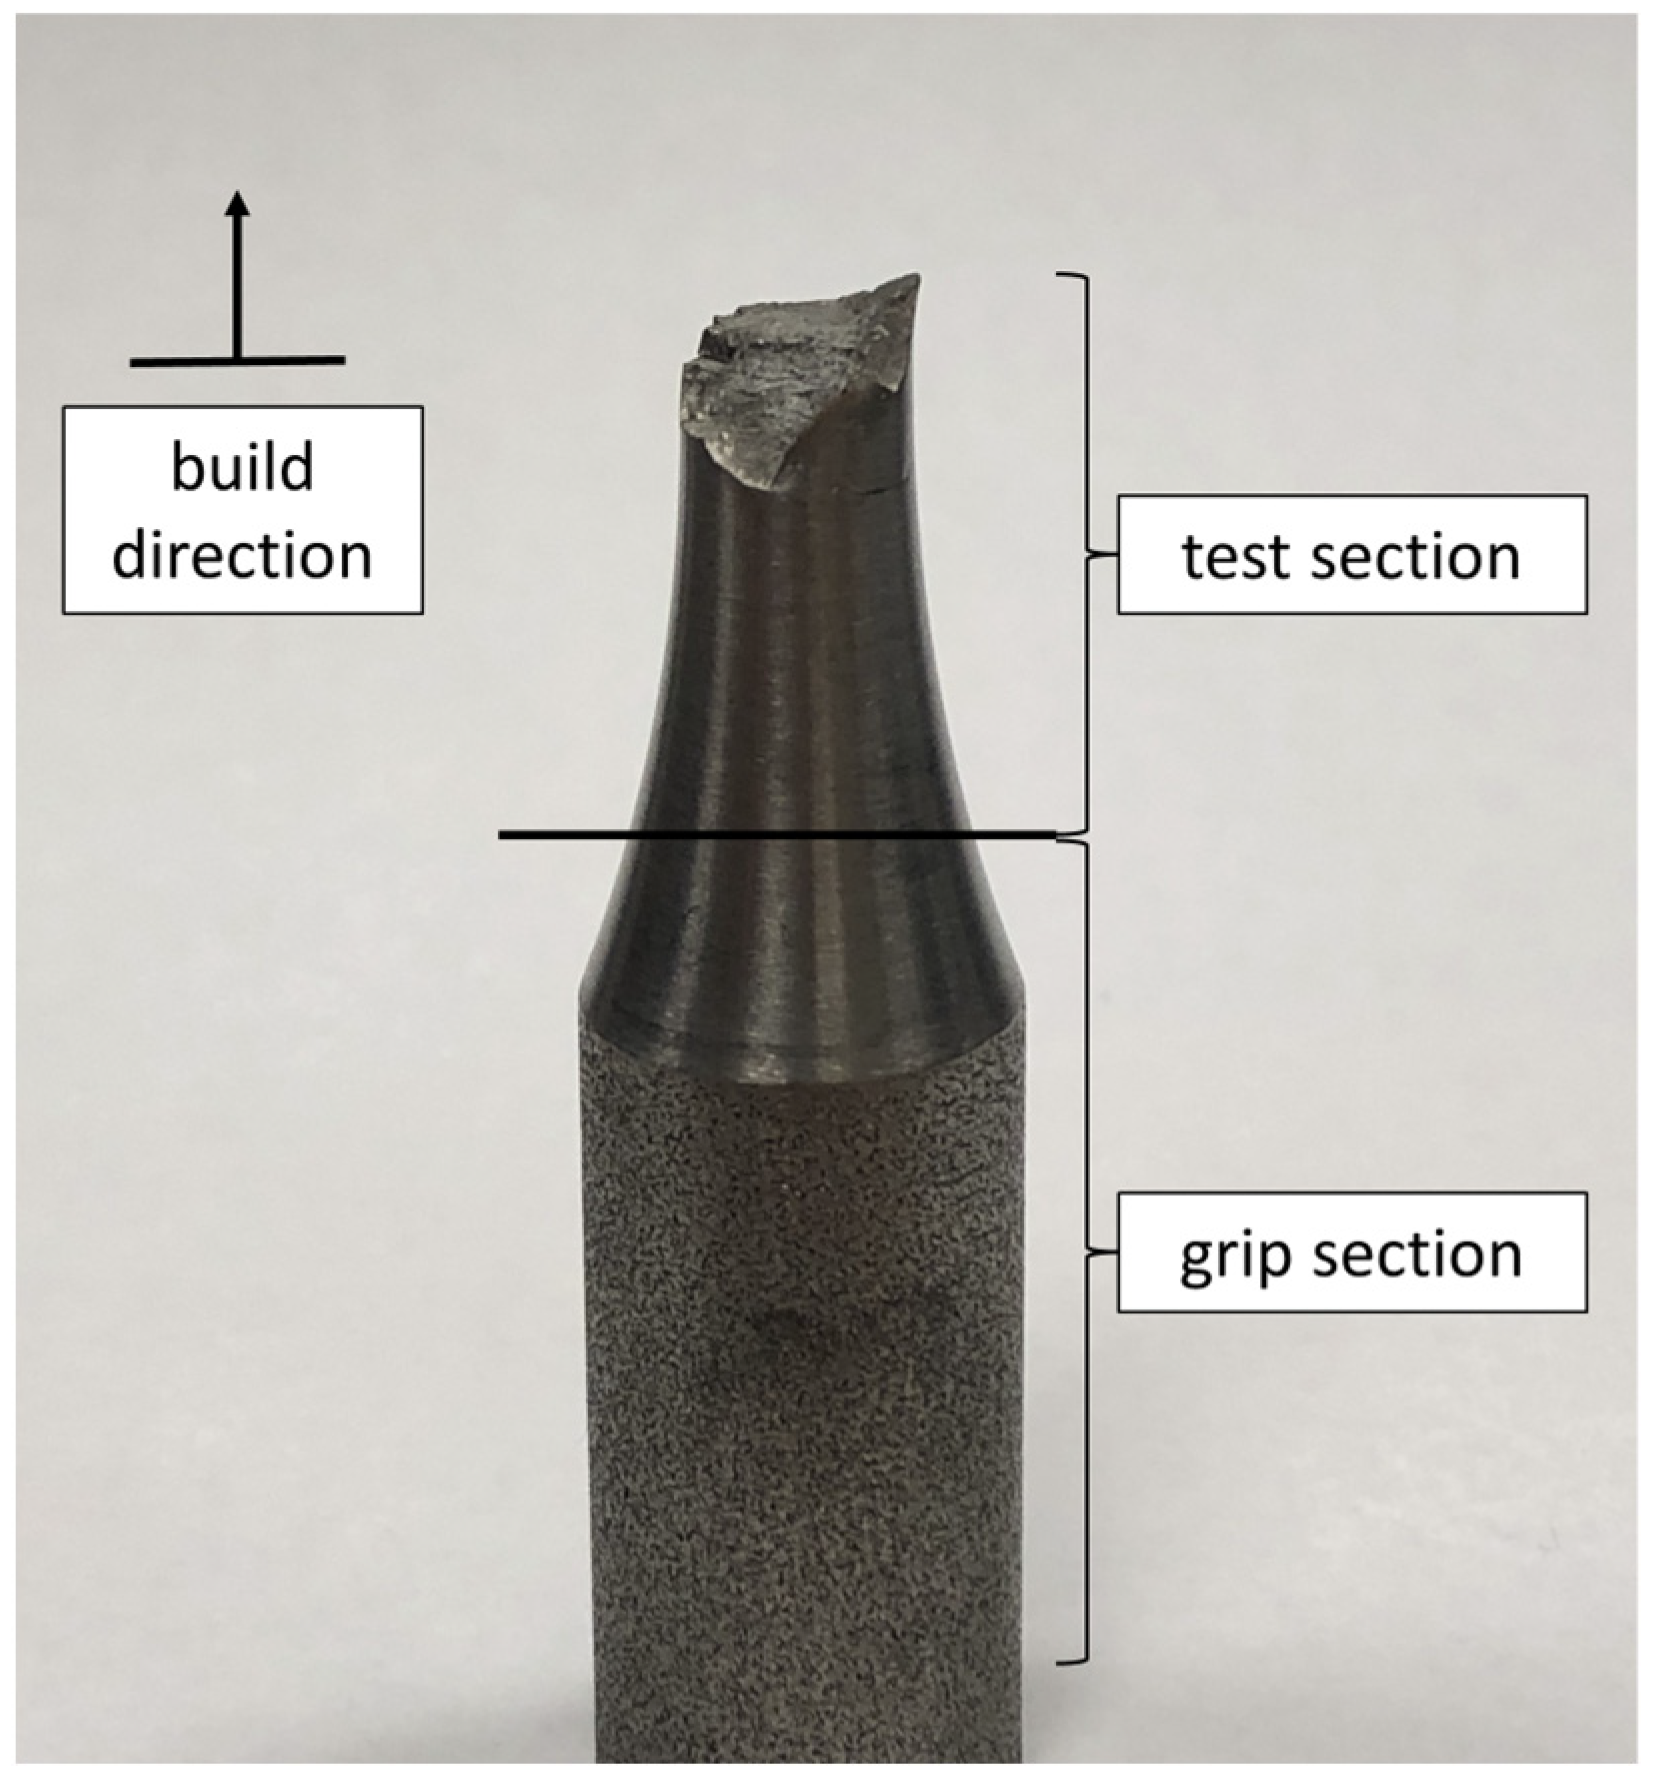
2.3. Fatigue Specimen Preparation

EBM was performed using an ARCAM machine with Ti-6Al-4V powder consisting of a 45–120 µm size distribution. Cylindrical volumes of material with a diameter of 15 mm were fabricated with a vertical build orientation, and all processing parameters other than the FO were kept constant for all specimens. These processing parameters, such as beam power, layer thickness, etc., were proprietary to the material supplier and not provided, as the objective was to investigate the effects of the defects, not their cause. Defects were generated in the material by adjusting the FO in the specimen gauge length to create varying defect sizes and shapes based on melt pool overlap and depth. To induce regions of un-melted powder, relatively high FOs were applied. Cylinders were printed using 36 mA, 44 mA, and 52 mA to form the test section area, and a lower FO was used to print the grip sections of cylinders. None of the cylinders were postprocessed to maintain the as-printed microstructure. Nine cylinders were printed for each FO. Each cylinder was machined via lathe to create a constant radius and reduced area gauge length. The reduced section’s diameter was 7.5 mm, and the machined specimen’s surface finish was left unaltered (Figure 2).

2.4. Mechanical Testing

To determine maximum stress values for the fatigue testing, an additional set of four specimens produced using the 36 mA FO were tested to tensile failure at a load rate of 0.02 mm/s (corresponding to a strain rate of 4% strain/min) to measure material properties. Average tensile testing results for these four specimens were a Youngs’s Modulus of 117.2 GPa, 0.2% offset yield strength of 993 MPa, ultimate tensile strength of 1055 MPa, and an elongation of 8.8% at fracture. The 36 mA EBM specimens in this study are stronger, slightly stiffer, and less ductile than both wrought EBM Ti-6Al-4V and other reported values for EBM Ti-6Al-4V [15].
Stress-controlled fatigue testing was performed using an MTS servo-hydraulic load frame (MTS Systems, Eden Prairie, MN, USA) at a frequency of 10 Hz at room temperature, ambient conditions. ASTM E466 was used in conducting the testing. Specimens were tested to failure, using a load ratio of R = 0.05 at 344.7 MPa, 379.2 MPa, and 413.7 MPa maximum stress levels. Due to a testing error, all specimens printed at 36 mA were tested at 413.7 MPa. The first groups of specimens were tested at 413.7 MPa based on the tensile test results. This value was chosen as slightly less than half of the yield strength. The original testing plan was to then increase this stress for the next group of specimens. Given the failure at relatively low numbers of cycles for all FOs, it was decided to instead lower the maximum stress for the other two testing levels.

2.5. Fracture and Microscopy

Scanning electron microscopy (SEM) (Zeiss Auriga, Oberkochen, Germany) was performed to analyze the fracture surface, identify and view fatigue initiation sites, and characterize crack propagation. The number of damage-initiation sites and large flaws on the fracture surfaces, which were large enough to be visible to the eye, were counted on fracture surfaces, using a 3× magnifying glass. Micrographs were taken by sectioning the specimen below the fracture surface after fatigue testing. Sections were polished with 120 to 1200 grit polishing paper under constant fluid coolant with a final 0.5-micron alumina slurry to obtain the desired polished finish. Micrograph specimen surfaces were etched at room temperature, using a solution of 1% ammonium bifluoride for 60–90 s. These specimens were then analyzed through an SEM or optical microscope (Zeiss Axio Observer -A1, Oberkochen, Germany) to determine the relative porosity to correlate the microstructure characteristics to failure mechanisms.

3. Results

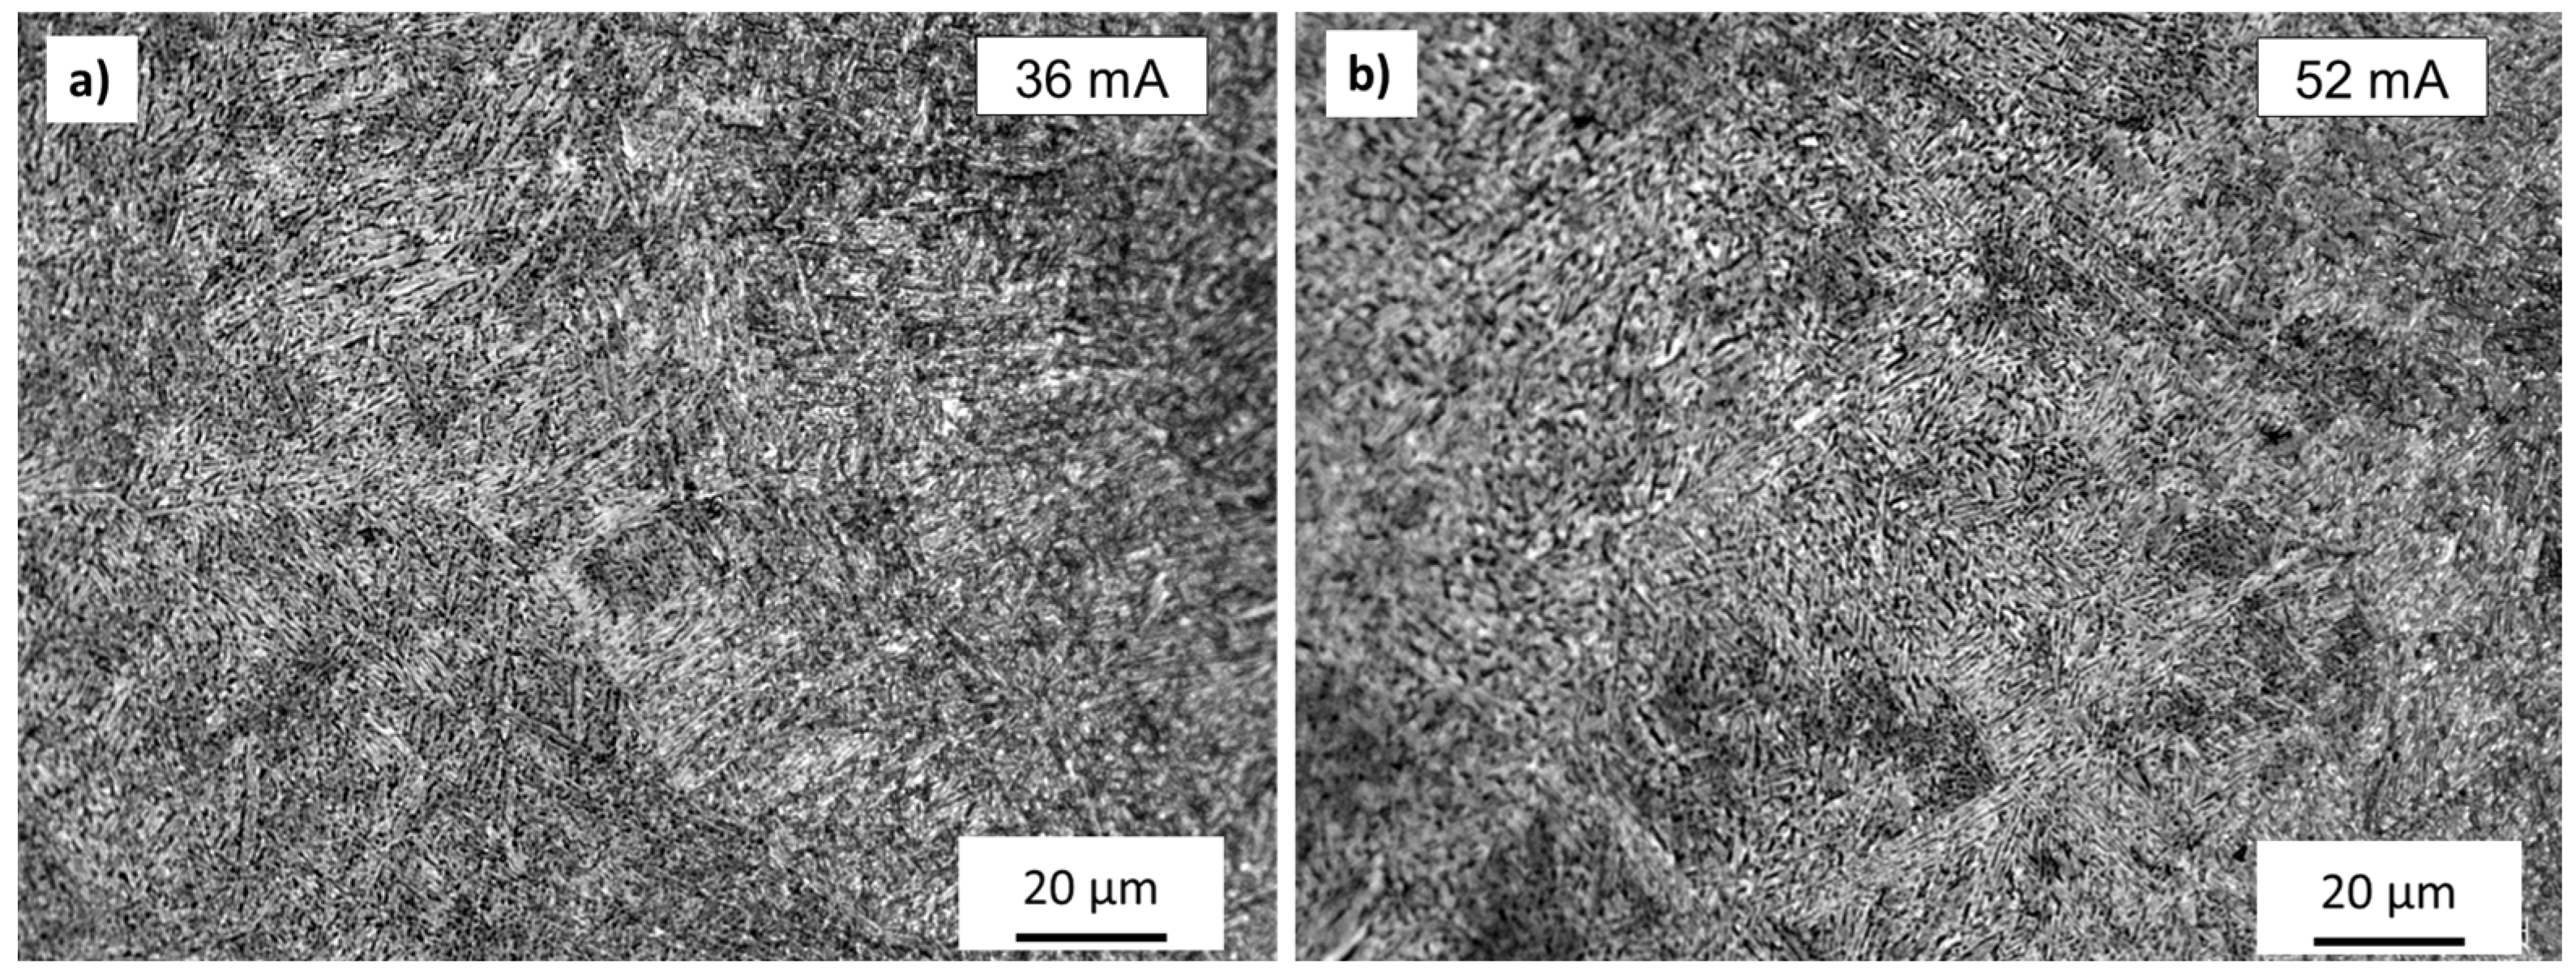
3.1. Micrographs, Microstructure, and Voids

Micrographs for each FO group were taken after etching to observe the microstructure (Figure 3). Microstructures primarily consisting of fine acicular alpha grains [31,32] were observed for all FO groups, indicating a relatively fast cooling rate for all specimens. Regions of high aluminum content (lighter color) and low aluminum content (darker color) were also observed.
SEM imaging of polished sections after fatigue testing showed voids and porosity in all material groups. The voids observed on polished sections were categorized into two groups based on their size: large regions of un-melted powder (Figure 4a) and smaller voids, referred to as microvoids, due to either gas release or lack of fusion between fully melted material (Figure 4b). The size of the regions of un-melted powder were larger, ranging from 100 µm to 450 µm across, compared to the microvoids, which were typically in the range of 2–20 µm across. Lack of fusion voids were present in all material groups. These un-melted powder regions exhibited rough edges due to the un-melted particles and were observed on fracture surfaces across FOs, though their average size and quantity varied. The smooth facets observed on the fatigue-fracture surfaces were not present in the micrographs, though this could be due to the planar nature of the facets being parallel to the direction of sectioning, thus being less likely to appear in the material sections.
The observed microvoids are either the result of trapped argon gas caused by the atomization process or small regions of lack of fusion [33]. The gas pores observed were relatively smooth, with a spherical or elliptical shape, whereas the microvoids attributed to a lack of fusion were more elongated and potentially contained a rough edge similar to those seen in the un-melted powder regions. In a prior study [12], gas pores were observed in EBM Ti-6Al-4V in the range of 5–200 µm, using computed tomography (CT). The gas pores observed in this study were smaller, though this could be attributed to the section imaging used in this study versus the CT method used in the comparison study or the result of different processing parameters. Larger gas pores were not seen in these micrographs, and little evidence of larger gas pores was identifiable on the specimen fracture surfaces.
The microdefects were orders-of-magnitude smaller and much more frequent than the large voids comprising the un-melted powder regions. The frequency of both types of small voids relative to each FO was quantified as the number of voids per mm2 observed on the micrographs for each specimen. Both the average number of microvoids per unit area and the standard deviation across specimens were calculated for each FO group. The results are provided in Table 1. The total number of microvoids per unit area was quantified, as well as the number attributed to the specific type of microvoid (gas pore or lack of fusion). It should be noted that the number of voids per unit area is provided, not to be confused with a percent porosity measurement.

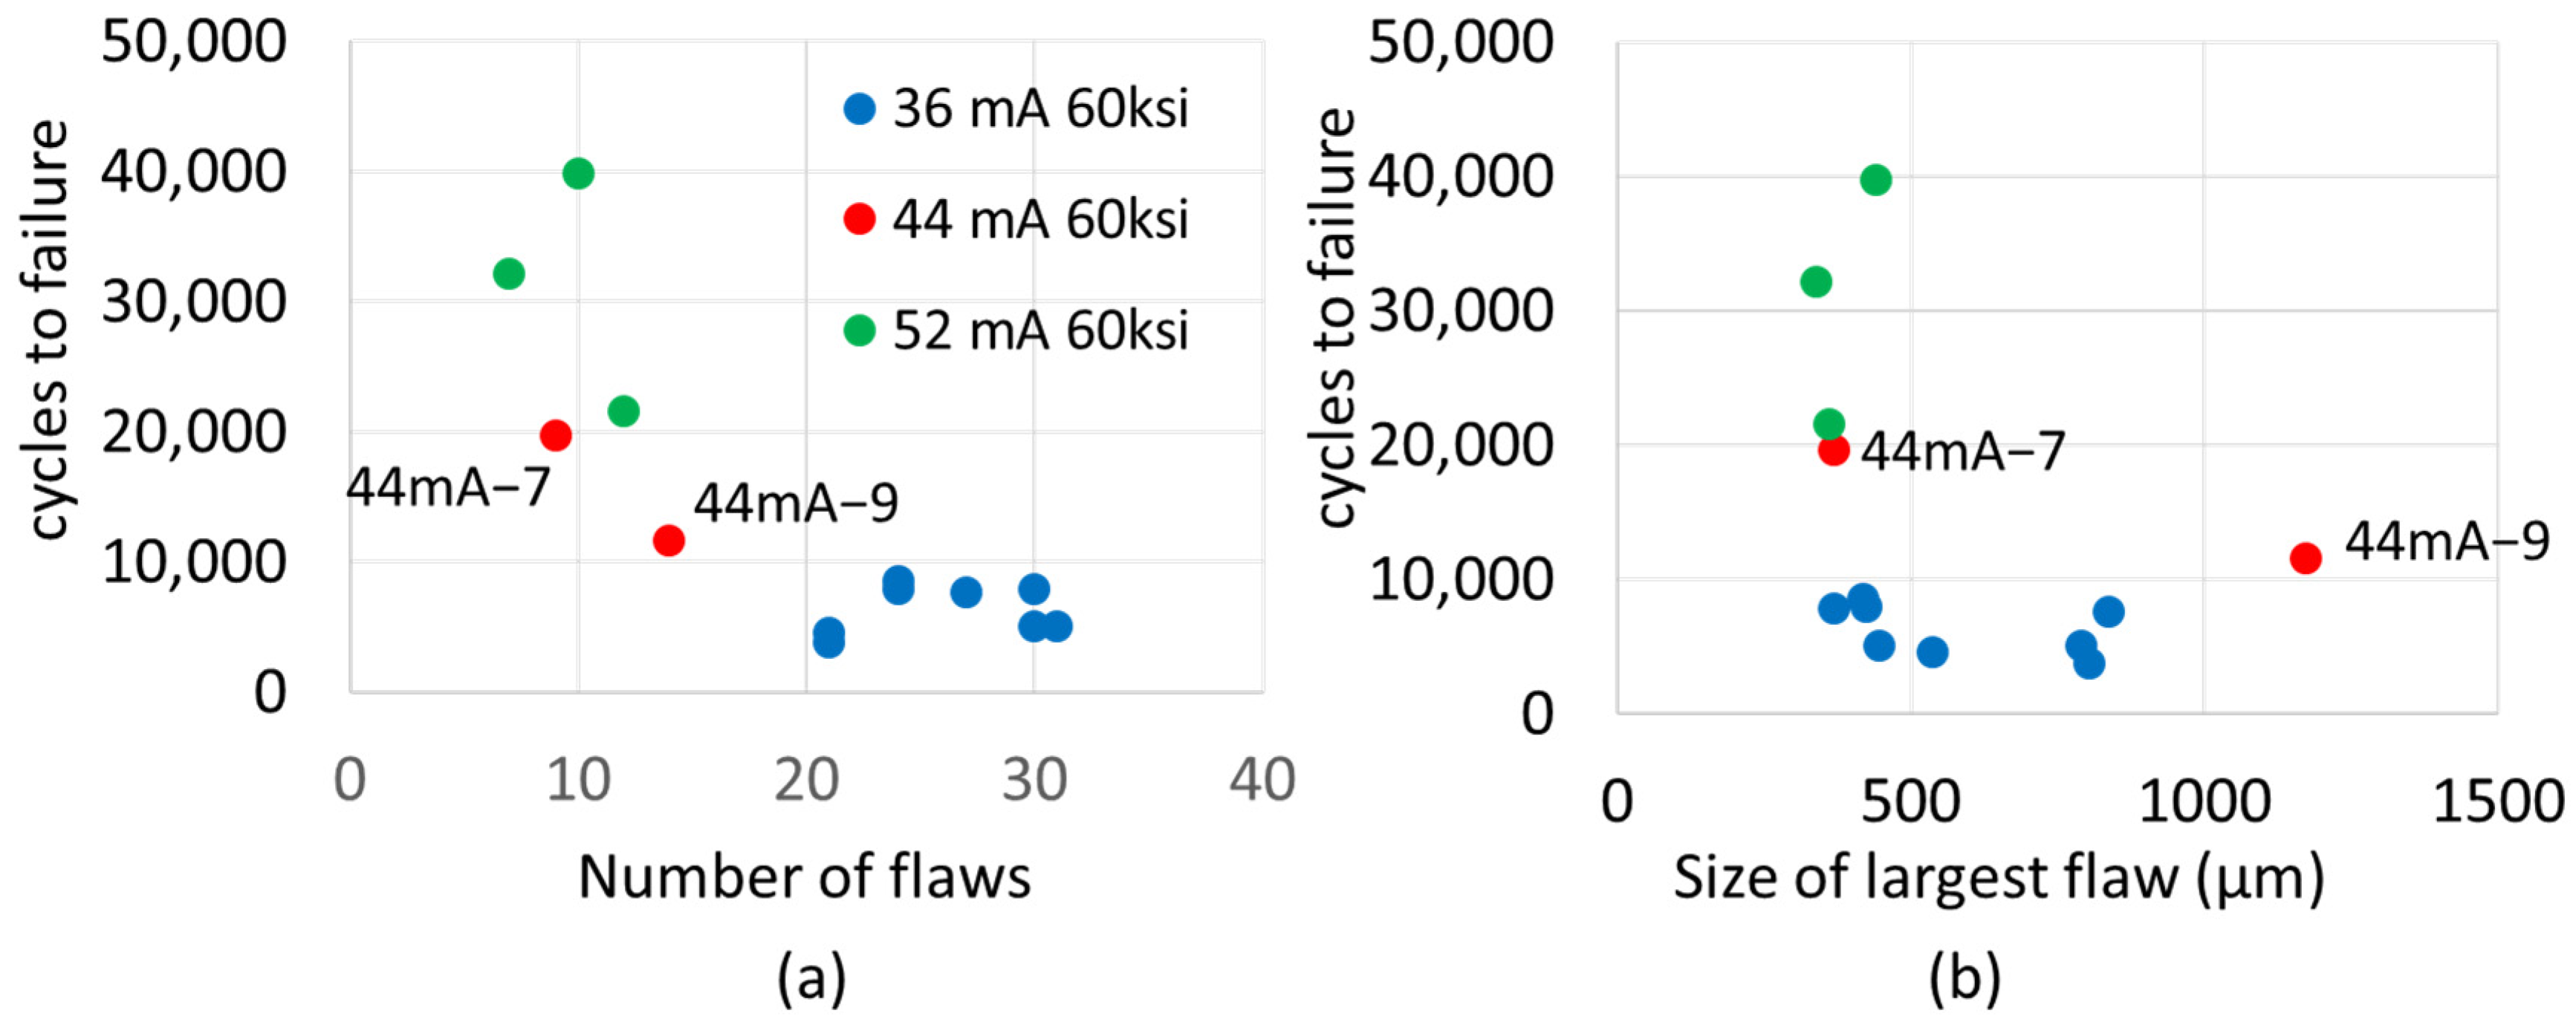
3.2. Fatigue Testing Results

Three specimens in the 44 mA and 52 mA FO groups failed early on in the fatigue test (at 8 and 10 cycles, at 413.7 and 379.2 MPa, respectively for the 44 mA FO specimens and 17 cycles at 379.2 MPa for the 52 mA FO specimen). Failure occurred outside of the gauge length at the interface between the test section material and the grip material. One specimen in the 44 mA group was tested at an incorrect maximum stress due to a machine error. These four specimens were excluded from the analysis.
The valid fatigue testing results exhibited a typical trend for this material, with cycles to failure (N) decreasing with increasing maximum applied stress (S), roughly linearly in maximum stress vs. log(n) (Figure 5). Statistical information for the FO groups at each maximum stress level is provided in Table 2. The average fatigue life increased with FO at the 413.7 MPa and 379.2 MPa maximum stress levels. Identification of a similar trend at the 344.7 MPa maximum stress level is inconclusive due to the limitation of only one valid specimen at the 44 mA FO and none at the 36 mA FO. At the 52 mA FO, two of the specimens failed at nearly identical values of 52,895 and 53,580 cycles to failure, and the third specimen failed at 97,948 cycles. Meanwhile, the 44 mA specimen failed at 75,451 cycles, splitting the difference between the 52 mA FO values. Given the limited number of specimens, there are not enough data points to reasonably conclude a trend at the lowest stress level. These observations are discussed relative to defect type in the discussion section.

3.3. Fracture Surface Defect Classification

The imaging of the fatigue fracture surfaces showed similar types of porosity and defects on the fracture surfaces of all three FO groups, though there was an observed difference in the number of potential damage-initiation sites between FO groups. Defects were characterized into three categories, with examples of each displayed in Figure 6. Several sites contained multiple defect types/classifications. Representative examples are presented in the discussion section.
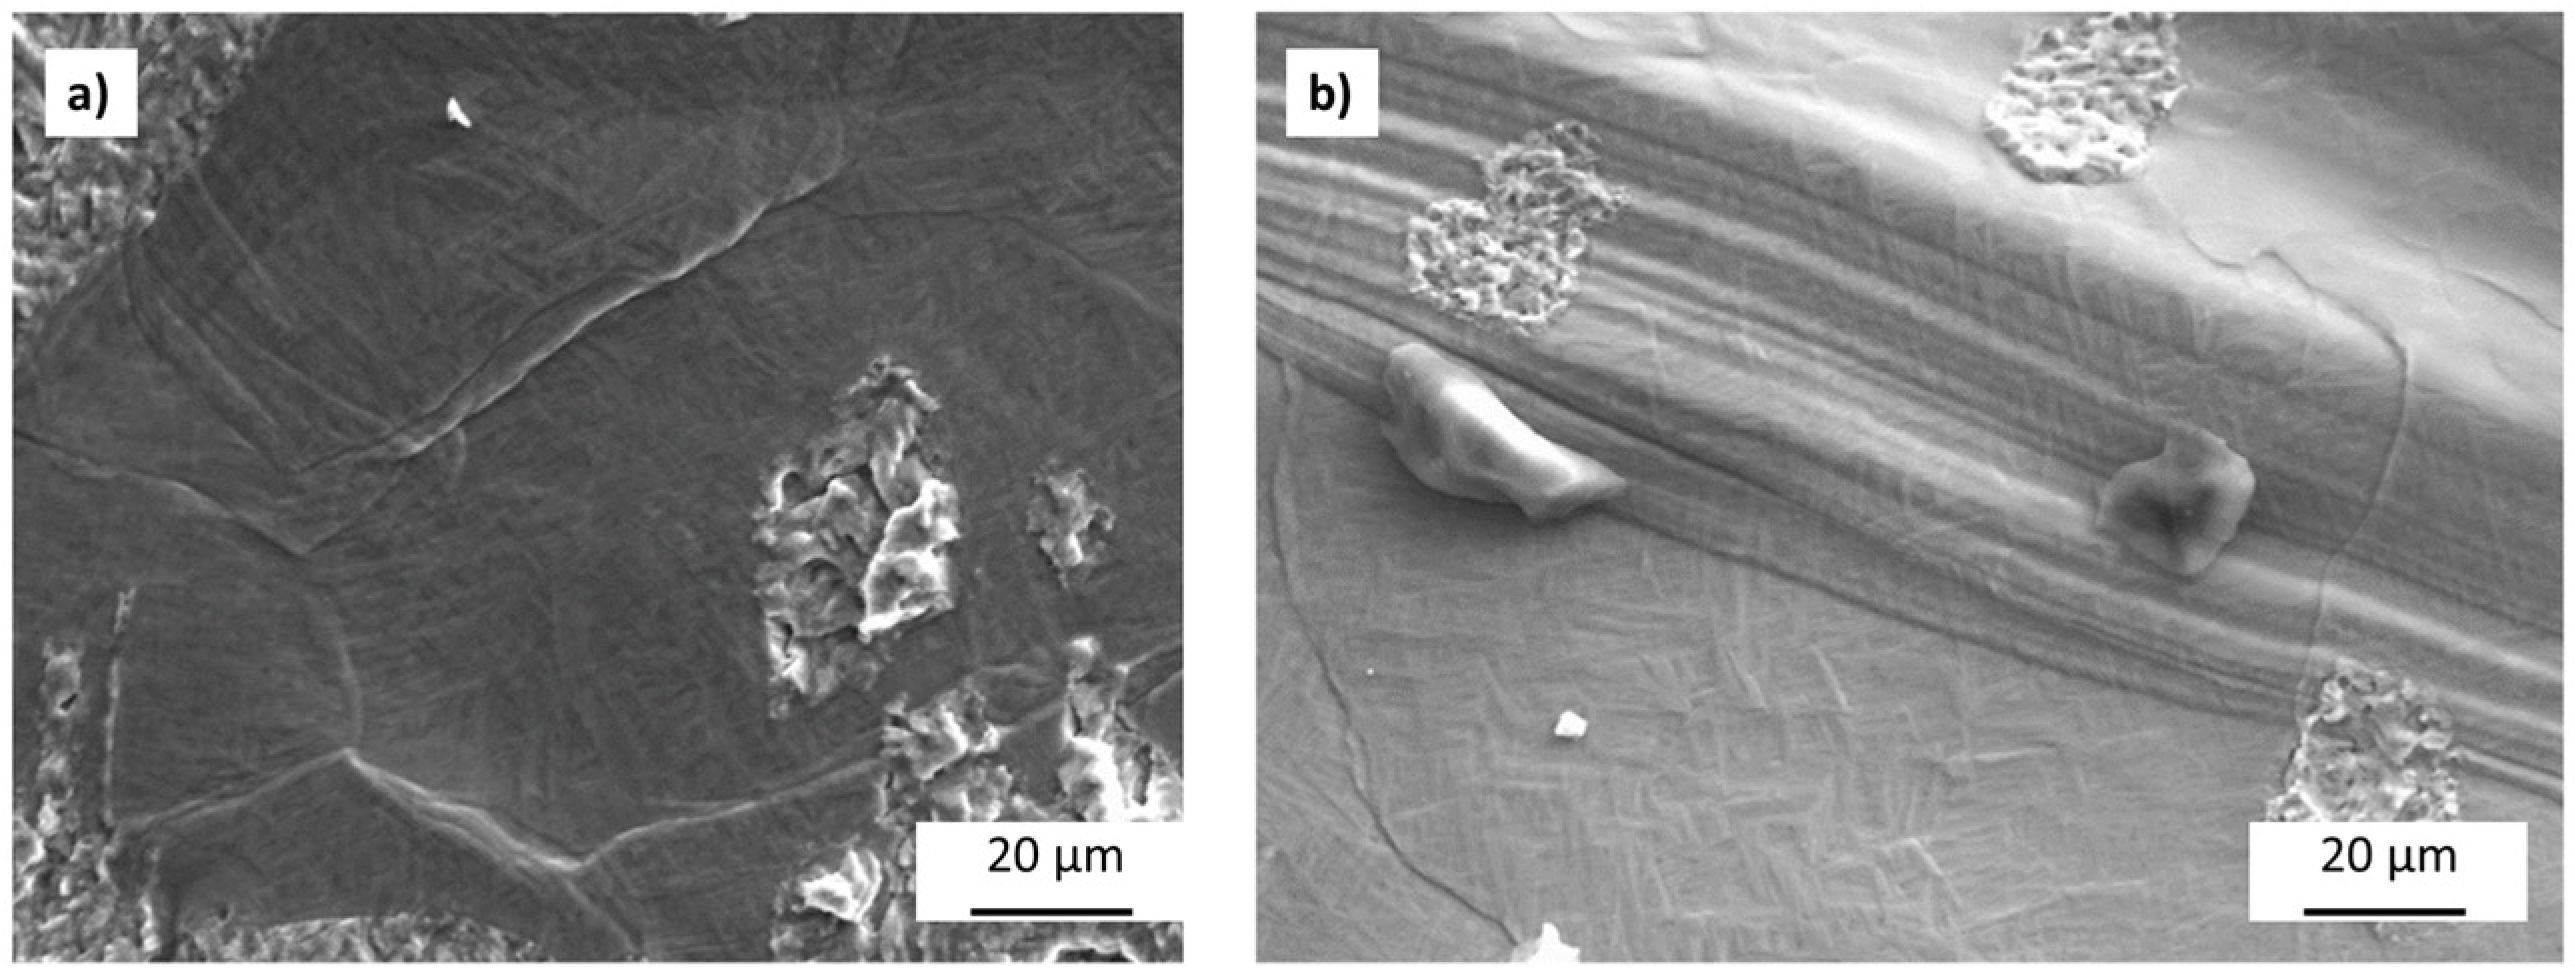
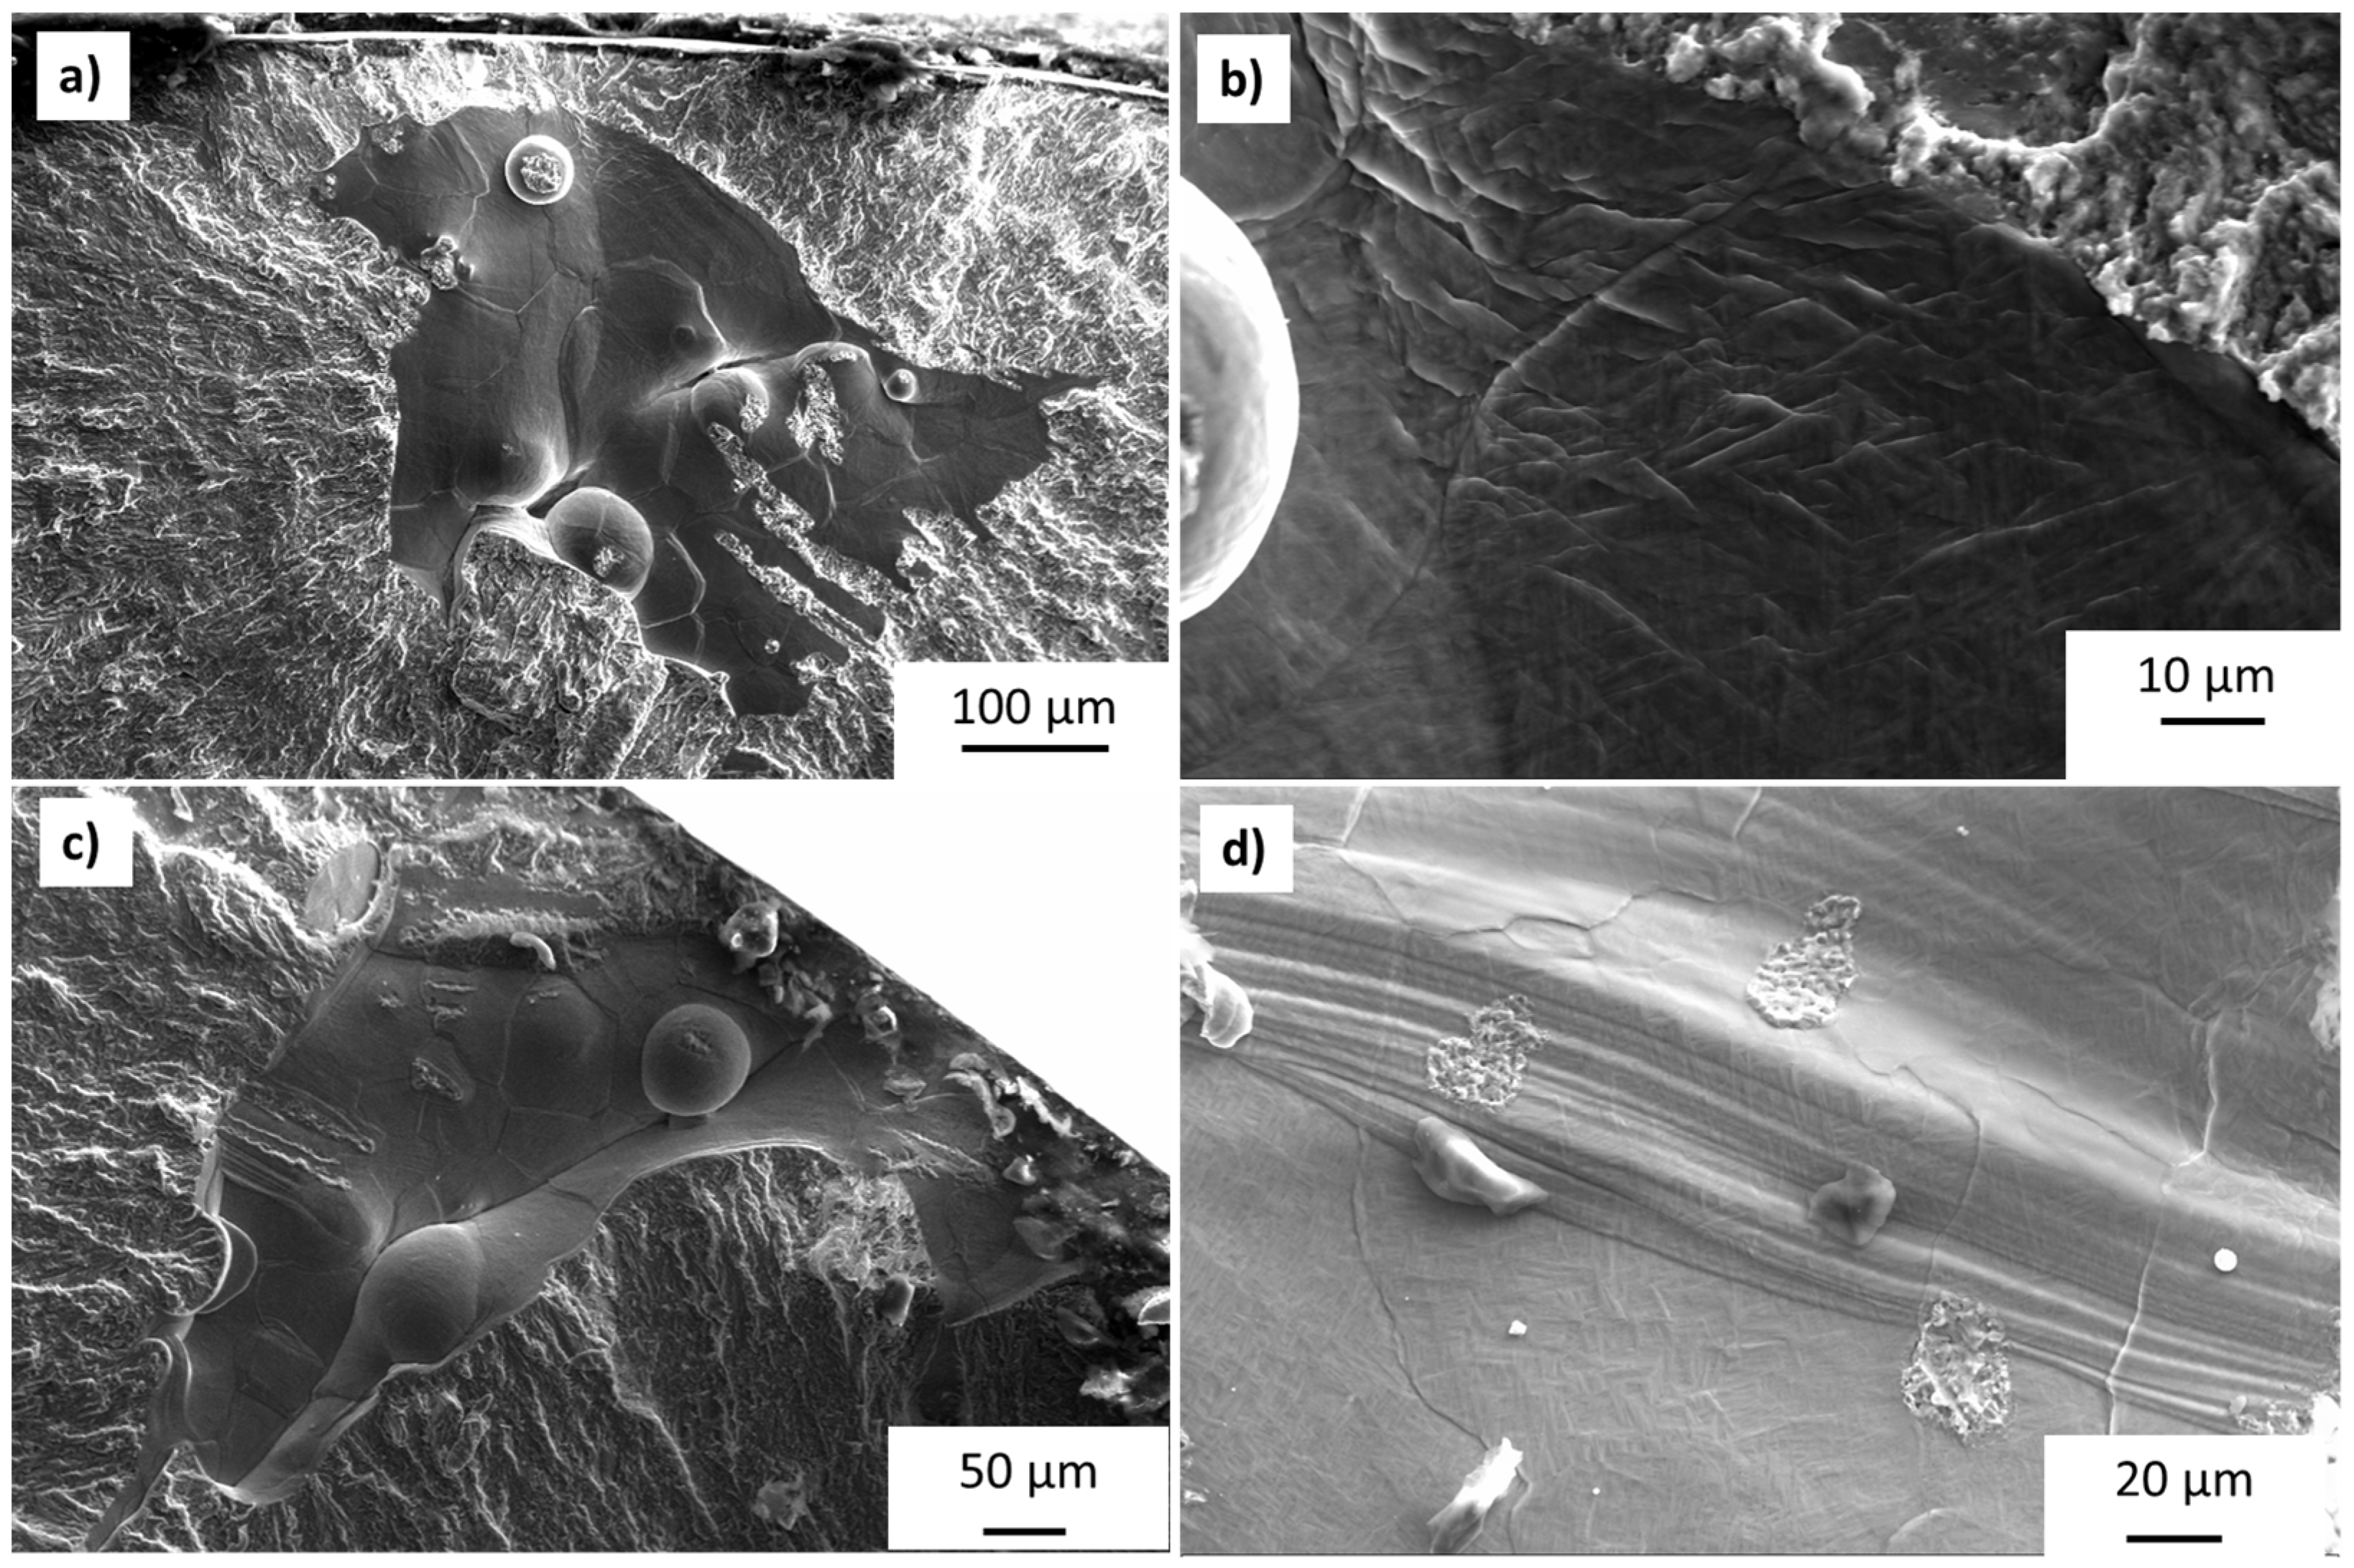
  • Deep un-melted powder (Figure 6a): Defects due to the incomplete melt of powder and lack of fusion, where remnants of spherical powder are clearly observed.
  • Smooth facets (Figure 6b,c): Smooth flaws that lack clear spherical powder remnants, appearing as outlines, potentially due to semi-fused powder or some microstructural feature, such as grain boundaries, are present. An additional texture of parallel lines running across the flaws is also observed on some facets (Figure 6c). Higher magnification of the surface texture on these flaws is shown in Figure 7.
  • Gas pores (Figure 6d): Round flaw formed by gas release during the melt process.
While defects on the fracture surfaces were relatively easy to categorize based on visible features, classifying and describing their formation is more difficult. Un-melted powder (Figure 6a) and gas-pore defects (Figure 6d) can easily be attributed to an incomplete melting of powder and lack of fusion and gas release, respectively. Both defect types are well documented in the EBM Ti-6Al-4V literature previously discussed. Fracture surface defects similar to the smooth flaws in this study, both with surface lines [16,19,34] and without surface lines [15,34], have been observed in other studies of fatigue of EBM Ti-6Al-4V. The cause of these type of defects has been attributed to multiple mechanisms, primarily either from lack of fusion [19,34] or due to cleavage fracture [16,35]. Cleavage fracture is suggested to occur by quasi-cleavage along grains or similarly oriented grain colony boundaries loaded perpendicularly to their basal plains. The observed smooth facets occurred in a variety of locations within the specimens, both near the surface and close to the center in a variety of shapes. These smooth facets created a shiny region in the fracture surface. Smooth facets were present on the vast majority of specimen fracture surfaces, often in multiple locations, and were most prevalent in the 36 mA set.

3.4. Fracture Surface Observations and Trends

Failure generally appeared to initiate at regions where un-melted powder and/or smooth facets were present. Some evidence of gas pores was also present on the fracture surfaces, but these flaws were significantly smaller and less common than those due to un-melted powder or smooth defect failure and deemed less impactful to fatigue failure for the material used in this study. The average number of defects observed with a 3× magnifying glass and the average largest flaw size in each FO are provided in Table 3. Histograms displaying the distribution of the number of flaws and largest flaw diameter observed on each specimen’s fracture surface are shown in Figure 8. While no significant difference is discernible between the 44 mA and 52 mA groups in terms of number of flaws, by comparison, the lower 36 mA group is distinguished by a substantially higher number of flaws per fracture surface. Other than the two outliers, there is no notable statistical difference for the size of the largest flaws on fracture surfaces across all groups. The specimen numbers for the outliers are identified on Figure 8b for further discussion.

4. Discussion

4.1. General Trends

The most easily observable and initially surprising trend observed in the fatigue-testing data is that fatigue life appeared to increase with increasing FO, contrary to a previous study [13], wherein the higher energy density of lower FOs was shown to exhibit a lower defect formation. Two potential explanations for this difference are the number of optically observable flaws present (Figure 9a) and the type of flaws on the fracture surfaces (Table 4). For the relationship between the number of initiating flaws on the fracture surface versus fatigue life, a general negative relationship is clear. This correlation was also established by Tammas-Williams [16], who concluded that close proximity between defects could increase stress concentrations, thus increasing the potential for crack nucleation. A greater number of defects increases the probability of defects in close proximity. However, it is difficult to claim that the number of flaws was the primary factor in fatigue resistance because of the lack of a trend within individual FO groups. This is most clearly seen in the 36 mA data, where there is minimal variation in fatigue life even with a large change in the number of fatigue-initiating flaws. Additionally, the fatigue life is separated by FO groups. However, this observation may be due to other interacting factors, such as the flaw type and location.
Therefore, in addition to the number and size of flaws present on the fracture surfaces, we investigated trends in the types of defects present on the fracture surfaces of each group to explain the difference in fatigue lives. The prevalence of different types of flaw classifications in each FO group is shown in Table 4. Evidence of each type of flaw is present in each group, with relatively uniform occurrence across all FO groups, except for smooth facets with surface lines, which were much more prevalent in the 36 mA group than in the 44 mA or 52 mA groups, potentially contributing to the lower fatigue life of the 36 mA group. A prior study by Rafi [15] also noted such smooth facets at fracture-initiation sites. There is, however, limited evidence in the statistics to explain the difference in fatigue lives between the 44 mA and 52 mA sets.
To explore this difference, the fracture surfaces for the 44 mA specimens tested at 413.7 MPa that exhibited lower fatigue lives than their 52 mA counterparts (Figure 9) are provided in Figure 10. Both specimens contained smooth facet flaws with surface lines, and these flaws are on or near the specimen surfaces. It is well established in the literature that pores near the surface shorten the fatigue life of specimens produced by both EBM and SLM [16,36,37,38,39,40]. Moreover, Xu et. al. [41] demonstrated the increase in stress concentration caused by pores within one diameter of the specimen surface relative to internal pores through a finite element study. It is evident from these specimens that these conclusions also pertain to smooth facet flaws. Both factors (flaw type and location) could account for the shortened fatigue life of the 44 mA specimens relative to the 52 mA specimens.
Alternatively, when comparing the fracture surfaces of the 44 mA and 52 mA FO specimens at 344.7 MPa, no significant differences were noted. The number, type, and size of defects were statistically consistent across the specimens of both FO groups. It can therefore be reasonably hypothesized that the difference in fatigue lives among specimens and lack of a trend between groups at this stress level is due to aleatoric scatter. This finding is considered a hypothesis and not a conclusion, as there was only one valid specimen in the 44 mA group. Therefore, there are not enough data points to conclusively state that there are no other material differences between the groups that could cause a difference in fatigue life that would be noticeable with more data.
There is no conclusive trend relative to the size of the largest flaw vs. fatigue life in general (Figure 9b). Specimens containing flaws of approximately the same size exhibited substantial variance in fatigue life. When differences did exist between specimens with significantly different flaw sizes, it was not discernible whether flaw size alone dictated the variation in fatigue life. For example, specimen 44mA−9 contained a significantly larger surface flaw than the other 44 mA specimen tested at the same stress level of 413.7 MPa. Specimen 44mA−9 failed at 11,643 cycles relative to specimen 44mA−7, which failed at 19,677 cycles. As discussed in the previous paragraph, both specimens contained a smooth facet with surface lines; however, the smooth facet observed in specimen 44mA−9 was closer to the surface than specimen 44mA−7. There is not enough data to conclusively determine if the difference in fatigue life is due to the flaw being closer to the surface, the flaw being considerably larger, or aleatoric uncertainty. The other outlier, 52mA−4, was tested at 379.2 MPa and failed at nearly the same number of cycles (30,862) as its counterpart specimen 52mA−2 (31,125). Both specimens exhibited similar fracture surfaces with multiple flaws and smooth facet flaws, which seem to be more influential than flaw size. Prior studies have concluded that the flaw area normal to loading is more dominant in shortening fatigue life than the total volume of the flaw [40,42]. From the presented results and prior studies, it appears that flaw type, location, and other factors are more influential than the size of the flaw.
A trend that is notably lacking is that flaws containing deep un-melted powder are not more likely to be present on fracture surfaces of the higher (44 mA and 52 mA) FO groups. This finding is surprising, because regions of un-melted powder have been reported to serve as fatigue-initiation sites and to be more likely to occur in high-FO conditions [15]. Additionally, the prevalence of microvoids due to the lack of fusion was observed at higher FOs. Based on the specimen fracture surfaces, the smaller pores do not seem to influence the cycles to failure of the high-FO groups for the investigated fatigue loadings. Due to the relatively small size and the spherically dominated shape of the pores caused by gas release, these pores may be significant in more dense prints and may pose problems when evaluating the density of the parts [43].

4.2. Classification of Defects

Further interpretation of the results strongly depends on classification of the defects observed on the fracture surface, especially of the smooth facets (Figure 6b,c), due to their prevalence in the 36 mA group, which exhibited the shortest fatigue life. Two types of lack-of-fusion flaws were observed: (1) defects with observable un-melted powder and (2) fully melted material in layers above and below the facet, resulting in the smooth texture, but with no or weak bonding between layers. As previously mentioned, the two competing explanations for the smooth facets (both with and without a line texture) are either from lack of fusion [14,34] or cleavage fracture [16,35]. An interesting result from the current study is that the highest FO (52 mA) specimens exhibited better fusion and less porosity than those printed at the lowest FO value (36 mA), going against the literature trends [12,15,29] or possibly suggesting that there is an FO value above which the lack of fusion begins to decrease or is less detrimental to fatigue behavior. If the smooth facets are caused by a lack of fusion, the surface lines would be attributed to solidification lines forming as the material cools after melting. This explanation, however, does not explain the higher incidence of surface lines on the smooth facets in the 36 mA group relative to the higher-FO groups. Alternatively, if the smooth facets are attributed to a quasi-cleavage fracture, then the quasi-cleavage of grains is a more important factor in the fatigue resistance of EBM Ti-6Al-4V than void content due to lack of fusion for this set of manufacturing parameters. This could be due to the fact that the FO and other processing parameters used in this study are more likely to produce neighborhoods of grains with the basal plain perpendicular to the applied load. In this case, the surface lines seen on some of the smooth defects would be attributed to steps or changes in the cleavage fracture plane.
A further explanation of the cause of these defects is provided in Figure 11, showing magnified images of some regions of interest near smooth flaws. These images show features of both smooth texture with several un-melted powder beads in and around the flaw (Figure 11a,c). The presence of un-melted particles retaining their spherical shape on the surface is evidence of a lack of fusion. Figure 11d also supports this conclusion, though instead of spherical powder particles, the smooth facet texture (shown with surface lines) is interspersed with regions of ductile fracture. These regions of ductile fracture, with a texture suggesting void coalescence, could be due to particles that partially fused across the smooth flaw. The image in Figure 11b shows a higher magnification of surface texture on smooth facets, revealing a texture similar to the fine acicular alpha microstructure seen in the micrographs. This could be the texture above the melt if the smooth flaw was due to lack of fusion, or it could be the cleavage fracture through the microstructure, pointing to the quasi-cleavage mechanism for the formation of the smooth facet flaws.
Overall, the images present more evidence for a lack of fusion as the source of these flaws, though we cannot completely rule out a cleavage fracture mechanism. Care should be taken in classifying defects of this type in future studies due to the multiple possible explanations. An interesting consequence of this conclusion is the different qualities of these two types of lack of fusion defects; the flaws where beads of powder remain un-melted (described as deep un-melted powder elsewhere in this paper) and the flaws where the material fails to fuse across the melt plane (the smooth flaws). This distinction could explain the increase in the smooth lack of fusion defects and shorter fatigue lives as FO decreases in this study, with the smoother flaws containing less free space while still weakening the material.

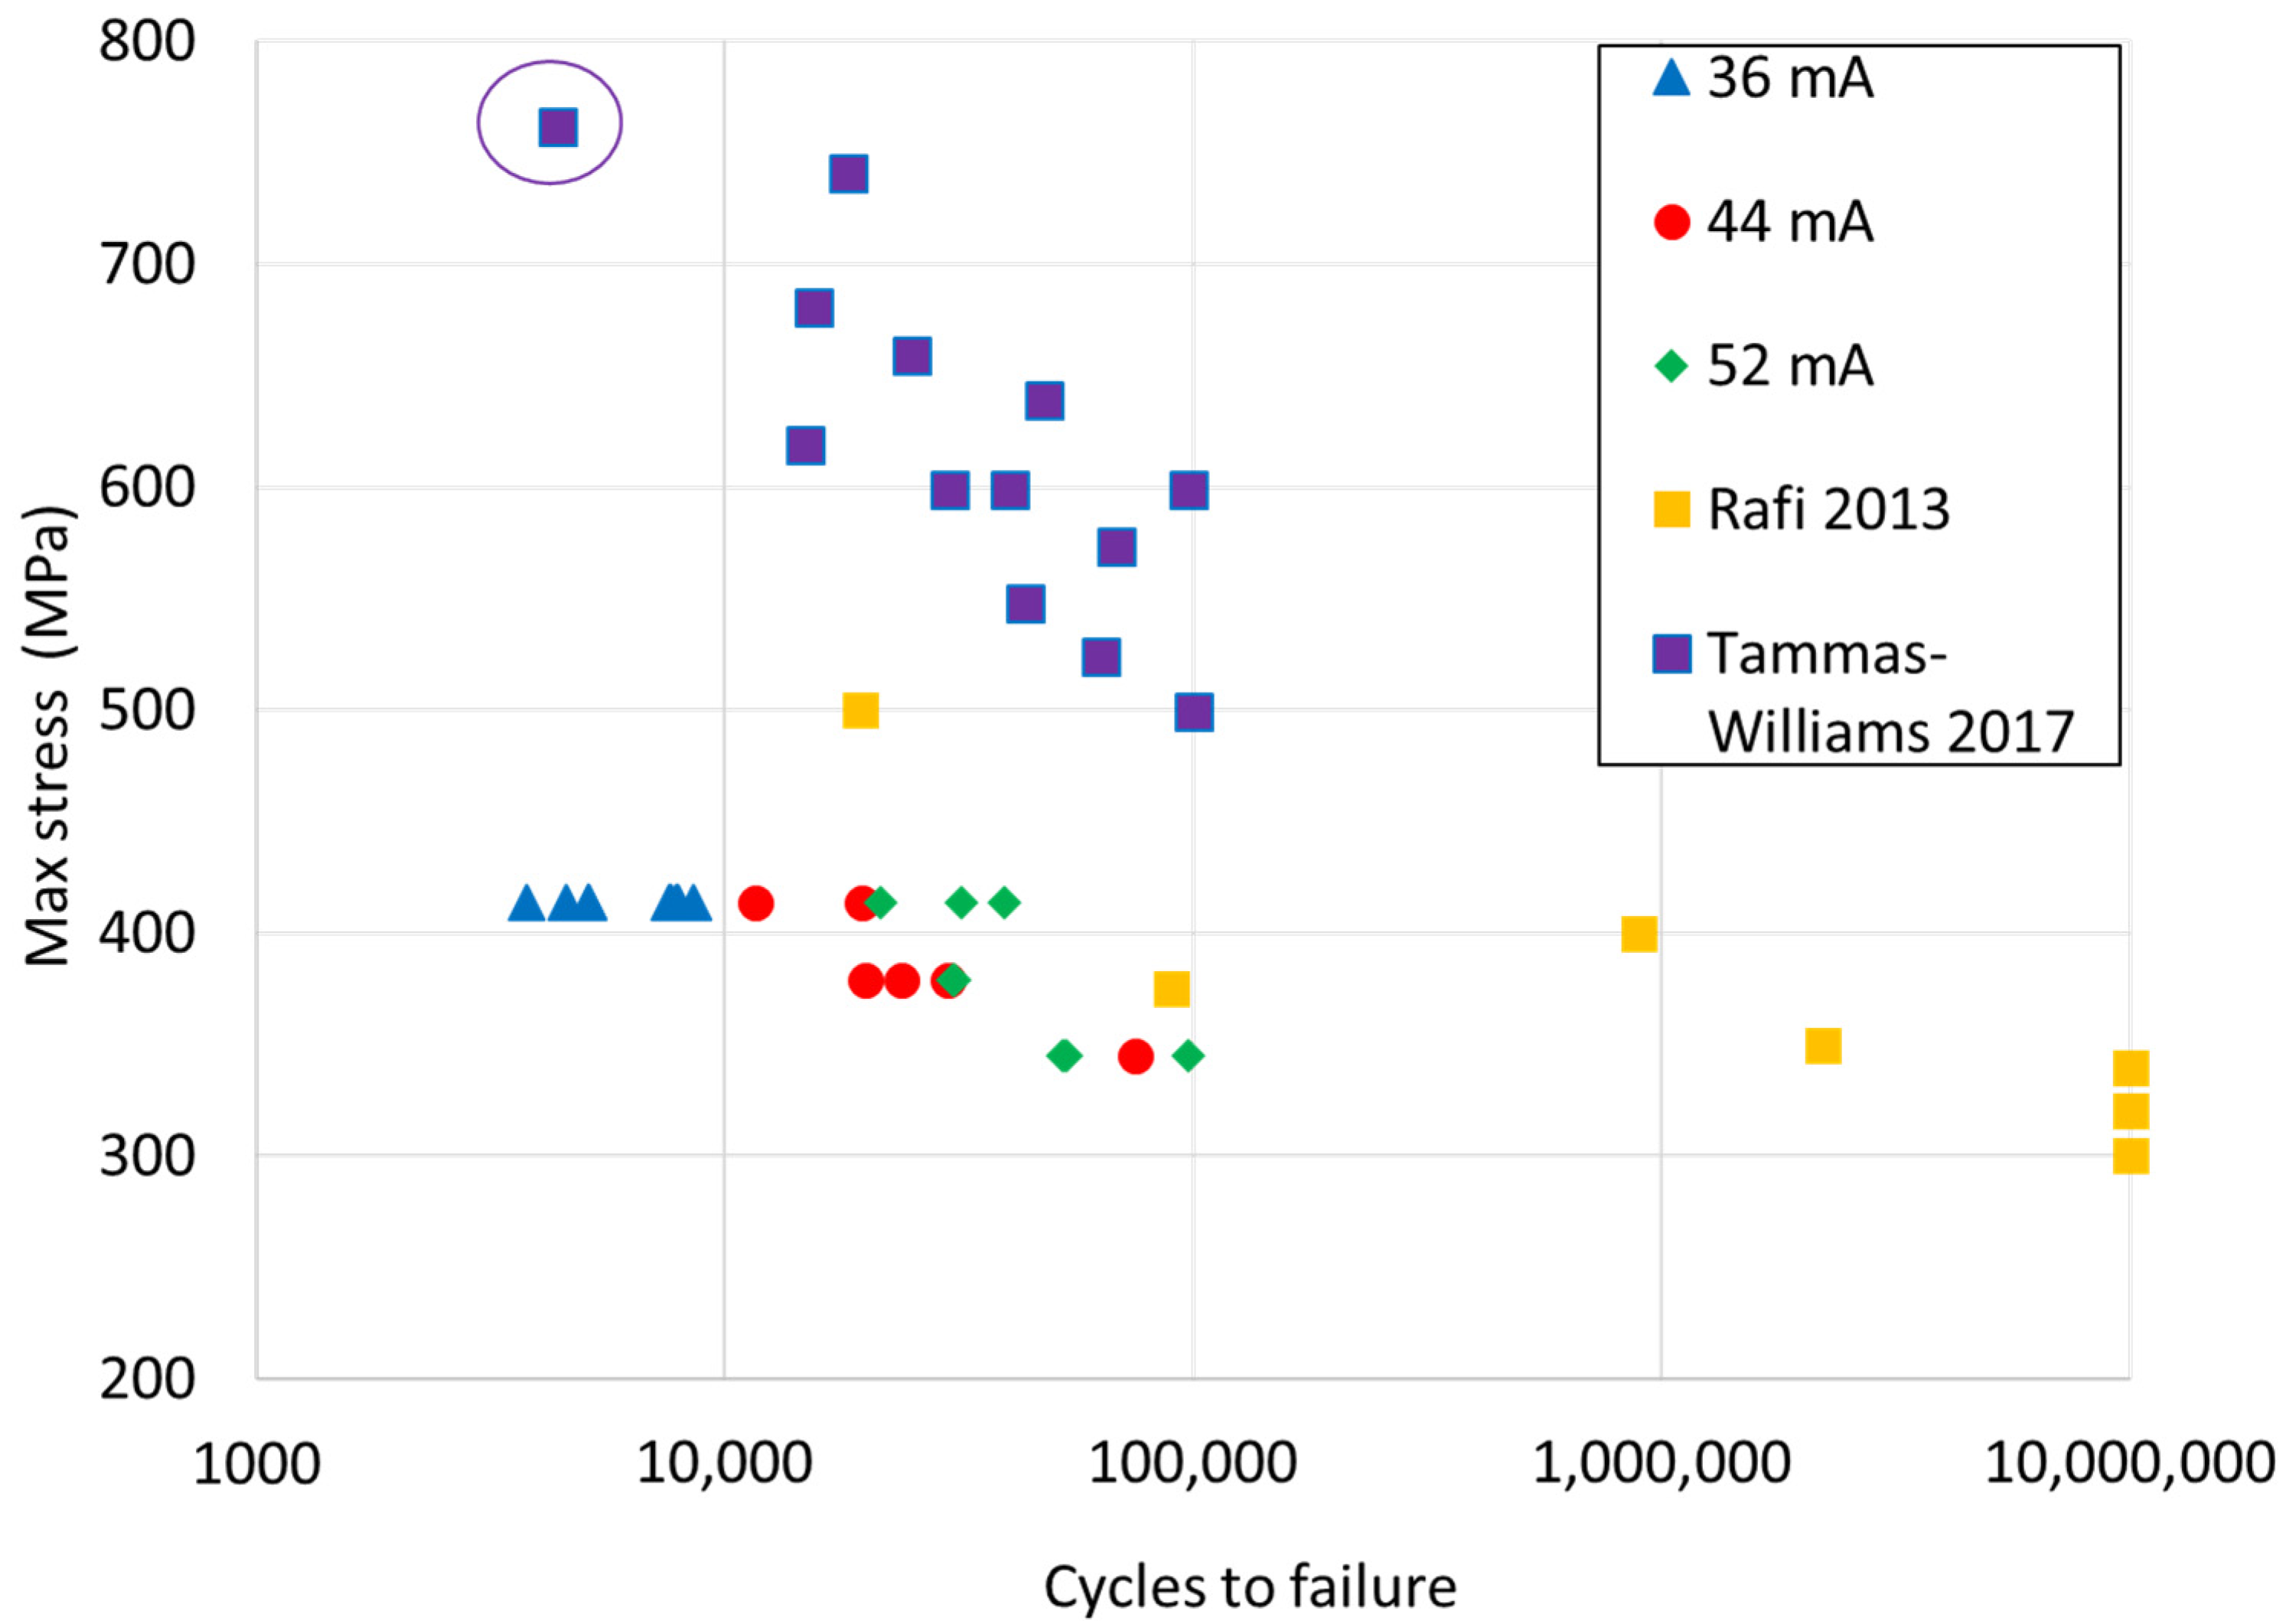
4.3. Comparison to Other Data

When the fatigue data collected in this study are compared to fatigue data published in other research on EBM Ti-6Al-4V [15,16] (Figure 12), the fatigue life measured in this study consistently underperforms. The fatigue data in these other studies were collected using R = 0.1 and R = 0.0, respectively, and the results were normalized to the R = 0.05 testing value in this study, using the Smith–Watson–Topper (SWT) mean stress correction [44]. A critical observation is the extreme drop in fatigue life relative to the Tammas-Williams [16] data, even though the specimens in the current study were tested at significantly lower stress levels. The current data also exhibited significantly lower fatigue life than the Rafi data [15], which were obtained at similar stress levels.
The higher prevalence of the smooth facets and the lower prevalence of keyhole pores in this study versus those seen in the Rafi [15] and Tammas-Williams [16] specimens provided a higher number of large potential fatigue-damage-initiation sites. This difference in flaw types may explain the poorer fatigue behavior of the 36 mA FO group compared to the 44 mA and 52 mA groups, due to larger number of smooth facet sites in the 36 mA FO group than the others in this study. It is interesting to note that the circled data point in the Tammas-William data was identified as fracturing at a smooth facet, and this specimen failed earlier than the others. This specimen was also tested at a slightly higher maximum stress than the next stress level; however, the specimen failed at a significantly lower number of cycles. Additional factors, such as a more conduction-type weld in this study versus a keyhole-type weld in the others and the microstructure indicating a fast cooling rate in this study are also likely to have negatively impacted the fatigue performance of the material. These data reinforce the extent to which large regions of lack of fusion can degrade fatigue performance, so extra care should be taken in process control and inspection procedures when fatigue damage is a concern.
It is also important to consider the maximum stress levels relative to the yield strength when evaluating the effects of smooth facets on fatigue life. The maximum stress levels as a percentage of yield strength in the current study are 413.7 MPa (42%), 379.2 MPa (38%), and 344.7 MPa (35%). The effects of smooth facets are concerning when considering that all specimens were tested at less than half of the yield strength. This finding has significant implications when determining safety factors.

5. Conclusions

The increased FOs beyond typical values generated voids indicative of insufficient energy density to fully melt the beads, resulting in a substantial lack of fusion flaws. Major takeaways from the fatigue test results and imaging are as follows:
  • Failure initiation sites consistently showed signs of smooth facets and/or lack of fusion. Lower FOs led to more smooth facet initiation sites. Damage initiating at these locations had a strong negative effect on the fatigue performance compared to other studies in which these defects were better controlled.
  • The higher FOs showed increases in the number of voids and lack of fusion with un-melted powder, but a lower number of smooth facets were present on fracture surfaces, resulting in an increased fatigue life.
  • The number of smooth/facet flaws were determined to be the primary factor in differentiating fatigue life performance. These smooth facets are more likely due to a lack of fusion between layers during the EBM process than cleavage fracture, but similar examples of this defect type have been attributed to both mechanisms in the literature, and care should be taken in classifying them in the future.

Author Contributions

Conceptualization, R.F., W.F. and S.T.; methodology, R.F., W.F. and S.T.; formal analysis, R.F.; investigation, R.F., W.F. and S.T.; resources, R.F., W.F. and S.T.; data curation, R.F.; writing—original draft preparation, R.F., W.F. and S.T; writing—review and editing, R.F., W.F. and S.T; visualization, R.F.; supervision, S.T.; project administration, S.T.; funding acquisition, S.T. All authors have read and agreed to the published version of the manuscript.

Funding

This research was funded by the Manufacturing and Materials Joining Innovation Center (Ma2JIC), made possible through awards NSF IIP-1540000 (Phase I) and NSF IIP-1822186 (Phase II) from the National Science Foundation Industry University Cooperative Research Center program (IUCRC). The APC was funded by the University of Tennessee.

Institutional Review Board Statement

Not applicable.

Informed Consent Statement

Not applicable.

Data Availability Statement

Data sharing not applicable.

Conflicts of Interest

The authors declare no conflict of interest. The funders had no role in the design of the study; in the collection, analyses, or interpretation of data; in the writing of the manuscript; or in the decision to publish the results.

References

  1. Ataee, A.; Li, Y.; Fraser, D.; Song, G.; Wen, C. Anisotropic Ti-6Al-4V gyroid scaffolds manufactured by electron beam melting (EBM) for bone implant applications. Mater. Des. 2018, 137, 345–354. [Google Scholar] [CrossRef]
  2. Nicoletto, G.; Konečná, R.; Frkáň, M.; Riva, E. Surface roughness and directional fatigue behavior of as-built EBM and DMLS Ti6Al4V. Int. J. Fatigue 2018, 116, 140–148. [Google Scholar] [CrossRef]
  3. Koptioug, A.; Rännar, L.E.; Bäckström, M.; Shen, Z.J. New metallurgy of additive manufacturing in metal: Experiences from the material and process development with electron beam melting technology (EBM). In Materials Science Forum; Trans Tech Publications Ltd.: Bäch, Switzerland, 2017. [Google Scholar]
  4. Sidambe, A.T. Three dimensional surface topography characterization of the electron beam melted Ti6Al4V. Met. Powder Rep. 2017, 72, 200–205. [Google Scholar] [CrossRef]
  5. Liu, Y.J.; Li, S.J.; Wang, H.L.; Hou, W.T.; Hao, Y.L.; Yang, R.; Sercombe, T.B.; Zhang, L.C. Microstructure, defects and mechanical behavior of beta-type titanium porous structures manufactured by electron beam melting and selective laser melting. Acta Mater. 2016, 113, 56–67. [Google Scholar] [CrossRef]
  6. Snyder, J.C.; Stimpson, C.K.; Thole, K.A.; Mongillo, D.J. Build Direction Effects on Microchannel Tolerance and Surface Roughness. J. Mech. Des. Trans. ASME 2015, 137, 111411. [Google Scholar] [CrossRef]
  7. Zhao, X.; Li, S.; Zhang, M.; Liu, Y.; Sercombe, T.B.; Wang, S.; Hao, Y.; Yang, R.; Murr, L.E. Comparison of the microstructures and mechanical properties of Ti-6Al-4V fabricated by selective laser melting and electron beam melting. Mater. Des. 2016, 95, 21–31. [Google Scholar] [CrossRef]
  8. Zhang, L.C.; Liu, Y.; Li, S.; Hao, Y. Additive Manufacturing of Titanium Alloys by Electron Beam Melting: A Review; Wiley-VCH Verlag: Hoboken, NJ, USA, 2018; Volume 20. [Google Scholar] [CrossRef]
  9. GE Additive. Inside Electron Beam Melting. White paper. 2019. Available online: https://go.additive.ge.com/rs/706-JIU-273/images/GE%20Additive_EBM_White%20paper_v3.pdf.
  10. Suresh, S. Fatigue of Materials, 2nd ed.; Cambridge University Press: Cambridge, UK, 1998. [Google Scholar]
  11. Seifi, M.; Salem, A.; Satko, D.; Shaffer, J.; Lewandowski, J.J. Defect distribution and microstructure heterogeneity effects on fracture resistance and fatigue behavior of EBM Ti–6Al–4V. Int. J. Fatigue 2017, 94, 263–287. [Google Scholar] [CrossRef]
  12. Tammas-Williams, S.; Zhao, H.; Léonard, F.; Derguti, F.; Todd, I.; Prangnell, P.B. XCT analysis of the influence of melt strategies on defect population in Ti-6Al-4V components manufactured by Selective Electron Beam Melting. Mater. Charact. 2015, 102, 47–61. [Google Scholar] [CrossRef]
  13. Gong, H.; Rafi, H.K.; Rafi, K.; Starr, T.; Stucker, B. The Effects of Processing Parameters on Defect Regularity in Ti-6Al-4V Parts Fabricated By Selective Laser Melting and Electron Beam Melting. In Proceedings of the 2013 International Solid Freeform Fabrication Symposium, Austin, TX, USA, 12–14 August 2013. [Google Scholar]
  14. Sanaei, N.; Fatemi, A. Defects in additive manufactured metals and their effect on fatigue performance: A state-of-the-art review. Prog. Mater. Sci. 2021, 117, 100724. [Google Scholar] [CrossRef]
  15. Rafi, H.K.; Karthik, N.V.; Gong, H.; Starr, T.L.; Stucker, B.E. Microstructures and mechanical properties of Ti6Al4V parts fabricated by selective laser melting and electron beam melting. J. Mater. Eng. Perform. 2013, 22, 3872–3883. [Google Scholar] [CrossRef]
  16. Tammas-Williams, S.; Withers, P.J.; Todd, I.; Prangnell, P.B. The Influence of Porosity on Fatigue Crack Initiation in Additively Manufactured Titanium Components. Sci. Rep. 2017, 7, 7308. [Google Scholar] [CrossRef] [PubMed]
  17. Liu, Z.Y.; Li, C.; Fang, X.Y.; Guo, Y.B. Energy Consumption in Additive Manufacturing of Metal Parts. Procedia Manuf. 2018, 26, 834–845. [Google Scholar] [CrossRef]
  18. Beretta, S.; Romano, S. A comparison of fatigue strength sensitivity to defects for materials manufactured by AM or traditional processes. Int. J. Fatigue 2017, 94, 178–191. [Google Scholar] [CrossRef]
  19. Hrabe, N.; Gnäupel-Herold, T.; Quinn, T. Fatigue properties of a titanium alloy (Ti–6Al–4V) fabricated via electron beam melting (EBM): Effects of internal defects and residual stress. Int. J. Fatigue 2017, 94, 202–210. [Google Scholar] [CrossRef]
  20. Chern, A.H.; Nandwana, P.; Yuan, T.; Kirka, M.M.; Dehoff, R.R.; Liaw, P.K.; Duty, C.E. A review on the fatigue behavior of Ti-6Al-4V fabricated by electron beam melting additive manufacturing. Int. J. Fatigue 2019, 119, 173–184. [Google Scholar] [CrossRef]
  21. Zhai, Y.; Galarraga, H.; Lados, D.A. Microstructure Evolution, Tensile Properties, and Fatigue Damage Mechanisms in Ti-6Al-4V Alloys Fabricated by Two Additive Manufacturing Techniques. Procedia Eng. 2015, 114, 658–666. [Google Scholar] [CrossRef]
  22. Hu, Y.N.; Wu, S.C.; Withers, P.J.; Zhang, J.; Bao, H.Y.X.; Fu, Y.N.; Kang, G.Z. The effect of manufacturing defects on the fatigue life of selective laser melted Ti-6Al-4V structures. Mater. Des. 2020, 192, 108708. [Google Scholar] [CrossRef]
  23. Günther, J.; Krewerth, D.; Lippmann, T.; Leuders, S.; Tröster, T.; Weidner, A.; Biermann, H.; Niendorf, T. Fatigue life of additively manufactured Ti–6Al–4V in the very high cycle fatigue regime. Int. J. Fatigue 2017, 94, 236–245. [Google Scholar] [CrossRef]
  24. Hrabe, N.; Quinn, T. Effects of processing on microstructure and mechanical properties of a titanium alloy (Ti-6Al-4V) fabricated using electron beam melting (EBM), part 1: Distance from build plate and part size. Mater. Sci. Eng. A 2013, 573, 264–270. [Google Scholar] [CrossRef]
  25. Hrabe, N.; Quinn, T. Effects of processing on microstructure and mechanical properties of a titanium alloy (Ti-6Al-4V) fabricated using electron beam melting (EBM), Part 2: Energy input, orientation, and location. Mater. Sci. Eng. A 2013, 573, 271–277. [Google Scholar] [CrossRef]
  26. Sidambe, A.T.; Todd, I.; Hatton, P.V. Effects of build orientation induced surface modifications on the in vitro biocompatibility of electron beam melted Ti6Al4V. Powder Metall. 2016, 59, 57–65. [Google Scholar] [CrossRef]
  27. Schwerdtfeger, J.; Singer, R.F.; Körner, C. In situ flaw detection by IR-imaging during electron beam melting. Rapid Prototyp. J. 2012, 18, 259–263. [Google Scholar] [CrossRef]
  28. Biamino, S.; Penna, A.; Ackelid, U.; Sabbadini, S.; Tassa, O.; Fino, P.; Pavese, M.; Gennaro, P.; Badini, C. Electron beam melting of Ti-48Al-2Cr-2Nb alloy: Microstructure and mechanical properties investigation. Intermetallics 2011, 19, 776–781. [Google Scholar] [CrossRef]
  29. Lee, H.J.; Kim, H.K.; Hong, H.U.; Lee, B.S. Influence of the focus offset on the defects, microstructure, and mechanical properties of an Inconel 718 superalloy fabricated by electron beam additive manufacturing. J. Alloys Compd. 2019, 781, 842–856. [Google Scholar] [CrossRef]
  30. Galati, M.; Snis, A.; Iuliano, L. Experimental validation of a numerical thermal model of the EBM process for Ti6Al4V. Comput. Math. Appl. 2019, 78, 2417–2427. [Google Scholar] [CrossRef]
  31. Gammon, L.M.; Briggs, R.D.; Packard, J.M.; Batson, K.W.; Boyer, R.; Domby, C.W. Metallography and Microstructures of Titanium and Its Alloys. ASM Handb. 2004, 9, 899–917. [Google Scholar] [CrossRef]
  32. Li, Y.; Song, L.; Xie, P.; Cheng, M.; Xiao, H. Enhancing hardness and wear performance of laser additive manufactured Ti6Al4V alloy through achieving ultrafine microstructure. Materials 2020, 13, 1210. [Google Scholar] [CrossRef]
  33. Romano, S.; Abel, A.; Gumpinger, J.; Brandão, A.D.; Beretta, S. Quality control of AlSi10Mg produced by SLM: Metallography versus CT scans for critical defect size assessment. Addit. Manuf. 2019, 28, 394–405. [Google Scholar] [CrossRef]
  34. Sandell, V.; Hansson, T.; Roychowdhury, S.; Månsson, T.; Delin, M.; Åkerfeldt, P.; Antti, M.L. Defects in electron beam melted Ti-6Al-4V: Fatigue life prediction using experimental data and extreme value statistics. Materials 2021, 14, 640. [Google Scholar] [CrossRef]
  35. Nalla, R.K.; Boyce, B.L.; Campbell, J.P.; Peters, J.O.; Ritchie, R.O. Influence of Microstructure on High-Cycle Fatigue of Ti-6Al-4V: Bimodal vs. Lamellar Structures. Metall. Mater. Trans. A 2002, 33, 899–918. [Google Scholar] [CrossRef]
  36. Edwards, P.; O’conner, A.; Ramulu, M. Electron beam additive manufacturing of titanium components: Properties and performance. J. Manuf. Sci. Eng. 2013, 135, 061016. [Google Scholar] [CrossRef]
  37. Antonysamy, A.A. Microstructure, Texture and Mechanical Property Evolution during Additive Manufacturing of Ti6Al4V Alloy for Aerospace Applications; The University of Manchester: Manchester, UK, 2012. [Google Scholar]
  38. Liu, Q.C.; Elambasseril, J.; Sun, S.J.; Leary, M.; Brandt, M.; Sharp, P.K. The effect of manufacturing defects on the fatigue behaviour of Ti-6Al-4V specimens fabricated using selective laser melting. In Advanced Materials Research; Trans Tech Publications Ltd.: Bäch, Switzerland, 2014; pp. 1519–1524. [Google Scholar]
  39. Amsterdam, E.; Kool, G. High cycle fatigue of laser beam deposited Ti-6Al-4V and Inconel 718. In ICAF 2009, Bridging the Gap between Theory and Operational Practice; Springer: Berlin/Heidelberg, Germany, 2009; pp. 1261–1274. [Google Scholar]
  40. Murakami, Y. Material defects as the basis of fatigue design. Int. J. Fatigue 2012, 41, 2–10. [Google Scholar] [CrossRef]
  41. Xu, Z.; Wen, W.; Zhai, T. Effects of pore position in depth on stress/strain concentration and fatigue crack initiation. Metall. Mater. Trans. A 2012, 43, 2763–2770. [Google Scholar] [CrossRef]
  42. Li, P.; Lee, P.; Maijer, D.; Lindley, T. Quantification of the interaction within defect populations on fatigue behavior in an aluminum alloy. Acta Mater. 2009, 57, 3539–3548. [Google Scholar] [CrossRef]
  43. Chisena, R.S.; Engstrom, S.M.; Shih, A.J. Computed tomography evaluation of the porosity and fiber orientation in a short carbon fiber material extrusion filament and part. Addit. Manuf. 2020, 34, 101189. [Google Scholar] [CrossRef]
  44. Dowling, N. Mechanical Behavior of Materials, 4th ed.; Pearson: London, UK, 2013. [Google Scholar]
Figure 1. As the FO is increased, the spot shape changes, influencing the melt plane and shape of the melt pool.
Metals 13 00350 g001
Figure 2. Specimen geometry, with gauge section manufactured using varying FOs.
Metals 13 00350 g002
Figure 3. Representative micrographs of material manufactured via different FOs (a) 36 mA FO and (b) 52mA FO.
Metals 13 00350 g003
Figure 4. (a) Voids caused by un-melted powder and lack of fusion. (b) Microvoids caused by gas release and lack of fusion.
Metals 13 00350 g004
Figure 5. S-N data for the FO groups under high cycle fatigue.
Metals 13 00350 g005
Figure 6. Fracture-surface images of observed defect types. (a) Deep un-melted powder. (b) Smooth facet without line texture. (c) Smooth flaw containing a line texture. (d) Gas pore.
Metals 13 00350 g006
Figure 7. Texture of smooth facets (a) without lines and (b) with surface lines.
Metals 13 00350 g007
Figure 8. Histogram of (a) the number of fatigue flaws present on each specimen’s fracture surface and (b) the size of the largest flaw present on each specimen’s fracture surface.
Metals 13 00350 g008
Figure 9. Plots comparing fatigue life at 413.7 MPa max stress level to (a) the number of flaws observed on fracture surfaces and (b) the size of the largest flaw present on each fracture surface.
Metals 13 00350 g009
Figure 10. Micrographs of 44 mA specimens tested at 413.7: (a) 44mA−7 and (b) 44mA−9.
Metals 13 00350 g010
Figure 11. (a) Smooth flaw, no surface lines, and what appears to be a near-fully un-melted powder particle on the flaw surface. (b) Closer image of the flaw shown in (a), with a texture similar to the fine acicular alpha microstructure seen in the micrographs. (c) Image of smooth flaw, where the distinction between un-melted particles and microstructural outlines is blurred. (d) Close image of a smooth flaw with surface lines, with areas containing a texture indicative of ductile fracture.
Metals 13 00350 g011
Figure 12. Fatigue-test data comparison to published results. An early failure in the Tammas-Williams data is highlighted, as it contained a smooth facet flaw on the fracture surface.
Metals 13 00350 g012
Table 1. Number of microvoids per mm2 averaged across all specimens in an FO group. Standard deviation is provided in parentheses.
Focus OffsetTotal Microvoids Gas Pore VoidsLack of Fusion Voids
36 mA69.8 (SD: 45.8)52.3 (SD: 34.3)17.4 (SD: 21.2)
44 mA111.9 (SD: 28.8)79.0 (SD: 30.4)32.8 (SD: 9.8)
52 mA102.9 (SD: 40.2)57.8 (SD: 42.4)45.2 (SD: 19.8)
SD: standard deviation.
Table 2. Average number of cycles to failure, standard deviation, and number of specimens for varying FO and maximum stress level.
Maximum Stress Level
FO
(mA)
344.7 MPa379.2 MPa413.7 MPa
AvgSD#AvgSD#AvgSD#
36 ------------648418009
44 75,45123,049124,6285080315,66056812
52 68,14125,816330,994186231,18191343
Avg, average; SD, standard deviation; #, number of specimens.
Table 3. Summary of fracture surface measurements for each FO group.
FOAverage Largest Flaw Size (μm)Average Number of Flaws on Surface
36 mA577 (SD: 198)26.0 (SD: 4.1)
44 mA578 (SD: 322)10.8 (SD: 2.1)
52 mA537 (SD: 302)10.9 (SD: 3.4)
SD: standard deviation.
Table 4. Percent of specimens within each group showing signs of each type of flaw.
FO GroupDeep
Un-Melted Powder
Smooth Facets
without
Line Texture
Smooth Facets with Line TextureGas Pore
36 mA25%100%75%37%
44 mA17%100%33%17%
52 mA25%100%43%37%
Disclaimer/Publisher’s Note: The statements, opinions and data contained in all publications are solely those of the individual author(s) and contributor(s) and not of MDPI and/or the editor(s). MDPI and/or the editor(s) disclaim responsibility for any injury to people or property resulting from any ideas, methods, instructions or products referred to in the content.

