Article

Low-Temperature Carburization: Ex Situ Activation of Austenitic Stainless Steel

Department of Materials Science and Engineering, Case Western Reserve University, 10900 Euclid Avenue, Cleveland, OH 44106, USA
*
Author to whom correspondence should be addressed.
These authors contributed equally to this work.
Metals 2023, 13(2), 335; https://doi.org/10.3390/met13020335
Submission received: 26 December 2022 / Revised: 21 January 2023 / Accepted: 30 January 2023 / Published: 7 February 2023
(This article belongs to the Special Issue Surface Engineering and Coating Tribology)

Abstract

:
Surface engineering of chromium-oxide-passivated alloys (e.g., stainless steels) by low-temperature infusion of interstitial solutes (carbon, nitrogen) from a gas phase requires “surface activation” by removing or perforating the passivating oxide film. We demonstrate a new approach for surface activation based on pyrolysis of a reagent powder, introduce advanced methodology to study its microstructure, and compare it to an established activation method. Rather than a bare alloy surface, stripped of its oxide, we find that an “activated” surface involves a reaction layer containing high concentrations of Cl, carbon, or nitrogen. We propose a model for the microscopic mechanism of surface activation that will enable future systematic development toward more effective process schemes.

1. Introduction

Many advanced engineering applications need alloys with a combination of excellent surface hardness, corrosion resistance, wear resistance, and high-cycle fatigue life. Alloy properties are most critical where environmental impact occurs: at the alloy surface. An approach to make alloy parts with superior performance and lifetime consists of “surface engineering” alloy parts after they first have been shaped and undergone surface machining. A particularly potent method of such alloy surface engineering is the infusion of concentrated interstitial solute, e.g., carbon or nitrogen from a gas phase, performed at low temperature. “Low” temperature, in this context, means a temperature that is high enough to enable rapid diffusion of interstitial solute, but, at the same time, low enough to suppress precipitation of undesired phases within the processing time. Under these conditions, the concentration of interstitial solute can become orders of magnitude higher than it could be in thermodynamic equilibrium [1,2,3,4,5,6,7,8,9,10]. Useful methods of surface engineering by gas-phase-based infusion of concentrated interstitial solute include low-temperature carburization, -nitridation, or -nitrocarburization [7,8,10,11,12,13,
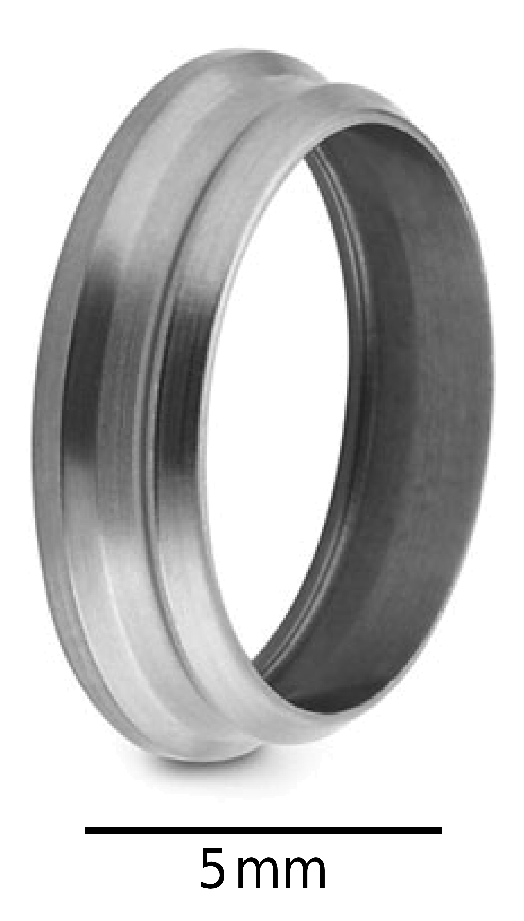
14]. An industrial process has been established for gas-phase-based low-temperature carburization, optimized particularly for ferrules (Figure 1) made from AISI-316L (austenitic Fe–Cr–Ni stainless steel containing Mo) [6,15,16,17,18]. Within a carbon infusion processing time ≈80 ks (1 day), this process can generate a highly conformal carbon-rich sub-surface zone (“case”) with carbon fractions up to X C = 0.15 and a carbon diffusion profile that, absent a sharp interface to the underlying alloy core, has an apparent “depth” of ≈25 μm in metallographic images. Similar methods have been developed for low-temperature nitriding and -nitro-carburization [9,19,20,21,22,23,24,25,26,27]. Even low depths of concentrated interstitial carbon and/or nitrogen impart significantly improved corrosion resistance in chlorine-rich environments (saltwater). Infusion of interstitial solute to greater depths also significantly increases surface hardness, wear resistance, and fatigue life, leading to numerous technical applications that may benefit from such surface engineering [1,3,5,14,28,29,30,31].
The usefulness of many important “corrosion resistant” austenitic alloys originates from their ability to spontaneously form a surface film of a passivating oxide. Representative alloys are AISI-316L, Al-6XN®, Inconel® 625, Incoloy® 825, and Hastelloy® C-22. The oxide protects the alloy against further oxidation and against corrosive attack from the environment. The oxide is typically a Cr-rich mixed oxide with a thickness that can be below 1 nm [32].
While the passivating oxide is beneficial in applications, it constitutes a diffusion barrier to carbon and nitrogen at the temperatures required by low-temperature infusion of interstitial solute. To enable the infusion of interstitial solute, an extra step is required to remove the passivating surface oxide film, or make it permeable to carbon or nitrogen. This critical step is known as “surface activation”. An activated surface is one that was made permeable to carbon and nitrogen, so carbon and nitrogen adsorbed on the alloy surface can dissolve into the underlying alloy. Several methods have been designed for surface activation over the development of low-temperature carburization, nitrocarburization, and nitridation, including the following:
  • Immersion in acidic solutions [33,34,35,36].
  • Catalytic metal plating [15,16,17,18,37].
  • Plasma-based processes [3,7,19,29].
  • Direct acidic gas exposure processes [6,15,16,17,18,38,39],
  • More recent developments of solid-reagent pyrolysis processes [24,36,40,41,42,43,44,45].
Each of these methods have benefits and detriments in terms of effectiveness, safety, overall process complexity, and applicability to different alloys. Surface activation is also not typically a process with binary results. Through certain mixtures of activation and infusion processes, one can produce, e.g., deep and even infusion or areas of varying infusion depth and interstitial level. The general understanding of how these methods activate the surface has been the same as for high-temperature carburization or nitriding: by removing the passivating oxide film, so that carbon or nitrogen can be infused through an oxide-free metal surface. However, our present work demonstrates that the earlier-derived understanding is incomplete.
In this work, we demonstrate that surface activation for low-temperature carburization can be more complex than expected from previous work. To this end, we study and compare the composition and structure of alloy surfaces activated by two different processes. The fundamental difference between them is that the established “double HCl” activation sequentially applies steps of surface etching and initial infusion of interstitial solute, whereas our newly developed method, i.e., “solid-reagent pyrolysis” activation, applies initial infusion of solute in tandem with surface etching. In the following, we abbreviate these two categories as AS (in-sequence etching and infusion) and AT (in-tandem etching and infusion). For both activation schemes, we study the resulting alloy surface immediately after activation as well as after following up with IC (continuous infusion of interstitial solute without further surface activation). The specific processes we studied for each category are these:
AS 
Activation by etching and initial solute infusion performed in 3 sequential steps, realized by directly applying specific gases from a gas reservoir: (i) etching with HCl gas, (ii) initial low-temperature carburization with CO gas, and (iii) repeating the first step. This is an established process, currently practiced by industry and known as “double HCl” activation.
AT 
Activation by gas generated by pyrolysis of a solid reagent, in this case NH4Cl. Etching and initial solute infusion performed in tandem in a single step. This is a new kind of activation process, first practiced by Christiansen, Somers et al. [43,46] as an “open-vessel” process with urea as solid reagent and recently developed further, including as “closed-vessel” process, with optimized solid reagents by our group [24,40,47].
IC 
Continuous infusion of interstitial solute, carried out as low-temperature carburization, with no further activation.
We present results revealing the respective microstructure and spatial distribution of atom species obtained by high-resolution imaging (FIB (focused ion beam) micromachining, SEM (scanning electron microscopy)), spatially-resolved spectrometry (XEDS (X-ray energy-dispersive spectrometry), ToF-SIMS (time-of-flight secondary-ion mass spectrometry)), and diffractometry (XRD (X-ray diffractometry)). Further, we compare surface hardenability by low-temperature carburization enabled by each activation method, measured by microhardness and effective lattice parameter expansion. Based on these data, we propose models for the microscopic mechanisms of surface activation that will enable future systematic development toward more effective process schemes.

2. Experimental Methods and Procedures

Table 1 shows 6 different kinds of specimens that were prepared and studied in this work. Processing consisted of first exposing—or not exposing—the specimen to one of two different methods of surface activation, AS and AT. Each one of these three options was followed—or not followed—by IC, carried out as low-temperature carburization, with no further surface activation. Table 1 introduces two-letter codes we use for distinguishing these six different treatments.
AS is currently industrially used as “double-HCl” process [6,15,16,17,18,48]. It involves direct control of the gas composition by gas supply from a reservoir. The first step, HCl(1), consists of flowing a HCl/N2 gas mixture around the samples at 523 K (250 °C) for 11 ks (3 h). It is followed by a short low-temperature carburization step, Carb(1), applying a CO/H2/N2 mixture at around 723 K (450 °C) for 11 ks (3 h). Then, HCl(1) is repeated as HCl(2). After this activation process, the furnace was purged with N2 and cooled.
AT constitutes a new approach to surface activation, using gas evolving from pyrolysis of a solid reagent. The composition of the gas is controlled indirectly via the composition of the solid reagent, the amount of reagent relative to chamber volume and specimen surface area, and the temperature (potentially different for reagent and specimen). AT can be carried out in an “open vessel” setup, as seen in Figure 2 and described extensively in [36]. An analogous “closed-vessel”setup can also be used and produces similar outcomes [24,40]. In our study, the solid reagent is NH4Cl. All experiments were carried out with the same mass of NH4Cl per alloy specimen surface area: 0.061 mg/mm2. The vessel containing the specimen and the NH4Cl was heated to 563 K within 0.1 ks and kept at this temperature for 2.7 ks (45 min). Before exposing the specimen to air, it was allowed to cool for 1 ks.
For IC, continuous low-temperature carburization after surface activation, we used the same furnace as for AS. After activation, before sealing and purging the furnace for performing carburization, we extracted “SX” samples for external testing and/or added “T” samples, i.e., samples activated via AT, which had intermittently been exposed to air for storage and transport. Then, the activated samples underwent a longer (roughly 0.11 Ms (30 h) low-temperature carburization step C. Further, in-depth description of this processing step may be found in [48].
We studied AISI-316L specimens of two different shapes: “ferrules” and “coupons”. An example of ferrule is shown in Figure 1. Ferrules were chosen as specimens because they are produced under well-controlled and reproducible conditions. This means that property changes observed after carburization under different conditions can uniquely be attributed to the variation in processing conditions, rather than e.g., be caused by unknown changes in the microstructure between different samples from a less-defined material. For this work, we used as-machined Swagelok® ferrules with an inner diameter of 6.4 mm (0.25 inch). The AISI-316L from which they are made has a somewhat (1.05 times) higher Cr atom and a significantly (1.2 times) higher Ni-fraction than standard AISI-316L—both within the allowed compositional range of AISI-316L. More precisely, the specification requires mass fractions M Cr 0.170 and M Ni 0.120 for Cr and Ni, respectively, while typical values for standard AISI-316L are M Cr 0.165 and M Ni 0.105 . Table 2 shows the composition of the Ni- and Cr-rich AISI-316L by atom fractions. The AISI-316L raw material was in a strain-hardened state (1/8 hard, as defined in [49]) prior to machining.
The second kind of specimens where AISI-316L foil coupons with a thickness of 100 μm and lateral dimensions of 14 mm by 59 mm. These samples were used in experiments on low-temperature nitriding via gas from solid-reagent (NH4Cl) pyrolysis.
At the beginning, all samples were cleaned in a series of ultrasonic baths with deionized water, isopropanol, and acetone before drying in an oven at 378 K (105 °C).
Then, the samples were—or were not—surface-activated by either S or T, followed—or not followed—by low-temperature carburization C to produce all the sample variants shown in Table 2. Figure 2 depicts the entire process for the example of “Hybrid Processing”, TC in Table 1. This includes surface activation T by gas evolved from pyrolyzing NH4Cl and subsequent low-temperature carburization, carried out in separate vessels. Processing surface activation and carburization in different vessels makes the surface activation “ex situ”. For surface activation, the sample and a solid reagent (NH4Cl or 15N2H4Cl) were held within a clean glass test tube, attached to a manifold for inert gas purging and exhausting of reagent pyrolysis products during and after the process. The test tubes and samples were immersed into a bath of molten Sn, thermostatically heated to the desired activation temperature (e.g., 563 K) for the prescribed activation time (e.g., 2.7 ks (45 min)), then removed and cooled. Subsequently, during transit to various analyses of the activated surface or to a gas carburization furnace, the samples were exposed to the atmosphere.
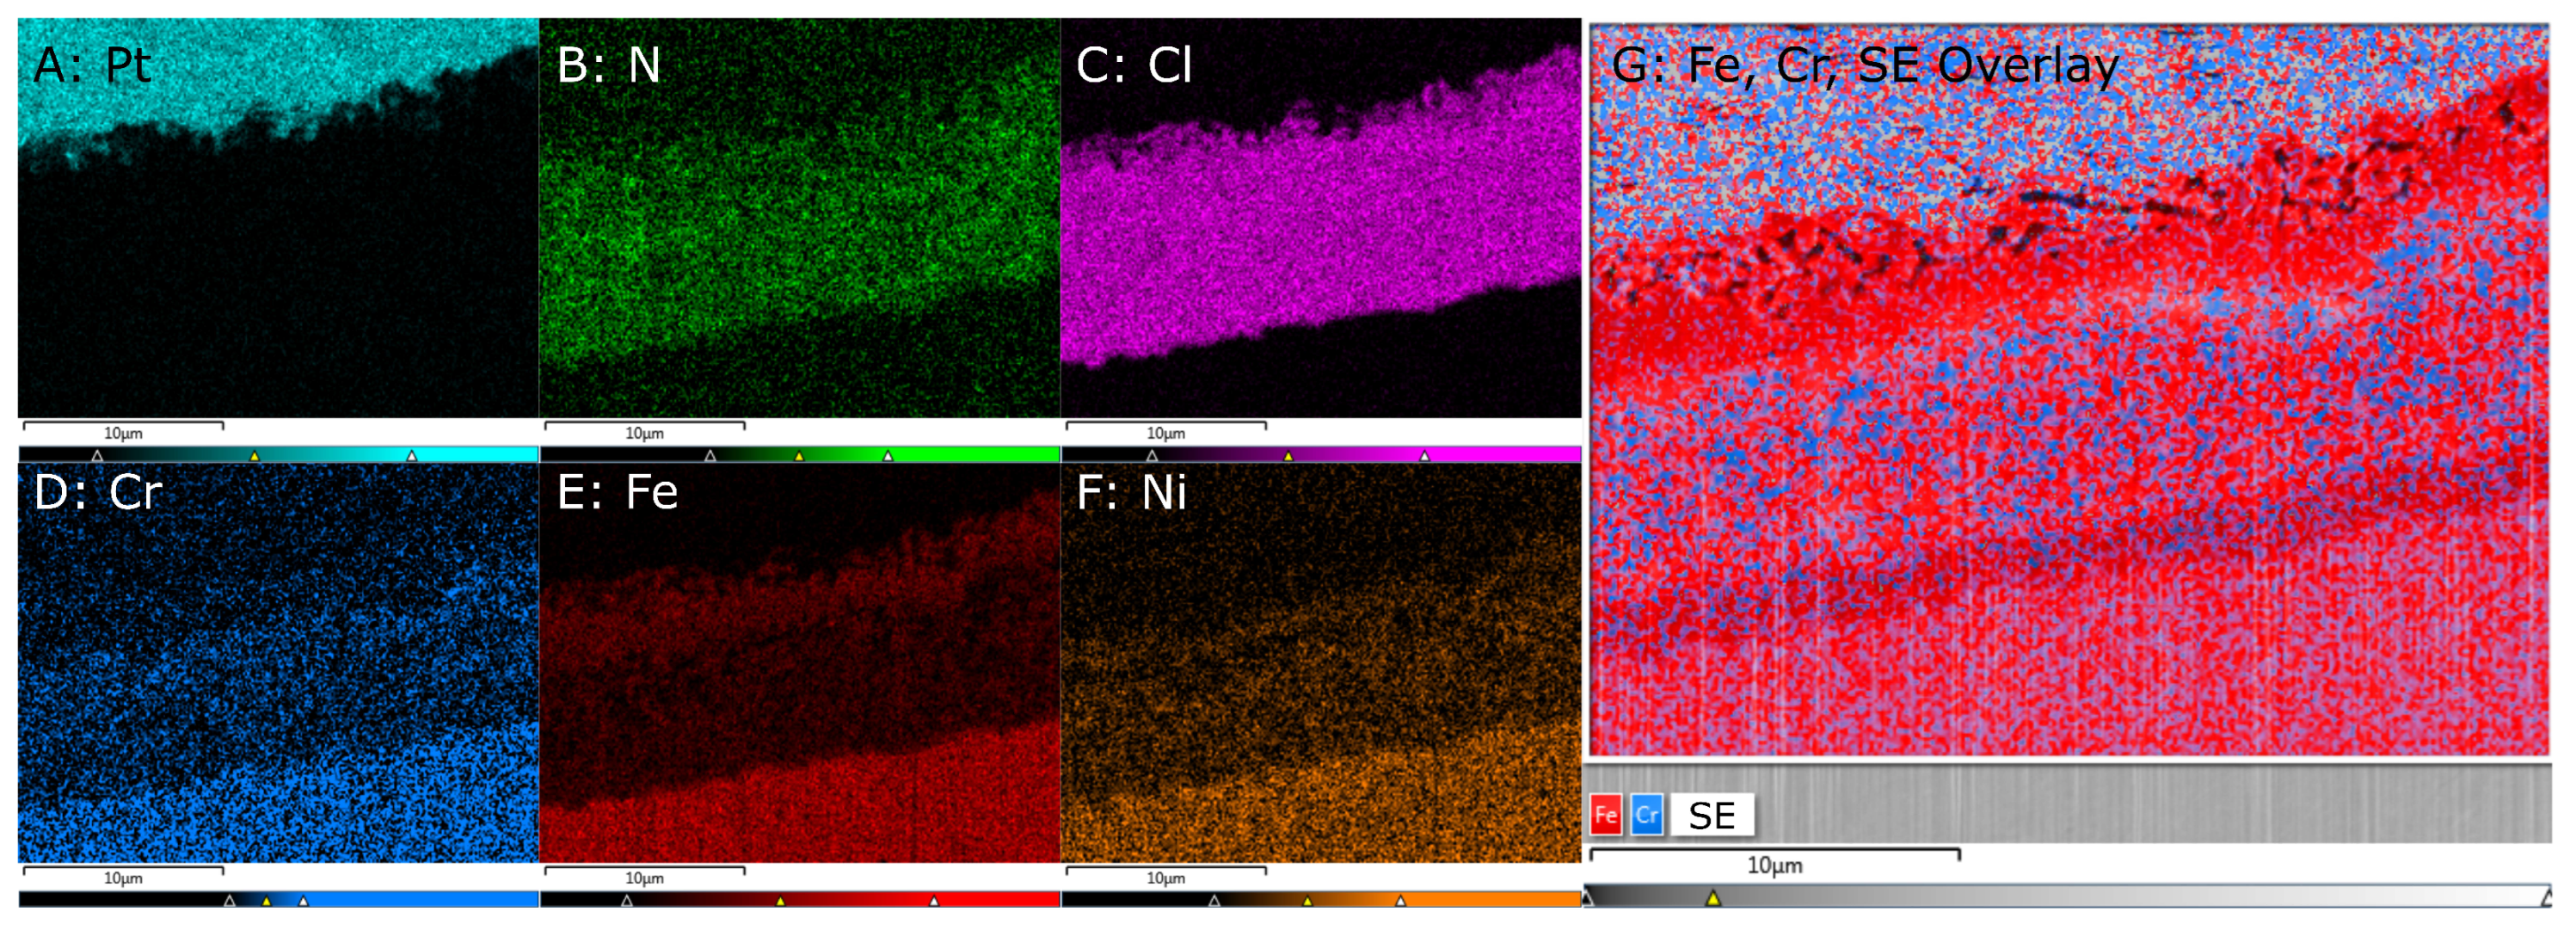
Some alloy samples were activated with reagents enriched with long-term stable isotopes, (e.g., 15N2H4Cl) so the presence of hydrogen (as deuterium) and larger ion fragments could be mapped with ToF-SIMS. After surface activation, samples were prepared as follows. First, we performed FIB milling to reveal the activated sub-surface zone. For this step, we used an FEI Helios dual-beam (scanning electron beam and scanning focused ion beam) system (Thermo Fisher Scientific, Waltham, MA, USA). Prior to milling, layers of Pt were deposited by ion-beam-induced decomposition of organo-metallic precursor molecules on part of the sample to preserve the original surface structure. The sample was fixtured and rotated relative to the incident gallium ion beam to cut into the surface at an angle of β = 30 against the original surface. In addition to providing excellent accessibility for imaging, such angled cutting doubles the magnification by which the microstructure appears in plan-view images along the direction into the alloy. After FIB milling, samples were imaged in both SE (secondary electron) and BSE (backscattered electrons) mode as well as evaluated with XEDS for mapping and line scans through the activated sub-surface zones.
After preparation, the samples were extracted and transferred for ToF-SIMS analysis in a PHI TRIFT V nano-ToF (PHI, Chanhassen, MN, USA). The instrument operates with a pulsed ion beam, which liberates secondary ion- and neutral fragments (i.e., neutral and charged atoms and atom clusters) from the sample surface. Applying electric charge to the specimen will cause secondary ions of the same polarity to be repelled toward the detector and enable determination of their mass-to-charge ratio from the time of flight. After standard mass and spatial resolution calibration, the samples were evaluated at various magnifications in positive and negative polarity modes. A Ga+ primary ion source in unbunched mode was used. Before the actual analysis, we sputtered the samples remove potential surface contamination from transfer between instruments. Because 1H is an unavoidable contaminant even in ultra-high vacuum, a 2H- (deuterium-) enriched reagent was used for the TX (activation T, no C) samples. Additionally, 15N-enrichment in the reagent was chosen to trace nitrogen-bearing species in the sample.
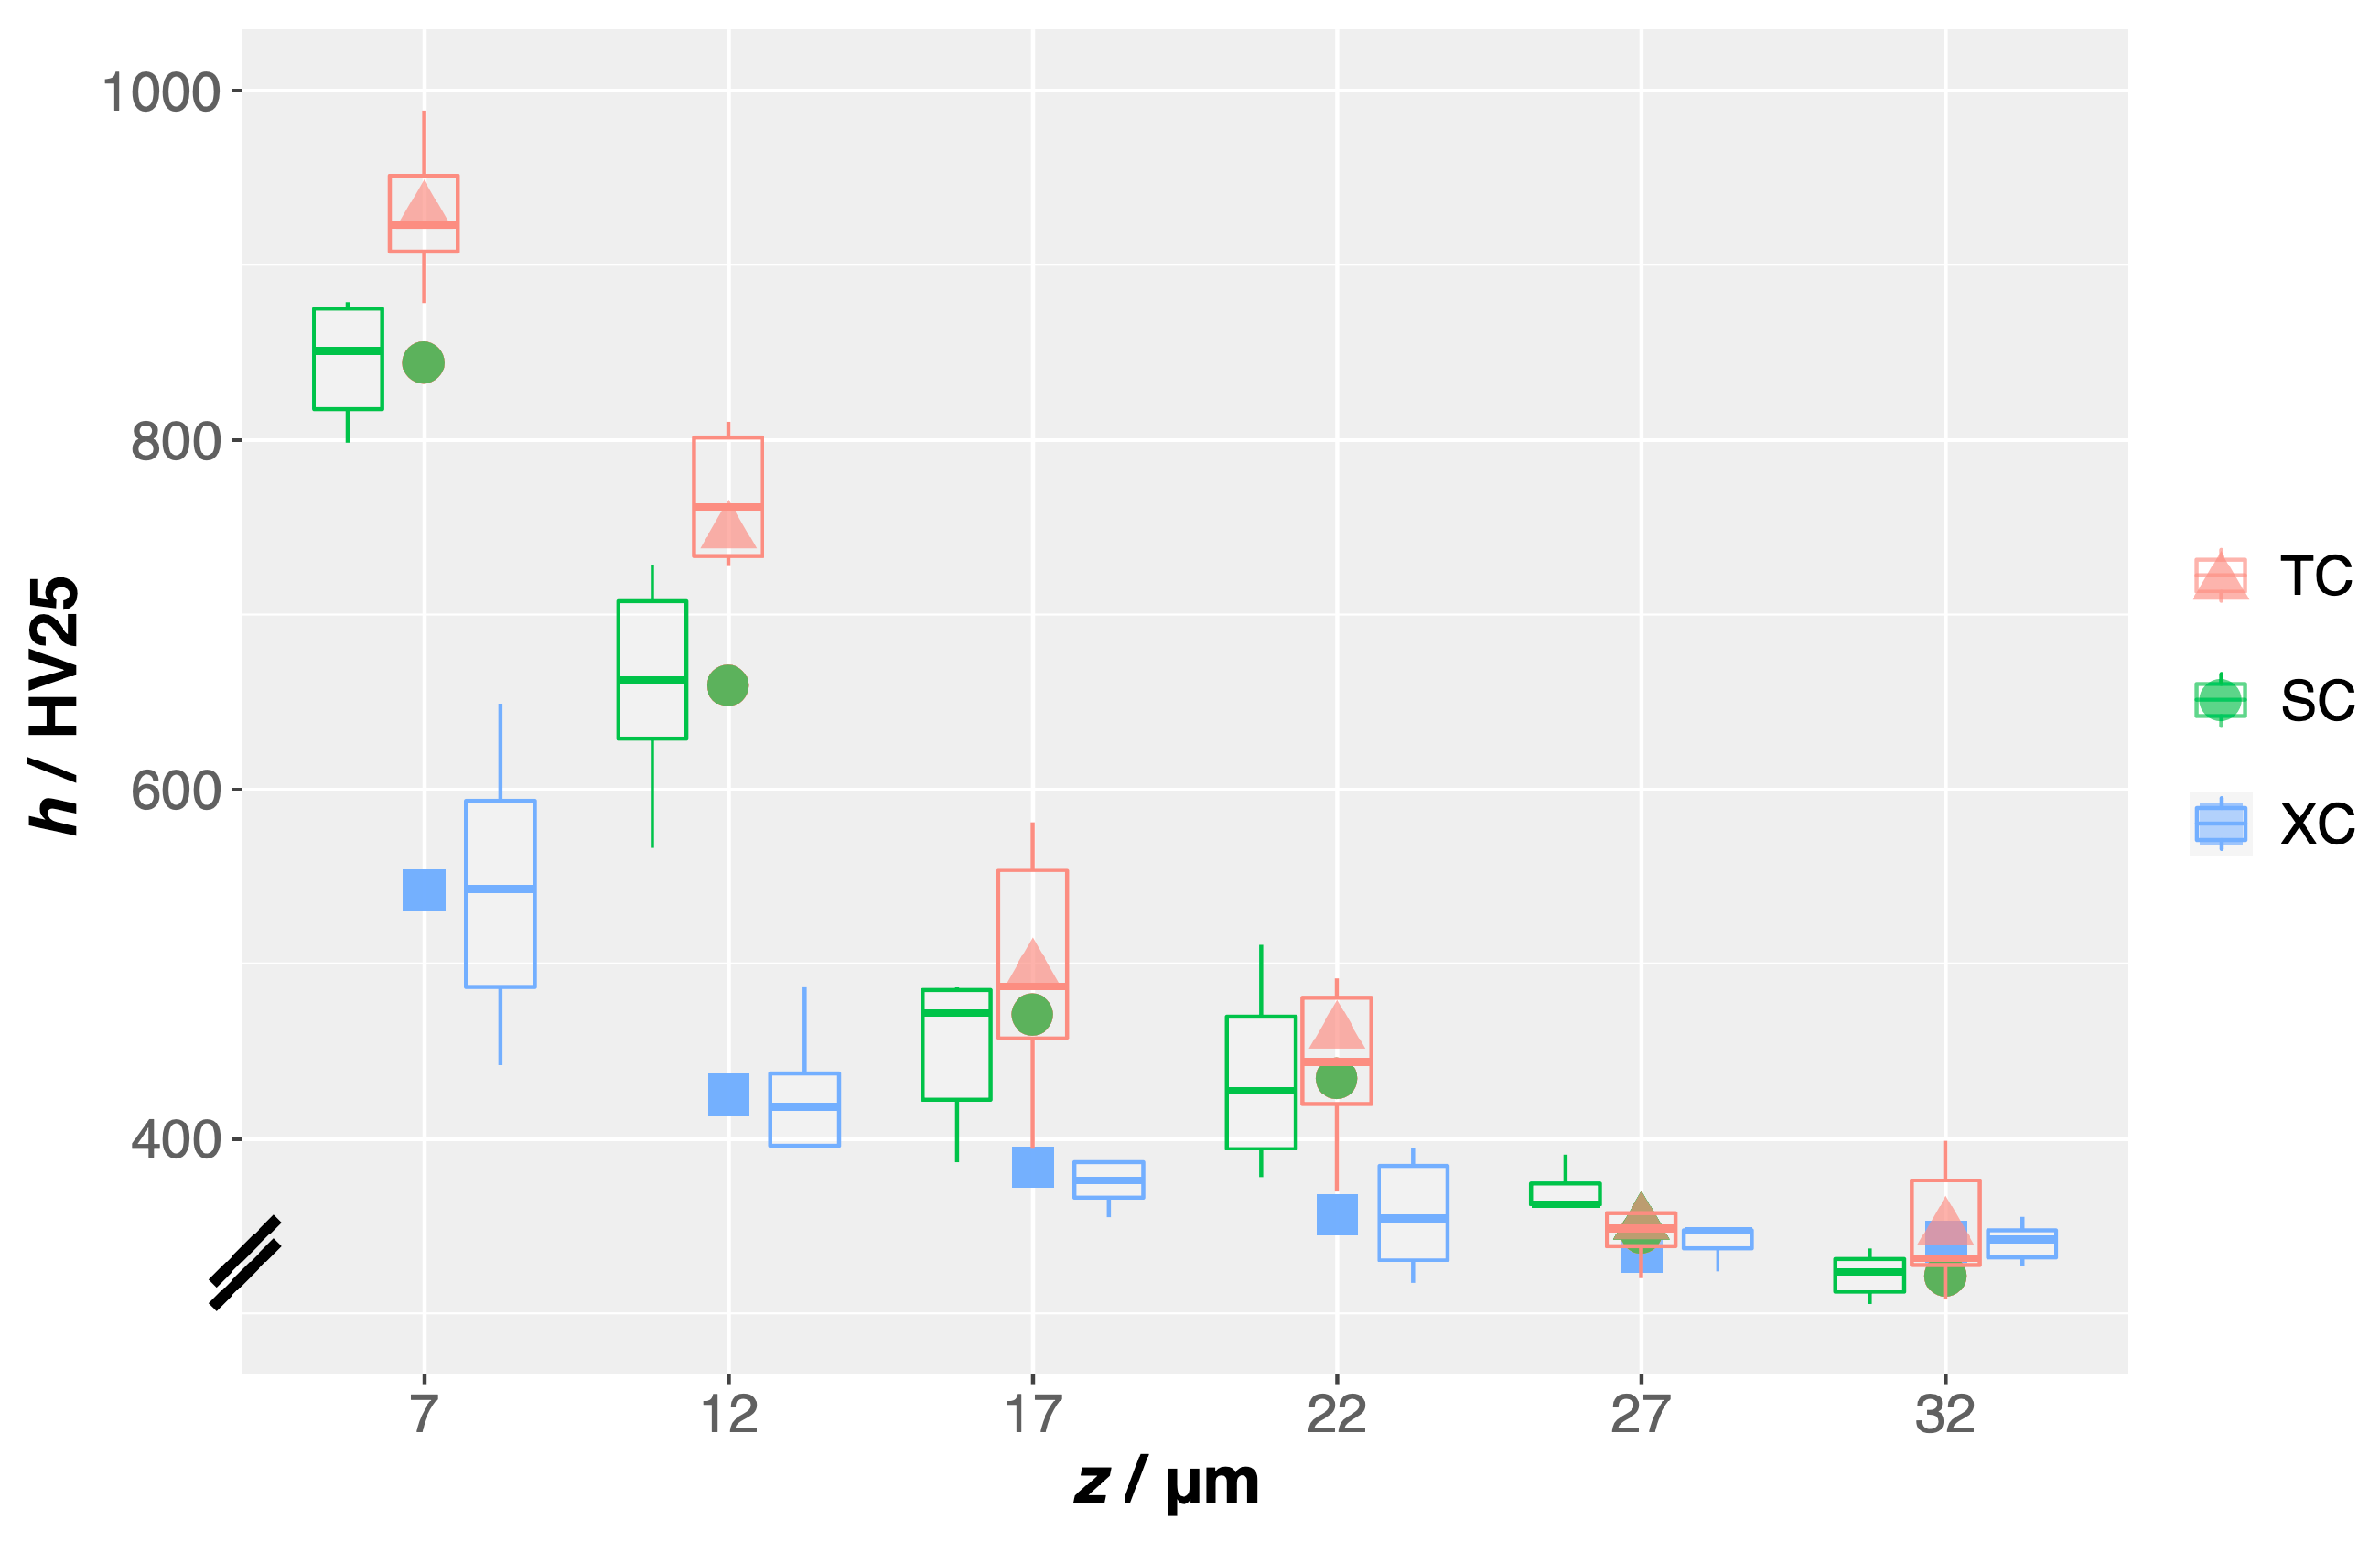
To acquire hardness–depth profiles h [ z ] resulting from infusion of interstitial solute, we mounted the samples and polished them to a 3 μm diamond suspension finish for microhardness indentation and optical microscopy. Microhardness–depth profiles h [ z ] were acquired by performing series of hardness indents at depths z i = i · Δ z , i = 1 N from the surface with constant depth increment Δz. For these measurements, we used a Clemex automated microhardness indentation system (Clemex, Stanford, CA, USA) with a Vickers indenter operating with a load of 0.25 N (25 gf) and a dwell time of th = 10 s. To address scatter, each carburized sample set had three pieces evaluated with two sets of 6 indents placed at each z i .
XRD was conducted to observe induced changes in atomistic structure, especially lattice parameter expansion from carburization, and detect additional phases potentially forming during activation processes. XRD was performed with a Discover D8 (Bruker, Madison, WI, USA) with a 2D VANTEC-500 solid state detector and a Co Kα source. Measurements were performed between 2 θ B = 5° and 2 θ B = 95° in 4 frames with 10° overlap between frames and 0.5 ks per frame. In order to display diffractograms independent of the wavelength of the X-ray source, these data were converted to spatial frequencies q : = d h k l 1 , where d h k l denotes the spacing of the {hkl} planes. Relative shifts between peaks, e.g., I 1 [ q ] and I 2 [ q ] , were evaluated by the cross-correlation function
CCF [ I 1 , I 2 , q ] : = + I 1 [ u ] I 2 [ u + q ] d u ,
discretized corresponding to the discretization of the XRD data. Especially, this yielded the shifts of peaks positions after carburization relative to the peak positions of non-treated AISI-316L. Evaluating the positions of the {111}, {200}, and {220} peaks after carburization, we also determined a best estimate for the lattice parameter of the carburized material. This evaluation is subject to two problems. One problem is that the X-rays with the wavelength we employed penetrate the specimen to a depth of typically 5 μm. Therefore, the resulting peak shapes and positions must be understood as a weighted average over depths of different fractions of interstitial solute. Second, small errors in the specimen height are known to cause peak shifts, such that the lattice parameters that can be calculated from each individual peak position appear to be different. This artifact can be eliminated by the “Nelson–Riley” correction, which we have performed by rescaling of the spatial frequency coordinate with the Nelson–Riley function and linear regression analysis [50]. To identify product phases from the P activation method, we performed peak matching with database powder diffractograms from the ICDD’s Powder Diffraction File™ (PDF®).
Lastly, we performed a simple experiment to determine if NH4Cl can successfully infuse interstitial nitrogen without an additional treatment gas supply. The equipment used for this experiment was a Carbolite Gero HZS 12/900 horizontal tube furnace (Carbolite Gero USA Verder Scientific, Newtown, PA, USA) with a 150 mm long fused silica sample vessel inside the work tube. In this experiment, we heated foil samples in an N2-purged tube furnace with 0.25 mg/mm2 NH4Cl to 773 K (500 °C) for 1.8 ks (30 min). After cooling, samples were polished, etched, and imaged to determine whether infusion had occurred. One sample was also analyzed by XRD to determine whether the treatment had produced expanded austenite and/or caused precipitation of nitrides.

3. Results

3.1. Microhardness Profile

To study the effectiveness of solid-reagent pyrolysis in activating the surface of AISI-316L for infusion of carbon at low temperature, we acquired microhardness–depth profiles h [ z ] of all carburized samples, i.e., XC (no activation, just carburization C), SC (activation S, then carburization C), and TC (activaton T, then carburization C). Figure 3 shows the result. To show the scatter of h [ z ] for each sample group, the hardness data are aggregated into box and whisker plots. For the given dimensions of the Vickers indenter and the applied load, the smallest depth h at which reliable hardness data can be obtained is z0 = 7 μm.
At the right end of Figure 3, at depths hhc := 27 μm, the hardness level represents that of the non-carburized (but equally heat-treated) strain-hardened alloy core: (341 ± 10)HV25. The core hardness provides a reference to measure the effect of the different activation and carburization treatments on the hardness–depth profile h [ z ] .
The AISI-316L samples only exhibit a comparatively small increase of surface hardness—with a mean of (542 ± 72)HV25 at z0 = 7 μm (minimum required depth for reliable hardness). Light-optical micrographs of etched AISI-316L samples (not shown) reveal a thin and uneven carburized sub-surface zone that characterizes low-temperature-carburized AISI-316L with lacking- or ineffective surface activation. The large standard deviation of h [ z 0 ] , significantly larger than the known reproducibility of hardness data, indicates that some indents coincidentally sampled regions that were hardened to a higher degree, while other indents sampled less-hardened areas.
The activated and carburized samples SC and TC, in contrast, exhibit significant increase in sub-surface hardness. At depths z z c , their hardness–depth profiles indicate an average hardness increase Δ h [ z ] : = h [ z ] h c twice as large as that of samples XC at every depth z. Close to the surface, at z 0 , samples SC exhibit a substantial hardness increase: h - [ z 0 ] = ( 845 ± 32 ) HV 25 . However, this significant increase is even exceeded by that of the reagent-pyrolysis-activated samples TC, for which h - [ z 0 ] = ( 930 ± 36 ) HV 25 .

3.2. Microstructure–Imaging

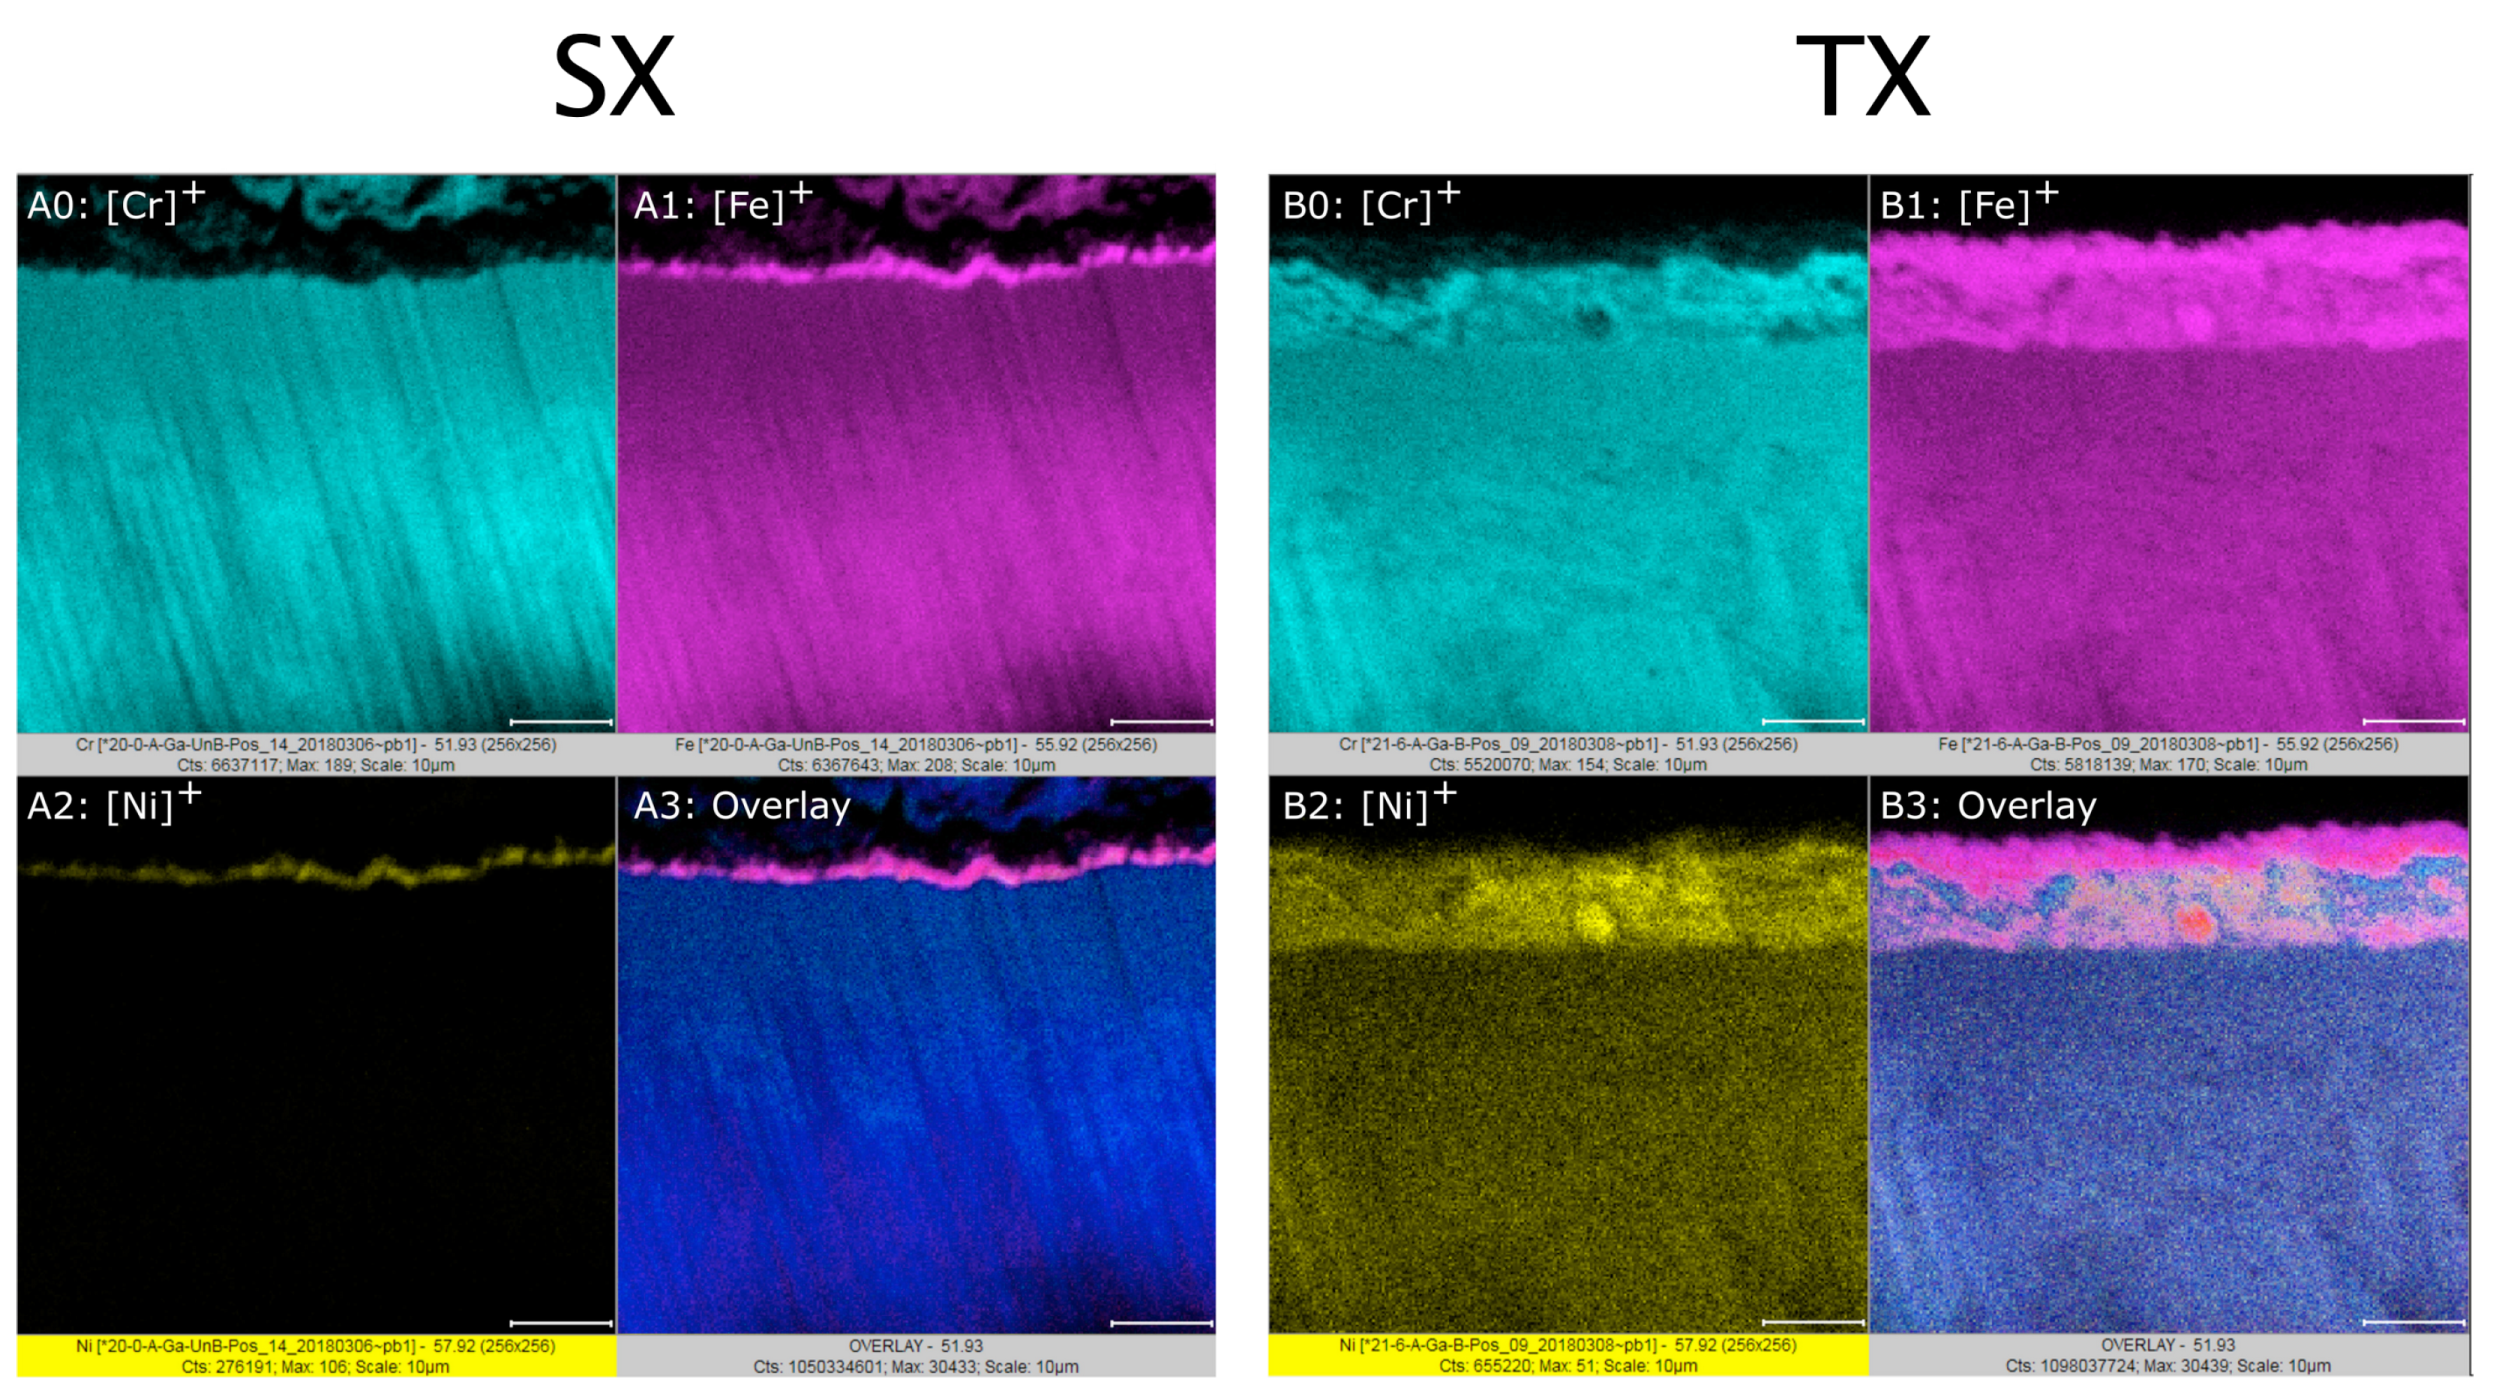
Toward the goal of understanding what constitutes an “activated” surface at the microscopic level, we performed several complementary methods of microcharacterization: microscopy, elemental mapping, and diffractometry. We analyzed one sample from each group of SX (activation S, no C) and TX, i.e., samples that were exposed to one of the activation treatments, but no subsequent carburization (SX, of course, does involve a brief intermediate step of carburization, Carb(1) in Table 1).
As a new method in this area of research, we used FIB-cutting into activated sample surfaces to reveal the microstructure directly below the surface with a minimum of disruptions and artefacts that plague more traditional sample preparation methods. 
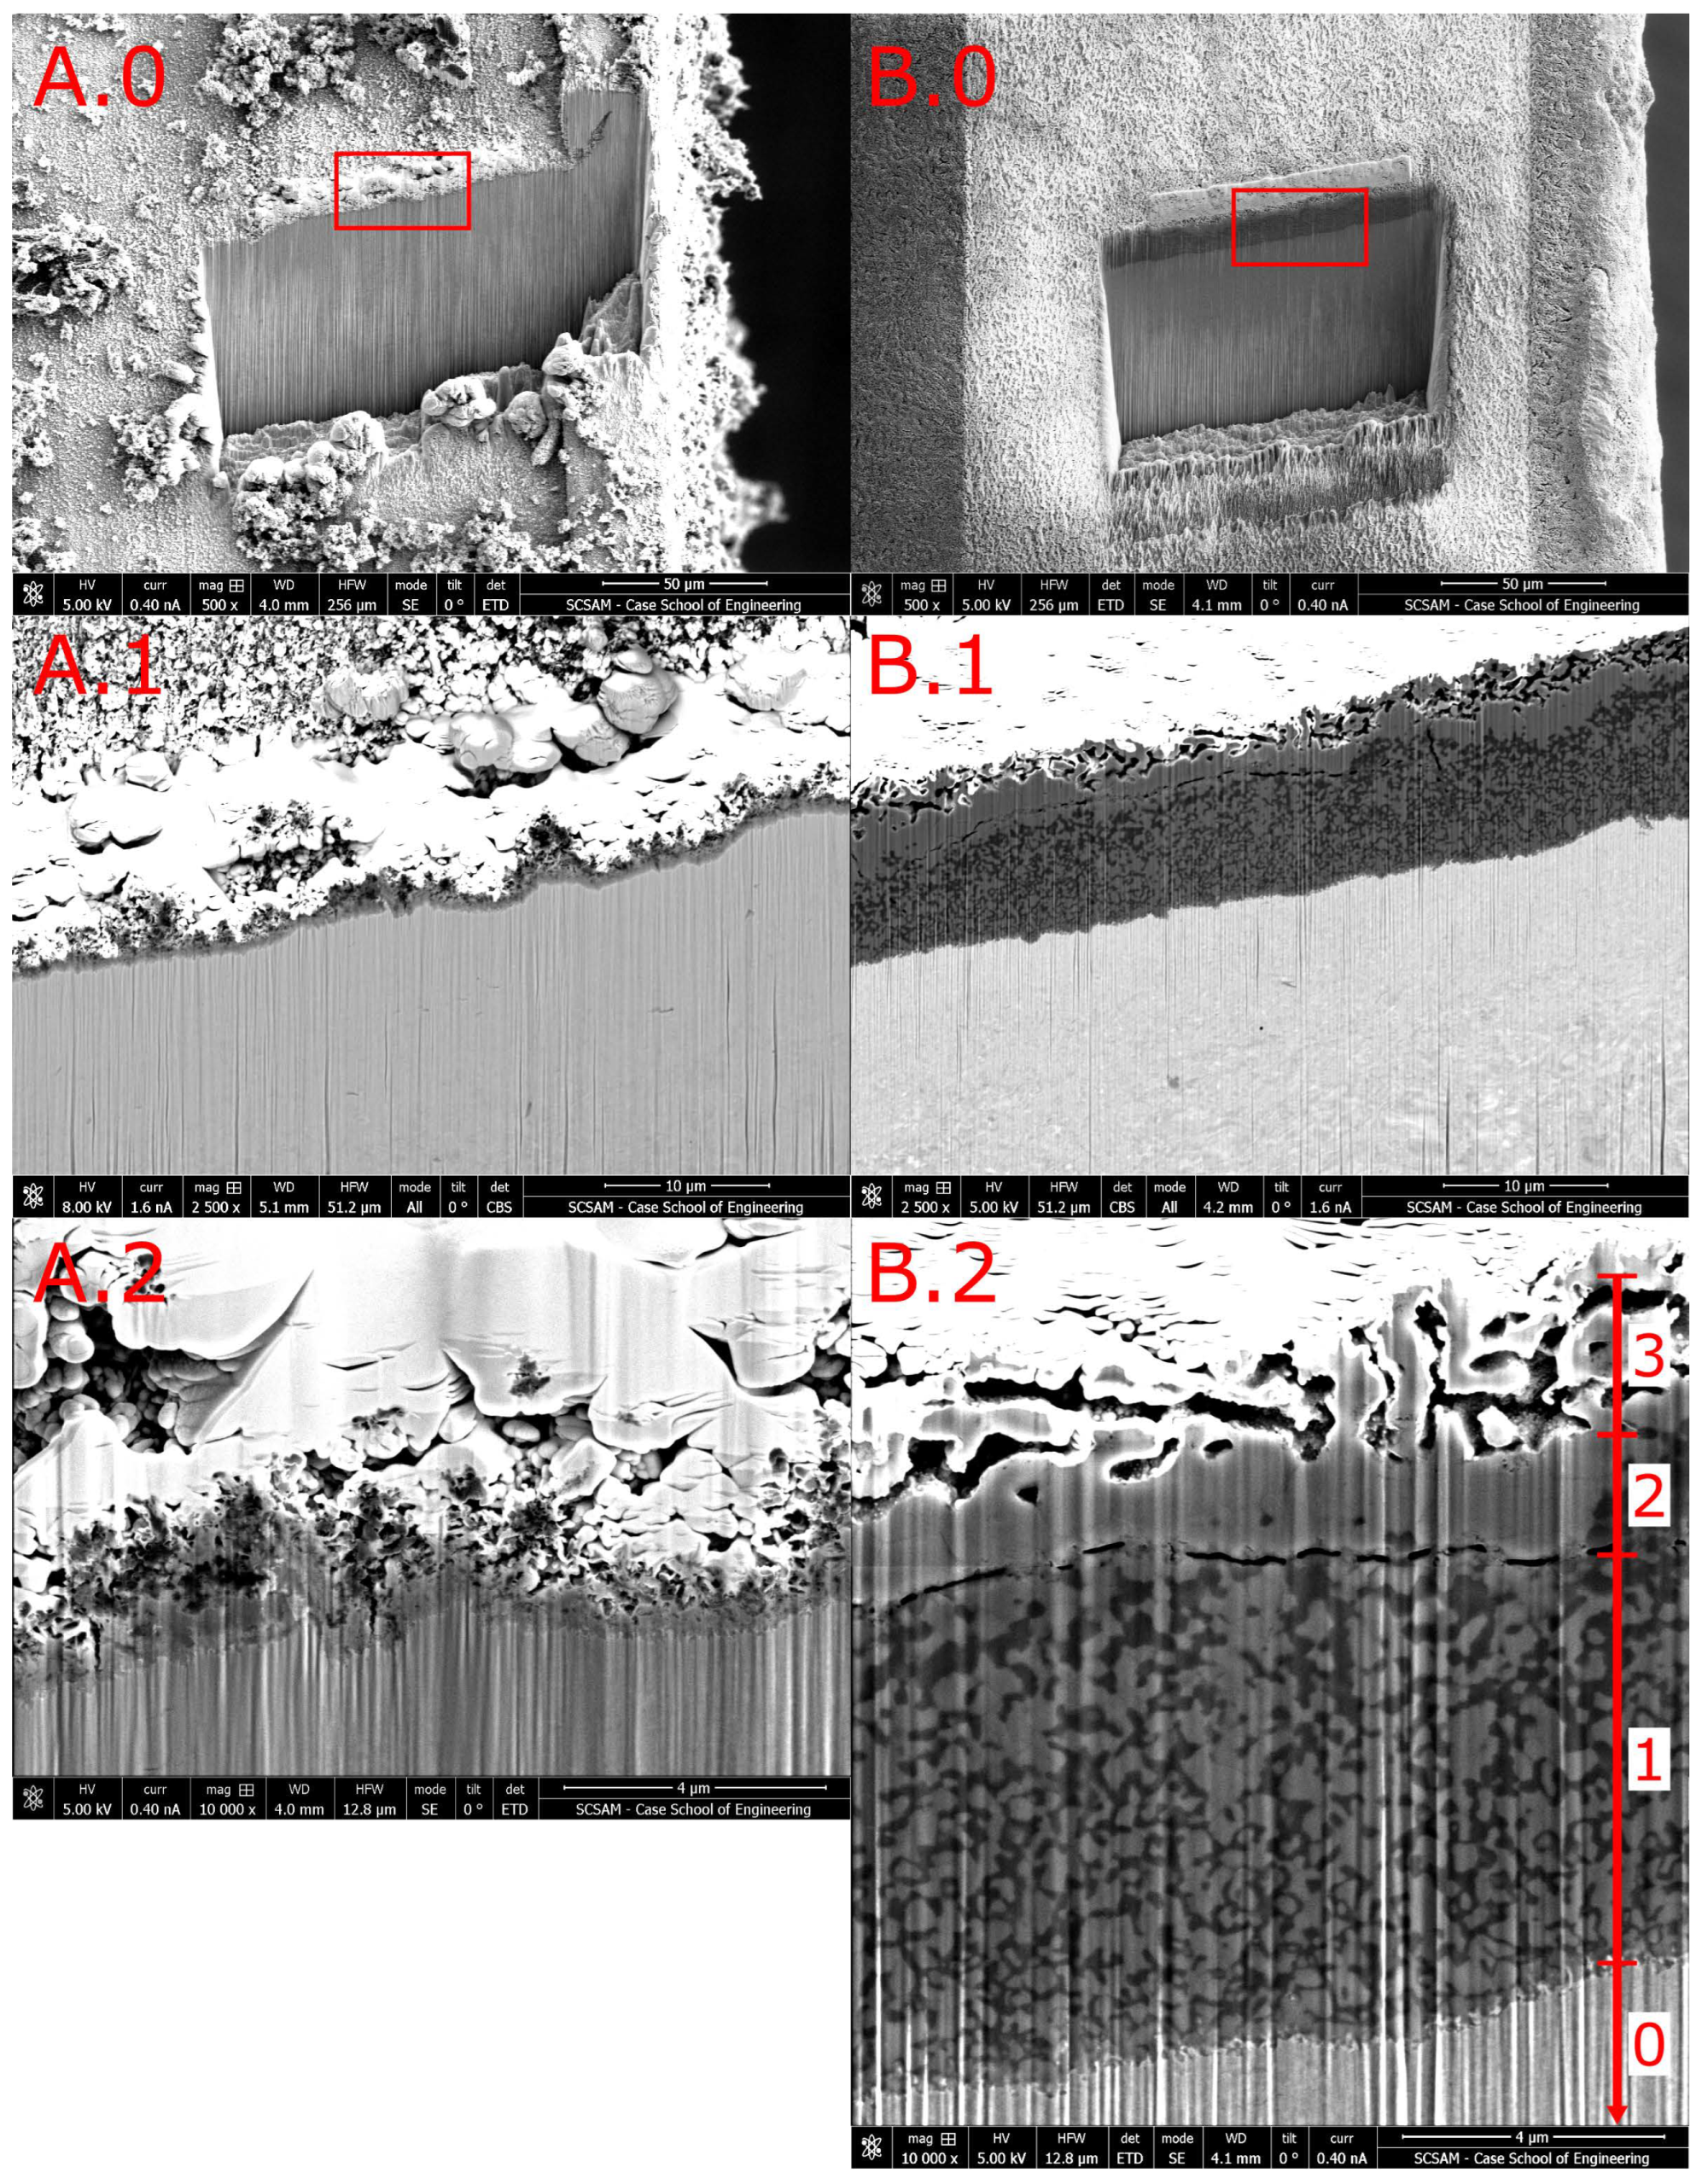
Figure 4A shows a FIB-cut 30° inclined cross-section of the sub-surface zone in a SX sample. (Recall that owing to the FIB-cut angle β = 30 , the depth z into the specimen is projected to the y-coordinate with a scaling factor of Sin [ β ] 1 = 2 . The vertical lines in the region of the alloy core are an artefact of FIB preparation, known as “curtaining”. The specimen surface surrounding the FIB-cut region exhibits soot particles with diameters on the order of 10 μm (Figure 4A.0) as well as a layer of loosely packed soot particles with diameters up to 3 μm (Figure 4A.2). The soot layer is covered by the Pt layer deposited for FIB preparation. The Pt layer appears with highest brightness. Between the Pt-covered soot layer and the alloy below (light-grey), the image features a dark-grey zone with a thickness of about 0.5 μm (Figure 4A.2).
In the following, we denote this zone as RL-S (reaction layer induced by treatment S).
It appears that the RL-S consists of a single phase. The reduced brightness in the BSE image A.1 (compared to the brightness of the alloy core below) suggests that this zone has a lower mass density than the alloy core. Additionally, the interface between the dark-grey zone layer and alloy core exhibits high fractality.
The images show that (even) the double-HCl activation process does not simply “remove” the surface oxide film, but actually produces a continuous reaction layer with a thickness of ≈0.5 μm over the alloy surface.
As to surface activation via gas from solid reagent pyrolysis, Figure 4B shows SE-(top) and BSE images (bottom) for sample TX, activated with 15N2H4Cl at 563 K for 2.7 ks. Stable imaging of this and similarly activated samples with high resolution required a low accelerating voltage and a low beam current. Initial imaging in a separate region with higher voltage and current caused gross damage to the surface material that appeared as material evaporating and topographic disruption within a few seconds. The low voltage (e.g., 5 kV) and current helped reduce damage, but there was still some (minor) disruption in the region that underwent XEDS mapping owing to long analysis times. The damage shows as [H]+ depletion in ToF-SIMS maps, see Section 3.3.2. This interesting effect, paired with some charging observed during SEM imaging, not only guided our analytical technique, but also revealed that the surface layer material is less electrically and thermally conductive than the alloy core. This suggests that the dark-grey zone in B.1 is a distinct reaction layer not just the topmost sub-surface zone of the alloy with infused interstitials (see below). Compared to the alloy core, the reaction layer has low mass density.
In the following, we denote this layer as RL-T (reaction layer induced by treatment T).
The BSE image Figure 4B.2 and Figure 5C, owing to its high magnification, reveals much detail. The image reveals 5 distinguishable grey shades. According to the characteristics of BSE imaging, higher intensity corresponds to higher mass density. The highest mass density is observed on the top surface of the specimen. It originates from the Pt layer that was deposited on the specimen for FIB preparation. In the angled cross-section view, the Pt layer has a thickness of 0.1 μm. The second highest mass density is observed in the alloy core—in the bottom half of the image. This zone of alloy core, denoted as Zone 0, shows a uniform grey level, as expected for a homogeneous solid solution.
Between the alloy core and the Pt layer, image B.1 reveals a complex multi-layer structure in the RL-T. The total thickness of this structured reaction layer is about ≈5 μm, accounting for the cut angle β = 30 ° . The inner architecture of the RL-T consists of three distinguishable zones:
Zone 1, the lowermost zone, right above the alloy core, exhibits two phases, distinguishable by the grey level they exhibit in the image: A low-density (dark-grey) phase and a mid-density (mid-grey) phase, denser than the former one, but less dense than the alloy core. Both phases exhibit a highly fractal morphology. The volume fraction of the mid-density phase is somewhat larger than that of the low-density phase. From the interface to the alloy core to the top of Zone 1, the volume fractions do not change significantly. The mid-density phase appears more globular, while the low-density phase occupies the space between the globular particles of the mid-density phase. The partitioning of the volume into regions of mid-density and low-density is fine-scaled immediate to the layer–alloy interface, but becomes coarser with increasing height above the interface. The layer–alloy interface appears to be highly fractal and rough, indicating etch attack of the alloy. Along the interface, both the mid-density phase and the low-density phase are in contact with the alloy.
In Zone 2, on top of the two-phase Zone 1, the SEM images show a uniform layer of the mid-density (mid grey) phase. Over a longer section of the (virtual) interface between Zone 2 and Zone 3 exhibits a crack, suggesting the relaxation of internal stress, possibly during cooling. Accounting for the cut angle β = 30 ° , the thickness of Zone 2 is ≈1.5 μm.
Zone 3 consists of the same mid-density phase as Zone 2, but here it only fills the volume to about one half. The other half of the volume consists of voids with a typical lateral extension of ≈1 μm. The voids tend to be elongated parallel to the surface, even more so than it appears because of the magnification anisotropy introduced by the cut-angle β .
In all three zones, the low-density phase and the mid-density phase appear with constant grey level in the BSE image. This suggests that their composition does not significantly vary as a function of distance z from the surface.
To evaluate the temporal evolution of the RL-T at the activation temperature, additional samples similar to TX were prepared at 563 K for 0.3 and 0.9 ks. All samples seen in Figure 5 show the same multi-zone structure described above. The total layer thickness increases linearly with time: 2.7 ks: ≈ 5.5 μm, 0.9 ks: ≈ 2 μm, and 0.3 ks: ≈ 1 μm. In the 0.3 ks sample, Zone 3 is significantly less porous than the same region of the samples activated for longer times. Additionally, the porous zone is bordered by the mid-density phase and a network of smaller pores within the low-density (dark-grey) phase.

3.3. Microstructure—Elemental Mapping

3.3.1. X-ray Energy-Dispersive Spectrometry

To understand the composition of the RL-T, i.e., the surface layer produced by solid-reagent pyrolysis on AISI-316L, we performed 2D XEDS elemental mapping and XEDS line scans on the FIB-cut ( β = 30 ° cross sections). Figure 6 depicts elemental maps of TX. In the map labeled “A: Pt”, the bright region at the top (left) is from the Pt layer deposited on the original surface of the sample. The FIB-cut cross-section is the dark, Pt-free area below. The cross-section lights up in the other five maps, tracing different elements. The alloy core is seen as the bright regions at the bottom of each one of the maps “D: Cr”, “E: Fe”, and “F: Ni”. Above the alloy core, the maps show the elemental distribution within the RL-T, Zone 1, 2, and 3. All three zones contain significant concentrations of nitrogen, Cl, Cr, Fe, Ni. Mainly, all three zones of the RL-T consist of Cl, followed by nitrogen. This explains the reduced intensity or lower grey level by which they appear in the SEM-BSE image compared to the alloy core. “B: N” indicates that the two-phase (low- and mid-density) Zone 1 has a higher average nitrogen level than the single-phase (mid-density) Zones 2 and 3. “E: Fe” reveals that Zones 2 and 3 is rich in Fe, richer than the two-phase region Zone 1 on the average. Zone 1, in contrast, is richer in Cr and Ni, which are practically absent in Zones 2 and 3.
Figure 7 shows a montage including the SEM image, the scan line, and the XEDS line scan data for Cl, Fe, Cr, and Ni to quantitatively reveal the elemental distribution within the sub-surface zone. Further elements are included in the quantification, but are not shown here for clarity. The scan line starts in the deposited Pt (left) and continues through the RL-T into the alloy core (right). Just as the maps of Figure 6 show, the entire RL-T is rich in Cl. Zones 2 and 3, the zones closest to the surface, are rich in Fe and without Cr and Ni. In the two-phase Zone 1, Cr-rich regions are separate from Fe/Ni-rich regions. Further, the XEDS line scan data indicate that the mid-density phase observed by SEM-BSE rich in Fe and Ni, while the low-density phase is rich in Cr.
ToF-SIMS results, presented in the next section, will mirror these XEDS findings. They also indicate a significant hydrogen presence (as 2H) in ammonium- and ammine-species.

3.3.2. Time-of-Flight Secondary-Ion Mass Spectrometry

Figure 8 shows ToF-SIMS maps of SX and TX. These maps were generated from positive ions coming off the specimen surface. In the maps labeled “Overlay”, the [Cr]+, [Fe]+ and [Ni]+ maps of each sample are superimposed.
Both samples share a few features on these maps. Relative to the alloy core, the [Cr]+ maps of both have a lower intensity in the outermost portion of the RL-T, while the [Fe]+ and [Ni]+ maps show higher intensity.
The decreased intensity of [Cr]+ could reflect a depletion of Cr, but it cannot be excluded that “matrix effects” also play a role in the observed intensity variation. For example, carbon diffused into the alloy may reduce the ionization yield of Cr. Correspondingly, the intensity increase observed for [Fe]+ or [Ni]+ may partly originate from higher ionization yield when emitted from a region with corresponding composition.
The [Fe]+ map Figure 8(B1) shows some apparent microstructural features of the RL-T as well. This agrees with other results that, unlike the alloy core, the activated surface zone is multi-phase. In the region closest to the free surface, Fe is the most prominent of the alloy constituents.
Figure 9 depicts the [CrCl]+, [FeCl]+, and [NiCl]+ maps of the same samples SX (A) and TX (B). The trends seen in the [M]+ maps (M = Cr, Fe, Ni) are also apparent in these [MCl]+ maps. Namely, the [FeCl]+ intensity dominates the surface zone with an especially high intensity near the top surface for both the SX and the TX activated sample. [CrCl]+ shows a similar trend to [Cr]+ in Figure 8, where the low intensity area corresponds to the high [FeCl]+ intensity zone directly below the surface. However, in Figure 9(B0), there is a significant intensity of [CrCl]+ in the sub-surface zone between the Cr-depleted surface and the alloy core. These [MCl]+ maps also provide evidence that the apparent multi-phase structure seen in the BSE images are indeed regions with different composition. In Figure 4A.1, the mid-dense (mid-density) phase of the sub-surface zone is observed throughout, but with an especially thick zone at the top surface. This agrees well with the [Fe]+ and [FeCl]+ ToF-SIMS maps. Similarly, the dark-grey (low-density) phase matches the [Cr]+ and [CrCl]+ maps.
The maps of SX, the just “double-HCl”-activated sample, further confirm the hypothesis that activation is not simply the removal of the oxide film and that the activated surface zone is non-trivially thin and composed of chemical compounds of the alloy and activating species. The maps of the 15N2H4Cl-activated sample TX confirm this. Because of the activating processes, there is a thick and conformal MCl-containing layer over the alloy core.
The maps in Figure 10 show [O] and [Cl] for samples SX and TX as well as [2H] for the latter. [H]+ for the first sample is not shown. Since hydrogen is the primary contaminant in ultrahigh vacuum, hydrogen maps do not provide useful information. For sample SX, the overlay map Figure 10(A3) shows a high intensity of [Cl] in the surface zone, while [O] appears absent until the alloy substrate. Figure 10(B3) for sample TX shows the same trend, but with [2H] also present in the sub-surface zone. Owing to volatilization of the 2H-bearing species during XEDS analysis, the [2H] map shows a decreased intensity in a rectangular area at the center of the field.
Figure 11 shows the negative ToF-SIMS maps of [CrCl32H], [FeCl32H], and [NiCl32H] as well as positive map of [2H615N]+ from sample TX. These maps demonstrate that the Cl-rich RL-T is not a simple metal chloride, but actually includes significant levels of hydrogen (as 2H) and nitrogen (as 15N). Furthermore, the map Figure 11(A3) suggests that these species exist in metal-ammine or metal-ammonium compounds, such as an ammonium iron chloride. If the nitrogen in the layer were interstitial or in a metal nitride, the 2H and [2H615N]+ signals should be negligible in those areas.

3.4. Microstructure—Diffractometry

Aiming to understand the phases formed during reagent-pyrolysis- and double-HCl activation processes, we performed XRD. Figure 12 shows the diffractogram of sample TX. The main peaks originate from the alloy core, ammonium–iron chlorides, chromium ammine chloride, chromium chloride, residual NH4Cl, and SiO2. According to peak matching with library data, the latter likely originates from fiber insulation used while processing this sample. The NH4Cl is present because the NH4Cl was still undergoing pyrolysis at the end of the 2.7 ks isotherm. Apparently, the remaining NH3 (ammonia) and HCl gases condensed back onto the sample surface during furnace cooling, decorating it with small crystallites. The peaks from ammonium iron chlorides, chromium ammine chloride, and chromium chloride species corroborate the results from SEM, ToF-SIMS, and XEDS. FeCl3 is not among the apparent species. Thermodynamically, it could form from Fe and HCl, but it appears that the ammonium iron chlorides are the favored product, owing to the presence of NH3 and HCl.
Figure 13 shows the diffractograms for samples XX (no activation, nor carburization), SX (activation S, no C), SC (activation S, then carburization C), and TC (activaton T, then carburization C). Compared to XX, sample SX shows the austenite peaks shifted toward lower spatial frequencies. This indicates a lattice parameter expansion caused by carbon infusion during the short carburization Carb(1) between the HCl gas steps HCl(1) and HCl(2). Furthermore, the expanded-austenite peaks appear distinct from the still-present original austenite peaks in the diffractogram, rather than a single asymmetric shifted peak that is often observed after full low-temperature carburization. This indicates that the XRD beam substantially probed into the deeper, non-expanded austenite of the alloy core. Additionally, non-austenite peaks are observed at low spatial frequencies. They originate from oxides and hydrated/oxidized chlorides of the matrix metals. During the experiments, we observed carbon soot on the alloy surface, which may explain some of the peaks observed at small spatial frequencies.
To explore how these samples with different surface activation respond to subsequent low-temperature carburization, compare the diffractograms of samples SC and TC. The diffractogram of sample TC exhibits significantly shifted austenite peaks, indicative of considerably high carbon level and a mean depth of carburization comparable to the penetration depth of the Co-Kα X-rays (≈5 μm). The diffractogram of sample SC also exhibits these peak shifts, but to a lesser extent. The diffractograms of both samples feature the usual asymmetric and shifted austenite peaks without distinct peaks for the original austenite like those seen in the diffractogram of sample SX.
As mentioned, the peak shifts indicate an expansion of the spacings between metal atoms. The effective lattice parameter observed in X-ray diffractograms positively correlates with the carbon penetration [40]
Γ : = 0 z X [ z ] d z .
However, the exact relationship between peak shift, peak shape, and the carbon-fraction–depth profile X C [ z ] is complicated. Part of the complication is that absorption of the X-ray beam, exponentially dependent on path length, but also on density, thus carbon fraction XC, leads to reduced X-ray beam intensity in greater depths. Moreover, the intensity as a function of depth depends on the diffraction angle θ B , as this determines the relationship between depth and path length. What appears as a peak in X-ray diffractograms can be understood as weighed superposition (integral) of peaks originating from different depths z with correspondingly different carbon fractions X C [ z ] and weighing factors that correspond on the diffraction angle θ B .
Table 3 shows XRD data for the tested samples. Using the data from specimen XX (non-treated) as a baseline, the peak shifts for the treated samples were determined from the location q 0 of the maximum of the cross-correlation function (1). Effective lattice parameters were calculated for each peak i = 1 3 and an overall effective lattice parameter a 0 determined by the Nelson–Riley correction, i.e., extrapolating the linear regression line of the lattice parameters a i = : a [ θ i ] versus the Nelson–Riley function
f [ θ i ] : = Cos [ θ i ] 2 Sin [ θ i ] + Cos [ θ i ] θ i
to obtain a 0 = a | f [ θ ] = 0 . In each sample, the effective lattice parameter a 0 is found increased versus that of the alloy core, owing to carbon infusion. Sample SX (activation S, no C), as it had only a brief carburization, exhibits only a 1.1% expansion of the effective lattice parameter. The diffractograms of sample SC (activation S, then carburization C) exhibits a larger effective lattice parameter expansion of 2.6%. Sample TC (activaton T, then carburization C) shows the largest peak shift of all, indicating a 3.1% expansion of the effective lattice parameter. Although sample TC only had the second-long-carburization step, it appears to have absorbed more carbon than the double-HCl-activated-and-carburized sample with its longer total exposure to low-temperature carburization.
The expansion of the effective lattice parameter measured by XRD correlates with the observed increase in microhardness. Of all tested samples, the NH4Cl-activated-and-carburized sample TC exhibits the most pronounced peak shifts and effective lattice parameter expansion as well as the highest surface hardness.

3.5. NH4Cl-Pyrolysis Low-Temperature Nitriding

Lastly, a foil sample was low-temperature nitrided with NH4Cl at 773 K for 1.8 ks to determine if NH4Cl and the reaction layer it forms can lead to infusion of interstitial nitrogen at typical temperatures for low-temperature nitriding and carburizing. This was a necessary analysis because it was unknown whether NH4Cl, which pyrolyzes completely around ≈600 K, would impart the reaction layer with species of suitable type and quantity to infuse nitrogen at temperature. Metallography shows a uniform 2 μm-deep treated zone around the entire surface. XRD confirmed that the surface has a thin nitrogen-expanded austenite layer. It does not show indications of nitride precipitation.

3.6. Summary of Results

The results reveal differences and similarities between surface activation by direct supply of gas (double-HCl activation) and gas from reagent pyrolysis. Both methods effectively remove the carbon diffusion barrier that initially exists as a passivating oxide film on the alloy surface. The results of ToF-SIMS indicate that both types of surface activation produce zones containing significant levels of chlorine. The 15N2H4Cl-activated sample also contains significant levels of 15N2H4-related species as well as segregated matrix elements. The XEDS data show that 15N2H4Cl-activation causes significant segregation of Fe and Ni away from Cr within the sub-surface zone. The XRD diffractograms demonstrate that the NH4Cl-activated surface contains primarily ammonium–iron chlorides and chromium ammine chloride. On the various carburized samples, XRD reveal austenite peak shifts indicating high levels of interstitial carbon. The largest peak shift is observed for the 15N2H4Cl-activated TX sample. This result agrees with the higher surface hardness observed as compared to SC samples. Additionally, low-temperature nitriding is possible with NH4Cl.

4. Discussion

Our data show that the native oxide on alloys such as AISI-316L constitutes a diffusion barrier to carbon and nitrogen. This is evident from the inconsistency and the overall low level of hardening exhibited by samples XC, carburized without prior surface activation. Therefore, surface engineering of such alloys by infusion of interstitial solute (carbon or nitrogen) requires surface activation, meaning removal of the oxide film or making it permeable to carbon and nitrogen.
For the first time, we have observed that surface activation can involve considerable microscopic complexity in addition to removing the oxide film (or perforating it or making it permeable). Our results of heat treatments and surface analysis reveal that an alloy surface that is “activated” for infusion of carbon (or nitrogen) can differ much from a “bare” alloy surface. Instead of the latter, we find that an activated alloy surface can be covered by a non-metallic substance with a complex microstructure and phase composition. We could neither directly observe the initial oxide film on the as-received alloy, nor its removal or modification toward increased permeability. However, since the activation methods we applied enable effective infusion of interstitial solute, carbon in this work, we conclude that the passivating oxide film that initially covers the alloy surface is removed, perforated, or, at least, made permeable to carbon (and nitrogen) as non-metallic reaction layer (RL-S or RL-T) forms on the surface.

4.1. AS–”Double-HCl” Activation–Model

For “double-HCl” activation, operating with direct gas supply, our results suggest the following model, illustrated in Figure 14: During HCl(1), HCl gas attacks the initially present surface oxide film, which constitutes a diffusion barrier to carbon (and nitrogen). When the oxide is removed, HCl gas reacts with the underlying alloy constituents to cover the surface with a reaction layer consisting of solid metal chlorides, similar to what Figrues Figure 4, Figure 8 and Figure 9 show at the end of the activation process. Subsequently, during Carb(1), providing CO and H2, this layer decomposes, and, by reaction with H2, produces HCl. This HCl, as in HCl(1), will initially assist to suppress re-formation of an oxide film on the alloy surface while the CO provides carbon to diffuse into the alloy. As always, carbon occupying interstitial sites will locally expand the spacing of metal atoms (not shown). In the course of Carb(1), however, when the Cl-containing reaction layer is completely decomposed, an oxide film will re-form, gradually re-erecting the initial carbon-diffusion barrier. This explains what was empirically found by industry, namely that carburization cannot just be continued after HCl(1)—a second HCl step, HCl(2), is needed to remove the re-formed oxide. Continuation of Carb(1) against the forming diffusion barrier leads to the formation of soot particles, as observed on the surface of SX in Figure 4A.0.
After HCl(2), the surface is again covered by a layer of solid metal chlorides (Figure 4, Figure 8 and Figure 9). Different from the layer formed in HCl(1), however, this layer will also contain carbon—from the soot left behind from Carb(1) as well as from HCl(2) etching into the alloy already carburized by Carb(1). The next step, Carb(2), i.e., continuous carburization, begins with heating to carburization temperature. Upon heating, the metal-cloride/carbon layer will again decompose, release HCl, and so suppress re-formation of an oxide film. This time, however, the decomposing layer will also release carbon, adding to the carbon activity resulting from the supplied CO gas. This will accelerate the transport of carbon into the alloy. The increasing fraction of carbon will increase the spacing of the metal atoms (not shown). This lowers the saddle-point energy associated with carbon jumps and increases carbon diffusivity [48]. The increasing sub-surface carbon level will increasingly impede re-formation of a passivating oxide film, even in the absence of HCl. The physical reason is that the infused interstitial carbon forms polar covalent bonds with the metal atoms, especially Cr [5]. At high carbon levels, consequently, the majority of the metal atoms will be bonded to carbon. This reduces the activity (availability) of Cr for surface oxidation, thus impedes the formation of the regular Cr-rich oxide film on the surface of AISI-316L. This theory is supported by the unrelated and much earlier empirical finding that HCl(2) improves the uniformity of solute infusion and decreases the probability of interruptions more effectively than a single HCl step with the same total duration [18].

4.2. AT–Activation by Gas from Solid-Reagent Pyrolysis—Model

For activation by gas from pyrolysis of NH4Cl, our results suggest a different microscopic mechanism, illustrated in Figure 15: The gas that results from NH4Cl reacts with the alloy surface. The reaction products build up the RL-T, a multi-phase product layer with a complex architecture and microstructure, predominantly consisting of the observed metal chlorides and ammonium (Figure 4, Figure 5, Figure 6, Figure 7, Figure 8, Figure 9, Figure 10 and Figure 11). NH4Cl (and 15N2H4Cl), in particular, pyrolyze to give off NH3 and HCl [36]. Both are known to attack Cr-rich oxide. We conclude that these molecules perforate/remove the passivating oxide film that initially covers the alloy surface.
The hardness–depth profiles h [ z ] in Figure 3 and XRD results in Table 3 obtained after low-temperature carburization quantitatively show that surface activation via gas from solid-reagent pyrolysis is somewhat more effective than what can currently be accomplished by “double-HCl” activation. Moreover, the RL-T generated by activation via gas from solid-reagent pyrolysis can even keep the surface activated after air exposure to the extent that specimens can be transferred to another furnace through air and be carburized or nitrided at low temperature without further surface activation. This is similar to the “provisional” passivation we observed earlier in the context of liquid-HCl activation [34].
The temporal evolution of the RL-T can be understood by considering the microstructure of samples activated for different times. If the layer growth were limited by diffusion, the layer thickness w should be of the form
w t .
The data on the temporal evolution of the RL-T presented in Results Section 3.2, in contrast, more suggest a linear form,
w = κ t ,
where κ = (2.5 ± 0.8) nm/s. Generally, a linear growth law suggests that the growth rate is not limited by diffusion, but, instead, by the reaction rate at an interface. The interface in question is the fractal interface between Zone 0 (alloy core) and Zone-1 (RL-T). This means that the RL-T with a thickness in the range we observe here does not passivate the alloy surface. The linear growth law suggests that the transport rate of nitrogen (ammine) and chlorine species to the RL-T–alloy interface is faster than the layer can form at this interface.
The different degrees of surface voids and porosity at different stages provide further information about the temporal evolution of the layer. For example, the TX sample activated for only 0.3 ks shows minor porosity at the top surface (Zone 3), while the two samples activated for longer times show more distinct and coarse voids (Figure 5). This difference can be understood as progressing void formation in situ, in a pre-existing layer. The voids observed after longer activation, e.g., in Figure 4B.2, may have grown as Cr in the dark-grey-looking regions reacted with HCl (g) and formed CrCl3 (g). The interface between the voids and the two-phase region often end in a network of smaller pores within the dark-grey-looking phase. A reaction between these Cr-rich fields and HCl (g) would explain why the dark-grey-looking phase only volatilizes at sites reachable by gaseous species instead of volatilizing in all areas.
Alternatively, the voids can be understood as gaps between outward-growing “pillars” of layer material. This would require significant diffusion of metal atoms to supply the growths. Such diffusion would be unlikely in a bulk alloy, but BSE images show that the reaction layer has a considerably lower mass density than the alloy. Additionally, it is observed that the two-phase region has a coarser microstructure nearer to the surface and this coarsening (with segregation of Cr from Fe and Ni) suggests significant metal-atom diffusion. The low density of the RL-T may also explain why the reaction can continue and the reaction layer–alloy interface continues to propagate into the alloy: The low density of the layer allows for rapid diffusion of the relevant reaction species (e.g., NH3 and HCl) to migrate from the gas phase to the layer–alloy interface, where the reaction proceeds.
The findings of the present work on reactions between NH4Cl and AISI-316L agree with the results of comparable studies in the literature. Meyer et al. discusses the use of NH4Cl pyrolysis to produce more usable products from various rare-earth sesquioxides [51]. They discuss that Y2O3 would not normally react with HCl gas in this temperature regime (575–675 K), but with NH4Cl producing both HCl and NH3, the oxide reacts to form a metal ammonium chloride with water as a byproduct. This “ammonium chloride route” requires both an acid–base reaction and the formation of a complex. Meyer et al. go on to suggest that H+, rather than HCl, acts as the acidic species. Other researchers have produced corroborating results of Fe- and Cr- alloy and oxide systems forming these metal-ammine- and metal-ammonium-chloride complexes in this temperature range [52,53,54].

4.3. Commonalities and Differences

Comparing the microscopic mechanisms of surface activation of AISI-316L by products of solid-reagent pyrolysis versus surface activation by direct supply of gas, our analysis reveals significant differences, but also important similarities/principles.
Common to both approaches is the removal of the diffusion barrier represented by the initial passivating oxide film, either by removing the film, perforating it, or making it permeable to carbon and nitrogen. According to our results, however, the micromechanism of each activation process is much more complicated than simply stripping the native oxide film to expose a bare alloy surface that enables subsequent infusion of carbon by contact with a gas. Our central finding is that both types of activation rely on covering the alloy surface with a solid reaction layer providing a storage for Cl and carbon or nitrogen atoms that is orders of magnitude higher than in a gas. In both activation processes, therefore, the critical initial phase of carburization, in which the carbon level in the alloy is not yet high enough to impede re-formation of a passivating oxide film diffusion barrier, can be overcome by the simultaneous release of highly active Cl and carbon or nitrogen from the reaction layer.
This insight raises the question as to whether infusion carbon through a—hypothetical—bare alloy surface would even work under practical conditions. The carburizing gas, supplied at near-normal pressure p ⪆ 0.10 MPa, mainly consists of CO and H2, but also contains traces of O2. For treating a bare alloy surface, this gas may not provide sufficient carbon activity to reach a carbon level in the alloy that sufficiently impedes re-passivation before the residual oxygen in the gas has formed a passivating oxide film.
Comparing computer simulated carbon-fraction–depth profiles X C [ z ] with experimentally acquired profiles reveals that the latter exhibit a smaller than expected carbon fraction gradient p d i f z X C in small depths. This behavior can be understood and simulated by assuming a gradual decrease in the carbon permeability of the alloy surface with increasing time. Although high concentrations of covalently bonded carbon impede the re-formation of a passivating oxide film, re-passivation will eventually occur during technically relevant processing times, 10(4.5) ks. In the limit of complete surface passivation, increasing processing time is expected to merely flatten X C [ z ] , without increasing 0 X C [ z ] d z any further.
A common side benefit of both activation variants is that etching the initial sub-surface zone of the alloy can remove a portion of a potentially existing “Beilby Layer”, a surface-machining-induced defect-rich sub-surface zone that is known to inhibit infusion of interstitial solute [22,23,24,34,55].

4.4. Differences

Measuring the efficacy of activation methods by the hardness–depth profile h [ z ] they enable to be obtained by subsequent low-temperature carburization, Figure 3 indicates that surface activation by gas generated through solid-reagent pyrolysis is more effective than “double HCl” activation. This can be explained as follows.
“Double HCl” activation may be less effective because it alternates between removing oxide and infusing carbon. During Carb(1), no HCl is present. This means that oxide can re-form during Carb(1). On the other hand, no carbon is present to be infused during HCl(1) and HCl(2). On the contrary, HCl(2) will etch away part of the sub-surface zone of the alloy that is already infused with carbon. Further, oxide removal by HCl(1,2) and infusion of interstitial solute by Carb(1,2) are being carried out at different temperature. The transition time between HCl(2) and Carb(2) likely allows re-passivation to progress.
Activation by gas from solid-reagent pyrolysis, in contrast, builds a thick reaction layer that, on heat-driven decomposition, simultaneously provides high activity of HCl and interstitial solute—nitrogen in this case. From the observations of NH4Cl producing a thin z ¯ = 0.5 and z ¯ = 2 μm nitrided surface layer on AISI-316L at 723 and 773 K in 1.8 ks, respectively, we know that heating the reaction layer for carburization produces atomic nitrogen. Similar to carbon, concentrated interstitial nitrogen may impede the re-formation of an oxide film by establishing M–N bonds. If so, the dynamic equilibrium of etching and nitrogen infusion can prevent repassivation while building up a sub-surface nitrogen fraction that effectively prevents re-passivation during subsequent carburization—without further activation.
Further, interstitial nitrogen in austenite is known to expand the distances between metal atoms in a similar way as carbon does. Such lattice parameter expansion is expected to promote the infusion of carbon by increasing carbon diffusivity [48]. As another side effect, the presence of nitrogen in austenite elevates the activity coefficient of carbon. Consequently, incoming nitrogen can “push” already infused carbon deeper into the alloy [20,56,57]. However, this effect is not likely to play a role here because nitrogen will be infused from the decomposing RL-T before a significant carbon activity can build up at the alloy surface in step C in Figure 15.
Finally, with the parameters we have employed, the RL-T is thicker than the RL-S obtained with “double HCl” activation. Consequently, it constitutes a larger reservoir of densely-packed Cl and solute (nitrogen) than the RL-S, which is helpful for effectively approaching solute levels at which the alloy can be carburized for a prolonged time without additional activation.

5. Conclusions

Surface engineering of AISI-316L or similar alloys by low-temperature carburization, -nitridation, or -nitro-carburization requires surface activation. This means to remove, perforate, or make permeable the Cr-rich oxide film that naturally forms on these alloys and constitutes a diffusion barrier to carbon and nitrogen at low temperature.
The new approach to surface activation we introduce in this article, using gas generated pyrolysis of a reagent powder, NH4Cl, is more potent than the established, industrially used “double HCl” method. As one particularly strong feature, it can be used in conjunction with subsequent infusion of interstitial solute by the same, pyrolysis-generated gas, but also in a hybrid fashion where specimens are transferred—through air—into a gas furnace and infused with interstitial solute without the need for further surface activation.
Both activation processes operate with gas that reacts with the alloy to produce a non-metallic solid reaction layer over the alloy surface. When this layer, rich in Cl and carbon or nitrogen atoms, decomposes at the beginning of low-temperature carburization, it generates a high activity of Cl and carbon or nitrogen. Cl works to impede re-formation of an oxide film. Carbon or nitrogen diffuses into the alloy to rapidly build up the sub-surface concentration of interstitial solute toward a level at which the covalent bonding between solute and metal atoms impedes the re-formation of surface oxide to a degree that enables continuous low-temperature carburization without further activation.
We conclude that an “activated” surface of AISI-316L, enabling continued infusion of interstitial solute from a gas phase, can be much different from a “bare” alloy surface that would result from simply stripping the passivating oxide. In fact, it is doubtful that a bare alloy surface could even be effectively carburized from a gas phase at low temperature in the presence of an oxygen activity as low as it is realizable in industrial settings.
With the processing parameters we have employed, solid-reagent-pyrolysis-based surface activation proves to be more effective than “double HCl” activation. It generates a thicker reaction layer that provides more Cl and interstitial solute (nitrogen) to be released at the beginning of low-temperature carburized. Moreover, oxide removal and infusion of solute are performed concomitantly, which constitutes a conceptual advantage over the less effective, mutually inhibiting way in which “double HCl” activation alternates these two essential components of surface activation.
While we observe significant differences in the microscopic mechanisms by which the two different activation process operate, the observed difference in activation efficacy is not necessarily inherent to the two different approaches. With the insights we gained in this study, the specific parameters of each process can be adjusted further to optimize the results.

Author Contributions

Conceptualization, C.I. and F.E.; methodology, C.I.; validation, C.I., Z.R. and F.E.; formal analysis, C.I., Z.R. and F.E.; investigation, C.I.; resources, C.I.; data curation, C.I., Z.R. and F.E.; writing—original draft preparation, C.I.; writing—review and editing, C.I., Z.R and F.E.; visualization, C.I., Z.R. and F.E.; supervision, F.E.; project administration, C.I. and F.E.; funding acquisition, F.E. All authors have read and agreed to the published version of the manuscript.

Funding

This research was made possible through funding by Swagelok Co.

Data Availability Statement

Data is contained within the article, and may also be available upon reasonable request.

Acknowledgments

We acknowledge financial support from Swagelok. We would like to thank P Williams, C Semkow, and J Gress of Swagelok for helpful discussions and for providing the steel specimens for testing. We acknowledge SCSAM (Swagelok Center for Surface Analysis of Materials) in the Case School of Engineering at Case Western Reserve University for the usage of instruments and the support SCSAM engineers have provided with the collection and analysis of SEM, XEDS, and ToF-SIMS data.

Conflicts of Interest

Z. Ren declares no conflict of interest. C. Illing and F. Ernst received financial support from Swagelok Co.

References

  1. Martin, F.; Natishan, P.; Lemieux, E.; Newbauer, T.; Rayne, R.; Bayles, R.; Kahn, H.; Michal, G.; Ernst, F.; Heuer, A. Enhanced corrosion resistance of stainless steel carburized at low temperature. Metall. Mater. Trans. A 2009, 40, 1805–1810. [Google Scholar] [CrossRef]
  2. Natishan, P.; Bayles, R.; Rayne, R.; Longazel, T.; Martin, F.; Kahn, H.; Heuer, A. Interstitial hardening of type 316L stainless steel to improve corrosion resistance and mechanical properties. Corrosion 2012, 68, 638–644. [Google Scholar] [CrossRef] [PubMed]
  3. Sun, Y. Response of cast austenitic stainless steel to low temperature plasma carburizing. Mater. Des. 2009, 30, 1377–1380. [Google Scholar] [CrossRef]
  4. Martin, F.; Lemieux, E.; Newbauer, T.; Bayles, R.; Natishan, P.; Kahn, H.; Michal, G.; Ernst, F.; Heuer, A. Carburization-induced passivity of 316 L austenitic stainless steel. Electrochem. Solid State Lett. 2007, 10, C76. [Google Scholar] [CrossRef]
  5. Li, T.; Chien, S.C.; Ren, Z.; Windl, W.; Ernst, F.; Frankel, G.S. Understanding the efficacy of concentrated interstitial carbon in enhancing the pitting corrosion resistance of stainless steel. Acta Mater. 2021, 221, 117433. [Google Scholar] [CrossRef]
  6. Collins, S.R.; Williams, P.C.; Marx, S.V.; Heuer, A.H.; Ernst, F.; Kahn, H. Low-Temperature Carburization of Austenitic Stainless Steels. In ASM Handbook: Vol. 4D, Heat Treating of Irons and Steels; Dossett, J., Totten, G., Eds.; ASM International: Materials Park, OH, USA, 2014; Volume 4, pp. 451–460. [Google Scholar]
  7. Dong, H. S-phase surface engineering of Fe—Cr, Co—Cr and Ni—Cr alloys. Int. Mater. Rev. 2010, 55, 65–98. [Google Scholar] [CrossRef]
  8. Borgioli, F. From Austenitic Stainless Steel to Expanded Austenite-S Phase: Formation, Characteristics and Properties of an Elusive Metastable Phase. Metals 2020, 10, 187. [Google Scholar] [CrossRef]
  9. Cao, Y.; Ernst, F.; Michal, G. Colossal Carbon Supersaturation in Austenitic Stainless Steels Carburized at Low Temperature. Acta Mater. 2004, 51, 4171–4181. [Google Scholar] [CrossRef]
  10. Collins, S.; Williams, P. Low-Temperature Colossal Supersaturation. Adv. Mater. Process. 2006, 164, 32–33. [Google Scholar]
  11. Tong, W.; Tao, N.; Wang, Z.; Lu, J.; Lu, K. Nitriding iron at lower temperatures. Science 2003, 299, 686–688. [Google Scholar] [CrossRef]
  12. Wu, D. Low-Temperature Gas-Phase Nitriding and Nitrocarburizing of 316L Austenitic Stainless Steel. Ph.D. Thesis, Case Western Reserve University, Cleveland, OH, USA, 2013. [Google Scholar]
  13. Wu, D.; Ge, Y.; Kahn, H.; Ernst, F.; Heuer, A.H. Diffusion Profiles After Nitrocarburizing Austenitic Stainless Steel. Surf. Coatings Technol. 2016, 279, 180–185. [Google Scholar] [CrossRef]
  14. Niu, W.; Li, Z.; Ernst, F.; Lillard, R. The passivity of low-temperature carburized austenitic stainless steel AISI-316L in a simulated boiling-water-reactor environment. J. Nucl. Mater. 2020, 537, 152197. [Google Scholar] [CrossRef]
  15. Williams, P.C.; Marx, S.V. Low Temperature Case Hardening Processes. U.S. Patent 6,093,303, 2000. [Google Scholar]
  16. Williams, P.C.; Marx, S.V. Selective Case Hardening Processes at Low Temperature. U.S. Patent 6,165,597, 2000. [Google Scholar]
  17. Williams, P.C.; Marx, S.V. Low Temperature Case Hardening Processes. U.S. Patent 6,461,448, 2002. [Google Scholar]
  18. Williams, P.C.; Marx, S.V. Modified Low Temperature Case Hardening Processes. U.S. Patent 6,547,888, 2003. [Google Scholar]
  19. Sun, Y. Kinetics of low temperature plasma carburizing of austenitic stainless steels. J. Mater. Process. Technol. 2005, 168, 189–194. [Google Scholar] [CrossRef]
  20. Gu, X.; Michal, G.M.; Ernst, F.; Kahn, H.; Heuer, A.H. Concentration-Dependent Carbon Diffusivity in Austenite. Metall. Mater. Trans. A 2014, 45, 3790–3799. [Google Scholar] [CrossRef]
  21. Gu, X. Numerical Simulations of Concentration-Depth Profiles of Carbon and Nitrogen in Austenitic Stainless Steel Based upon Highly Concentration Dependent Diffusivities. Ph.D. Thesis, Case Western Reserve University, Cleveland, OH, USA, 2011. [Google Scholar]
  22. Ge, Y.; Ernst, F.; Kahn, H.; Heuer, A.H. The Effect of Surface Finish on Low-Temperature + Acetylene-Based Carburization of 316L Austenitic Stainless Steel. Metall. Mater. Trans. A 2014, 45, 2338–2345. [Google Scholar] [CrossRef]
  23. Ge, Y. Low-Temperature Acetylene-Based Carburization and Nitrocarburizing of 316L Austenitic Stainless Steel. Ph.D. Thesis, Case Western Reserve University, Cleveland, OH, USA, 2013. [Google Scholar]
  24. Agaponova, A. Encapsulation Method for Surface Engineering of Corrosion-Resistant Alloys by Low-Temperature Nitro-Carburization. Master’s Thesis, Case Western Reserve University, Cleveland, OH, USA, 2015. [Google Scholar]
  25. Michal, G.M.; Ernst, F.; Kahn, H.; Cao, Y.; Oba, F.; Agarwal, N.; Heuer, A.H. Colossal Carbon Supersaturation due to Paraequilibrium Carburization: Stainless Steels with Greatly Improved Mechanical Properties. Acta Mater. 2006, 54, 1597–1606. [Google Scholar] [CrossRef]
  26. Michal, G.M.; Ernst, F.; Heuer, A.H. Carbon Paraequilibrium in Austenitic Stainless Steel. Metall. Mater. Trans. A 2006, 37, 1819–1824. [Google Scholar] [CrossRef]
  27. Christiansen, T.; Drouet, M.; Martinavičius, A.; Somers, M. Isotope exchange investigation of nitrogen redistribution in expanded austenite. Scr. Mater. 2013, 69, 582–585. [Google Scholar] [CrossRef]
  28. Martin, F.J.; Lemieux, E.J.; Newbauer, T.M.; Bayles, R.A.; Natishan, P.M.; H. Kahn, G.M.M.; Ernst, F.; Heuer, A.H. Carburization-Induced Passivity of 316L Austenitic Stainless Steel. Electrochem. Solid State Lett. 2007, 10, 1895–1906. [Google Scholar] [CrossRef]
  29. Sun, Y. Corrosion behaviour of low temperature plasma carburised 316L stainless steel in chloride containing solutions. Corros. Sci. 2010, 52, 2661–2670. [Google Scholar] [CrossRef]
  30. Heuer, A.H.; Kahn, H.; Ernst, F.; Michal, G.M.; Hovis, D.B.; Rayne, R.J.; Martin, F.J.; Natishan, P.M. Enhanced corrosion resistance of interstitially hardened stainless steel: Implications of a critical passive layer thickness for breakdown. Acta Mater. 2012, 60, 716–725. [Google Scholar] [CrossRef]
  31. Niu, W.; Lillard, R.; Li, Z.; Ernst, F. Properties of the passive film formed on interstitially hardened AISI 316L stainless steel. Electrochim. Acta 2015, 176, 410–419. [Google Scholar] [CrossRef]
  32. Rhodin, T.N. Oxide Films on Stainless Steels. Corros. Natl. Assoc. Corros. Eng. 1956, 12, 41–53. [Google Scholar] [CrossRef]
  33. Li, Z. Surface Hardening of Austenitic Fe-Cr-Ni Alloys for Accident-Tolerant Nuclear Fuel Cladding. Ph.D. Thesis, Case Western Reserve University, Cleveland, OH, USA, 2018. [Google Scholar]
  34. Li, Z.; Illing, C.; Heuer, A.H.; Ernst, F. Low-Temperature Carburization of AL-6XN Enabled by Provisional Passivation. Metals 2018, 8, 997. [Google Scholar] [CrossRef]
  35. Li, Z.; Ernst, F.; Kahn, H.; Heuer, A. Alloy Surface Activation by Immersion in Aqueous Acid Solution. U.S. Patent 10,450,658 B2, 2019. [Google Scholar]
  36. Illing, C.A.W. Chemical Mechanisms and Microstructural Modification of Alloy Surface Activation for Low-Temperature Carburization. Master’s Thesis, Case Western Reserve University School of Graduate Studies, Cleveland, OH, USA, 2018. [Google Scholar]
  37. Christiansen, T.L.; Somers, M.A.J. Low temperature gaseous surface hardening of stainless steel. HTM J. Heat Treat. Mater. 2011, 66, 109–115. [Google Scholar] [CrossRef]
  38. Tahara, M.; Senbokuya, H.; Kitano, K.; Hayashida, T. Method of Carburizing Austenitic Metal. U.S. Patent 5,593,510, 1997. [Google Scholar]
  39. Hsieh, M.C.; Ge, Y.; Kahn, H.; Michal, G.M.; Ernst, F.; Heuer, A.H. Volatility Diagrams for the Cr-O and Cr-Cl Systems: Application to Removal of Cr2O3-Rich Passive Films on Stainless Steel. Metall. Mater. Trans. B 2012, 43, 1187–1201. [Google Scholar] [CrossRef]
  40. Illing, C.; Ren, Z.; Agaponova, A.; Heuer, A.; Ernst, F. Rapid Alloy Surface Engineering through Closed-Vessel Reagent Pyrolysis. Metals 2021, 11, 1764. [Google Scholar] [CrossRef]
  41. Ren, Z. Intrinsic Properties of “Case” and Potential Biomedical Applications. Ph.D. Thesis, Case Western Reserve University, Cleveland, OH, USA, 2019. [Google Scholar]
  42. Ren, Z.; Eppell, S.; Collins, S.; Ernst, F. Co–Cr–Mo alloys: Improved wear resistance through low-temperature gas-phase nitro-carburization. Surf. Coatings Technol. 2019, 378, 124943. [Google Scholar] [CrossRef]
  43. Christiansen, T.L.; Hummelshoj, T.S.; Somers, M.A.J. A Method of Activating an Article of Passive Ferrous or Non-Ferrous Metal Prior to Carburizing, Nitriding and/or Nitrocarburizing. European Patent Application EP2278038-A1, 2011. [Google Scholar]
  44. Christiansen, T.L.; Hummelshoj, T.S.; Somers, M.A.J. Method of Activating an Article of Passive Ferrous or Non-Ferrous Metal Prior to Carburising, Nitriding and for Nitrocarburising. Patent WO2011009463-A1; US2012111456-A1; CN102471864-A; EP2467509-A1; JP2012533687-W; RU2012105919-A; SG177562-A1; US8845823-B2; RU2536841-C2; SG177562-B; CN102471864-B, 2011. [Google Scholar]
  45. Williams, P.C.; Marx, S.V.; Ernst, F.; Agaponova, A.V. Enhanced Activation of Self-Passivating Metals. U.S. Patent US10214805B2, 2019. [Google Scholar]
  46. Somers, M.; Christiansen, T. Gaseous processes for low temperature surface hardening of stainless steel. In Thermochemical Surface Engineering of Steels; Elsevier: Amsterdam, The Netherlands, 2015; pp. 581–614. [Google Scholar] [CrossRef]
  47. Illing, C.A. Alloy Surface Engineering by Solid-Reagent Pyrolysis. Ph.D. Thesis, Case Western Reserve University, Cleveland, OH, USA, 2022. [Google Scholar]
  48. Ernst, F.; Avishai, A.; Kahn, H.; Gu, X.; Michal, G.M.; Heuer, A.H. Enhanced Carbon Diffusion in Austenitic Stainless Steel Carburized at Low Temperature. Metall. Mater. Trans. A 2009, 40, 1768–1780. [Google Scholar] [CrossRef]
  49. A01 Committee. Specification for Annealed or Cold-Worked Austenitic Stainless Steel Sheet, Strip, Plate, and Flat Bar; Technical Report; ASTM International: West Conshohocken, PA, USA, 2015. [Google Scholar] [CrossRef]
  50. Cullity, B.D.; Stock, S.R. Elements of X-ray Diffraction; Prentice Hall: Upper Saddle River, NJ, USA, 2001. [Google Scholar]
  51. Meyer, G.; Staffel, T.; Doetsch, S.; Schleid, T. Versatility and low-temperature synthetic potential of ammonium halides. Inorg. Chem. 1985, 24, 3504–3505. [Google Scholar] [CrossRef]
  52. D’yachenko, A.N.; Kraidenko, R.I.; Smorokov, A.A. Preparation of High-Purity Iron by Means of Ammonium Chloride Complexes. Russ. J. Inorg. Chem. 2018, 63, 736–741. [Google Scholar] [CrossRef]
  53. Bremm, S.; Meyer, G. Reactivity of Ammonium Halides: Action of Ammonium Chloride and Bromide on Iron and Iron(III) Chloride and Bromide. Z. Für Anorg. Und Allg. Chem. 2003, 629, 1875–1880. [Google Scholar] [CrossRef]
  54. Kyuno, E.; Kamada, M.; Tanaka, N. Systematic Synthesis of Ammine Series of Chromium(III) Complexes. Bull. Chem. Soc. Jpn. 1967, 40, 1848–1854. [Google Scholar] [CrossRef]
  55. Finch, G.I.; Quarrell, A.G. The Beilby Layer. Nature 1936, 137, 516–519. [Google Scholar] [CrossRef]
  56. Tsujikawa, M.; Yamauchi, N.; Ueda, N.; Sone, T.; Hirose, Y. Behavior of carbon in low temperature plasma nitriding layer of austenitic stainless steel. Surf. Coatings Technol. 2005, 193, 309–313. [Google Scholar] [CrossRef]
  57. Gu, X.; Michal, G.M.; Ernst, F.; Kahn, H.; Heuer, A.H. Numerical Simulations of Carbon and Nitrogen Composition-Depth Profiles in Nitrocarburized Austenitic Stainless Steels. Metall. Mater. Trans. A 2014, 45, 4268–4279. [Google Scholar] [CrossRef]
Figure 1. Ferrule, made of a Ni-rich and Cr-rich austenitic stainless steel AISI-316L.
Metals 13 00335 g001
Figure 2. Overview of “Hybrid Processing” for ex situ surface activation via gas from solid-reagent pyrolysis followed by gas-phase low-temperature carburization.
Metals 13 00335 g002
Figure 3. Hardness–depth profiles h [ z ] of low-temperature-carburized AISI-316L samples: XC, SC, and TC. The profiles were obtained using a Vickers indenter with a load of 25 gf.
Metals 13 00335 g003
Figure 4. SE (A.0,B.0,A.2,B.2) and BSE (A.1,B.1) SEM images of FIB-cuts showing the activated surface of an AISI-316L sample. (A.0) through (A.2) depict sample SX. (B.0) through (B.2) depict sample TX. The red outlines in (A.0) and (B.0) mark the view areas shown in (A.1) and (B.1), respectively. SX: activated by direct HCl gas exposure with the “double-HCl” process. TX: activated by gas from pyrolysis of 15N2H4Cl.
Metals 13 00335 g004
Figure 5. SEM images of FIB-cuts showing the activated surface of AISI-316L samples TX, activated with 15N2H4Cl at 563 K. (A) Activated for 0.3 ks. (B) Activated for 0.9 ks. (C) Activated for 2.7 ks).
Metals 13 00335 g005
Figure 6. XEDS maps of the FIB-cut sub-surface zone of AISI-316L sample TX activated by 15N2H4Cl reagent pyrolysis at 563 K for 2.7 ks.
Metals 13 00335 g006
Figure 7. XEDS line scan along the line shown in red through the SEM image of the FIB-cut sub-surface zone of AISI-316L sample TX activated by 15N2H4Cl reagent pyrolysis. The plot below displays the variation of the local atom fraction X of Cl, Fe, Cr, and Ni along the scan line. The atom fractions were obtained from the measured corresponding local intensities of element-characteristic X-rays, taking into account “k-factors”.
Metals 13 00335 g007
Figure 8. ToF-SIMS maps [Cr]+, [Fe]+, and [Ni]+ and overlay. SX: activated by direct HCl gas exposure with the “double-HCl” process. TX: activated by gas from pyrolysis of 15N2H4Cl.
Metals 13 00335 g008
Figure 9. ToF-SIMS maps [CrCl]+, [FeCl]+, [NiCl]+ and overlay. SX: activated by direct HCl gas exposure with the “double-HCl” process. TX: activated by gas from pyrolysis of 15N2H4Cl.
Metals 13 00335 g009
Figure 10. ToF-SIMS maps [O], [2H], and [Cl] and overlay. SX: activated by direct HCl gas exposure with the “double-HCl” process. TX: activated by gas from pyrolysis of 15N2H4Cl.
Metals 13 00335 g010
Figure 11. TX activated with 15N2H4Cl: ToF-SIMS maps [CrCl32H], [FeCl32H], [NiCl32H] as well as map of [2H615N]+.
Metals 13 00335 g011
Figure 12. X-ray diffractogram of AISI-316L sample TX (activation T, no C), confirming the presence of metal-ammine/ammonium chlorides.
Metals 13 00335 g012
Figure 13. X-ray diffractograms of AISI-316L samples XX, SC (activation S, then carburization C), SX (activation S, no C), and TC (activaton T, then carburization C).
Metals 13 00335 g013
Figure 14. Model for the microscopic mechanism of AS—“double HCl”—surface activation and subsequent low-temperature gas-phase carburization of austenitic Cr-bearing alloys. The bold line shows the height z of the alloy surface as a function of time t. (A) Initial state, alloy surface passivated by oxide film. (B) ”Double HCl” activation, consisting of HCl(1), Carb(1), HCl(2), see Table 1. (C) Continuous low-temperature carburization, Carb(2).
Metals 13 00335 g014
Figure 15. Model for the microscopic mechanism of AT—surface activation via solid-reagent pyrolysis—and subsequent low-temperature gas-phase carburization of austenitic Cr-bearing alloys. The bold line shows the height z of the alloy surface as a function of time t. (A) Initial state, alloy surface passivated by oxide film. (B) Alloy surface reacts with molecules generated by solid-reagent pyrolysis, e.g., NH3, HCl. Result: Oxide film removal, reaction layer consisting of ammonium–iron chlorides and chromium ammine chloride, provisional passivation. (C) Continuous low-temperature carburization, Carb. In the beginning, heating to carburization temperature and H2 supply induce decomposition of reaction layer. Decomposition generates activity of Cl and nitrogen.
Metals 13 00335 g015
Table 1. Treatment- and sample codes.
CodeTreatment
XNo treatment.
SSurface activation AS: Sequential steps of etching and solute infusion.
Direct supply of HCl gas in HCl(1,2) and (CO + H2) in Carb(1).
Treatment: HCl(1), Carb(1), HCl(2), purge/cool, air exposure.
TSurface activation AT: In-tandem etching and solute infusion.
Gas from pyrolysis of solid reagent powder—NH4Cl.
Treatment: Heat specimen with reagent, cool, air exposure.
CContinuous solute infusion IC, carried out as low-temperature carburization.
Treatment: Heat, expose to carburizing gas, cool, air exposure.
CodeSample
XXNon-treated: no surface activation, nor carburization.
SXActivation S only. No C.
SCS followed by C.
XCC without prior S or T.
TXActivation T only. No C.
TCT followed by C.
Table 2. Composition of Ni- and Cr-rich AISI-316L by atom fractions.
FeCrNiMnSi
0.6430.1860.1180.020≤0.015
MoNCPS
0.012≤0.0039≤0.0014≤0.0008≤0.0005
Table 3. XRD results.
SampleDataLattice Parameter
Peakq (nm−1) (1)2 θ ( )a (nm) (2) Δ a/aXX
1114.8151.0
XX2005.5459.40.360
2207.8689.3
1114.7350.0
SX2005.4258.00.3640.011 (1.1%)
2207.7587.8
1114.7049.7
SC2005.3657.30.3690.026 (2.6%)
2207.6786.6
1114.6849.5
TC2005.3256.90.3710.031 (3.1%)
2207.6386.1
(1) shifted peak locations calculated as maximum value of CCF (cross-correlation function) between XX and act./carb. samples. (2) a: lattice parameter extrapolated from ahkl with Nelson-Riley correction function (1/2)(cos2(Θ)/sin(Θ) + sin2(Θ)/Θ) .
Disclaimer/Publisher’s Note: The statements, opinions and data contained in all publications are solely those of the individual author(s) and contributor(s) and not of MDPI and/or the editor(s). MDPI and/or the editor(s) disclaim responsibility for any injury to people or property resulting from any ideas, methods, instructions or products referred to in the content.

