Article

Investigation of Causal Relationships between Printing Parameters, Pore Properties and Porosity in Laser Powder Bed Fusion

Department of Materials Engineering, Auburn University, Auburn, AL 36849, USA
*
Author to whom correspondence should be addressed.
Metals 2023, 13(2), 330; https://doi.org/10.3390/met13020330
Submission received: 6 January 2023 / Revised: 26 January 2023 / Accepted: 3 February 2023 / Published: 6 February 2023

Abstract

:
This work reports on employing X-ray computed tomography (XCT) and optical microscopy to investigate the causal relationships between printing parameters, pore properties, and porosity in 316L stainless steel samples additively manufactured by Laser Powder Bed Fusion (LPBF). The porosity is very similar for both investigation methods. XCT provides more accurate results for large lack of fusion pores, while optical results are more accurate for small keyhole pores. These results were employed to develop mathematical models to determine how printing parameters influence pore properties and overall porosity. The developed optical and XCT mathematical models reveal that power is the most significant factor affecting pore properties and overall porosity. Pore number and mean diameter decrease and sphericity increases with increasing power. Overall porosity is negatively correlated with power, indicating that the higher the power, the lower the overall porosity. Attention should also be paid to the quadratic effects of power, velocity and hatch spacing on porosity, revealing an inverse change in porosity after a certain threshold. Power interacts with velocity and hatch spacing, suggesting that changes in power affect the influence of velocity and hatch spacing on porosity, and vice versa. The interaction of velocity and hatch spacing is not significant. Both models successfully predicted optimal printing parameter sets as validated by experimental measurements.

1. Introduction

Laser powder bed fusion (LPBF) in additive manufacturing (AM) has been rapidly developing, driven by the aerospace, medical and automotive industries [1]. In order to supply highly qualified parts, great efforts have been made to control the manufacturing process and ensure excellent mechanical properties. Defects are increasingly recognized as a major factor affecting mechanical properties and cannot be completely eliminated [2]. They are detrimental to the structural integrity and durability of AM components [3]. It is well known that defect properties and their impact on performance are closely related to the manufacturing process [4]. Therefore, the process–defects/porosity relationship is crucial to correlate process parameters with resulting defect properties/porosity.
The characterization and analysis of defect structures is important when investigating the macroscopic properties of LPBF parts. Defects can be characterized in a variety of ways, including destructive methods such as optical microscopy [5,6] and non-destructive methods such as X-ray Computed Tomography (XCT) [7,8,9,10]. Optical microscopy has long been a standard method to assess pore characteristics. However, as it is based on measuring a 2D cross-section of a pore, it often is unable to capture the full 3D nature and influence of the pore [6]. XCT works by illuminating a sample with a beam of X-rays, acquiring subsequent absorption X-ray images as the sample is rotated from 0 to 360 degrees. Absorption images show internal details of the sample from different angles through the penetration of X-rays. The acquired images are utilized to reconstruct the volumetric dataset. XCT has been shown to be a method able to quantitatively measure and evaluate the entire 3D nature of pore volume, morphology, and distribution comparable to the results obtained by other methods [11,12]. The defect properties obtained, such as size and shape, provide important process-related information. For example, relatively spherical pores are often signs of entrained gas due to localized overheating and tend to be small (<50 μm) [13]. Irregular and elongated pores indicate unfused particles, usually due to insufficient laser energy input. These so-called lack of fusion pores tend to be larger (>100 μm) [14]. These studies revealed that defect properties/porosity strongly depend on the laser process parameters employed. Therefore, a systematic study to determine which parameters have the strongest causal links to defects is necessary towards controlling their reduction and making lasting impacts on improving the quality and reliability of LPBF parts.
Defect formation is affected by the combination of various processing parameters, including, but not limited to, laser power, scan velocity and hatch spacing [15]. Efforts have been made to investigate how these process parameters influence defect properties/porosity. For example, researchers investigated the role of laser power in defect density, size, shape and porosity in 316L stainless steel specimens additively manufactured with a fixed scan velocity. They concluded that there was no trend in defect characterization with power and that porosity increased linearly with decreasing laser power over the experimental range [16]. Kluczyński et al. [17] manufactured 316L austenitic steel parts using printing parameters within ±10% of the value recommended by the manufacturer. The results showed that porosity increased with increasing hatching spacing and velocity. All of these efforts focused on the correlation of defect properties/porosity with individual laser process parameters; although they have added to the fundamental knowledge of the effects of process parameters on defects in LPBF, process optimization is still in need of additional systematic and statistical understanding of complex relationships between process parameters and defect properties/porosity.
This work focuses on filling the gap among laser process parameters, defect properties and porosity optimization in the LPBF of 316L stainless steel. It utilizes defect properties and porosity obtained by two complementary methods, optical microscope and XCT, to develop predictive models to evaluate the laser parameters in relation to defect properties and porosity optimization. This deeper understanding of the relationship can guide the selection of printing parameters to achieve the best quality of manufactured components.

2. Materials and Methods

2.1. Design of Experiment

The Response Surface Method (RSM), a mathematical and statistical method for modeling and analyzing the process, was used to design experiments implemented by a statistical analysis software (JMP, SAS Institute, Cary, NC, USA). This design consists of three sets of design points (Figure 1): cube points, representing the factorial (fractional) design of factors, each with two levels; axial points, representing values below and above two factorial levels; central points, representing the medians of the values used in cube points, often replicated to improve the experimental precision. This approach allows us to build quadratic models and interactions of factors and to find factor levels that optimize the response [18]. The response surface Y can be expressed by a quadratic regression equation as shown in Equation (1),
y = β 0 + β i x i + β i i x i 2 + β i j x i x j
where y is the response of interest, which is defect properties/porosity in this study; x is the independent factor, which is laser power, scan velocity and hatch spacing in this study; β is the coefficient; and x i x j represents the interactions of two factors.
Table 1 is the CCC experimental design, including the 3 printing parameters of laser power (p), scan velocity (v) and hatch spacing (h), as well as 5 levels for each parameter. The high and low level of each parameter was selected within the working range of the printer, Concept Laser MLab 100R (GE Additive, Boston, MA, USA). Meanwhile, the volume energy (E) calculated from the three printing parameters and each layer thickness t ( E = p / v h t ) covered the printing range from conduction mode, defined by low energy and shallow laser penetration, to keyhole mode, defined by high energy and deep laser penetration [19].

2.2. Printing Strategy

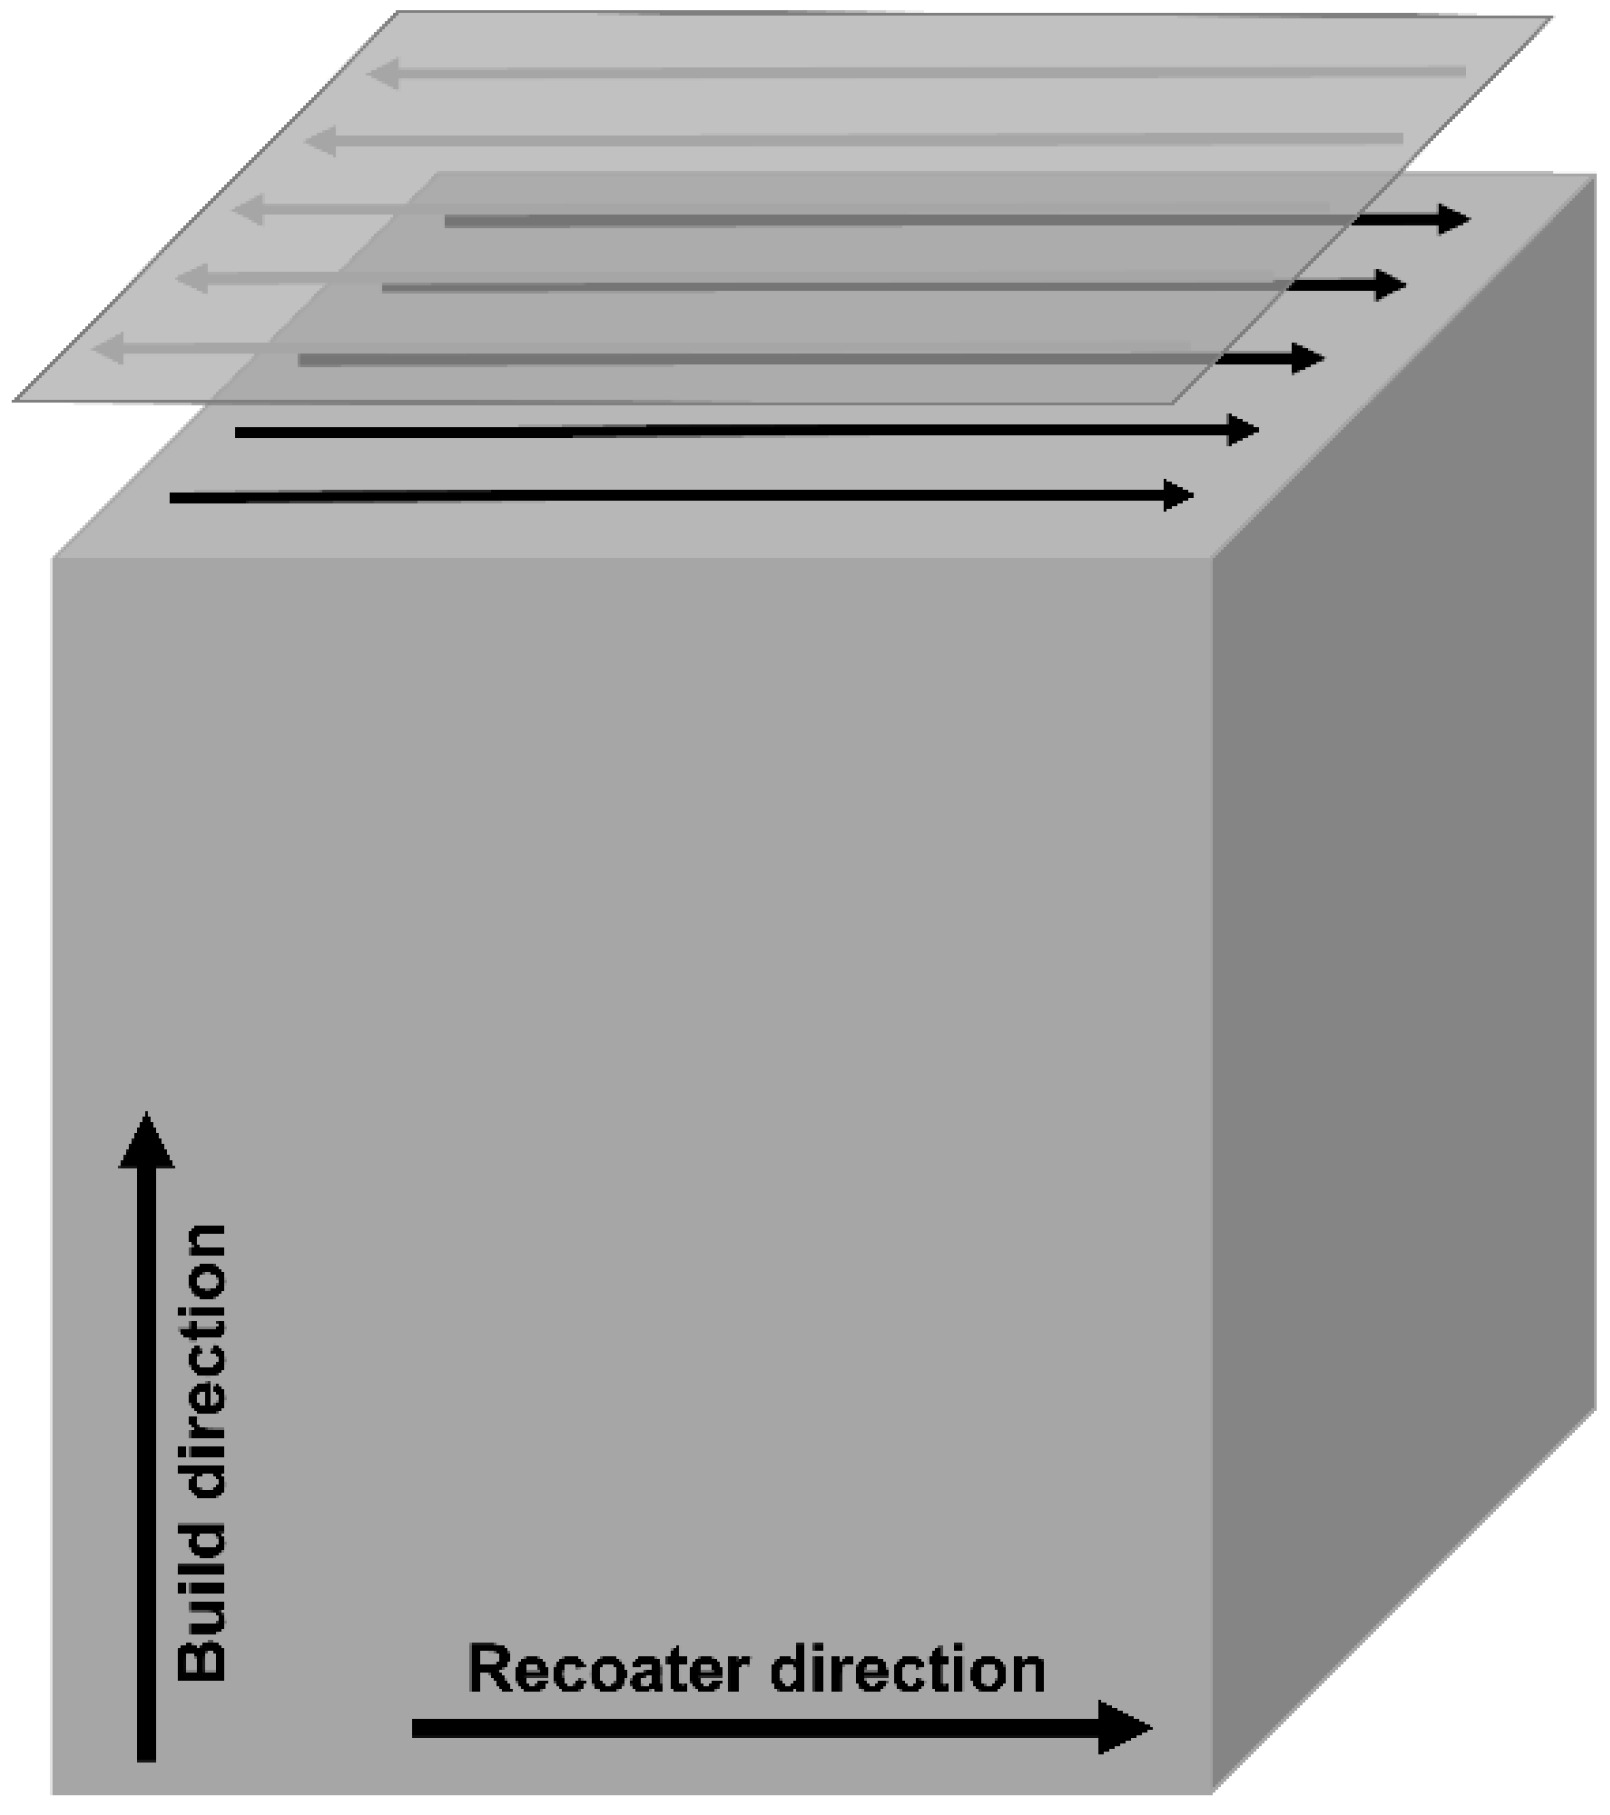
The samples were additively manufactured from 316L stainless steel powder in an Argon atmosphere on a Concept Laser Mlab 100R (GE Additive, Boston, MA, USA). Powders were purchased from Carpenter Additive (Opelika, AL, USA), produced by gas atomization with a size of 15–45 μm. A total of 20 cubes with dimensions of 5 mm × 5 mm × 5 mm were printed using the printing parameters shown in Table 1. The layer thickness was 25 μm for all samples. The laser scanning direction was the same as the recoater blade; see Figure 2.

2.3. Pore Properties and Porosity Measurement

AM part pore properties and porosity were measured using a Pinnacle X-ray Solutions Benchmark 225/60 X-ray Computed Tomography (Pinnacle X-Ray Solutions, Suwanee, GA, USA). Samples were mounted on a rotating stage and placed 2 mm away from the X-ray source. The minimum voxels were 2 × 2 × 2, with a voxel size of around 5 µm. The X-ray source operated at 225 kV and 109 μA, with a 1 mm Cu filter and a 1 mm Al filter to reduce beam hardening. A total of 2880 radiographs with an exposure time of 750 ms and 4 integrated frames were acquired to build the 3D XCT reconstruction. Reconstruction, visualization and analysis were performed using commercial software VGSTUDIO MAX 3.5 (Volume Graphics, Heidelberg, Germany). The dimensions of the cubes were 5 mm × 5 mm × 5 mm, and the analysis was carried out in an internal volume of 4 mm × 4 mm × 4 mm to avoid edge effect.
After scanning the samples with XCT, the porosity of these samples was measured using an optical microscope for comparison. Samples were sectioned in half along the laser scan direction, mounted on conductive bakelite, ground using 120, 800, and 1200 grit abrasive papers, polished using 9 µm and 3 µm diamond paste and finally polished to a mirror finish using OPS solution. Measurements were carried out using an Olympus BX51 optical microscope (Olympus, Tokyo, Japan). Porosity was obtained in the Processing Module, and the threshold value was adjusted to distinguish the black pores from the grey background. 5 images were taken at 10X magnification with a resolution of about 0.7 µm to calculate the average porosity.

3. Results and Discussion

3.1. Reliability of XCT and Optical Method

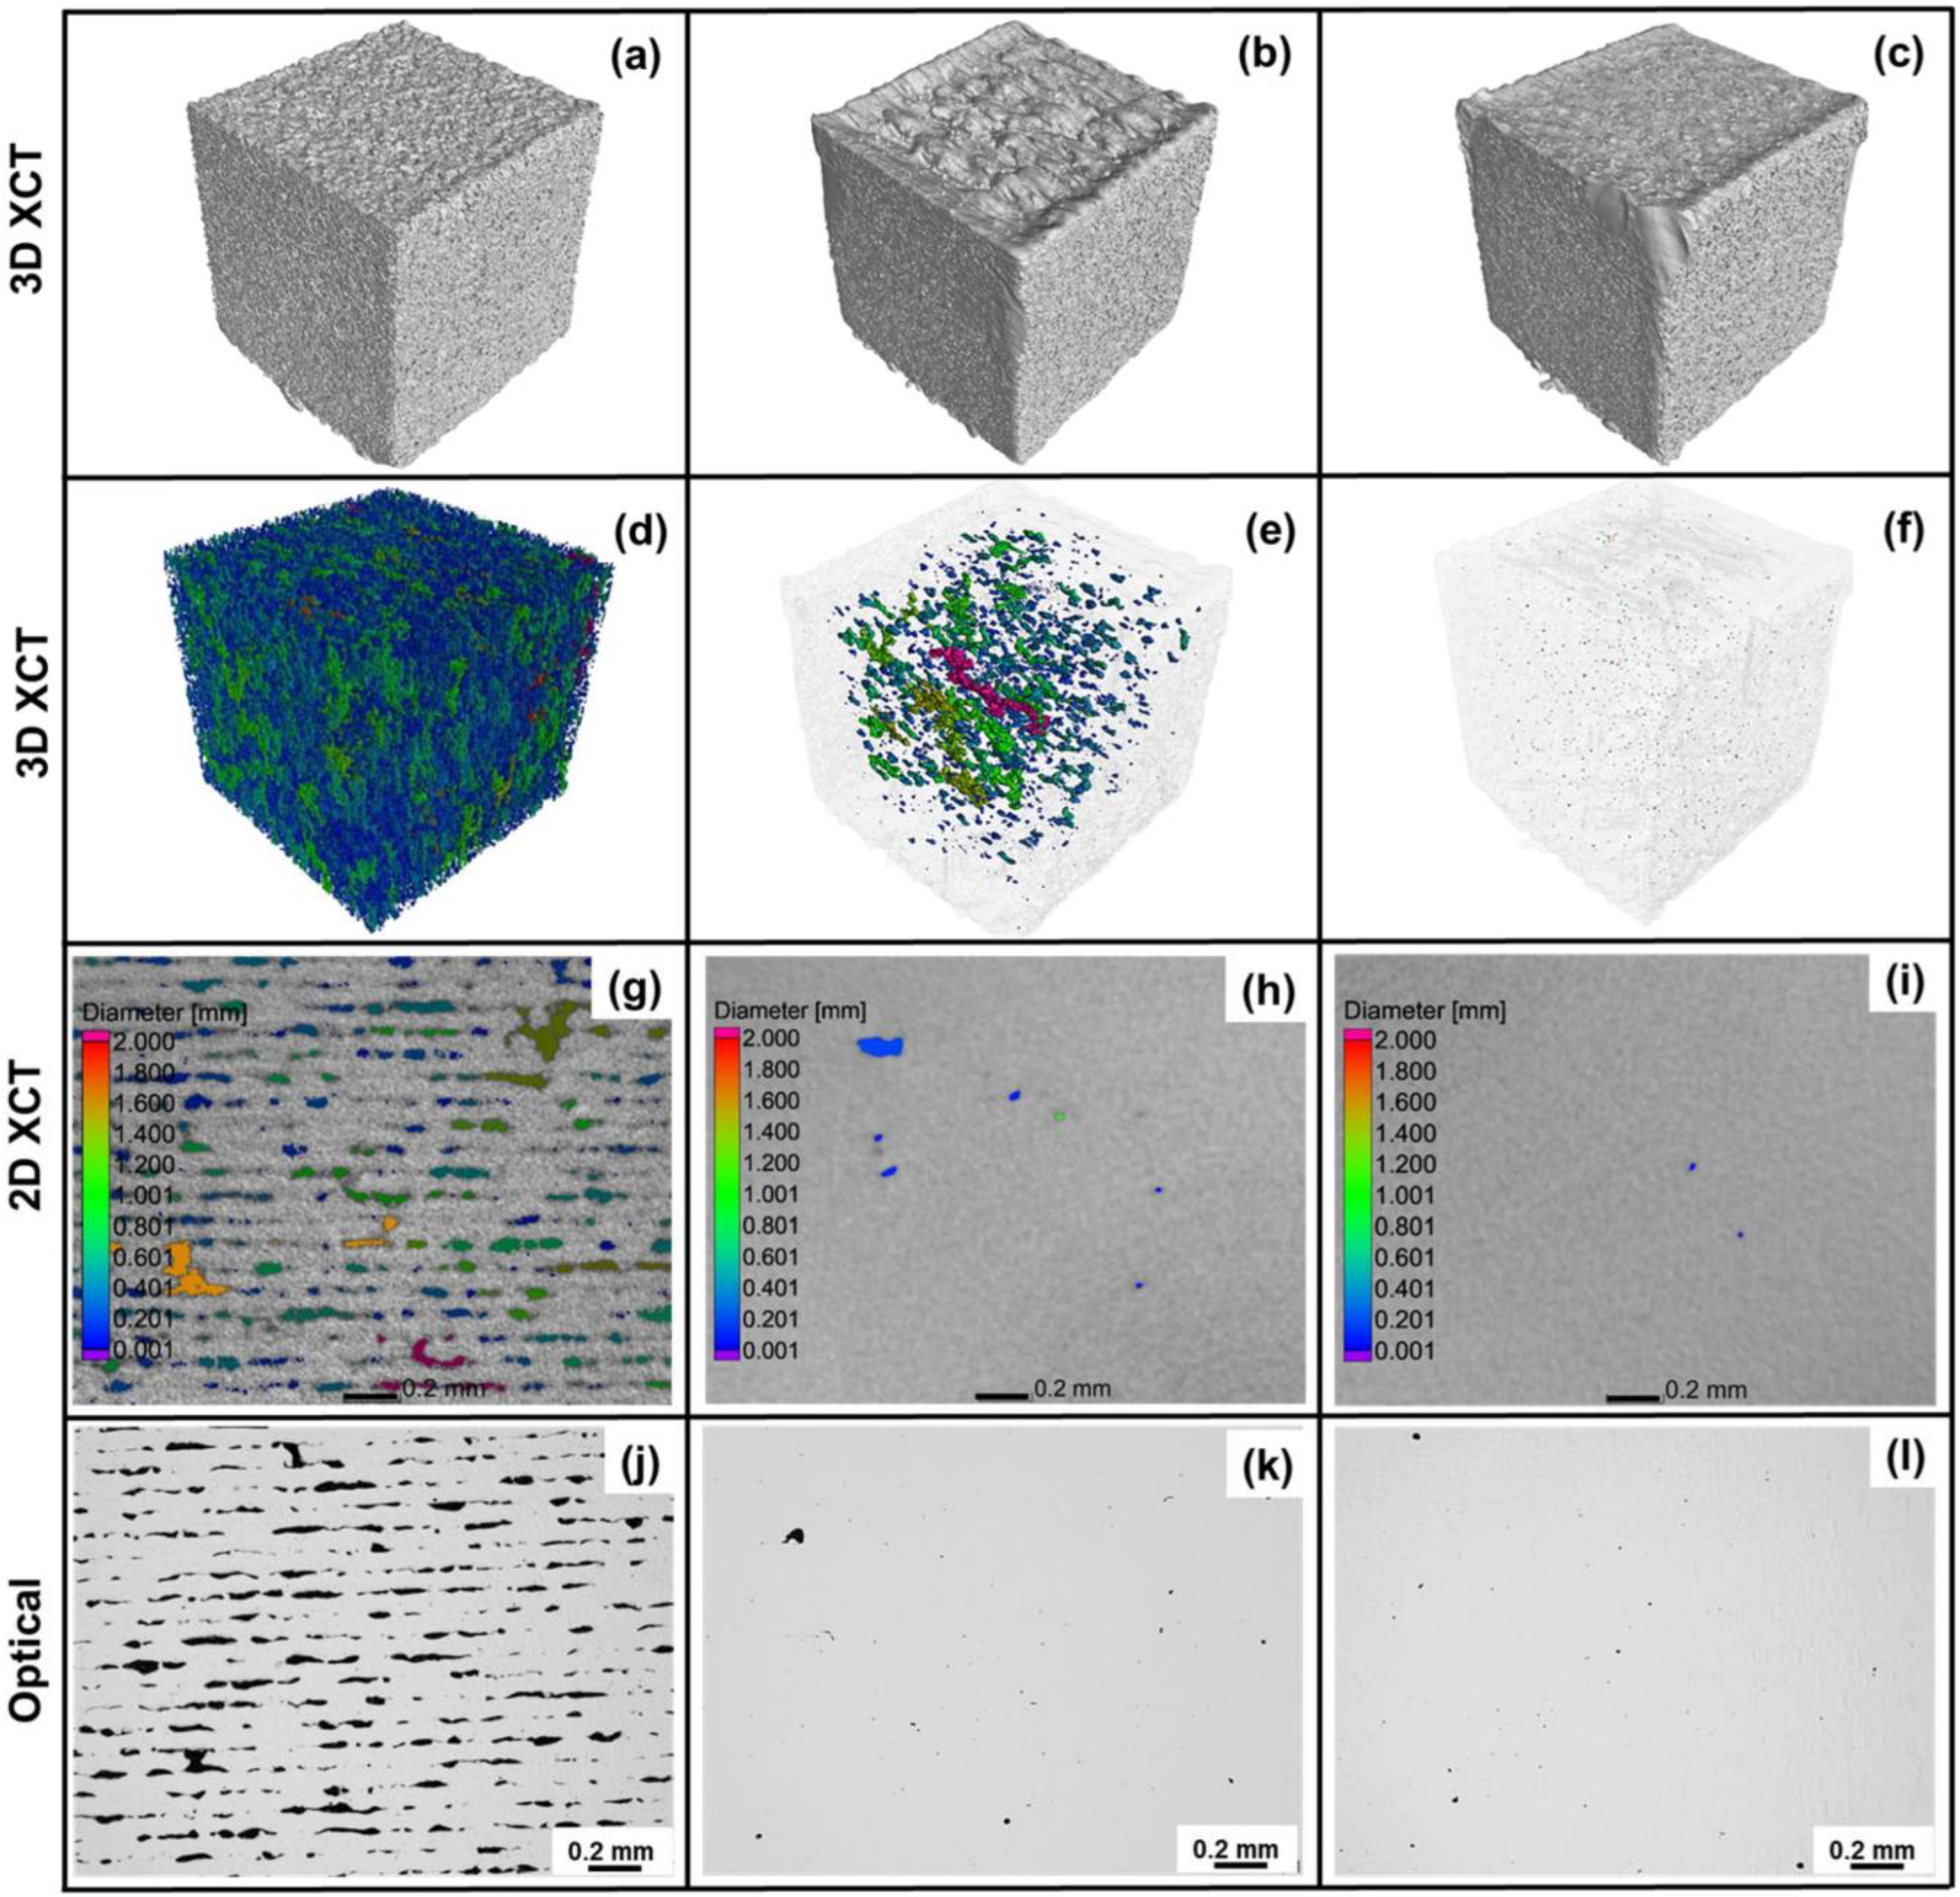
To validate the reliability of both methods, a comparison between optical microscopy and XCT in terms of overall porosity and pore properties of three samples is shown in Figure 3. The three samples ranged from lack of fusion pores to keyhole pores, left to right; see (a) to (c). The 3D XCT and porosity analysis, (d) to (f), exhibited the expected pore number, size and shape obtained from the typical lack of fusion and keyhole parameter sets. Optically obtained analysis, Figure 3j–l, was compared to the counterparts, 2D slices of the XCT porosity analysis, Figure 3g–i. In general, optical images and XCT 2D images show that the overall porosity and pore properties of the two methods are comparable. XCT 3D images enable better and more intuitive visualization of how overall porosity and pore properties such as pore number, size and sphericity vary with power and volume energy in the entire volume.

3.2. Pore Properties Analysis

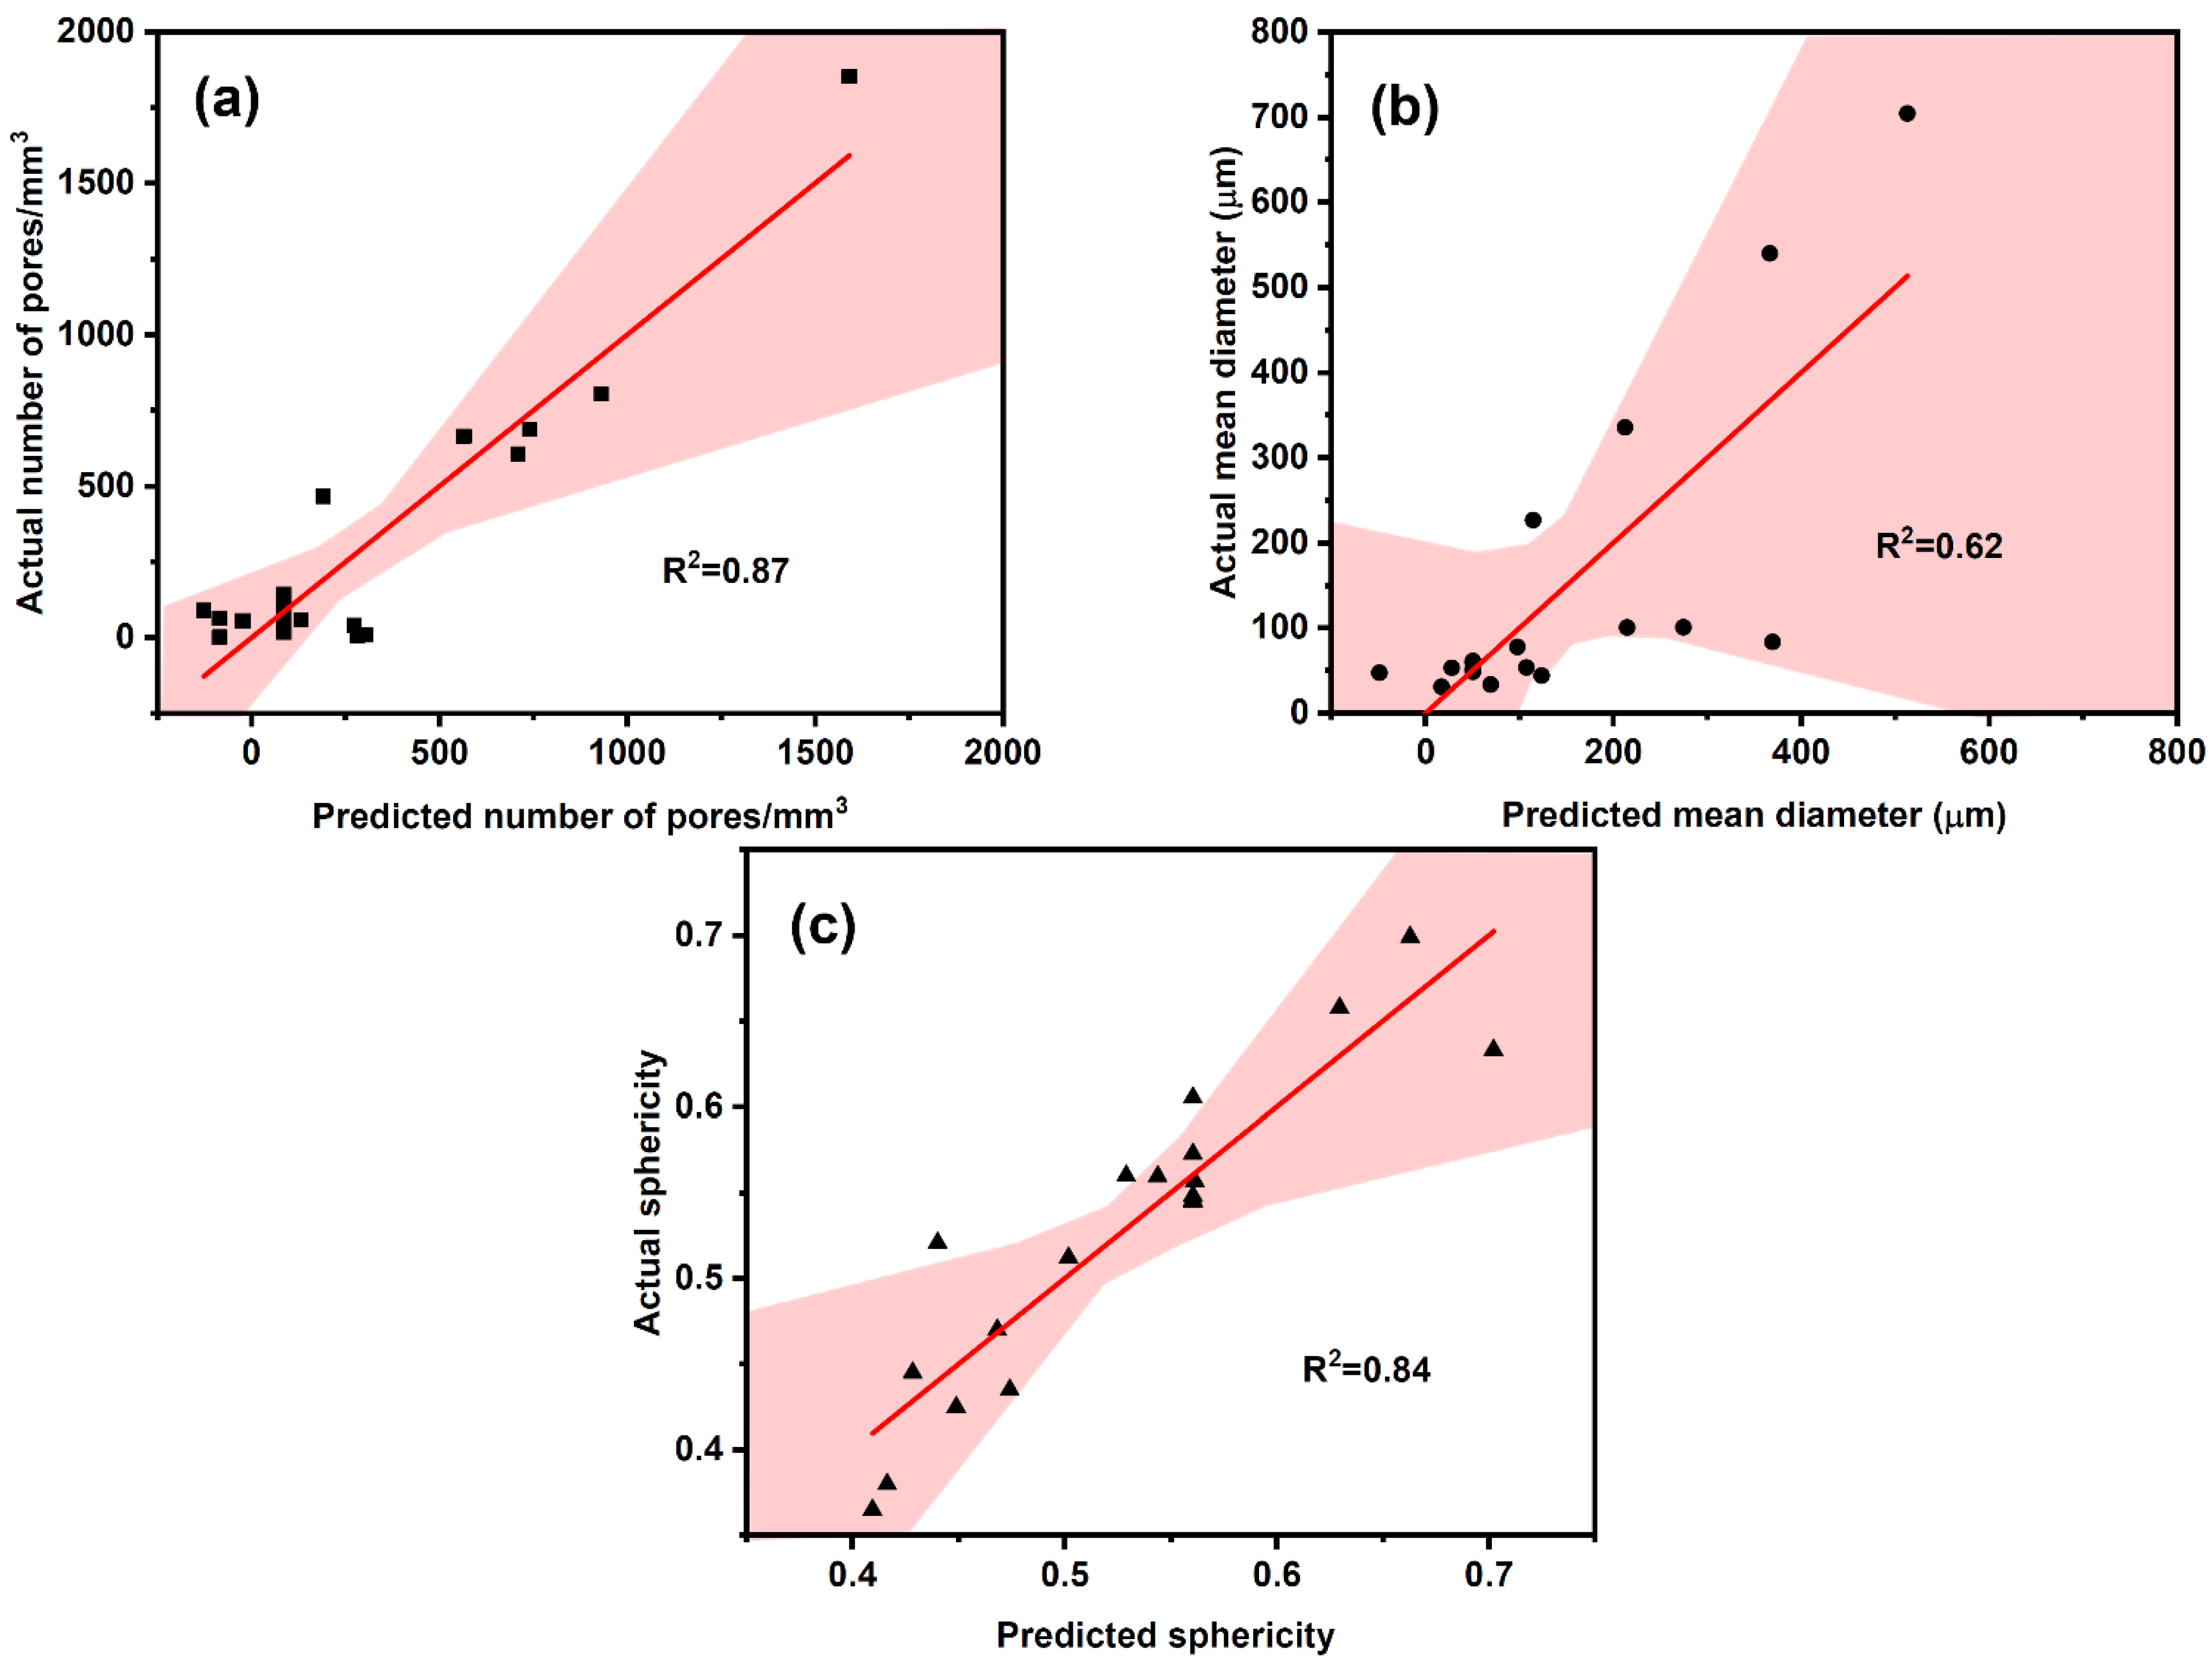
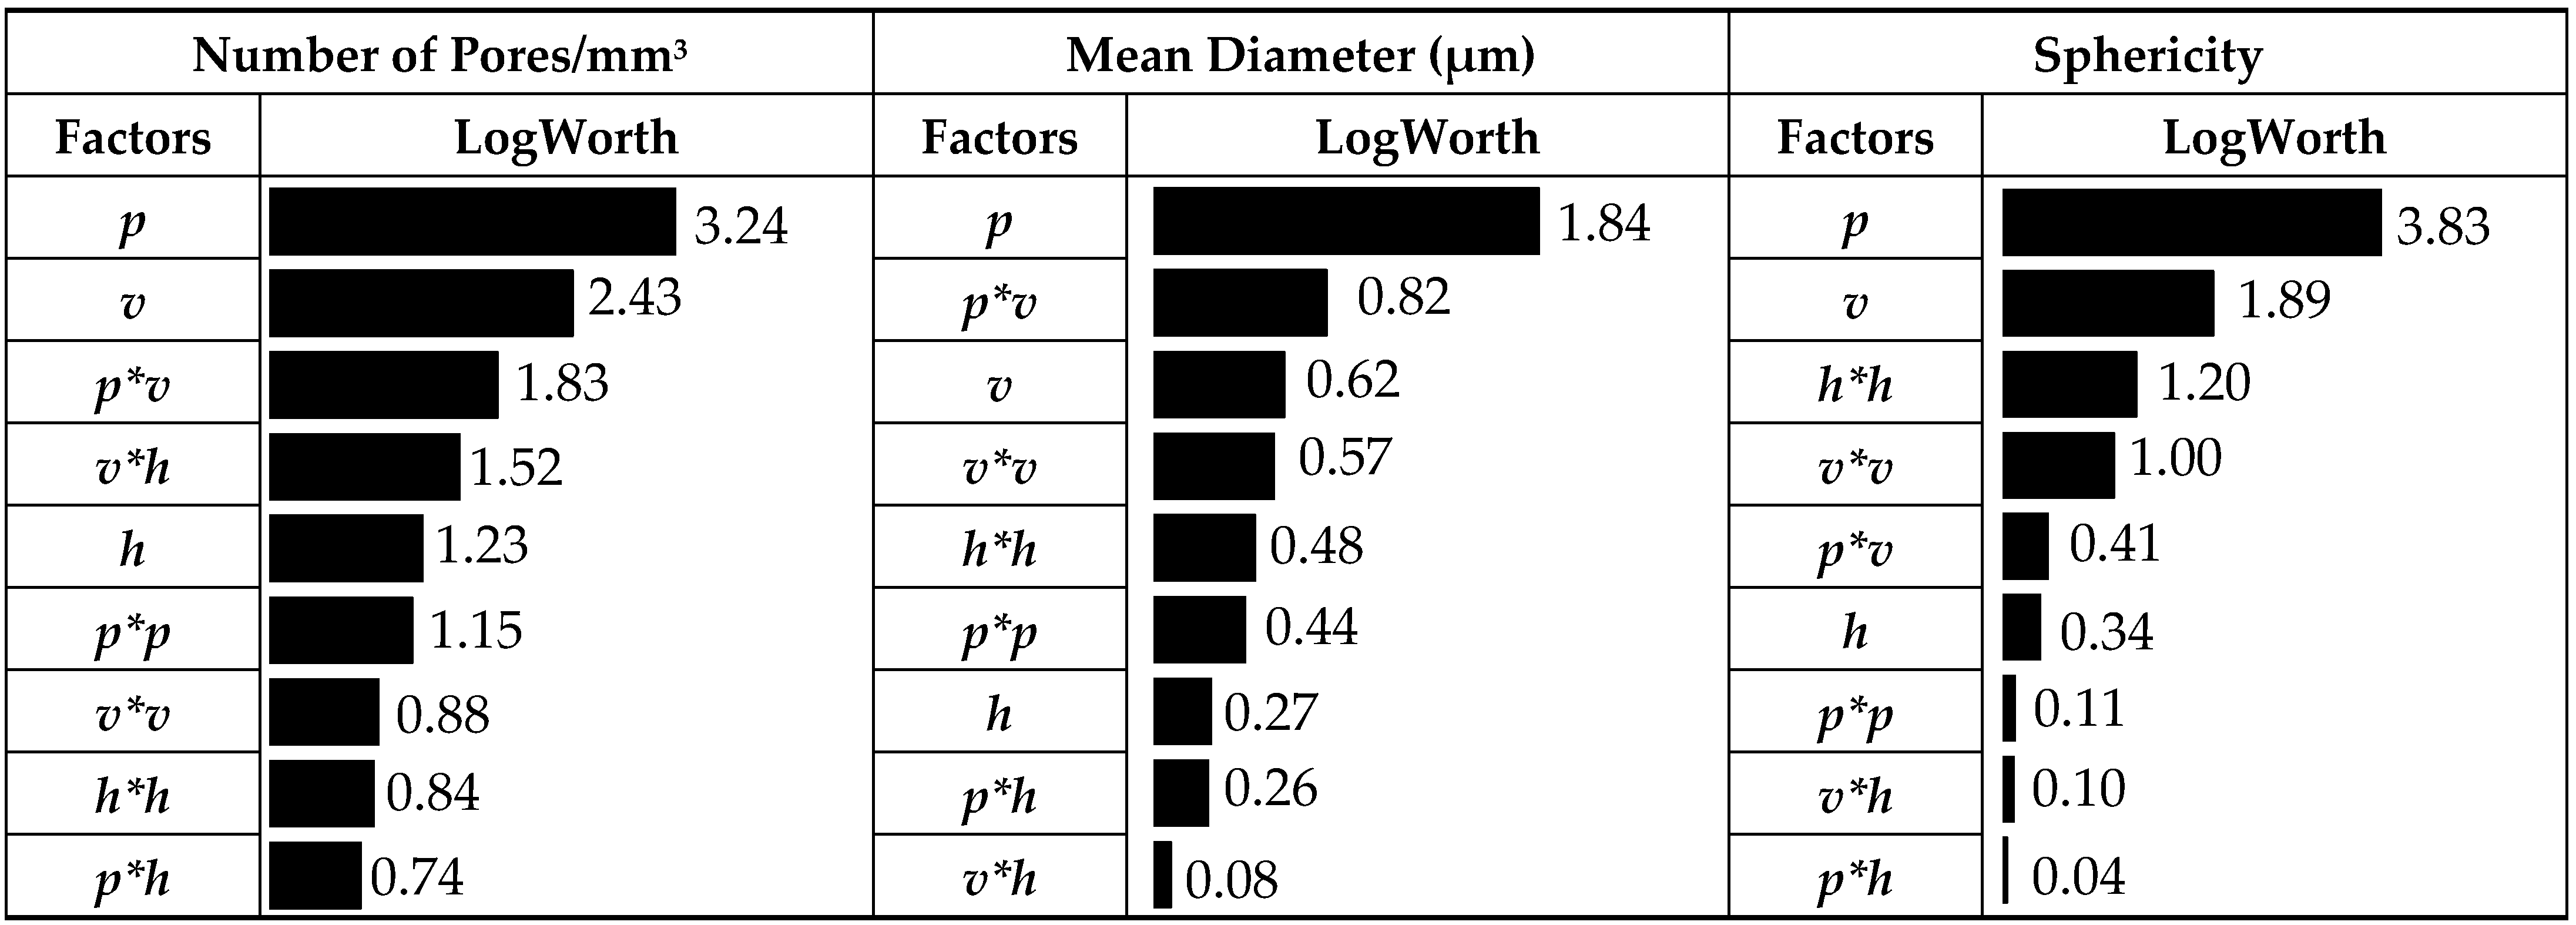
The similarity in optical and XCT images mutually proves the reliability of the two methods. XCT facilitates the demonstration of 3D pore properties of the entire volume for a comprehensive study; therefore, XCT data were used to investigate pore properties, including pore density, size and shape as well as their relationship with printing parameters. A commercial statistical software JMP was used to analyze pore property data of 20 samples. Figure 4 shows the mathematical modeling results of number of pores/mm3 (Figure 4a), mean diameter of pores (Figure 4b) and sphericity of pores (Figure 4c). A pink 95% confidence region was drawn on top of the slanted red regression line. The modeling enables identification of the effect of each printing parameter and its interactions with pore properties; see Table 2. The LogWorth value quantifies the predictive influence of each factor on pore properties, with larger values indicating greater influence of this factor. LogWorth greater than 1.3 is statistically significant, meaning that the factor has an influence on pore properties. It is shown that laser power is the dominant factor to determine pore density, size and shape (with LogWorth values of 3.24, 1.84 and 3.83, respectively), with velocity the next most significant (with LogWorth values of 2.43, 0.62 and 1.89, respectively); hatch spacing is the least influential of the three (with LogWorth values of 1.23, 0.27 and 0.34, respectively). Interactions between power–velocity and velocity–hatch spacing also significantly affect pore density, which means that the selection of velocity will affect the influence of power and hatch spacing on pore properties.
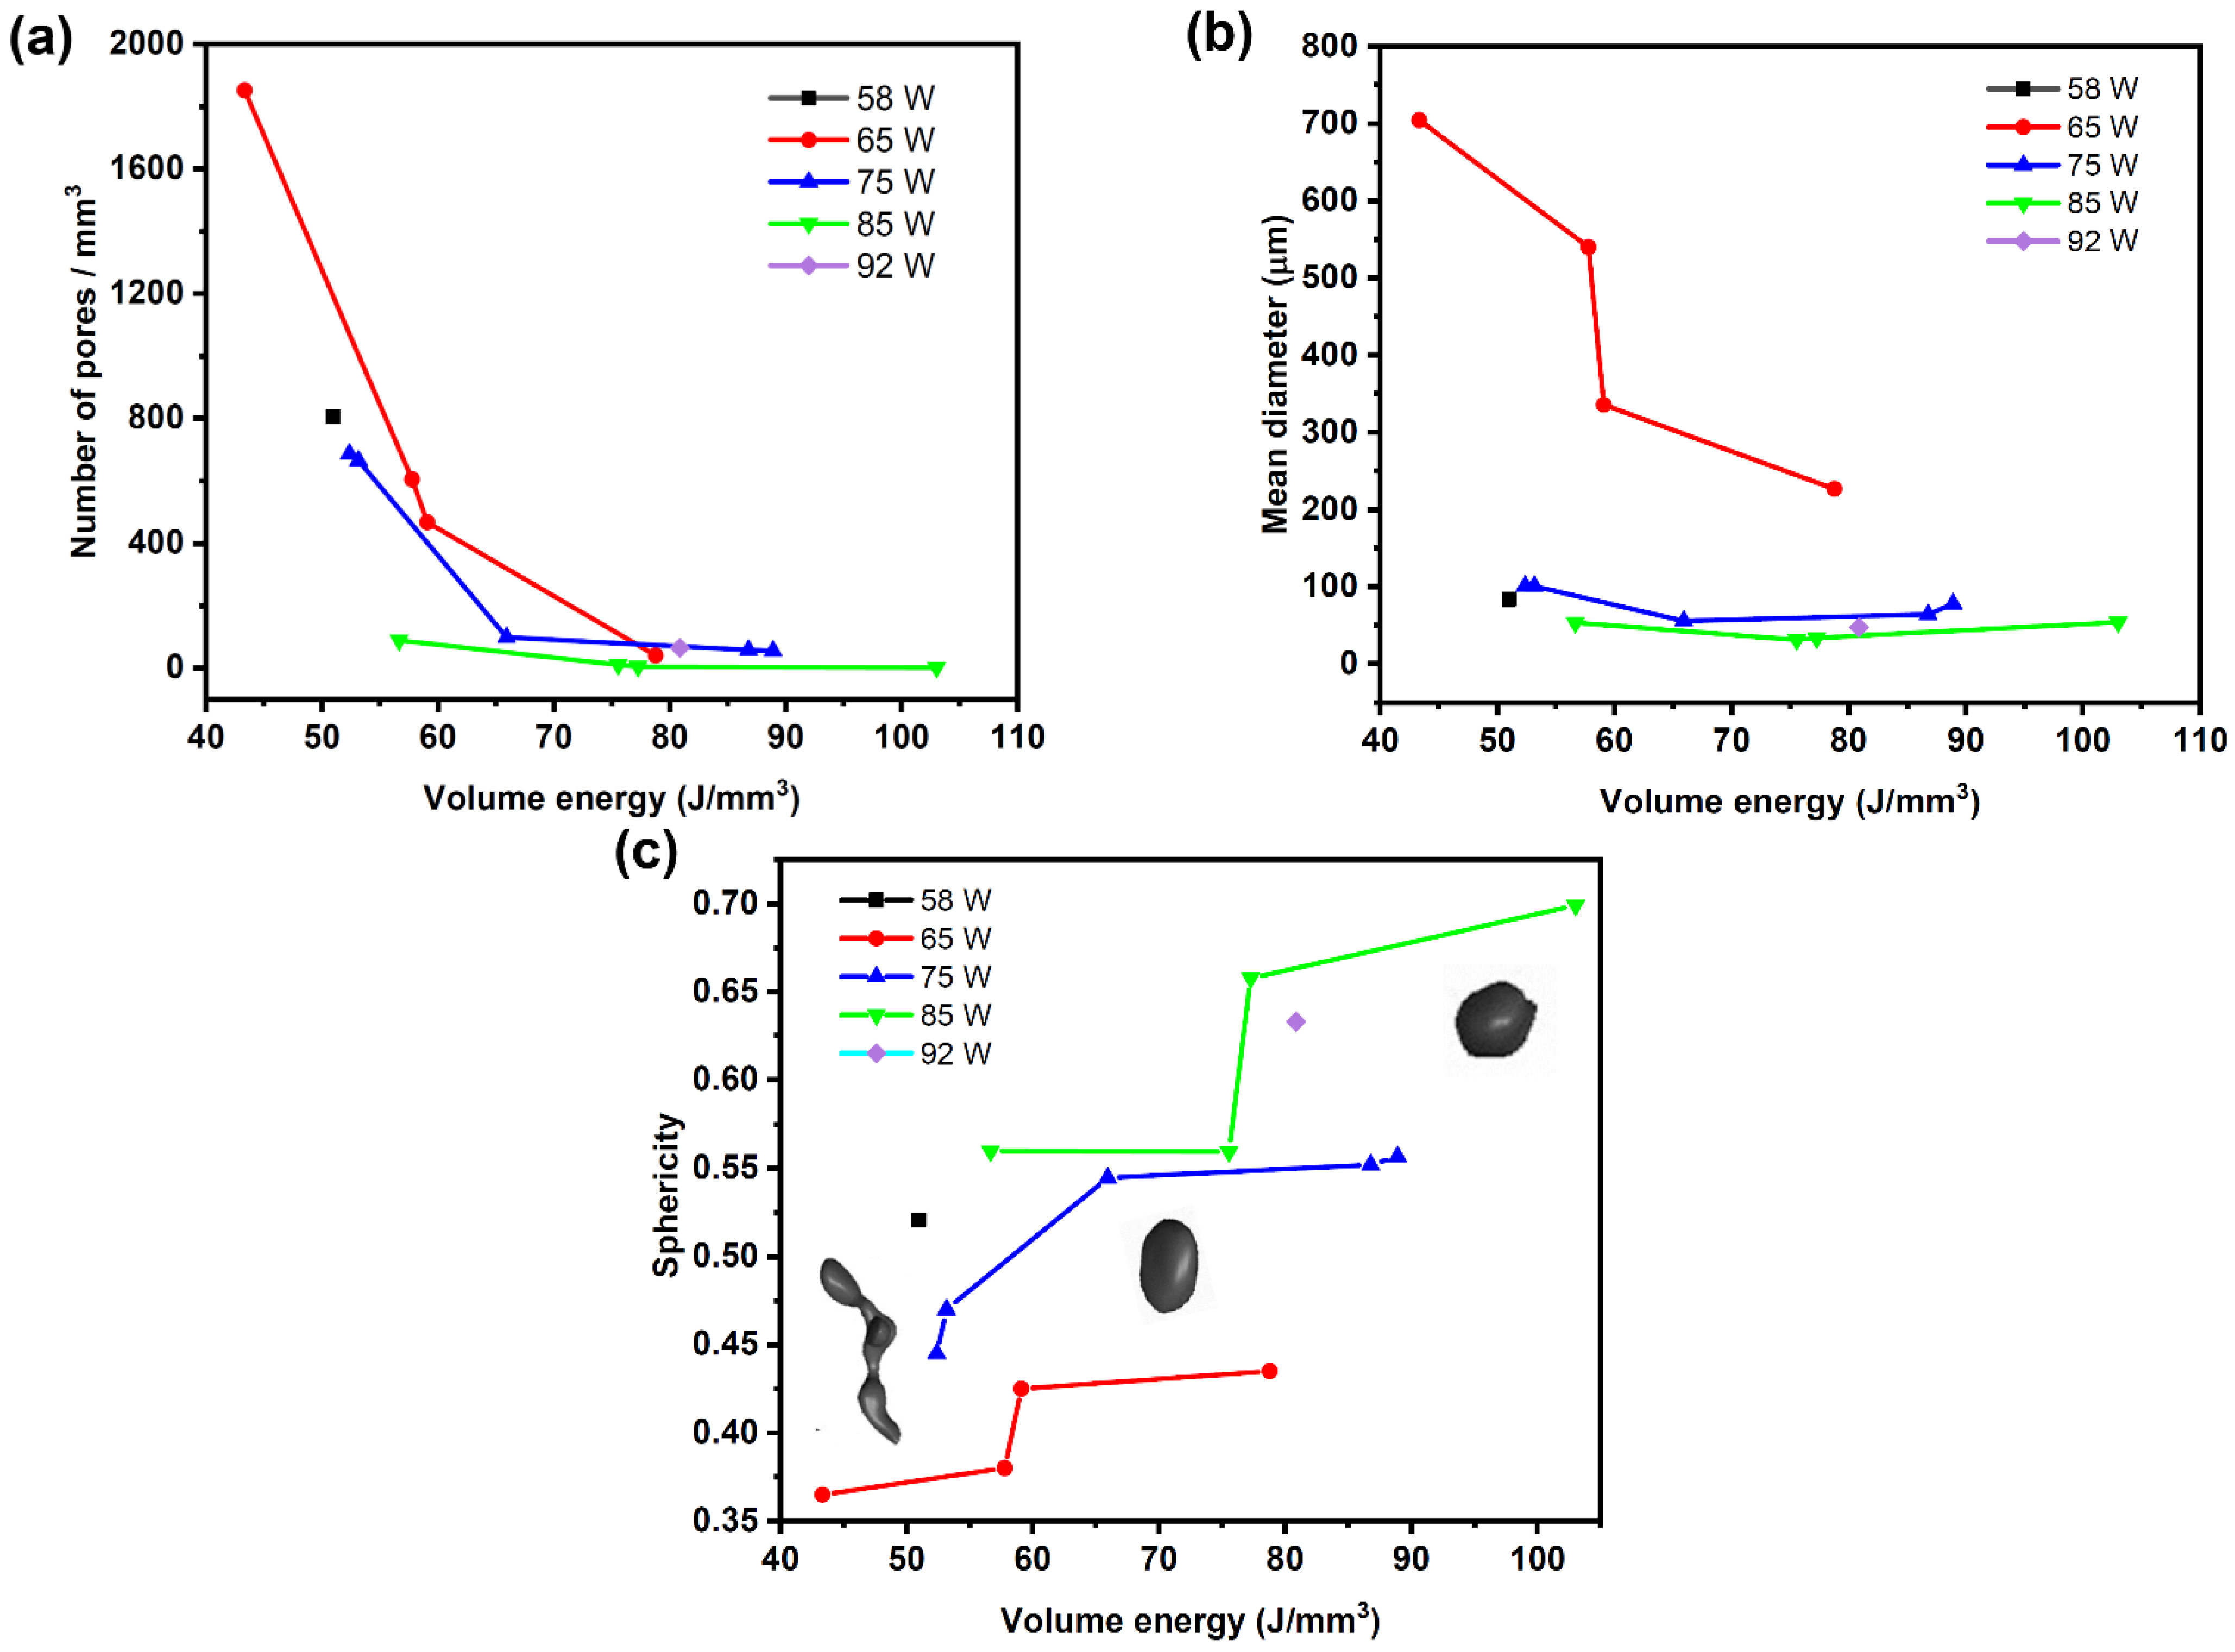
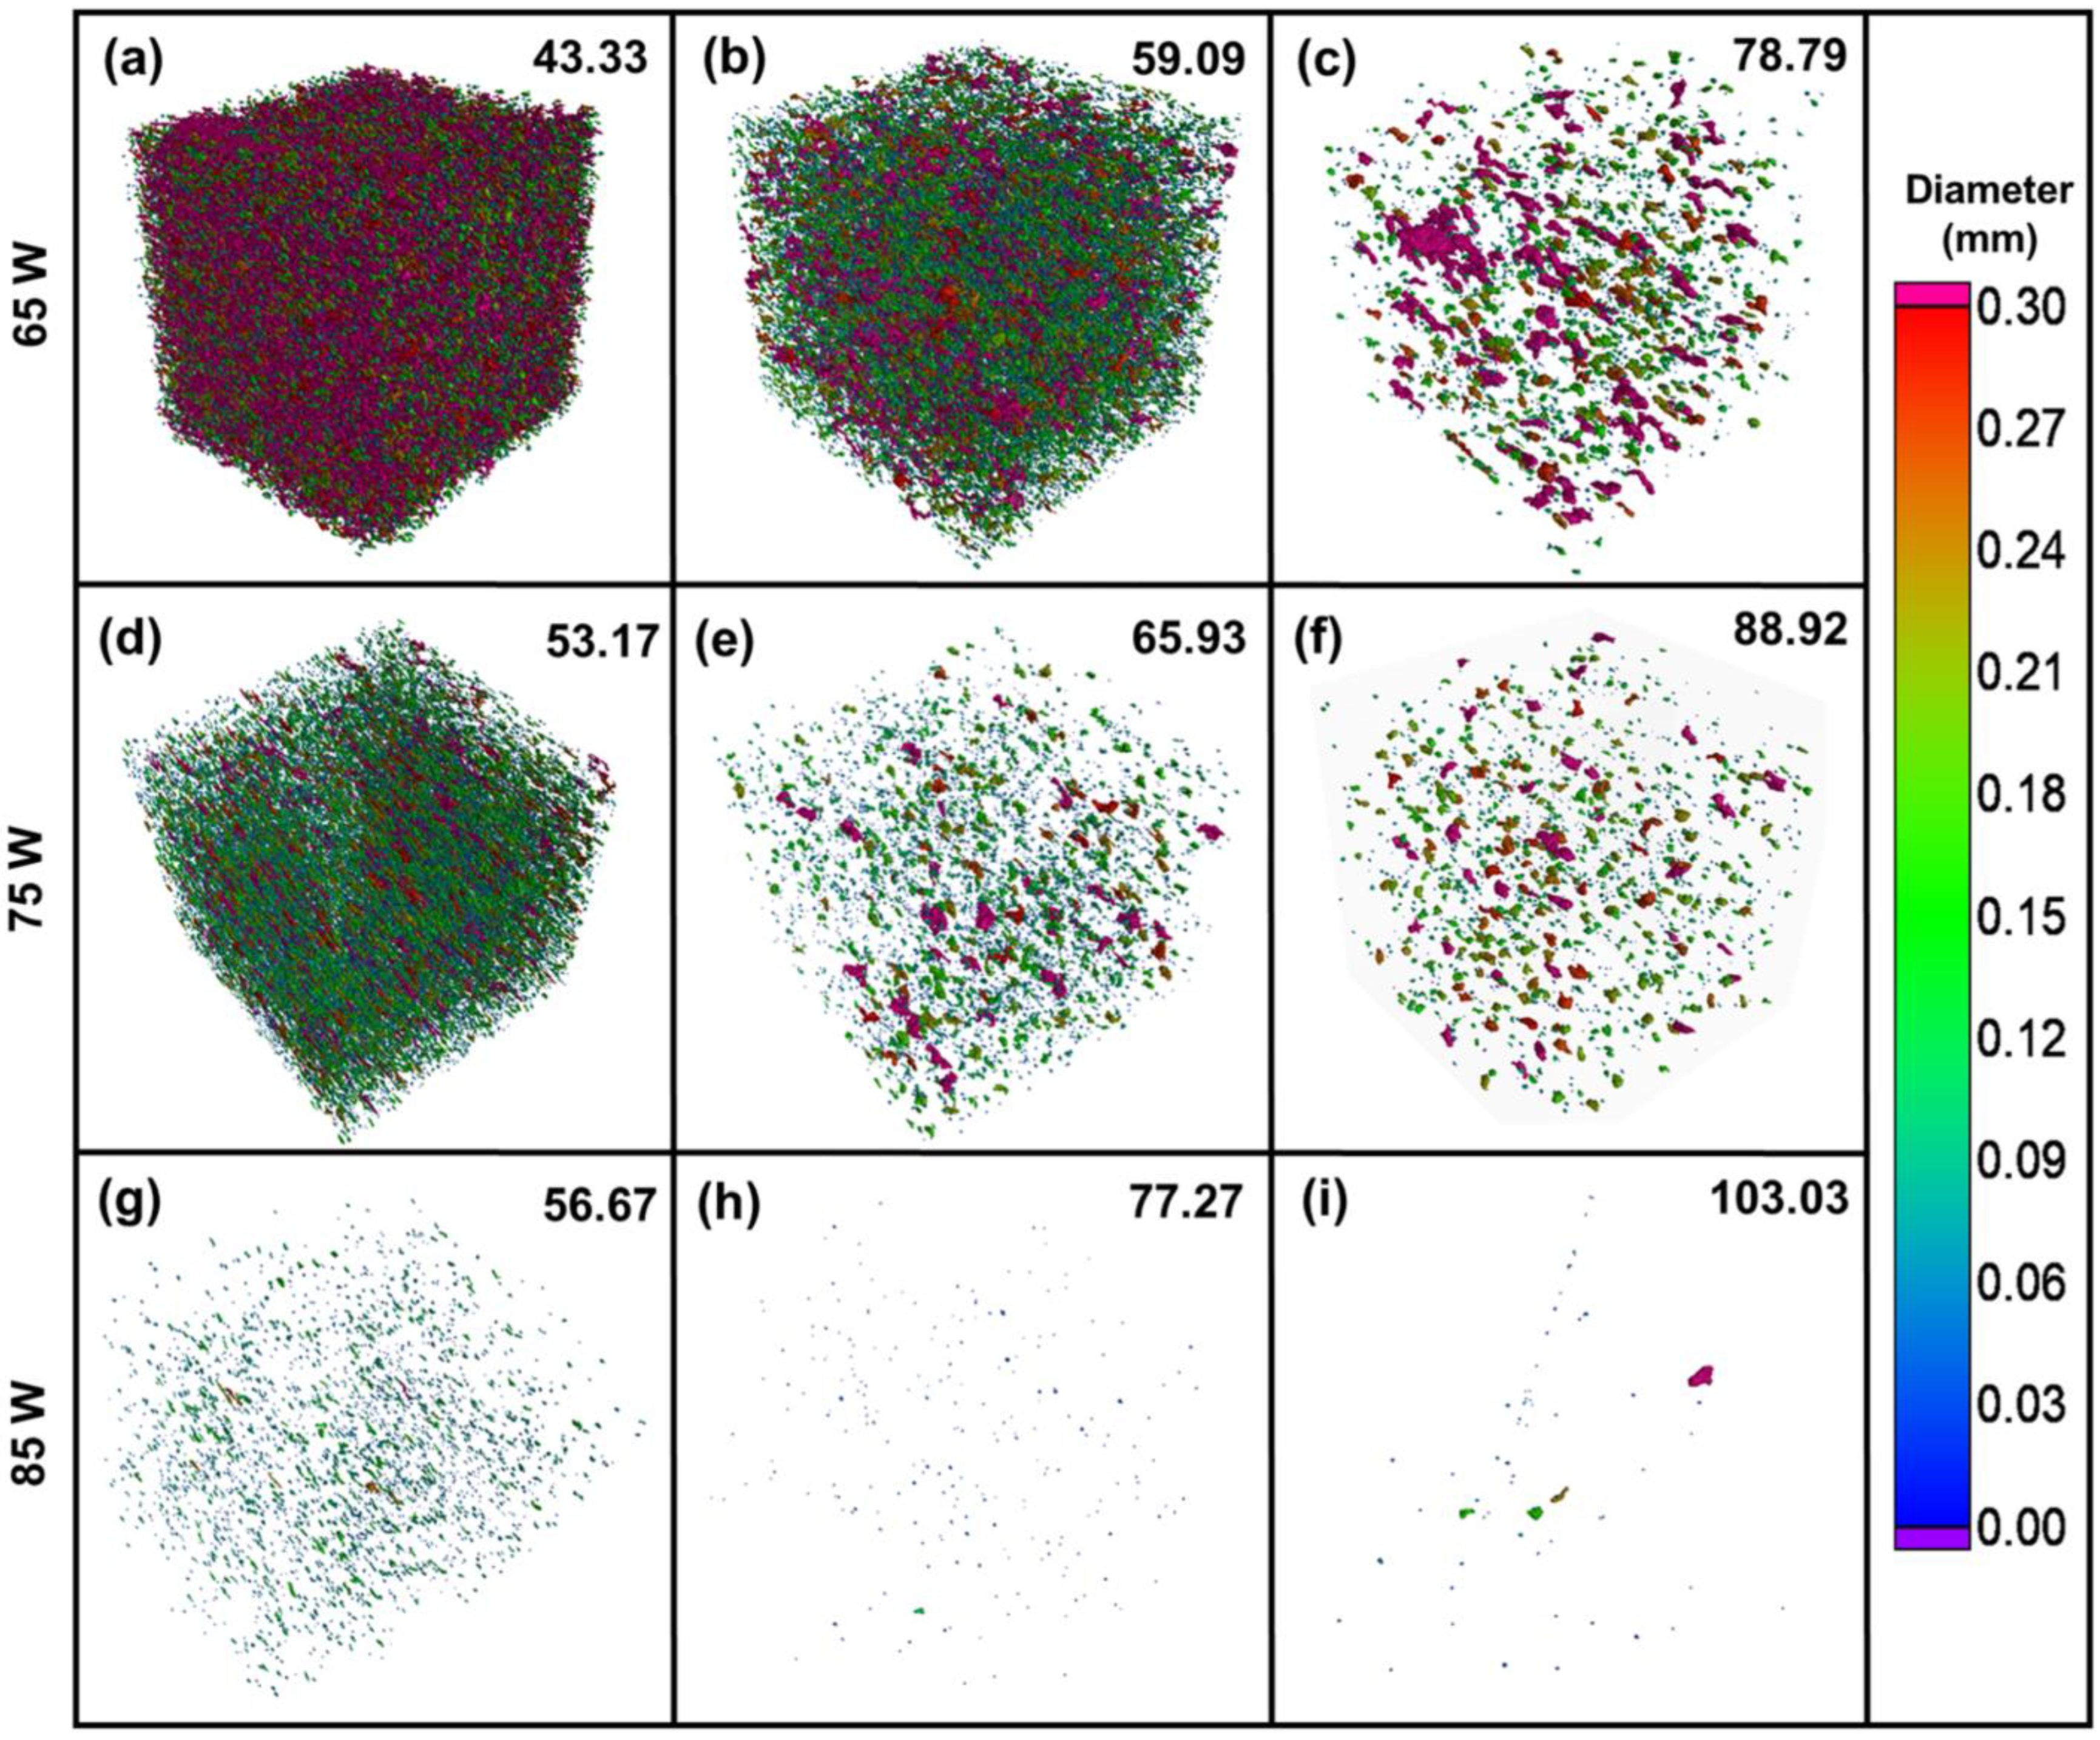
Since power is the dominant parameter, the variation of pore properties is shown with power and volume energy (Figure 5). In general, pore density (Figure 5a) and mean diameter (Figure 5b) decrease and sphericity (Figure 5c) increases with increasing power. For each power, there is a clear trend that the pore density decreases and sphericity increases with increasing volume energy. Increasing the power or volume energy will introduce more heat to melt the metal powder, and irregularly shaped lack of fusion pores formed due to insufficient energy will be correspondingly reduced. Figure 6 shows this pore property variation in a 3D visualization. At 65 W power and 43.33 J/mm3 volume energy (Figure 6a), molten material cannot wet the previous layer and hatch line and is therefore insulated by the surrounding powder. Pores form due to insufficient melting and lead to incomplete binding of the powder layer or hatch line (lack of fusion) [20]. These pores are large and aligned parallel to layers or hatch lines and exhibit elongated voids (with a sphericity of 0.37); see the inserts in Figure 5c. Figure 6d shows that the number and size of pores in the sample printed at 75 W power and 53.17 J/mm3 volume energy are reduced compared to Figure 6a. Further increasing the power to 85 W and the volume energy to 56.67 J/mm3 produces even fewer, smaller and rounder pores (with a sphericity of 0.56); see the inserts in Figure 5c. These rounder melt pores form due to excessive energy introduced into the material and are referred to as keyholes [13,15]. Keyholes are generated in the melting process due to entrapment of inert gas and metal gas evaporated by high laser energy. Keyhole size increases after a certain threshold of energy input at 75 W and 85 W (Figure 5b). The same reasons explain the decrease of pore number and increase of sphericity with increasing volume energy at each power in Figure 5 and Figure 6.

3.3. Porosity Analysis

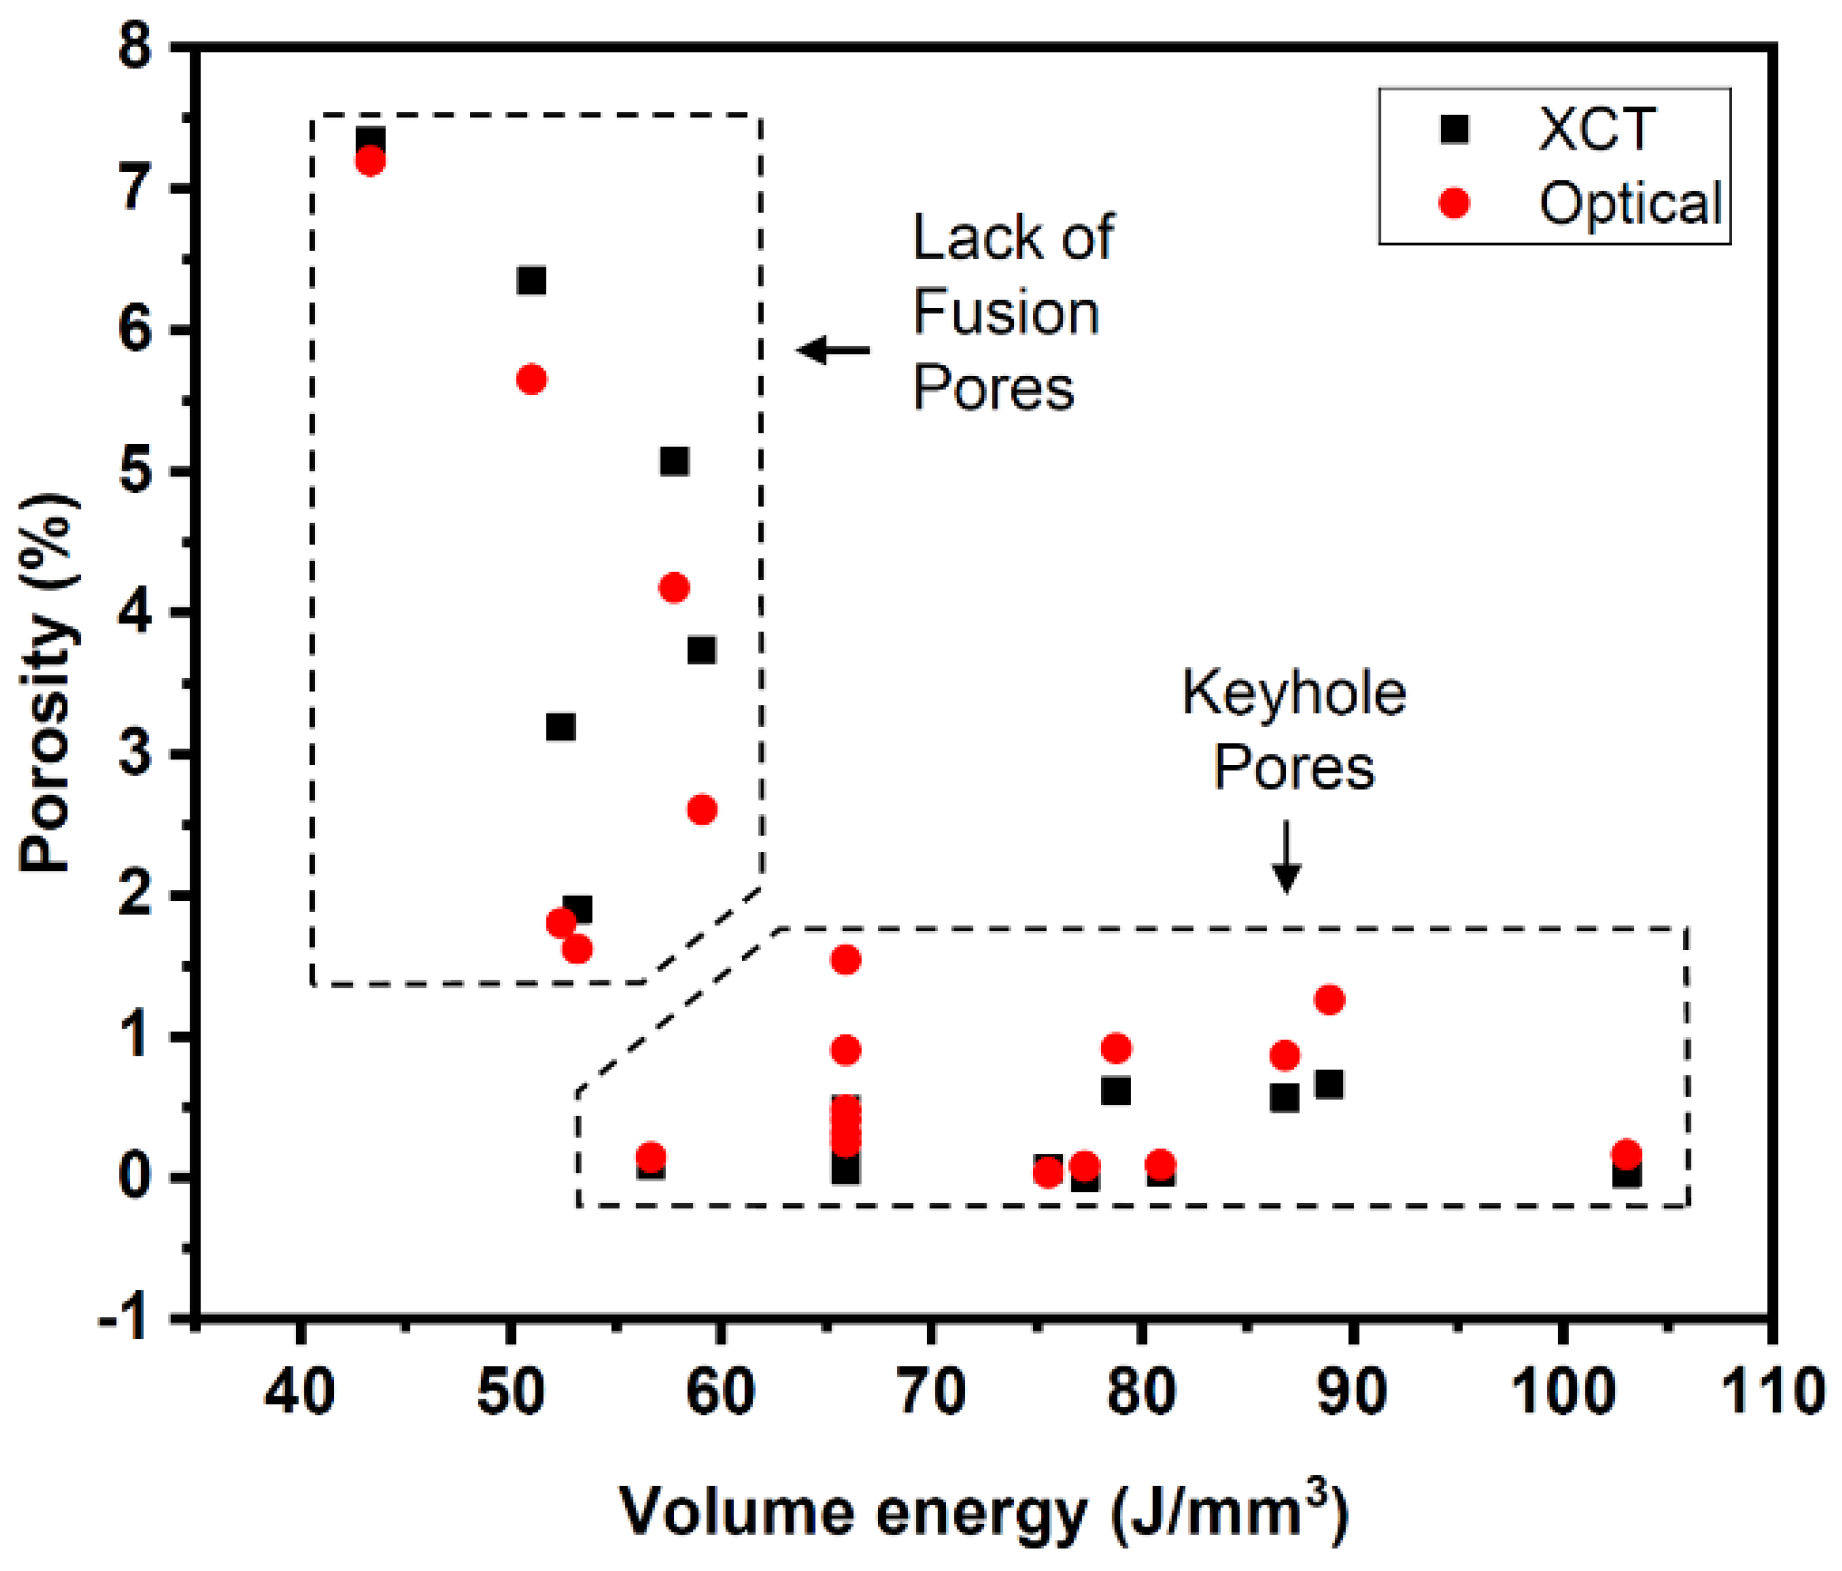
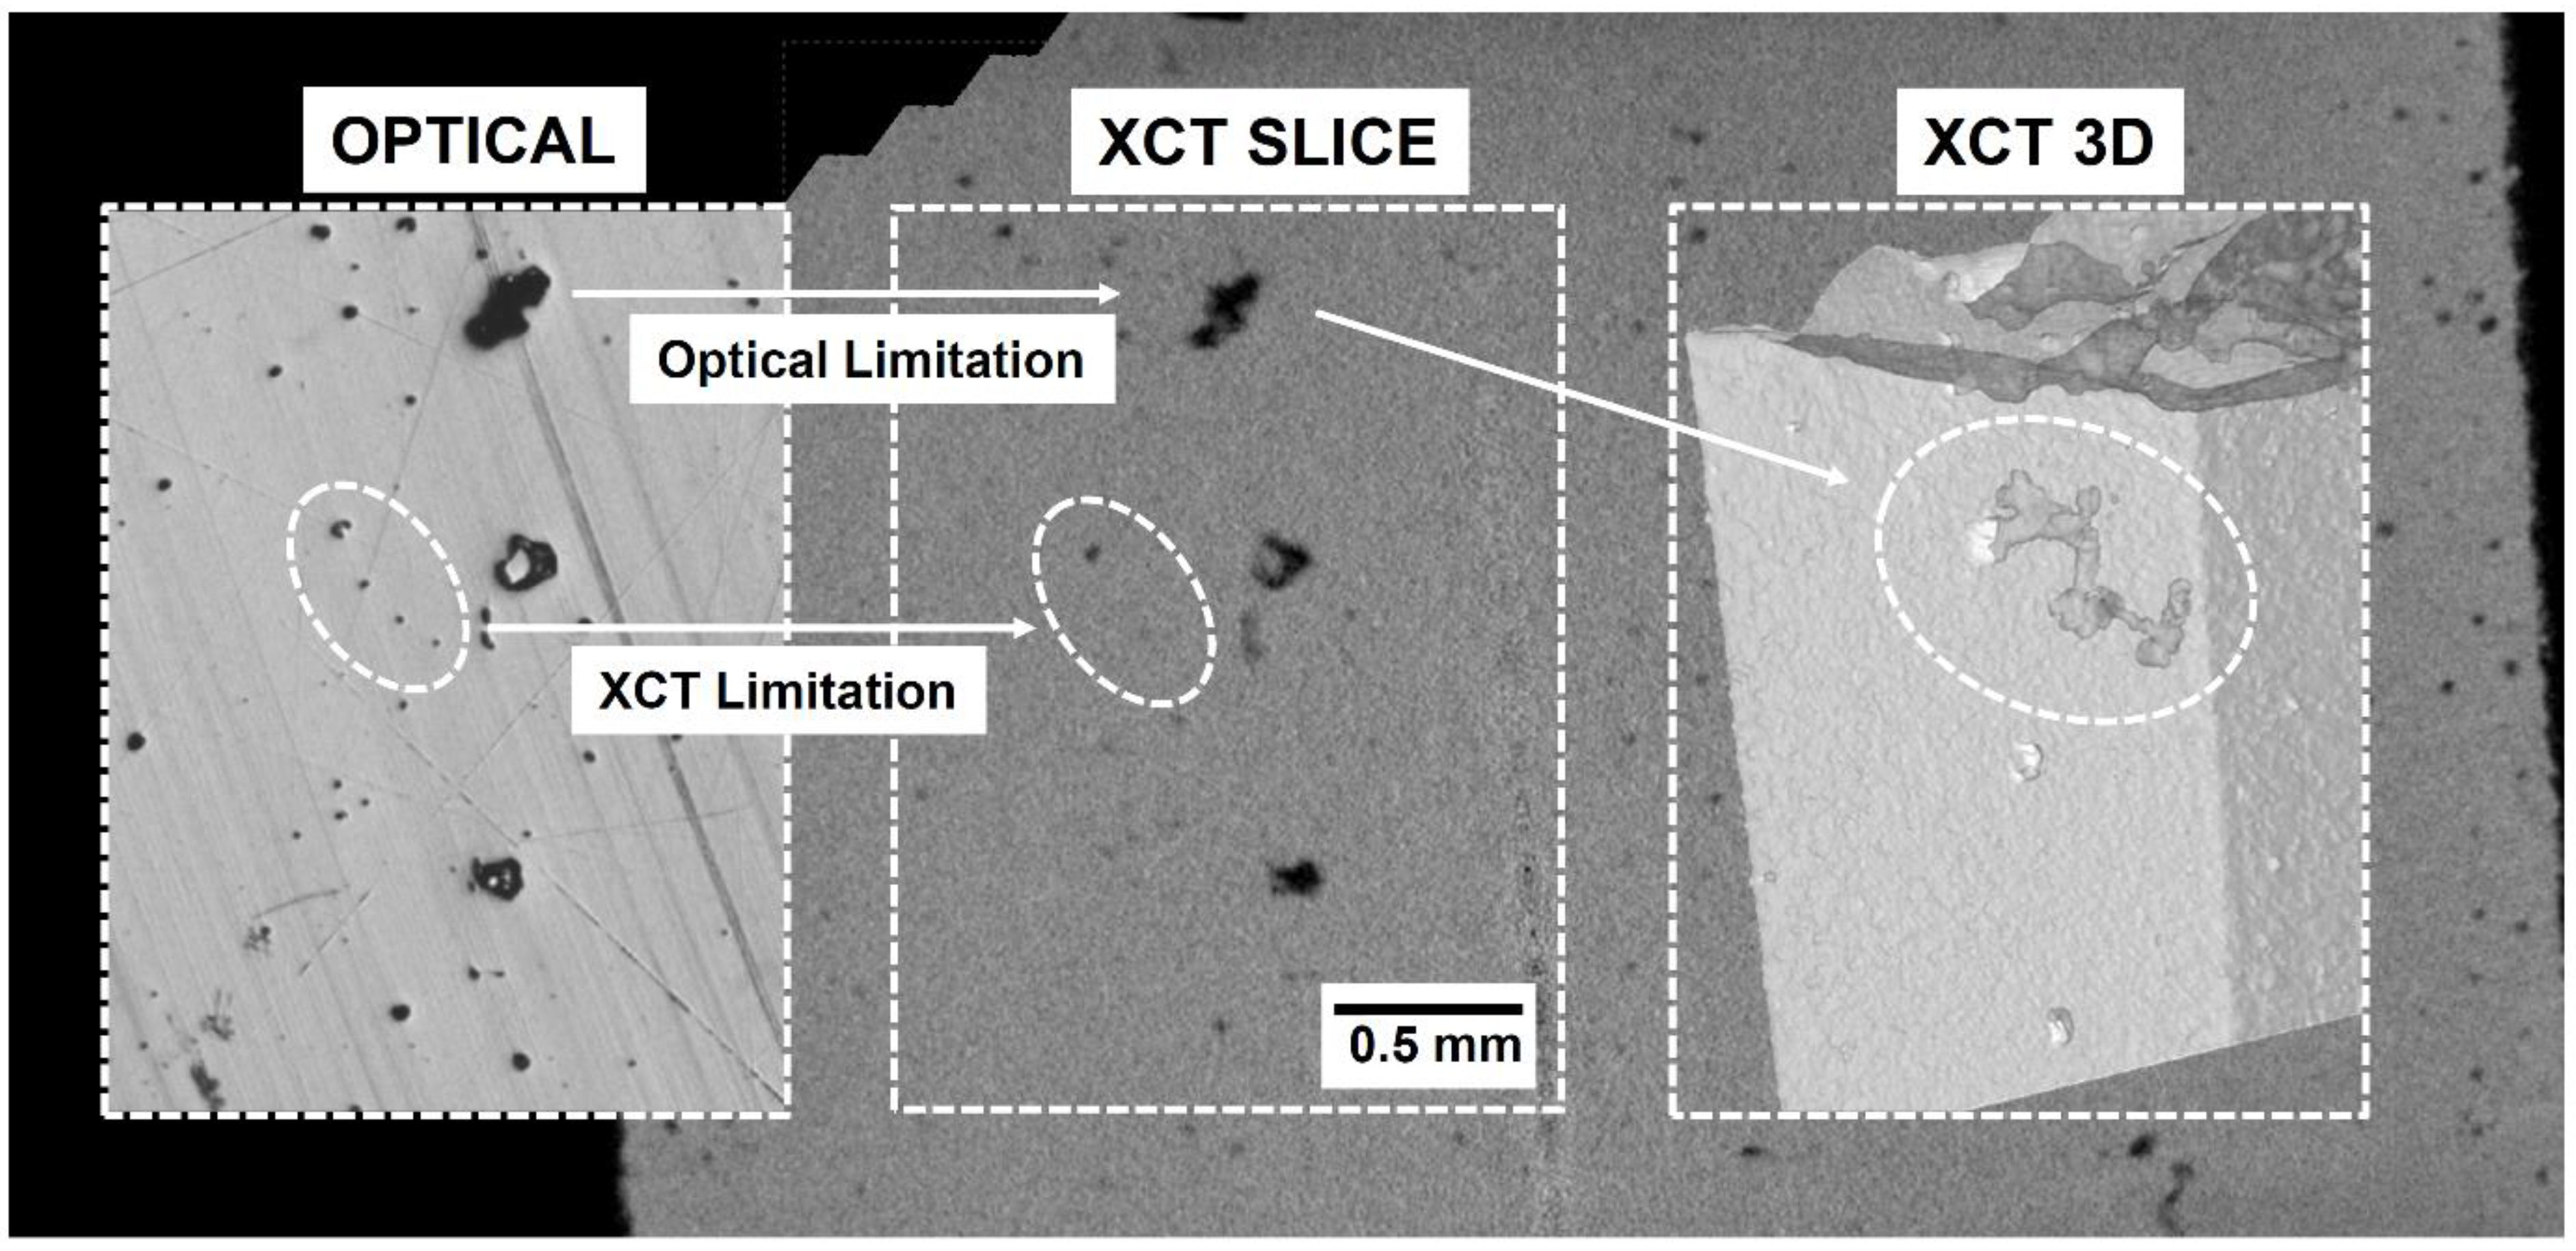
Figure 7 shows a comparison of porosity measured using XCT and optical microscope. Depending on pore size and shape, lack of fusion pores and keyhole pores were observed in the samples. In this study, samples with porosity greater than 1.5% have lack of fusion pores, and these pores are larger and more numerous than keyhole pores present in samples with porosity below 1.5%. In general, porosity obtained by XCT and optical microscope are comparable. At low volume energy, pores formed due to lack of fusion are typically larger than XCT resolution (around 14 µm), so XCT is able to detect all pores in the entire volume, whereas an optical microscope uses only 2D cross-sectional layers of each sample to measure porosity, and this may miss some pores that are not on the imaging layer (Figure 8). In addition, several optical images taken on the imaging layer may not cover the entire area of the layer, which may also miss pores. The porosity obtained by the optical microscope is slightly higher than XCT for keyholes. At this porosity level, pores formed in the keyhole mode are small, and those pores smaller than the XCT resolution cannot be detected and measured by the XCT while they are captured by the optical microscope due to its much higher resolution (0.7 µm), as is shown in Figure 8.
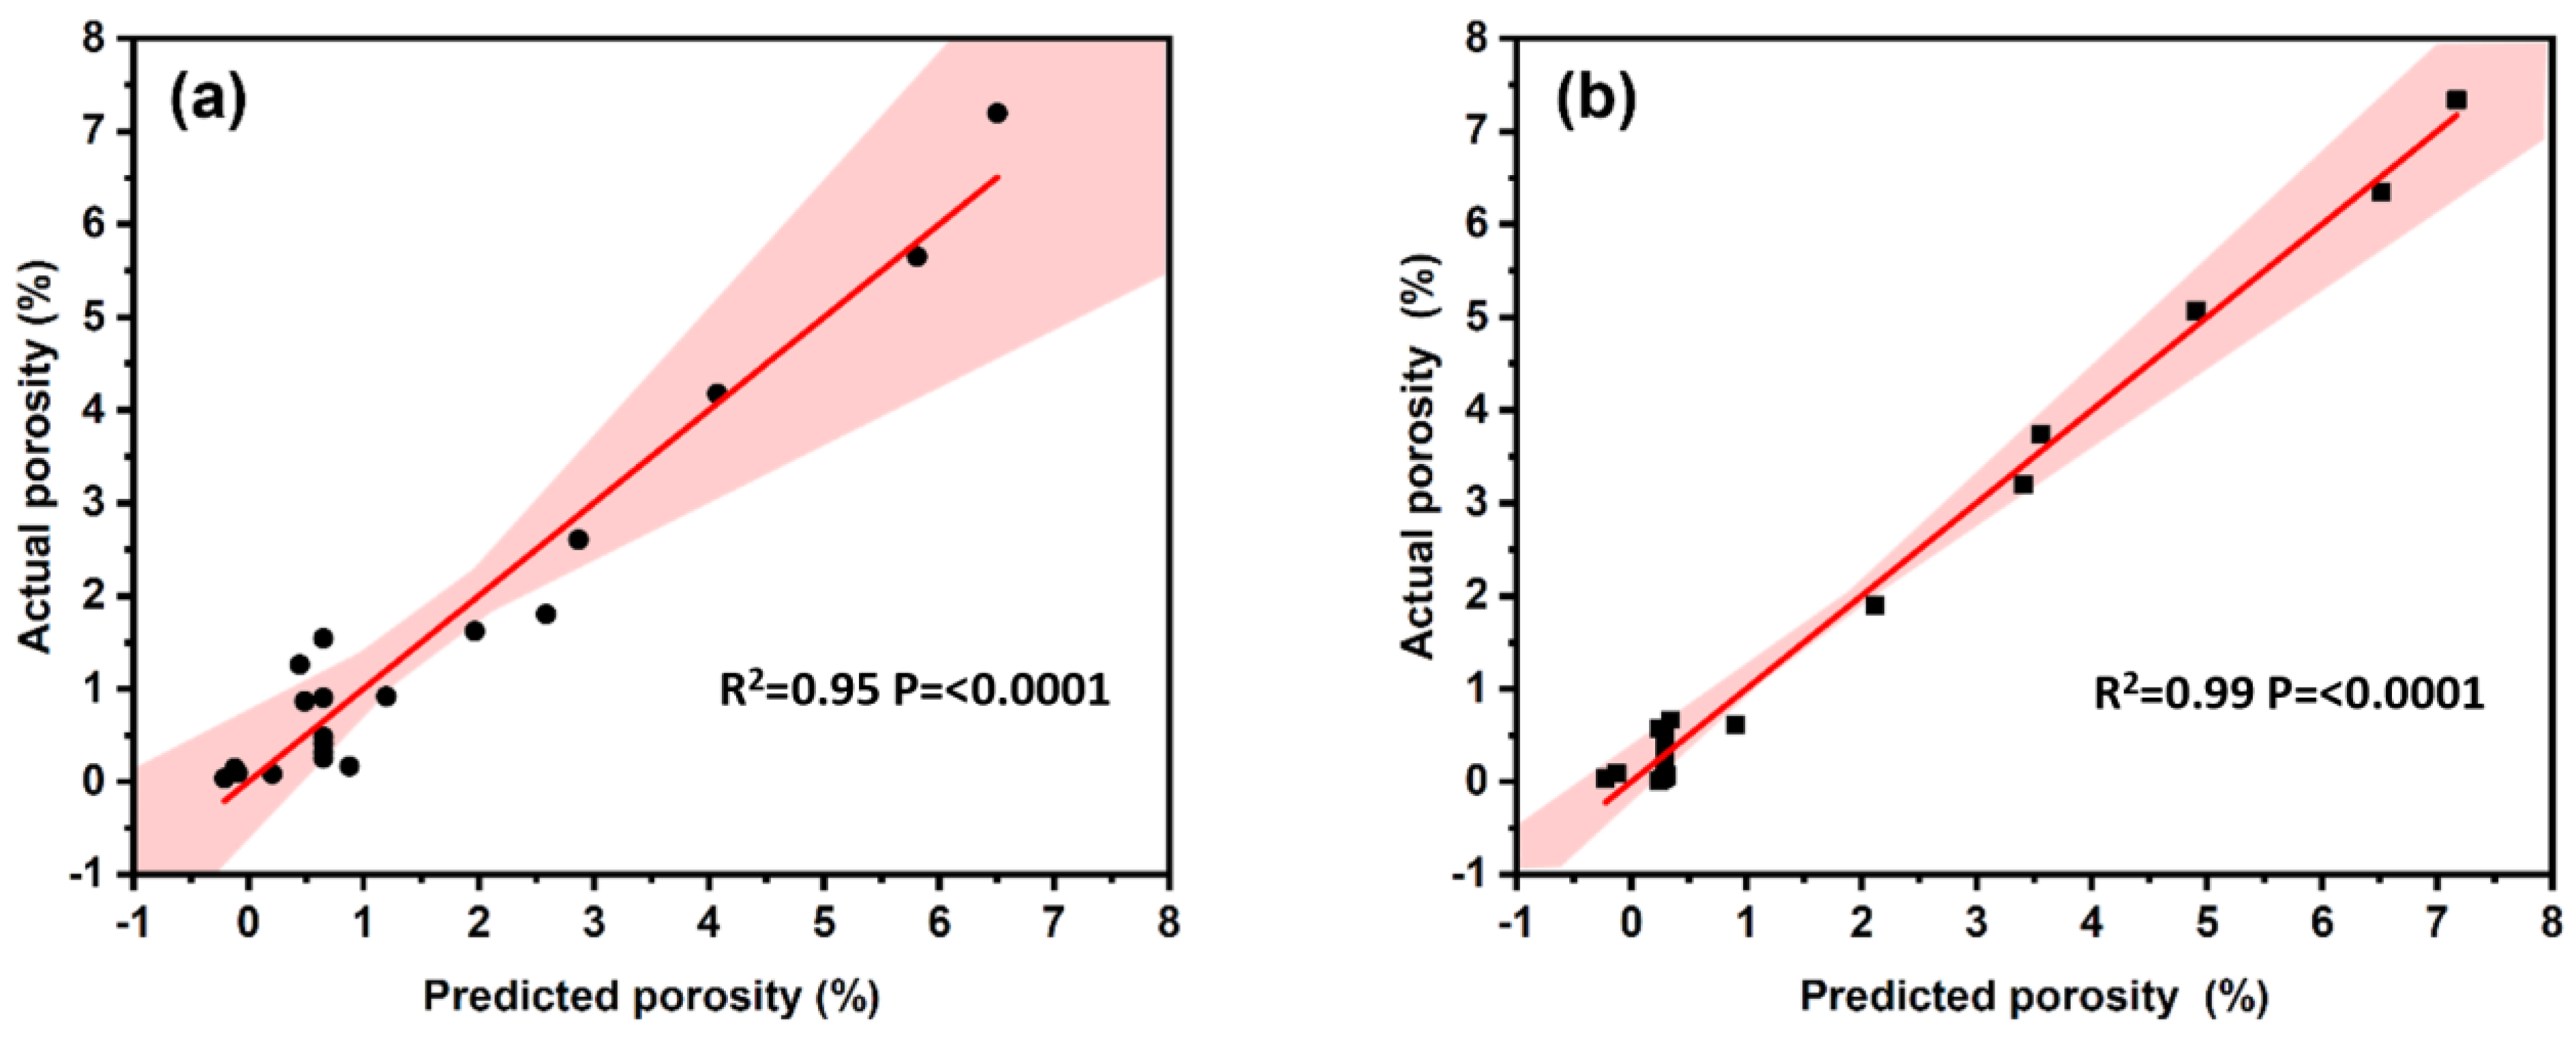
The porosities obtained using XCT and optical microscope were analyzed using JMP to investigate the mathematical relationship between printing parameters and porosity. Figure 9 shows the actual porosity vs. predicted porosity plot from the optical microscope (Figure 9a) and (Figure 9b). A p-value less than 0.05 is considered statistically significant. The linear regression R2 is 0.95 for optical microscope data and 0.99 for XCT data, with both p-values ≤ 0.0001, indicating a good match between experimental and predicted data for both methods.
Table 3 shows the factors and their effect on porosity based on the models. Regression coefficients indicate if this factor is positively or negatively correlated with porosity. Factors are listed according to their effect on porosity, sorted by ascending p-values. F Ratio is a statistical signal-to-noise ratio. The F ratios and p-values provide information about whether each individual factor influences porosity. A p-value less than 0.05 is statistically significant, meaning that the factor influences porosity. The smaller the p-value, the more dependent the porosity is on the factor. The LogWorth value shows the effect estimated by the model and is defined as −log10 (p-value). This transformation adjusts the p-values to give the appropriate plot scale. Factors with a LogWorth value greater than 1.3 affect porosity. The higher the LogWorth number, the greater the influence of the factor on porosity. From the modeling results of porosity obtained by optical microscope and XCT, power is the most significant factor affecting porosity, with velocity the next significant and hatch spacing the least of the three. Power and porosity are negatively correlated, indicating that the higher the power, the lower the porosity, which is consistent with the modeling result of the pore properties in Figure 4 and Table 2. Attention should also be paid to the quadratic effects of power, velocity and hatch spacing, showing that the porosity tends to change in reverse after a certain threshold. The power–velocity and power–hatch spacing interactions are significant, indicating that changes in one parameter will affect the effect of the other on porosity. The velocity–hatch spacing interaction is not significant, indicating that they do not affect each other. The JMP predictive equations of porosity as a function of laser power (p), scan velocity (v) and hatch spacing (h) are given in Equation (2) based on optical data and Equation (3) based on XCT data.
P o r o s i t y o p t i c a l   = 6.44304 0.17356 p 0.00638 v + 0.04401 h + 0.00764 ( p 75 ) 2 0.00099 ( p 75 ) ( v 650 ) + 0.00003 ( v 650 ) 2 0.00585 ( p 75 ) ( h 70 ) + 0.00019 ( v 650 ) ( h 70 ) + 0.00204 ( h 70 ) 2
P o r o s i t y X C T   = 5.32658 0.19815 p + 0.00910 v + 0.05584 h + 0.00986 ( p 75 ) 2 0.00099 ( p 75 ) ( v 650 )   + 0.00006 ( v 650 ) 2 0.00674 ( p 75 ) ( h 70 ) 0.00010 ( v 650 ) ( h 70 ) + 0.00315 ( h 70 ) 2

3.4. Prediction and Optimization of Porosity

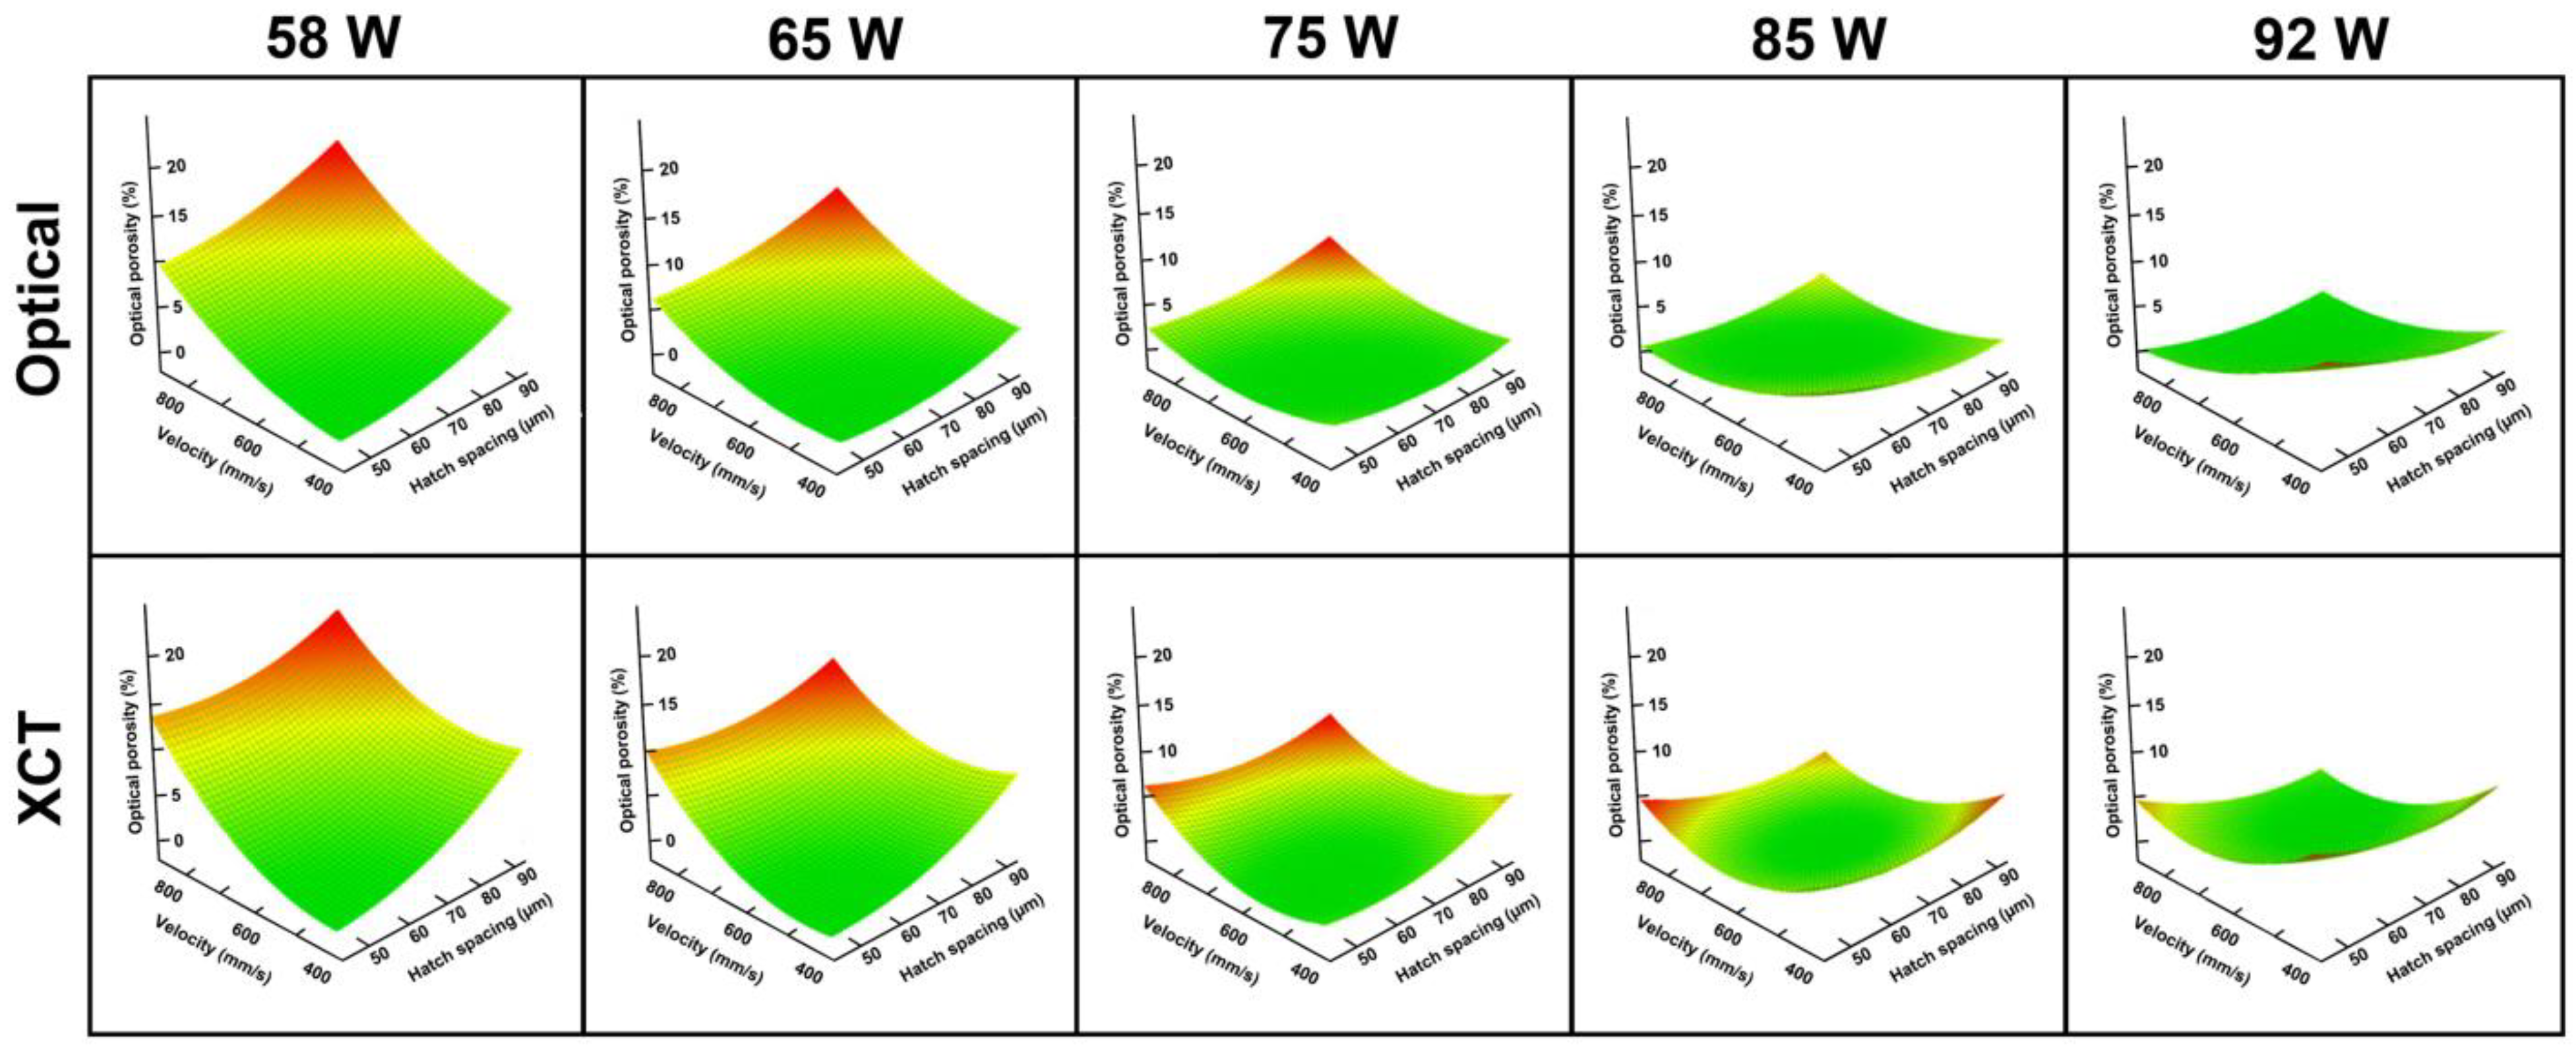
Since laser power is the dominant factor affecting porosity, Equations (2) and (3) were employed to predict the porosity as a function of velocity and hatch spacing at different laser powers; see Figure 10. The primary aim is to show how porosity varies with laser power. Figure 10 shows the prediction of porosity based on the optical and XCT models. Overall, they show the same changing trend. 3D plots show a gradual decrease in porosity with increasing power. At 58 W, the highest porosity (red on response surfaces) is greater than 20%, falling below 5% at 85 W within the experimental range. When the power is further increased to 92 W, the highest porosity increases due to the increased keyhole pores resulting from excessive energy input. The 3D plots also show that at 58 W, 65 W and 75 W, the highest porosity is obtained at high velocity and large hatch spacing due to lack of fusion, while at 85 W and 92 W, the highest porosity is obtained at low velocity and small hatch spacing at high energy due to keyholes. The transition from lack of fusion pores to keyhole pores indicates that there is a minimum porosity when appropriately combining power, velocity and hatch spacing at this transition region.
Table 4 shows the predicted optimum parameter combinations to manufacture the minimum porosity and the experimentally measured porosity. The two methods predicted different optimum velocity and hatch spacing; however, the volume energies are close to each other. The semitransparent 3D porosity analysis (Figure 11) confirms the extremely low measured porosity. The findings indicate that the optimum printing parameter sets that result in minimal porosity can be reliably predicted from both optical and XCT data. In principle, this method can be applied to other metals in laser powder additive manufacturing.

4. Conclusions

Optical microscope and XCT were employed to characterize the pores and porosity of additively manufactured 316L stainless steel under systematically and statistically designed laser parameter sets. Mathematical models show that power is the dominant printing parameter affecting pore properties and porosity. Power is negatively correlated with pore density, size and porosity, and positively correlated with sphericity. The porosity measured by the two methods is similar. XCT measured higher porosity at low power and volume energy with large pores formed due to lack of fusion, while optical microscopy measured higher porosity at high power and volume energy with small keyhole pores. Both optical and XCT mathematical models successfully predicted extremely low porosity. The measured porosities of the optimum samples predicted by the optical and XCT models are 0.0009% and 0.0003%, respectively. The optimum power, velocity and hatch spacing are 92 W, 818 mm/s and 76 µm as predicted by the optical model and 92 W, 750 mm/s and 81 µm as predicted by the XCT model. The results in this study contribute to a deeper understanding of process–defect properties and process–porosity relationships and can assist in the design of experiments for quality control in other alloys in LPBF.

Author Contributions

Conceptualization, R.Z.; methodology, R.Z., A.S. and R.F.; software, R.Z., A.S. and R.F.; validation, R.Z. and A.S.; formal analysis, R.Z.; investigation, R.Z.; resources, B.C.P.; data curation, R.Z.; writing—original draft preparation, R.Z.; writing—review and editing, R.Z., R.F.; visualization, R.Z. and A.S.; supervision, B.C.P.; project administration, B.C.P.; funding acquisition, B.C.P. All authors have read and agreed to the published version of the manuscript.

Funding

This research was funded by [United States National Institute of Standards and Technology] grant number [NIST-70NANB16H272, NIST-70NANB17H295 and NIST-70NANB18H220].

Institutional Review Board Statement

Not applicable.

Informed Consent Statement

Not applicable.

Data Availability Statement

Not applicable.

Acknowledgments

This work was sponsored by the United States National Institute of Standards and Technology under contracts NIST-70NANB16H272, NIST-70NANB17H295 and NIST-70NANB18H220.

Conflicts of Interest

The authors declare that they have no conflict of interest.

References

  1. Chowdhury, S.; Yadaiah, N.; Prakash, C.; Ramakrishna, S.; Dixit, S.; Gupta, L.R.; Buddhi, D. Laser powder bed fusion: A state-of-the-art review of the technology, materials, properties & defects, and numerical modelling. J. Mater. Res. Technol. 2022, 20, 2109–2172. [Google Scholar]
  2. Tang, M.; Pistorius, P.C.; Beuth, J.L. Prediction of lack-of-fusion porosity for powder bed fusion. Addit. Manuf. 2017, 14, 39–48. [Google Scholar] [CrossRef]
  3. du Plessis, A.; Yadroitsava, I.; Yadroitsev, I. Effects of defects on mechanical properties in metal additive manufacturing: A review focusing on X-ray tomography insights. Mater. Des. 2020, 187, 108385. [Google Scholar] [CrossRef]
  4. du Plessis, A. Effects of process parameters on porosity in laser powder bed fusion revealed by X-ray tomography. Addit. Manuf. 2019, 30, 100871. [Google Scholar] [CrossRef]
  5. Spierings, A.B.; Schneider, M.; Eggenberger, R. Comparison of density measurement techniques for additive manufactured metallic parts. Rapid Prototyp. J. 2011, 17, 380–386. [Google Scholar] [CrossRef]
  6. de Terris, T.; Andreau, O.; Peyre, P.; Adamski, F.; Koutiri, I.; Gorny, C.; Dupuy, C. Optimization and comparison of porosity rate measurement methods of Selective Laser Melted metallic parts. Addit. Manuf. 2019, 28, 802–813. [Google Scholar] [CrossRef]
  7. Cakmak, E.; Bingham, P.; Cunningham, R.W.; Rollett, A.D.; Xiao, X.; Dehoff, R.R. Non-destructive characterization of additively manufactured components with x-ray computed tomography for part qualification: A study with laboratory and synchrotron x-rays. Mater. Charact. 2021, 173, 110894. [Google Scholar] [CrossRef]
  8. Ziółkowski, G.; Chlebus, E.; Szymczyk, P.; Kurzac, J. Application of X-ray CT method for discontinuity and porosity detection in 316L stainless steel parts produced with SLM technology. Arch. Civ. Mech. Eng. 2014, 14, 608–614. [Google Scholar] [CrossRef]
  9. Chioibasu, D.; Mihai, S.; Mahmood, M.A.; Lungu, M.; Porosnicu, I.; Sima, A.; Dobrea, C.; Tiseanu, I.; Popescu, A.C. Use of X-ray Computed Tomography for Assessing Defects in Ti Grade 5 Parts Produced by Laser Melting Deposition. Metals 2020, 10, 1408. [Google Scholar] [CrossRef]
  10. Yusuf, S.M.; Chen, Y.; Boardman, R.; Yang, S.; Gao, N. Investigation on Porosity and Microhardness of 316L Stainless Steel Fabricated by Selective Laser Melting. Metals 2017, 7, 64. [Google Scholar] [CrossRef]
  11. Wits, W.W.; Carmignato, S.; Zanini, F.; Vaneker, T.H.J. Porosity testing methods for the quality assessment of selective laser melted parts. CIRP Ann. 2016, 65, 201–204. [Google Scholar] [CrossRef]
  12. Heim, K.; Bernier, F.; Pelletier, R.; Lefebvre, L.P. High resolution pore size analysis in metallic powders by X-ray tomography. Case Stud. Nondestruct. Test. Eval. 2016, 6, 45–52. [Google Scholar] [CrossRef]
  13. Vilaro, T.; Colin, C.; Bartout, J.D. As-Fabricated and Heat-Treated Microstructures of the Ti-6Al-4V Alloy Processed by Selective Laser Melting. Metall. Mater. Trans. A 2011, 42, 3190–3199. [Google Scholar] [CrossRef]
  14. Kan, W.H.; Nadot, Y.; Foley, M.; Ridosz, L.; Proust, G.; Cairney, J.M. Factors that affect the properties of additively-manufactured AlSi10Mg: Porosity versus microstructure. Addit. Manuf. 2019, 29, 100805. [Google Scholar] [CrossRef]
  15. Gong, H.; Rafi, K.; Gu, H.; Starr, T.; Stucker, B. Analysis of defect generation in Ti–6Al–4V parts made using powder bed fusion additive manufacturing processes. Addit. Manuf. 2014, 1–4, 87–98. [Google Scholar] [CrossRef]
  16. Choo, H.; Sham, K.-L.; Bohling, J.; Ngo, A.; Xiao, X.; Ren, Y.; Depond, P.J.; Matthews, M.J.; Garlea, E. Effect of laser power on defect, texture, and microstructure of a laser powder bed fusion processed 316L stainless steel. Mater. Des. 2019, 164, 107534. [Google Scholar] [CrossRef]
  17. Kluczyński, J.; Śnieżek, L.; Grzelak, K.; Mierzyński, J. The Influence of Exposure Energy Density on Porosity and Microhardness of the SLM Additive Manufactured Elements. Materials 2018, 11, 2304. [Google Scholar] [CrossRef] [PubMed]
  18. Montgomery, D.C. Design and Analysis of Experiments, 8th ed.; John Wiley & Sons, Inc.: Hoboken, NJ, USA, 2012. [Google Scholar]
  19. Aggarwal, A.; Patel, S.; Kumar, A. Selective Laser Melting of 316L Stainless Steel: Physics of Melting Mode Transition and Its Influence on Microstructural and Mechanical Behavior. JOM 2019, 71, 1105–1116. [Google Scholar] [CrossRef]
  20. Kasperovich, G.; Haubrich, J.; Gussone, J.; Requena, G. Correlation between porosity and processing parameters in TiAl6V4 produced by selective laser melting. Mater. Des. 2016, 105, 160–170. [Google Scholar] [CrossRef] [Green Version]
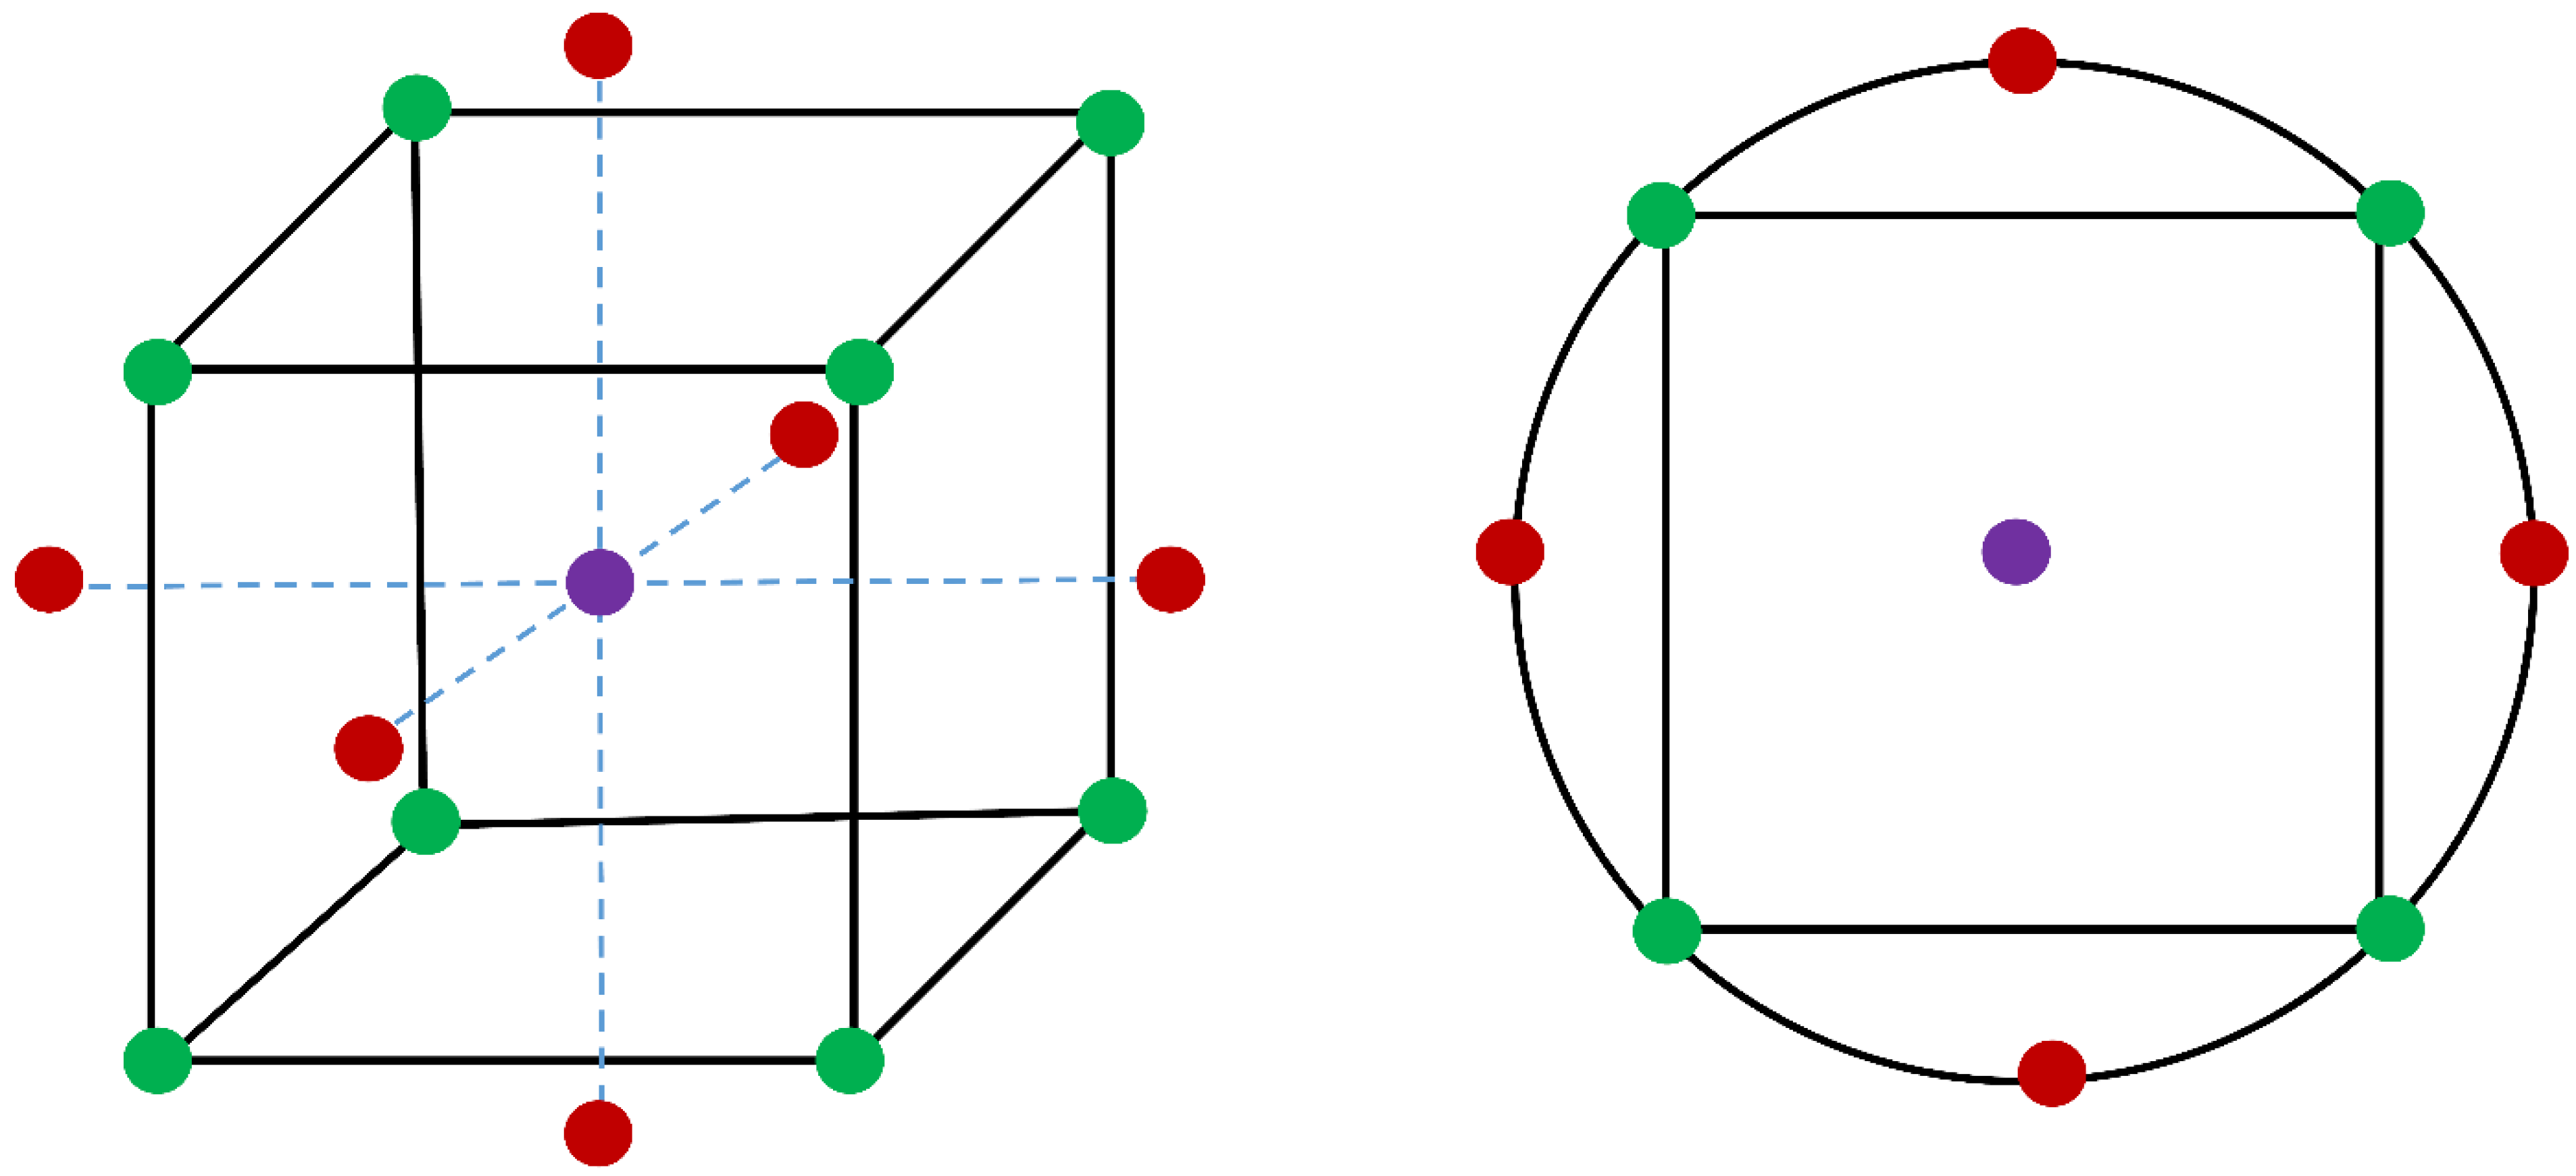
Figure 1. Schematic diagram of a central composite design-circumscribed (CCC), consisting of cube points (green), axial points (red) and central points (purple).
Metals 13 00330 g001
Figure 2. Printing geometry and strategy.
Metals 13 00330 g002
Figure 3. Porosity characterization for lack of fusion and keyhole parameter sets, including 3D XCT samples from lack of fusion pores to keyhole pores (ac), 3D XCT porosity analysis (df), 2D XCT images (gi) and 2D optical images (jl). The pore coloring scale of 3D XCT is the same as those shown in 2D XCT.
Metals 13 00330 g003
Figure 4. Mathematical modeling of pore properties: (a) number of pores/mm3, (b) mean diameter and (c) sphericity.
Metals 13 00330 g004
Figure 5. Pore properties change with power and volume energy: (a) number of pores/mm3, (b) mean diameter and (c) sphericity. The three inserts in (c) are representative pores showing increasing sphericity.
Metals 13 00330 g005
Figure 6. XCT 3D porosity analysis shows number of pores/mm3, mean diameter and sphericity change with power: (ac) 65 W, (df) 75 W, (gi) 85 W, and change with volume energy (denoted in the upper right corner of each image).
Metals 13 00330 g006
Figure 7. Comparison of porosity measured using XCT and optical microscope.
Metals 13 00330 g007
Figure 8. Comparison of pores measured using XCT and optical microscope.
Metals 13 00330 g008
Figure 9. Porosity modeling of (a) optical data and (b) XCT data.
Metals 13 00330 g009
Figure 10. Prediction of porosity variation with power based on the optical and XCT models.
Metals 13 00330 g010
Figure 11. XCT porosity analysis from the predicted optimum parameter sets in Table 4.
Metals 13 00330 g011
Table 1. Experimental design including 3 printing parameters and 5 levels for each parameter; 6 central points were used to improve the modeling and prediction precision.
Sample
Number
Power
(W)
Velocity
(mm/s)
Hatch Spacing
(µm)
Volume Energy
(J/mm3)
1657508043.33
2756507065.93
3857506075.56
4857508056.67
5756507065.93
68555060103.03
7657506057.78
8756507065.93
9586507050.99
10655506078.79
11655508059.09
12756507065.93
13855508077.27
14756507065.93
157565086.8153.17
16926507080.88
177565053.1886.79
18754827088.92
19758187052.39
20756507065.93
Table 2. Factors and their effects on pore properties based on the regression model of XCT data.
Metals 13 00330 i001
Table 3. Factors and their effect on porosity based on the regression model of (a) optical and (b) XCT data.
(a)
FactorsReg. coe.F ratiop-valueLogWorth
Power−0.17356100.7724<0.00001Metals 13 00330 i002
Power*Power0.0076421.12780.00099Metals 13 00330 i003
Power*Velocity−0.0009919.04760.00141Metals 13 00330 i004
Velocity−0.0063813.46300.00432Metals 13 00330 i005
Power*Hatch spacing−0.005856.64980.02748Metals 13 00330 i006
Hatch spacing0.044016.42090.02967Metals 13 00330 i007
Velocity*Velocity0.000033.27780.10032Metals 13 00330 i008
Hatch spacing*Hatch spacing0.002041.45890.25489Metals 13 00330 i009
Velocity*Hatch spacing0.000190.70550.42058Metals 13 00330 i010
(b)
FactorsReg. coe.F ratiop-valueLogWorth
Power−0.19815566.9653<0.00001Metals 13 00330 i011
Power*Power0.00986152.0352<0.00001Metals 13 00330 i012
Velocity0.00910118.5320<0.00001Metals 13 00330 i013
Power*Velocity−0.0009982.5550<0.00001Metals 13 00330 i014
Velocity*Velocity0.0000547.26320.00004Metals 13 00330 i015
Hatch spacing0.0558444.61940.00006Metals 13 00330 i016
Power*Hatch spacing−0.0067438.09170.00011Metals 13 00330 i017
Hatch spacing*Hatch spacing0.0031414.92900.00314Metals 13 00330 i018
Velocity*Hatch spacing−0.000100.83790.38154Metals 13 00330 i019
Table 4. Predicted parameter sets that result in minimum porosity.
MethodPower (W)Velocity (mm/s)Hatch Spacing (μm)Volume Energy (J/mm3)Predicted Porosity (%)Measured Porosity (%)
Optical928177659.27−1.1980.0009
XCT927508160.58−0.9250.0003
Disclaimer/Publisher’s Note: The statements, opinions and data contained in all publications are solely those of the individual author(s) and contributor(s) and not of MDPI and/or the editor(s). MDPI and/or the editor(s) disclaim responsibility for any injury to people or property resulting from any ideas, methods, instructions or products referred to in the content.