Article

Kinetic Mechanism of Hydrogen Absorption of AA6111 Alloys Melt

1
State Key Laboratory of Featured Metal Materials and Life-Cycle Safety for Composite Structures, Guangxi University, Nanning 530004, China
2
Centre of Ecological Collaborative Innovation for Aluminum Industry in Guangxi, Guangxi University, Nanning 530004, China
3
Key Laboratory of High-Performance Structural Materials and Thermo-Surface Processing, Education Department of Guangxi Zhuang Autonomous Region, Guangxi University, Nanning 530004, China
4
Advanced Research Institute of Multidisciplinary Science (ARIM), Beijing Institute of Technology (BIT), Beijing 100081, China
5
Anhui Antai New Style Packeting Materials Co., Ltd., Hefei 230601, China
*
Author to whom correspondence should be addressed.
Metals 2023, 13(2), 236; https://doi.org/10.3390/met13020236
Submission received: 19 December 2022 / Revised: 13 January 2023 / Accepted: 16 January 2023 / Published: 26 January 2023
(This article belongs to the Section Computation and Simulation on Metals)

Abstract

:
The kinetic mechanism of hydrogen absorption of the AA6111 alloy melt in different melting environments, and the in-situ real-time observation of the oxide film structure during the hydrogen absorption process were studied. The results show that the hydrogen absorption process of the aluminum alloy melt is related to the melting environment and the oxide film on the melt surface. The hydrogen content in the melt increases with the extension of time when the melting environment humidity and temperature are constant. The initial hydrogen content is also higher and the hydrogen absorption capacity of the melt is larger when the melting temperature is constant with an increasing melting environment humidity. The oxide film will fold over on itself and become porous, due to the change in the structure of the melt surface during heating. The surface of the melt is similar to the double-oxide-film defect hydrogen absorption carrier, which leads to the aggravation of hydrogen absorption. Hydrogen absorption kinetic equations for the aluminum alloy melt under different melting environments are obtained based on the experimental results.

1. Introduction

The quality requirements of aluminum alloy are becoming increasingly stringent with the wide application of aluminum alloy in the automobile, aerospace, and electronics industry, among others [1,2,3,4,5,6]. Aluminum alloy melts are very easily react with water vapor in the air, and absorb hydrogen during the melting process; this leads to pinhole and porosity defects in the casting and seriously reduces the tensile strength, elongation, and fatigue resistance of the aluminum alloy. Therefore, special technological measures should be taken in the process of melting and pouring. To obtain high-quality products, it is significant that the gas and inclusions in aluminum melt are removed by the special purification technical during actual production process [7].
Hydrogen is the sole dissolved gas in aluminum melts [8]. The most commonly used concept in describing the hydrogen concentration in aluminum is the solubility limit and gas content (or hydrogen solubility and hydrogen content). The hydrogen content and solubility of aluminum melts have been reported elsewhere [9,10,11,12,13,14]. It should be pointed out that hydrogen content and hydrogen solubility are different concepts. Hydrogen content is the amount of hydrogen dissolved in a unit quantity of aluminum melts. Hydrogen solubility is the ability of hydrogen (or the maximum amount of hydrogen) to dissolve in aluminum melts at a given temperature and hydrogen partial pressure. It is, therefore, the maximum amount of hydrogen that can dissolve in an aluminum alloy melt of a given chemical composition under equilibrium conditions at a specific temperature and hydrogen partial pressure; this is a thermodynamic equilibrium value. Hydrogen content usually refers to the kinetic process in which the concentration of hydrogen in an aluminum melt changes with time under the actual melting conditions [12].
The content of hydrogen in the aluminum melt is affected by many factors, such as melting temperature, holding time, environmental humidity, the content of the alloy elements, the oxide film structure and the inclusions [15,16,17,18]. Zeng [19] discussed the hydrogen content of a ZL114A aluminum melt under different air conditions of melting, and pointed out that the hydrogen content of the aluminum alloy melts under the humid melting environment was much higher than that in the dry environment. Sun [20] developed a computer-aided system for measuring the hydrogen absorption capacity of an aluminum alloy melt. The experimental results show that the melt temperature and the contact time between the aluminum melt and the water vapor are the key factors in determining the hydrogen absorption capacity of the aluminum melt. Guo [21] found that the hydrogen content in the aluminum melt increased with the increase in the casting temperature, by measuring the hydrogen content in the aluminum melt at different temperatures in the chute. It has been found that the alloying elements in aluminum alloys can be divided into two categories: endothermic occludes of hydrogen (such as Mg, Li or Ti) and exothermic occludes of hydrogen (such as Cu, Si, Zn or Fe) [13]. When the Mg content in the aluminum melt is gradually increased, the Al2O3 film on the melt surface will be gradually replaced by MgO. The MgO film formed is porous and does not protect the aluminum melt. On the contrary, the aluminum melt more easily contacts the atmosphere, making it inhale and be oxidized [15]. Cu is a non-surface-active element, is not enriched on the surface of the aluminum solution and does not readily interact with the oxide film. The copper oxide produced by the oxidation of Cu has the same lattice as γ-Al2O3, which has a higher density and a dense organization [22].
Nonetheless, studies have mainly focused on the factors that affect the hydrogen degassing process of the aluminum melt, and there is no in-depth study that discusses the hydrogen absorption process of the aluminum melt. In this work, the kinetic mechanism of the hydrogen absorption of AA6111 melts in different melting environments, and the effect of the oxide film structure on the hydrogen absorption process, are found by using in-situ real-time OM observation. On the basis of the above research, the mathematical model of the hydrogen absorption kinetics of the AA6111 aluminum alloy melt in different melt environments was established. Understanding the kinetic mechanism of hydrogen absorption in the alloy melt is helpful for predicting the hydrogen content in the aluminum alloy melt in real-time, and improving the quality of castings.

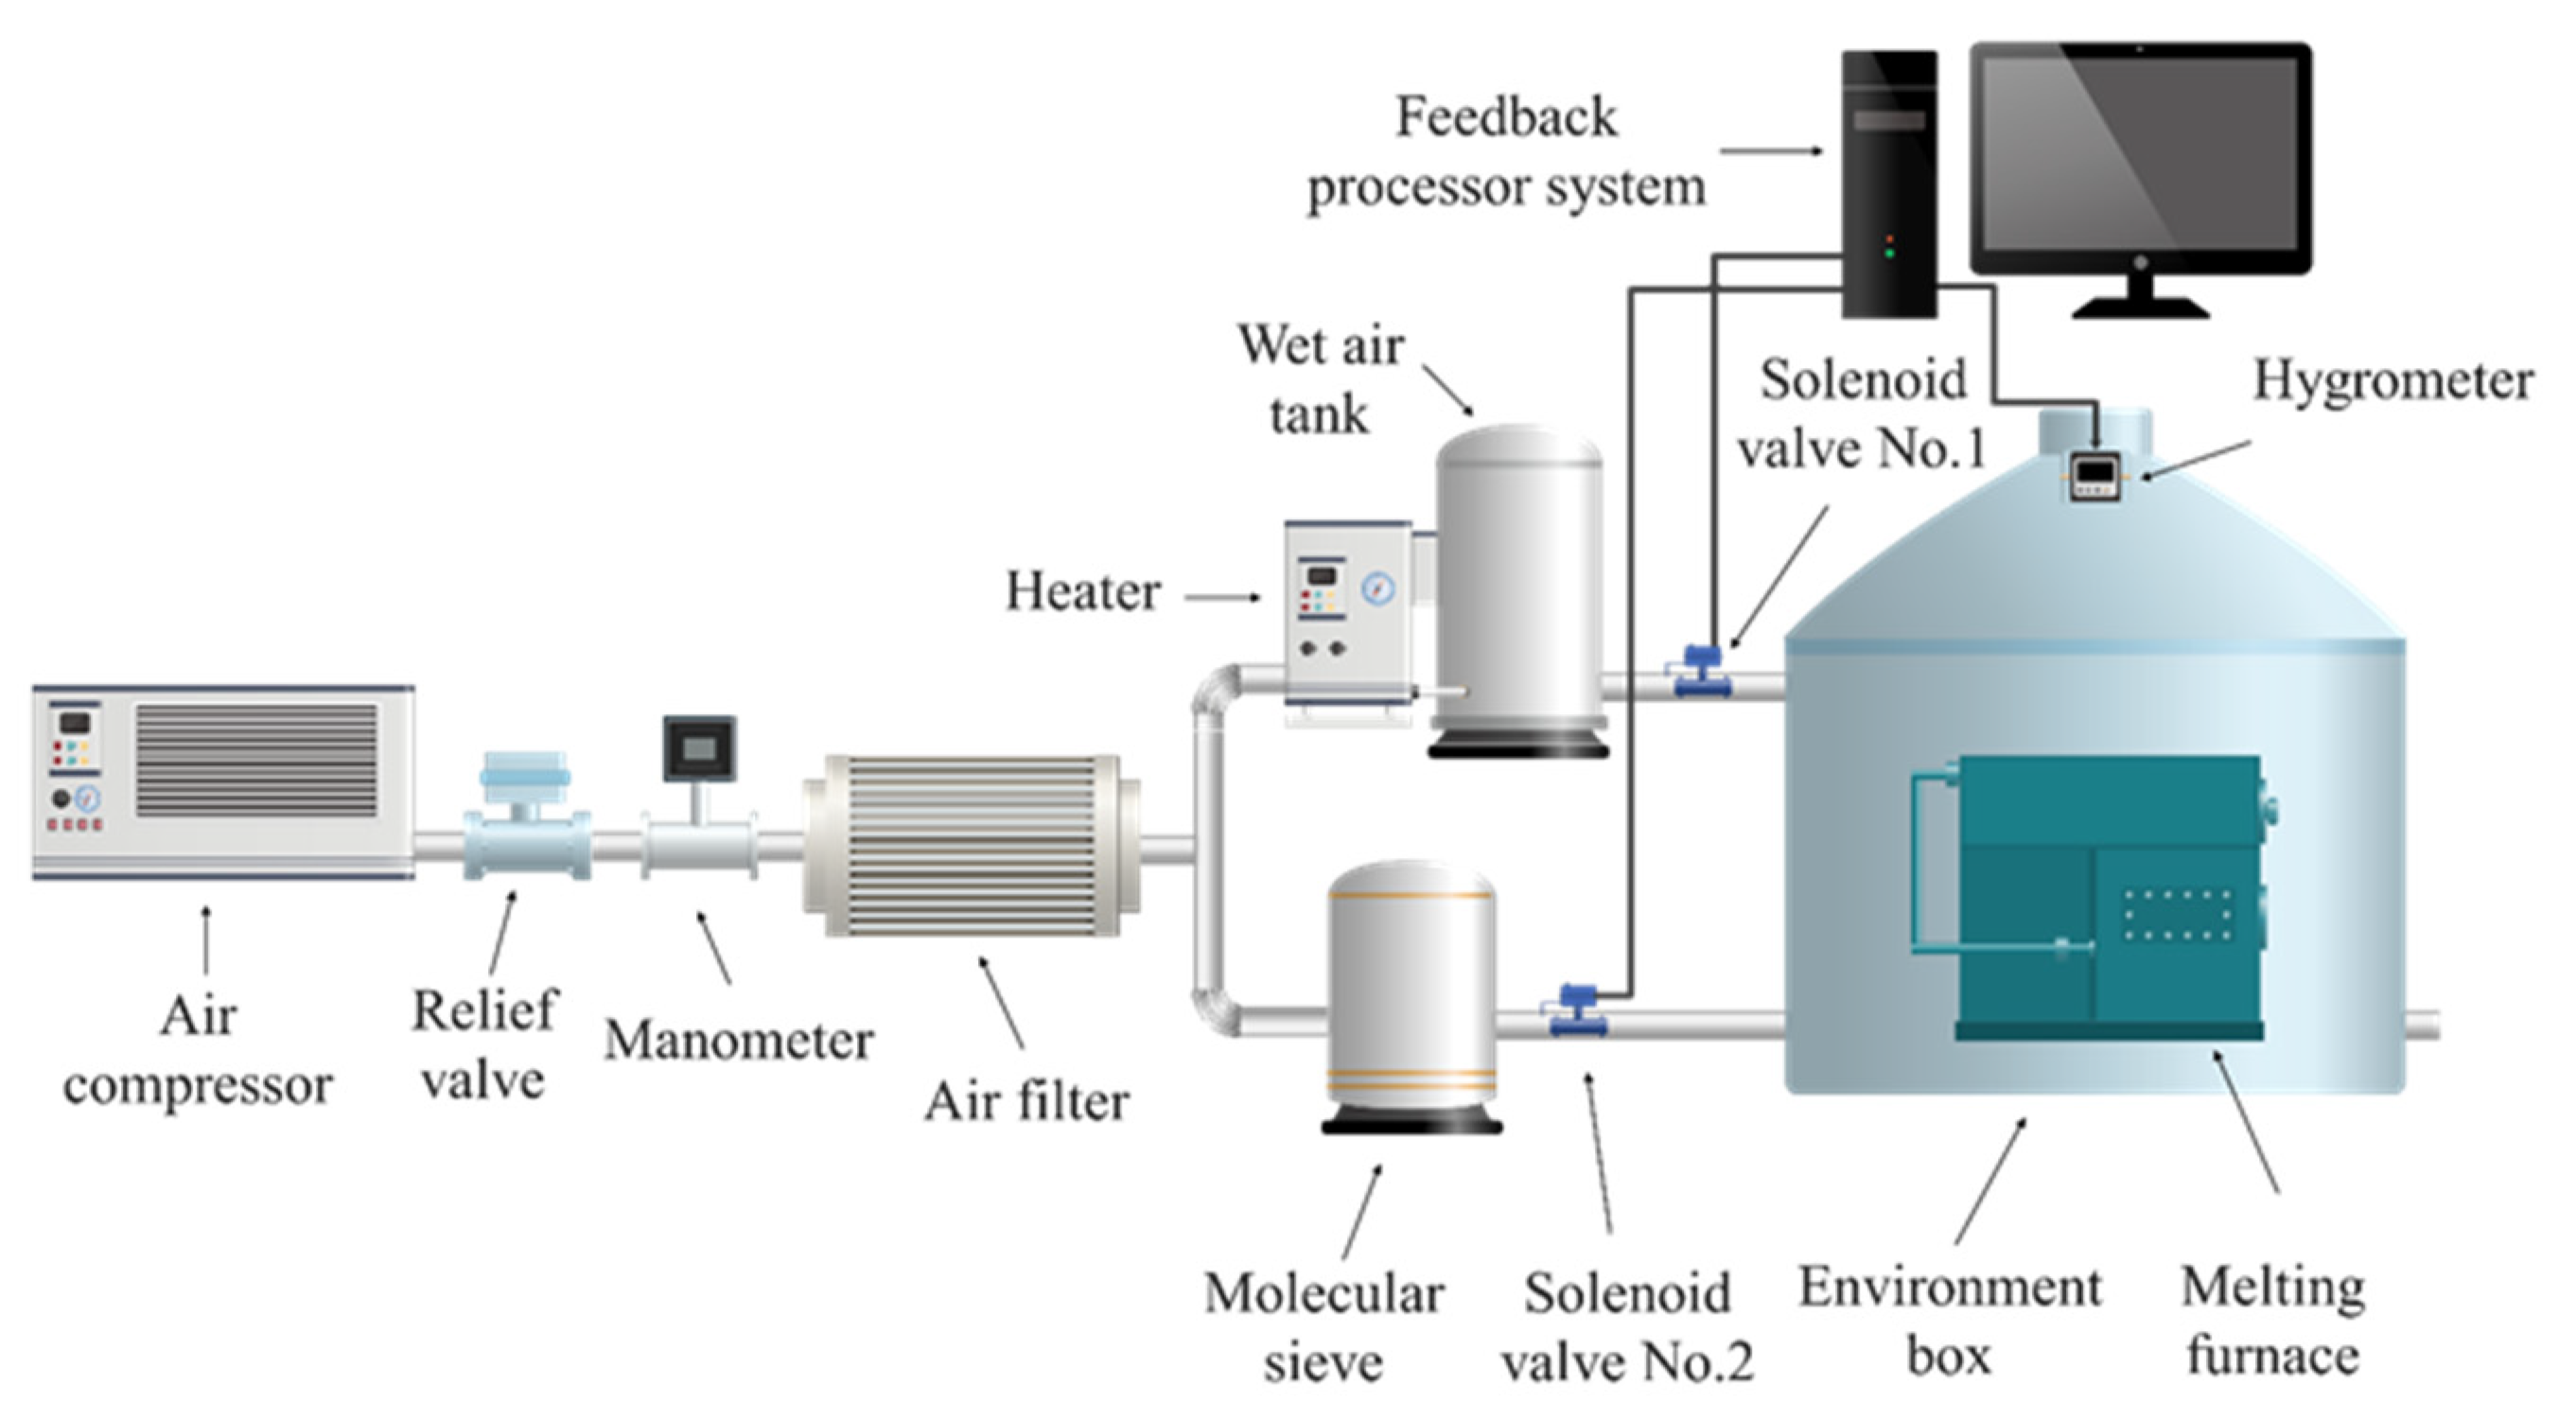
2. Materials and Methods

The composition of the AA6111 alloy used in the experiment is shown in Table 1. The aluminum alloy surface was sandblasted, and then was cleaned with ultrasonic for 10 min to avoid the influence of various oil stains and impurities on the alloy surface. The standard burden of 1.5 kg of AA6111 alloy was melted in the melting furnace. The relative humidity of the melting environment of the AA6111 alloy was set as 30%, 50%, and 80%. The heat preservation temperature also had three levels: 973 K, 1023 K and 1073 K. The hydrogen content data of 9 real-time melting processes were recorded in each experiment and the hydrogen content was measured every 20 min, according to the experimental arrangement in Table 2.
The in-situ observation was performed by High-Temperature Laser-Scanning Confocal Microscopy (HTLSCM, VL2000DX-SVF17SP, Yonekura, Yokohama, Japan). After grinding and polishing, the in-situ sample was placed in the heating container table of HTLSCM. The structural change in the AA6111 oxide film from room temperature to 1173 K was observed; the heating rate was 120 K/min and kept for 2 min at each temperature. During the heating process, an image of the macro-structure of the oxide film was saved every second and then all of the images were merged into a video at the end of the observation.
The purpose of using the ambient humidity-adjusting device, shown in Figure 1, is as follows. The function of the device is adjusting the relative humidity above the aluminum melt and to simulate the hydrogen absorption behavior of the AA6111 alloy under different melting conditions. The process of adjusting the melting environment during the experiment is as follows: the air compressor produces a continuous air supply, which is decompressed by the relief valve and which enters into an air filter to be filtered of the impurities in the air. The filtered air enters two channels for humidification and drying. The heater in the humidification channel can continuously produce wet air saturated with water vapor since a certain amount of water is loaded at the bottom of the wet air tank. There is a molecular sieve in the drying channel, and its function is to fully absorb the moisture in the air and produce enough dry air. The solenoid valve No.1 is adjusted by the feedback processor system to make more wet air enter the melting environment and make excess wet air be automatically expelled when the air humidity of the melting environment is higher than the specified humidity. The solenoid valve No.2 is adjusted by the feedback processing system to make the dry air enter the melting environment and the excess dry air be discharged automatically when the air humidity in the melting environment is lower than the specified humidity. The mutual adjustment of humidification and drying channels ensures that the necessary experimental conditions can be obtained in the melting environment regulation system.
The Hyscan Analyzer II hydrogen meter was used to determine the hydrogen content in the aluminum melt, and the principal schematic is shown in Figure 2. The determination of the hydrogen contents was carried out based on the Reduced Pressure Technique (RPT). The unit of hydrogen content measured by the system was mL/100 gAl and the accuracy was 0.01 mL/100 gAl. The apparatus used for the experiment is shown in Table 3.

3. Results and Discussion

3.1. Analysis of Experimental Results

3.1.1. Effect of Melting Environment on the Hydrogen Absorption Process

The hydrogen content data of the AA6111 aluminum alloy melts, measured by Hyscan II hydrogen meter under different melting conditions, are drawn as the hydrogen absorption curve, as shown in Figure 3 and Figure 4.
Figure 3 shows the change in the hydrogen content in the AA6111 alloy melt at different relative humidity with the same temperature. The hydrogen absorption process of the AA6111 alloy melt can be divided into two stages: the dynamic stage and steady stage. The hydrogen content of the aluminum melt shows a flat growth platform at the dynamic stage. When the aluminum melt is in contact with the atmosphere, the oxide film on the surface of the melt reacts with water vapor, resulting in a high partial pressure of hydrogen above the aluminum melts [23], which provides a great driving force for the dissolution of hydrogen into the aluminum alloy melt. A part of the oxide film is formed on the surface of the aluminum melt with further hydrogen absorption; this plays a protective role [24] and delays the further oxidation of the aluminum melt. It results in a decrease in the driving force of the hydrogen absorption and a gradual decrease in the hydrogen absorption rate. When the hydrogen content is close to its saturated solubility under this condition, the hydrogen absorption of the aluminum melt enters the equilibrium state, and the hydrogen absorption reaches saturation; this is called the steady state. The hydrogen absorption rate of the aluminum melt is proportional to the melting temperature, and the time of the hydrogen absorption process to reach a steady state is shortened [25].
The migration behavior of hydrogen in the aluminum melt is strictly a comprehensive kinetic process of absorbing and exhaling hydrogen in real-time. The hydrogen absorbing rate is higher than the hydrogen exhaling rate in the dynamic stages, and the hydrogen content increases. Meanwhile, the hydrogen exhalation gradually reaches equilibrium with the hydrogen absorption, and the hydrogen content maintains a relatively stable level when the melt is standing for a long time. The temperature of the aluminum melt should be reduced as much as possible to avoid excessive hydrogen absorption under the premise of not affecting the actual aluminum alloy pouring.
Figure 4 shows the change in hydrogen content in the melt at the different temperatures with the same relative humidity. The range in the hydrogen absorption curve of the aluminum melt at 1073 K is smaller than that at 973 K and 1023 K. When the initial hydrogen content is relatively high, then the time for the aluminum melt to reach the steady state is relatively short. This might be due to some changes in the structure of the aluminum melt, which results in the change in hydrogen migration behavior in the melt. The hydrogen content that is kept at a high level forms a high concentration gradient on the surface of aluminum melt, and the hydrogen absorption rate of the aluminum melt is accelerated. Liu [26,27] calculated the structural properties and viscosity of pure aluminum by molecular dynamics simulation. The hydrogen content in aluminum melts becomes abnormal near the temperatures of 1053 K to 1153 K, and, correspondingly, the change in the viscosity of aluminum melts occurs from 1003 K to 1143 K. When the temperature increases, the arrangement of the internal atoms in the aluminum melt tends to discrete, yet the melt structural abruption appears around 1053 K and 1173 K. The interactions between the internal atomic motion and the atomic potential causes the alteration in the melt structure. The hydrogen content at 1073 K is different to that at 973 K and 1023 K, which should be relative to the sudden change in the hydrogen absorption of the aluminum melt by the change in the melt structure.

3.1.2. Effect of Structural Change in Oxide Film on Hydrogen Absorption during the Heating Process

Through the above research, it was found that the hydrogen content of the AA6111 alloy melt is kept at a high level in different melting environments. This may be because the structure of the oxide film on the melt surface at different temperatures affects the hydrogen absorption process of the melt. The in-situ observation of the structure changes in the oxide film during the heating of the AA6111 alloy was performed by HTLSCM.
The oxide film formed on the surface of the solid aluminum at room temperature is amorphous and dense [28], as shown in Figure 5a. Accompanied by the increase in the temperature to approximately 773 K, the pores in the oxide film on the surface of the sample begin to appear, in Figure 5b. When the temperature reaches 833 K, the sample begins to melt and the oxide film expands and becomes smooth, as shown in Figure 5c. The increase in the number of pores is attributed to the precipitation of the dissolved hydrogen in the surrounding melt into the internal atmosphere, which results in the defect during heating [29]. In Figure 5d, the pore of the sample itself disappears and gradually condenses into a large pore on the surface when the temperature range is between 833 K and 930 K. The white spots appear where the pore disappears after 930 K, and the new pore begins to form along the crystal boundary. With the extension of residence time, the surface of the aluminum melt folds over on itself, and the relative surface oxide film, comes into contact with each other, which may form a double oxide film defect and capture a large amount of gas [30]. The smooth surface of the melt with double oxide film defects becomes a hydrogen absorption carrier, and is distributed on the surface of the aluminum melt, shown in Figure 5e and Figure 5f, respectively.
Figure 6 shows the in-situ real-time observation of the oxide film folding over on itself on the surface of the AA6111 aluminum alloy melt from 973 K to 1173 K. The α-Al2O3 inclusion, formed at the temperature below 873 K, is almost inert to hydrogen and water vapor and has a protective effect on the aluminum melt. In the process of heating, γ-Al2O3 and χ-Al2O3, transformed by isomerization, are active to hydrogen and water vapor, and have strong adsorption capacity; it is strongest at 873 K to 973 K [31]. The contact area between the oxide film and the water vapor is increased, and the hydrogen in the aluminum melt is adsorbed through the surface or the crack in the oxide inclusion with the increase in temperature. In this way, the oxide inclusion on the surface of the melt becomes the carrier to absorb hydrogen, and the hydrogen content in the aluminum melt increases with the increase in the oxide inclusions in the aluminum melt [32]. Moreover, there is an adsorption force field around the oxide inclusion, and the direction of its adsorption force on hydrogen in the aluminum melt is opposite to the direction of degassing [33,34]. It will further reduce the diffusion and transfer rate of hydrogen, prevent the degassing of the aluminum melt, and make degassing difficult when there are enough oxide inclusions and the adsorption force fields are close to each other. When there is a large number of oxide inclusions in the aluminum melt, it not only increases the hydrogen content of the aluminum melt, but also provides a nucleation interface for the pore and promotes the formation of the pore [35].
Figure 7 shows the three-dimensional surface morphology of the cooled sample of the AA6111 alloy. Dendritic growth and dendrite precipitation were observed on the surface. The sensitivity of hydrogen precipitation to solidification conditions increases in the case of a higher hydrogen content [36]. The distribution of oxide inclusion in the sample will also affect the solidification process and then affect the hydrogen precipitation. At this time, the surface morphology of the sample is irregular, which is similar to the seaweed-like pattern [37]. This might be due to the grain boundary destruction during heating and the volume shrinks during cooling (see Figure 5c). These destroyed grain boundaries become hydrogen absorption channels for aluminum melts during the heating process. At high temperatures, the dense layer on the inner surface of the oxide film is destroyed along the grain boundary and then the hydrogen absorption of aluminum melt is intensified.

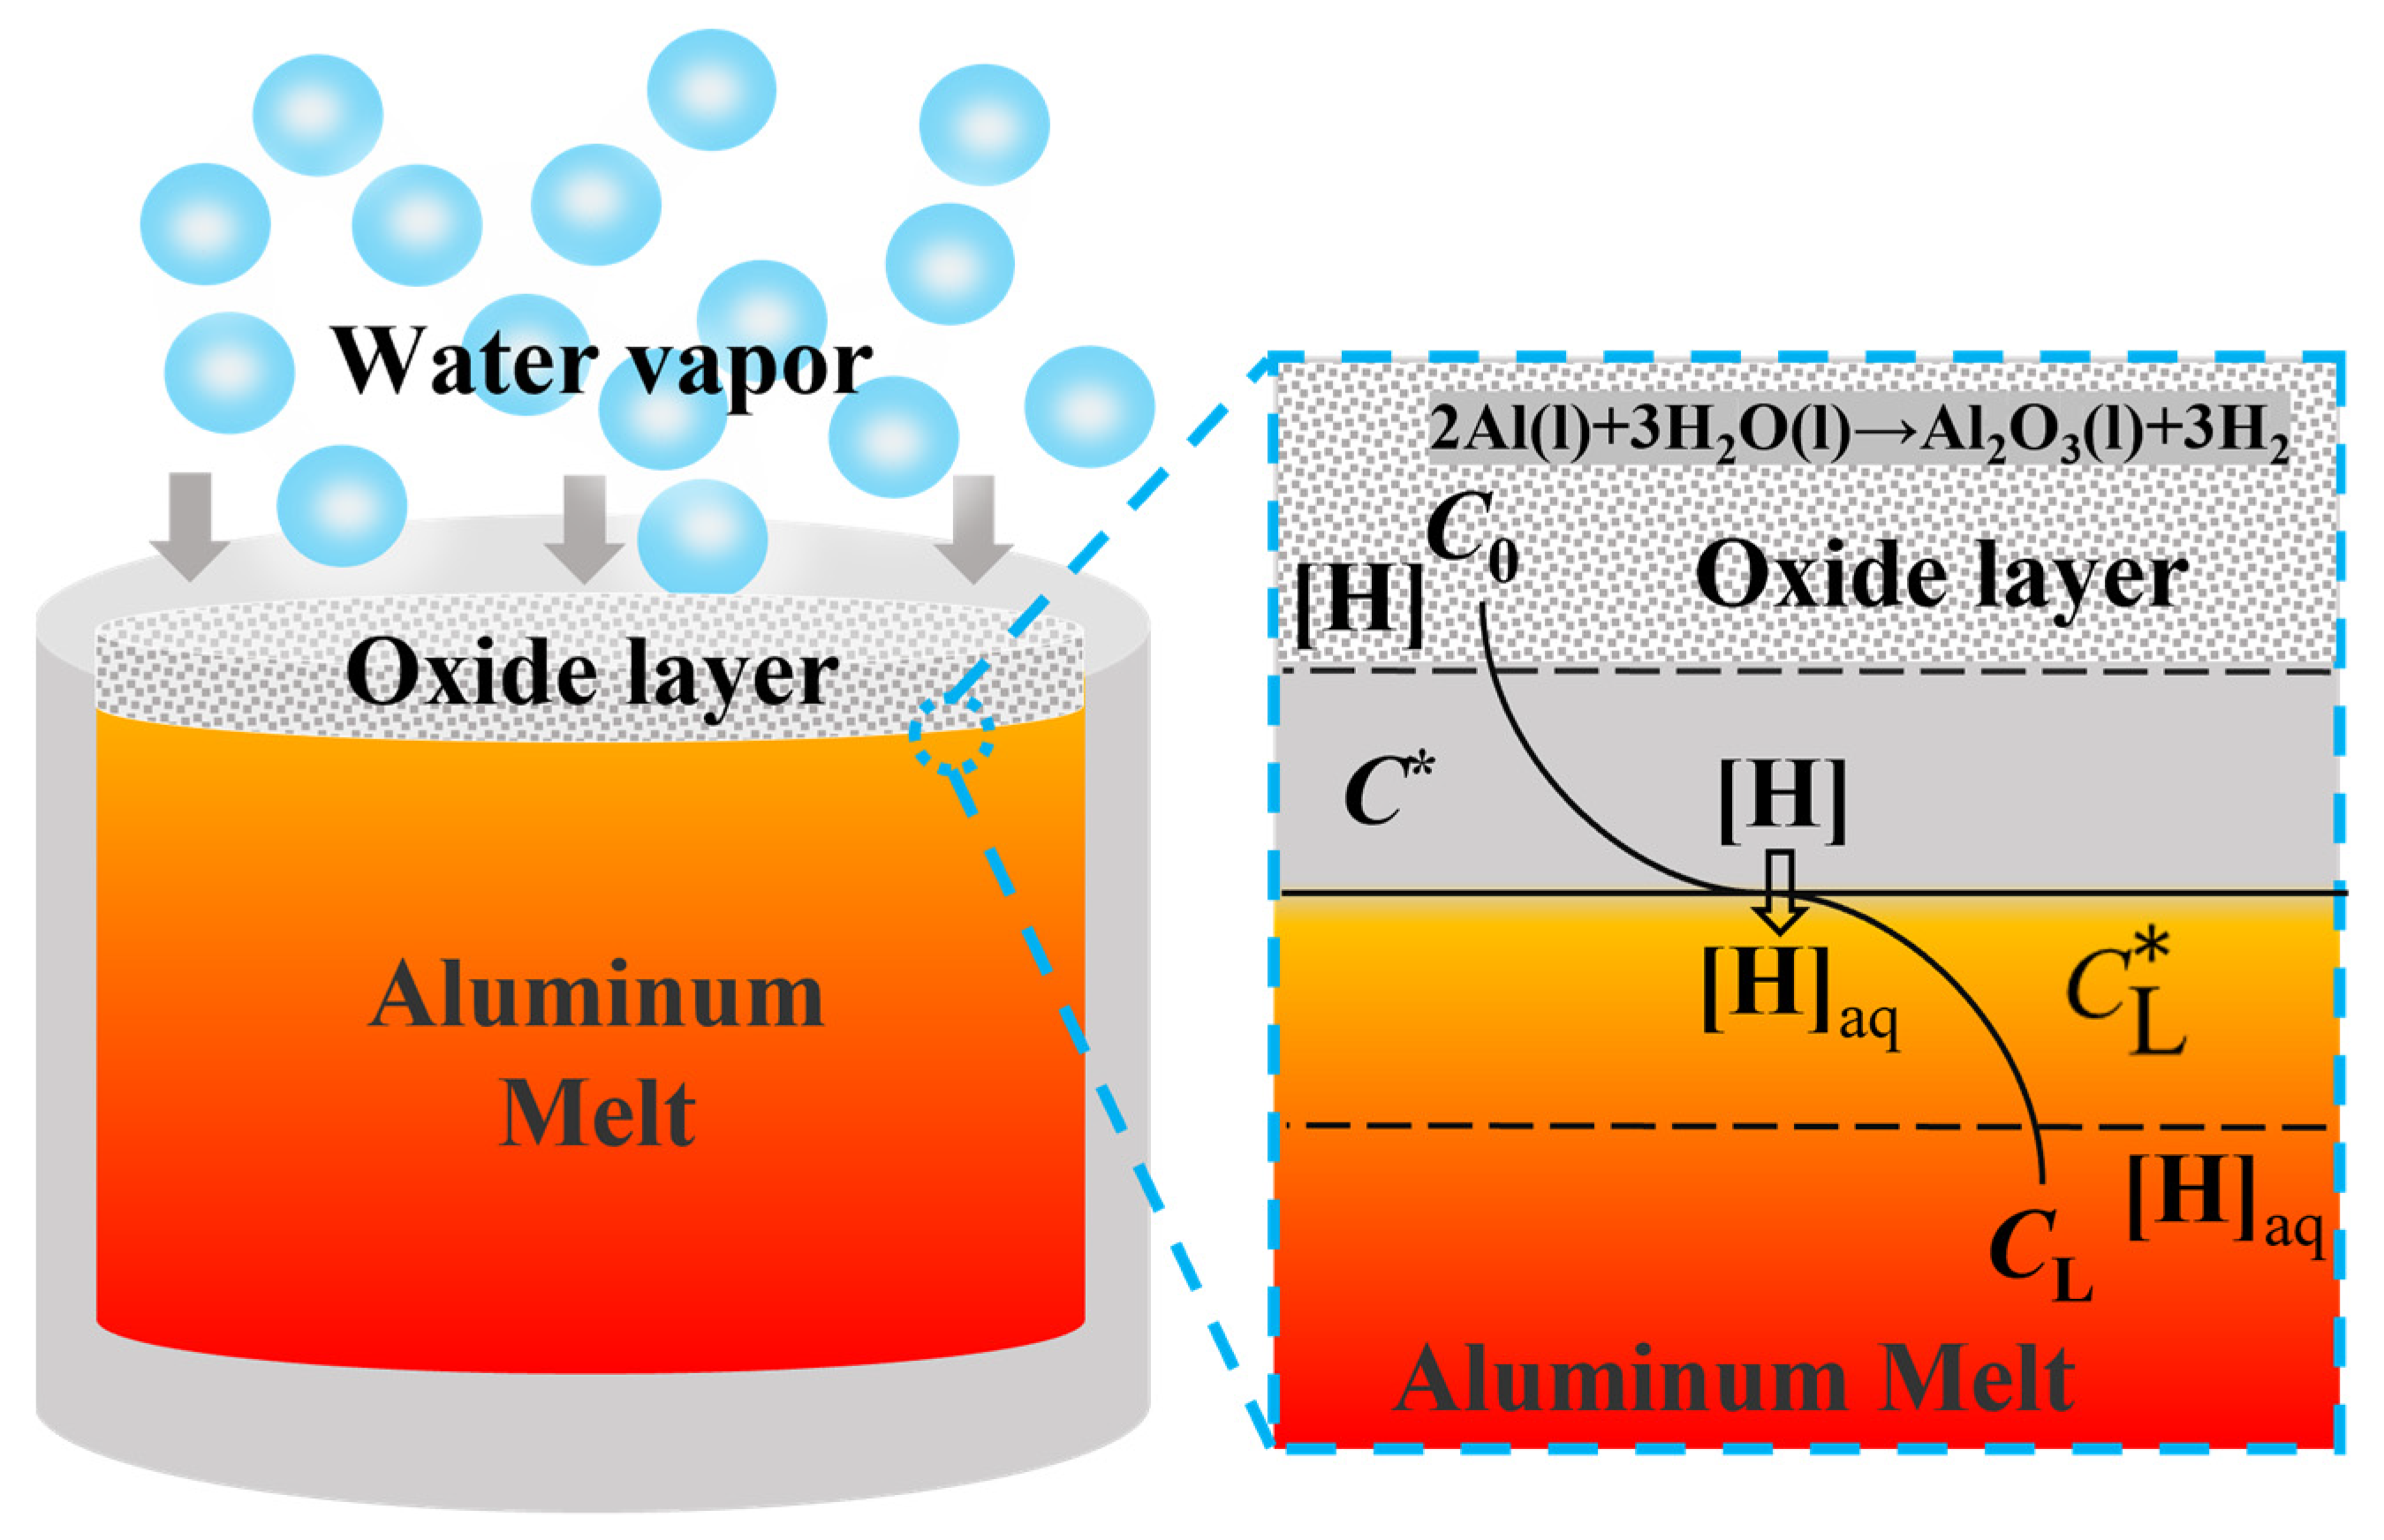
3.2. Modeling of the Hydrogen Absorption Process in Aluminum Melt

The hydrogen absorption process of the aluminum melt can be described in the following four steps [13], as shown in Figure 8:
(1) At first, the porosity oxide layer reacts with the water vapor in the melting environment to produce a large amount of hydrogen:
2Al(l) + 3H2O(g)→Al2O3(γ) + 3H2
(2) The [H] formed by the reaction diffuses to the gas-liquid interface through the gas film boundary layer:
H2→2[H]
(3) [H] chemical reaction occurs at the gas-liquid interface and the [H](aq) formed by the chemical reaction is dissolved into the melt through the diffusion of the liquid film boundary layer:
[H]→[H](aq)
where [H] is the atomic state of hydrogen, and [H](aq) is dissolved hydrogen in aluminum melts.
Given the concentration of atomic hydrogen at the gas-liquid interface C * and the concentration of dissolved hydrogen C L , the dissolution process of hydrogen in the aluminum melt is the limiting link during the whole hydrogen absorption process [14]. The rate of dissolution to form dissolved hydrogen is called the hydrogen absorption rate of melt, which can be expressed as [21]
ν = d C L d t = k 1 ( C * C L )
where ν is the hydrogen absorption rate of the melt, C L is the concentration of the dissolved hydrogen in the melt, C * is the hydrogen concentration at the gas–liquid interface, k 1 is the mass transfer coefficient, and t is the time of dissolution of the hydrogen atom in the aluminum melt.
The special solution of Equation (4) is obtained from the initial conditions: t 0, C L C 0 :
C L = C * ( C * C 0 ) e k 1 t
where C 0 is the initial hydrogen content in melt.
Equation (5) is derived from the assumption that the hydrogen concentration C * at the interface between the melt and the atmosphere remains unchanged. Equation (6) shows that, in practical application, the concentration of hydrogen atoms at the gas–liquid interface varies in real time under the influence of external factors:
C * =   C 0 * + C
where C 0 * is the initial hydrogen concentration at the gas–liquid interface and C is the change in hydrogen concentration at the gas–liquid interface.
The concentration of atomic hydrogen at the gas–liquid interface is affected by the structure of the surface oxide layer of the aluminum melt. A new hydrogen concentration is generated by other means and then C is positive when the hydrogen concentration at the gas–liquid interface increases. When C is negative as the hydrogen concentration at the gas–liquid interface decreases, the hydrogen concentration depletes through other insoluble means. The concentration of hydrogen consumed or produced can be derived from a first-order rate equation [38]:
C = α ( 1 e k 2 t )
where α , k 2 is constant. The physical meaning of k 2 is the reaction coefficient of hydrogen molecules at the gas–liquid interface when aluminum melts react with water vapor in the air.
The two situations will be discussed as follows:
(1) C * decreases with time. The adsorption of water vapor at the interface of the aluminum melt increases the hydrogen content. As the oxide film structure changes, the oxide film absorbs part of the water vapor and reduces the partial pressure of the water vapor on the melt surface, that is, the partial pressure of the hydrogen on the melt surface and the hydrogen concentration on the gas–liquid surface [39]. The change in the hydrogen content in the melt can be formed by the equation below:
C * = C 0 * α ( 1 e k 2 t )
Substituting Equation (8) into Equation (3), the equation below is obtained:
d C L d t = k 1 ( C 0   α + α e k 2 t ) k 1 C L
Because the hydrogen in the aluminum melt decreases over time. It is concluded that C L has a maximum from Equation (8). t m can be established from the following Equation (10):
t m = 1 k 2 ln ( α C m C )
where t m is the time when the melt reaches the maximum hydrogen concentration in the melt.
From the initial conditions: t = 0, C L C 0 . Assuming d C L / d t = 0 , the solution of Equation (9) can be obtained:
C L = C + k 1 α k 1 k 2 e k 2 t + ( C 0 C k 1 α k 1 k 2 ) e k 1 t
Bringing Equation (10) into Equation (11), the expression for α is obtained:
α = C 0 C ( C m C ) e k 1 t m + C 0 C k 1 t m ln ( α C m C )
where C is the hydrogen concentration of the final melt.
(2) C * increases with time. When the concentration of the water vapor absorbed on the interface increases with the change in the oxide film structure, the partial pressure of hydrogen on the melt surface increases. Similar to the derivation process of Equation (8), Equation (13) is obtained:
C * = C 0 * + α ( 1 e k 2 t )
Substituting Equation (4) into Equation (9):
d C L d t = k 1 ( C 0 + α α e k 2 t ) k 1 C L
The melting time is limited in our actual melting process and the melt hydrogen content reaches a dynamic balance before the maximum melting time. Assuming that the maximum melting time in the actual melting process is t m and the final hydrogen content of the melt is C , at which time C = C m .
Make d C L / d t = 0 :
t m = 1 k 2 ln ( α C 0 + α C m )
Suppose that the initial condition is t = 0, C L C 0 :
C L = C m k 1 α k 1 k 2 e k 2 t + ( C 0 C m + k 1 α k 1 k 2 ) e k 1 t
So,
α = C m C 0 + ( C 0 C m ) e k 1 t m 1 e k 1 t m ( 1 ln α C 0 + α C m k 1 t m )

3.3. Calculation Result and Discussion

The situation discussed in this paper is the hydrogen absorption process of the aluminum melt under the condition of maintaining the partial pressure of water vapor in the melting environment. Equation (16) is adopted as the calculation model and the measured hydrogen content data in Figure 3 are taken as the basis. Because of the change in the melt structure factor at 1073 K, only the hydrogen content data at 973 K and 1023 K were obtained and compared with the calculation results of the mathematical model.
The initial hydrogen content and final hydrogen content of the aluminum melt at the time of t are obtained from the experimental measurement and then the ratio of ln C m / C 0 to t is calculated. Finally, the points in the diagram are connected to obtain a straight line and the mass transfer coefficient k 1 can be calculated from the slope ratio of the straight line. Bring k 1 into Equation (17) to obtain the value of α , and use the value of α in Equation (15) to obtain the value of k 2 .The data relating to the hydrogen content and the parameters of the aluminum melt are shown in Table 4. The kinetic equations of the hydrogen absorption of the AA6111 alloy melt at several relative humidity and melting temperatures are obtained after using the parameters of Table 4 in Equation (16), as shown in Table 5.
It can be seen from Figure 9 that the experimental data are basically consistent with the calculated results of the hydrogen absorption kinetic model. However, as shown in Figure 9a–c, when the melting temperature is 973 K, the fitting curve of the calculated results is below the fitting curve of the experimental data, but the changing trend in the curve is consistent. The low hydrogen partial pressure in the low-humidity environment leads to the decrease in hydrogen activity in aluminum, which shows that the fitted experimental data is higher than the model calculation results. The coincidence degree of the calculated results and the fitted curve from the experimental data is higher when the melting temperature is 1023 K, and the changing trend is basically the same. This is because the sensitivity of hydrogen to melting will increase at high temperatures. In addition, the high temperature field around the melting furnace in the actual producing process reduces the effect of the high relative humidity on the hydrogen absorption of the aluminum melt. The fitting curve of the experimental data is in good agreement with the fitting curve of the calculated results. Thus, the mathematical model obtained in this study can meet the needs of the actual production process.

4. Conclusions

In this study, the hydrogen absorption process and its influencing factors on the aluminum alloy melt under different melting conditions were studied in detail. The effect of the structural change in the oxide film on the surface of the aluminum melt on the process of hydrogen absorption was observed in-situ by HTLSCM. The main conclusions are as follows:
(1) The aluminum melt absorbs hydrogen in two stages. In the initial stage, the rate of the hydrogen increase is flat. At the steady state stage, the melt hydrogen absorption and exhalation reach equilibrium and the hydrogen content remains basically constant.
(2) As the relative humidity of the melting environment increases, the hydrogen content of the AA6111 alloy increases. The melt holding temperature increases during melting and the melt hydrogen absorption increases.
(3) With the increase in temperature, the oxide film on the surface of the melt will fold over on itself to form a double oxide film defect and become a hydrogen absorption carrier; the hydrogen content of the melt increases.
(4) The kinetic model for hydrogen absorption of the AA6111 alloy melt is obtained and the expressions of kinetic models in many cases are calculated. The actual measured fitting data are basically consistent with the data of the established hydrogen absorption kinetic model with time.

Author Contributions

Conceptualization, B.Y. and Z.X.; validation, Z.X. and B.Y.; formal analysis, B.Y.; investigation, B.Y., W.L., G.Z. (Guoqing Zhang), Y.T., X.W. and J.H.; resources, Z.X.; data curation, B.Y.; writing—original draft preparation, B.Y.; writing—review and editing, B.Y. and Z.X.; funding acquisition, Z.X., H.T., J.W., G.Z. (Guoliang Zhu) and M.C. All authors have read and agreed to the published version of the manuscript.

Funding

This research was funded by National Natural Science Foundation of China-Guangxi Joint Fund, grant number No. U20A20276; National Natural Science Foundation of China, grant number No. 51961008; Guangxi Natural Science Foundation, grant number No. 2020GXNSFAA297269.

Institutional Review Board Statement

Not applicable.

Informed Consent Statement

Not applicable.

Data Availability Statement

Data supporting reported results can be found in this study.

Acknowledgments

The authors are grateful to our group members Zhichao Tang and Yifan Zhang for the analysis and discussion of the mathematical model.

Conflicts of Interest

The authors declare no conflict of interest.

References

  1. Jakse, N.; Pasturel, A. Ab initio based understanding of diffusion mechanisms of hydrogen in liquid aluminum. Appl. Phys. Lett. 2014, 104, 3377. [Google Scholar] [CrossRef]
  2. Sergey, V.B.; Vladimir, N.B.; Ivan, Y.G.; Boris, P.K.; Natalia, P.K. Saturation dynamics of aluminum alloys with hydrogen. ARPN J. Eng. Appl. Sci. 2017, 12, 6243–6247. [Google Scholar]
  3. Yu, M.Z.; Cui, J.; Tang, Z.C.; Shen, Z.N.; Chen, X.Y.; Xu, Z.B.; Zeng, J.M. Effect of Er-Rich Precipitates on Microstructure and Electrochemical Behavior of the Al-5Zn-0.03In Alloy. Metals 2022, 12, 131. [Google Scholar] [CrossRef]
  4. Cui, J.; Tang, Z.C.; Yu, M.Z.; Hu, J.J.; Chen, X.Y.; Xu, Z.B.; Zeng, J.M. Effect of Heat Treatment on Microstructural Evolution and Microhardness Change of Al-5Zn-0.03In-1Er Alloy. Metals 2022, 12, 370. [Google Scholar] [CrossRef]
  5. Tang, Z.C.; Cui, J.; Yu, M.Z.; Zhu, W.Q.; Xu, Z.B.; Zeng, J.M.; Xu, T.; Yang, H.D.; Tan, Y.P.; Yang, B. A new insight on the diffusion growth mechanism of intermetallic compounds in Al-Er system. Mater. Des. 2022, 224, 111341. [Google Scholar] [CrossRef]
  6. Voigt, C.; Ditscherlein, L.; Werzner, E.; Zienert, T.; Nowak, R.; Peuker, U.; Sobczak, N.; Aneziris, C. Wettability of AlSi7Mg alloy on alumina, spinel, mullite and rutile and its influence on the aluminum melt filtration efficiency. Mater. Des. 2018, 150, 75–85. [Google Scholar] [CrossRef]
  7. Wu, R.Z.; Sun, B.D.; Shu, D.; Li, F.; Chen, H.L.; Yan, L.L.; Wang, J. Degassing of Aluminum Melt. Mater. Sci. Technol. 2006, 14, 218–221. [Google Scholar] [CrossRef]
  8. Haghayeghi, R.; Bahai, H.; Kapranos, P. Effect of ultrasonic argon degassing on dissolved hydrogen in aluminium alloy. Mater. Lett. 2012, 82, 230–232. [Google Scholar] [CrossRef]
  9. Harvey, J.P.; Chartrand, P. Modeling the Hydrogen Solubility in Liquid Aluminum Alloys. Metall. Mater. Trans. B 2010, 41, 908–924. [Google Scholar] [CrossRef]
  10. Jiang, G.R.; Liu, Y.; Li, Y.X.; Su, Y.Q.; Guo, J.J. A Model for Calculating Solubility of Hydrogen in Molten Aluminum Alloys. Acta Metall. Sin. 2008, 44, 129–133. [Google Scholar]
  11. Zhang, H.W.; Li, Y.X.; Liu, Y. Hydrogen Solubility in Pure Metals for Gasar Process. Acta Metall. Sin. 2007, 43, 113–118. [Google Scholar]
  12. Anyalebechi, P.N. Hydrogen Solubility in Liquid and Solid Pure Aluminum—Critical Review of Measurement Methodologies and Reported Values. Mater. Sci. Appl. 2022, 13, 158–212. [Google Scholar] [CrossRef]
  13. Anyalebechi, P.N. Analysis of the effects of alloying elements on hydrogen solubility in liquid aluminum alloys. Scr. Metall. Et Mater. 1995, 33, 1209–1216. [Google Scholar] [CrossRef]
  14. Sigworth, G.K.; Engh, T.A. Chemical and kinetic factors related to hydrogen removal from aluminum. Metall. Trans. B 1982, 13, 447–460. [Google Scholar] [CrossRef]
  15. Jang, H.S.; Kang, H.J.; Yoon, P.; Lee, G.; Shin, S. Effects of Mg Content on Hydrogen Content and Melt Quality of Al-Mg Alloys. Met.—Open Access Metall. J. 2019, 9, 1235. [Google Scholar] [CrossRef] [Green Version]
  16. Muhammet, U.; Remzi, e.; Derya, D.; Murat, T. Characterization of the Effect of Melt Treatments on Melt Quality in Al-7wt %Si-Mg Alloys. Met.—Open Access Metall. J. 2017, 7, 157. [Google Scholar] [CrossRef] [Green Version]
  17. Zhang, L.; Lv, X.; Torgerson, A.T.; Long, M. Removal of Impurity Elements from Molten Aluminum: A Review. Miner. Process. Extr. Metall. Rev. 2011, 32, 150–228. [Google Scholar] [CrossRef]
  18. Kim, M.J.; Yun, J.P.; Yang, J.; Choi, S.J.; Kim, D.E. Prediction of the Temperature of Liquid Aluminum and the Dissolved Hydrogen Content in Liquid Aluminum with a Machine Learning Approach. Met.—Open Access Metall. J. 2020, 10, 330. [Google Scholar] [CrossRef] [Green Version]
  19. Zeng, J.; Ping, G.; Wang, Y. Investigation of Inner Vacuum Sucking method for degassing of molten aluminum. Mater. Sci. Eng. B 2012, 177, 1717–1720. [Google Scholar] [CrossRef]
  20. Sun, Y.Z.; Li, S.C.; Zhang, G.Q.; Qiu, H.X.; Yu, C.; Zhang, G.W. Research on Absorbing Hydrogen Special Property of Liquid State ZL101 Aluminium Alloys. Acta Met. Sin. 1999, 9, 939–941. [Google Scholar]
  21. Guo, Y.J. Effect of Casting Temperature on Hydrogen Content in Aluminum Alloy. Alum. Fabr. 2008, 1, 39–40. [Google Scholar]
  22. Tiryakiolu, M. On estimating the hydrogen solubility in solid aluminium alloys and the hydrogen solubility difference between the liquidus and solidus temperatures. Int. J. Cast Met. Res. 2021, 34, 83–87. [Google Scholar] [CrossRef]
  23. Li, P.J.; Zeng, D.B.; Jia, J. Kinetics of absorbing hydrogen of Al melt. Trans. Nonferrous Met. Soc. China 2000, 10, 261–263. [Google Scholar]
  24. Fu, G.S.; Kang, J.X. Interactive Mechanism Between Inclusions and Hydrogen in Molten Aluminum. Chin. J. Nonferrous Met. 1999, 1, 51–56. [Google Scholar] [CrossRef]
  25. Zhou, D.S.; Long, W.; Xu, C.J.; Zhang, H.H. Hydrogen Separation Behavior of A356 Aluminum Alloy During Solidification. Heat Treat. 2013, 28, 33–36. [Google Scholar]
  26. Liu, Y.; Dai, Y.; Wang, J.; Shu, D.; Sun, B. Structure of Liquid Aluminum and Hydrogen Absorption. J. Wuhan Univ. Technol.—Mater. Sci. Ed. 2011, 26, 93–97. [Google Scholar] [CrossRef]
  27. Liu, Y.; Dai, Y.B.; Wang, J.; Shu, D.; Sun, B.D. Hydrogen Diffusion in Aluminum Melts: An ab initio Molecular Dynamics Study. J. Wuhan Univ. Technol.—Mater. Sci. Ed. 2012, 27, 560–567. [Google Scholar] [CrossRef]
  28. Fox, S.; Campbell, J. Visualisation of oxide film defects during solidification of aluminium alloys. Scr. Mater. 2000, 43, 881–886. [Google Scholar] [CrossRef]
  29. Raiszadeh, R.; Griffiths, W.D. The Effect of Holding Liquid Aluminum Alloys on Oxide Film Content. Metall. Mater. Trans. B 2011, 42, 133–143. [Google Scholar] [CrossRef]
  30. Raiszadeh, R.; Griffiths, W.D. A Semi-empirical Mathematical Model to Estimate the Duration of the Atmosphere within a Double Oxide Film Defect in Pure Aluminum Alloy. Metall. Mater. Trans. B 2008, 39, 298–303. [Google Scholar] [CrossRef]
  31. Scherf, A.; Janda, D.; Baghaie Yazdi, M.; Li, X.; Stein, F.; Heilmaier, M. Oxidation Behavior of Binary Aluminium-Rich Fe–Al Alloys with a Fine-Scaled, Lamellar Microstructure. Oxid. Met. 2015, 83, 559–574. [Google Scholar] [CrossRef]
  32. Shmelev, V.; Yang, H.; Yim, C. Hydrogen Generation by Reaction of Molten Aluminum with Water Steam. Int. J. Hydrogen Energy 2016, 41, 14562–14572. [Google Scholar] [CrossRef]
  33. Gyarmati, G.; Fegyverneki, G.; Mende, T.; Tokár, M. Characterization of the Double Oxide Film Content of Liquid Aluminum Alloys by Computed Tomography. Mater. Charact. 2019, 157, 109925. [Google Scholar] [CrossRef]
  34. Griffiths, W.D.; Caden, A.J.; El-Sayed, M.A. An Investigation into Double Oxide Film Defects in Aluminium Alloys. Mater. Sci. Forum 2014, 783–786, 142–147. [Google Scholar] [CrossRef]
  35. Hart, R.K. The Oxidation of Aluminium in Dry and Humid Oxygen Atmospheres. Proc. R. Soc. Lond. 1956, 236, 68–88. [Google Scholar]
  36. Zhang, Q.Y.; Sun, D.K.; Zhang, S.H.; Wang, H.; Zhu, M.F. Modeling of microporosity formation and hydrogen concentration evolution during solidification of an Al-Si alloy. Chin. Phys. B 2020, 29, 078104. [Google Scholar] [CrossRef]
  37. Dong, Y.H.; Shuai, S.S.; Zheng, T.X.; Cao, J.W.; Chen, C.Y. In-Situ observation of solid-liquid interface transition during directional solidification of Al-Zn alloy via X-ray Imaging. J. Mater. Sci. Technol. 2020, 39, 113–123. [Google Scholar] [CrossRef]
  38. Moore, B. Basic Physical Chemistry, 3rd ed.; Prentice-Hall: New York, NY, USA, 1983; pp. 217–298. [Google Scholar]
  39. Yang, Q.Q.; Liu, Y.; Li, Y.X. Hydrogen diffusion coefficient in liquid metals evaluated by solid–gas eutectic unidirectional solidification. Trans. Nonferrous Met. Soc. China 2014, 24, 4030–4037. [Google Scholar] [CrossRef]
Figure 1. Schematic diagram of the humidity-adjusting device.
Metals 13 00236 g001
Figure 2. The principal schematic of Hyscan Analyzer II.
Metals 13 00236 g002
Figure 3. Variation in hydrogen content in AA6111 alloy melt at the same temperature and different humidity: (a) 973 K, (b) 1023 K, (c) 1073 K.
Metals 13 00236 g003
Figure 4. Variation in hydrogen content in AA6111 alloy melt at the same humidity and different temperature: (a) RH 30%, (b) RH 50%, (c) RH 80%.
Metals 13 00236 g004
Figure 5. In-situ real-time observation of structural changes in oxide film of AA6111 alloy melt from room temperature to 950 K: (a) Room temperature, (b) 773 K, (c) 833 K, (d) 875 K, (e) 930 K, (f) 950 K.
Metals 13 00236 g005
Figure 6. In-situ real-time observation of structural changes in oxide film of AA6111 alloy melt from 973 K to 1173 K: (a) 973 K, (b) 1023 K, (c) 1053 K, (d) 1073 K, (e) 1123 K, (f) 1173 K.
Metals 13 00236 g006
Figure 7. Three-dimensional surface morphology of AA6111 alloy: (a,b) ×500, (c,d) ×2000.
Metals 13 00236 g007
Figure 8. Schematic diagram of hydrogen absorption process of aluminum melt.
Metals 13 00236 g008
Figure 9. The comparison between the calculated results and the experimental data: (ac) 973 K, (df) 1023 K.
Metals 13 00236 g009
Table 1. The chemical composition of AA6111 alloys (mass fraction, wt.%).
ElementsSiMgCuFeMnZnTiCrAl
Composition0.850.730.580.380.250.130.080.07Bal.
Table 2. The experimental arrangement.
LotsHolding Temperature (K)Relative Humidity (%)
A197330
A250
A380
A4102330
A550
A680
A7107330
A850
A980
Table 3. The list of apparatus and equipment.
Equipment NameModelManufacturer
Precision electronic balanceAG285Mettler Toledo, Zurich, Switzerland
Melting furnaceK4/13Nabertherm, Lilienthal, Germany
Electro-thermostatic blast oven101-1-BSShanghai Furnace, Shanghai, China
Optical microscopeDMRELeica, Wetzler, Germany
Hydrogen analyzerHyscan IIMechaTech, Bristol, UK
The high-temperature laser scanning confocalVL2000DX-SVF18SPYonekura, Yokohama, Japan
Humidity adjusting device
Table 4. Measurement and calculation of the parameters for the solution of equations.
ParametersMeasured ParametersCalculated Parameters
Lots C 0 C ( m L / kg ) k 1   ( × 10 4 s 1 ) α k 2   ( × 10 4 s 1 )
A14.55.73.7541.0465.207
A25.06.13.8431.1058.179
A35.56.64.2491.2285.729
A44.85.94.1361.0265.568
A55.66.74.5611.0266.125
A66.48.04.8941.0196.637
Table 5. Kinetic equation of hydrogen absorption of AA6111 alloy melt under different conditions.
Temperature (K)Relative Humidity (%)Mathematical Model
97330 C L = 5.7 + 2.428 e 5.207 × 10 4 t 3.728 e 3.754 × 10 4 t
50 C L = 6.1 + 0.981 e 8.179 × 10 4 t 2.081 e 3.843 × 10 4 t
80 C L = 6.6 + 3.616 e 5.729 × 10 4 t 4.716 e 4.249 × 10 4 t
102330 C L = 5.9 + 2.691 e 5.568 × 10 4 t 3.991 e 4.136 × 10 4 t
50 C L = 6.7 + 2.608 e 6.125 × 10 4 t 4.008 e 4.561 × 10 4 t
80 C L = 8.0 + 2.257 e 6.637 × 10 4 t 3.857 e 4.894 × 10 4 t
Disclaimer/Publisher’s Note: The statements, opinions and data contained in all publications are solely those of the individual author(s) and contributor(s) and not of MDPI and/or the editor(s). MDPI and/or the editor(s) disclaim responsibility for any injury to people or property resulting from any ideas, methods, instructions or products referred to in the content.

