
Computational and Experimental Study on Failure Mechanism of a GTD-111 First-Stage Blade of an Industrial Gas Turbine

 ,
,  ,
,  and
and
Abstract
:1. Introduction
2. Materials and Methods
2.1. First-Stage Turbine Blade
2.2. Computational Methods
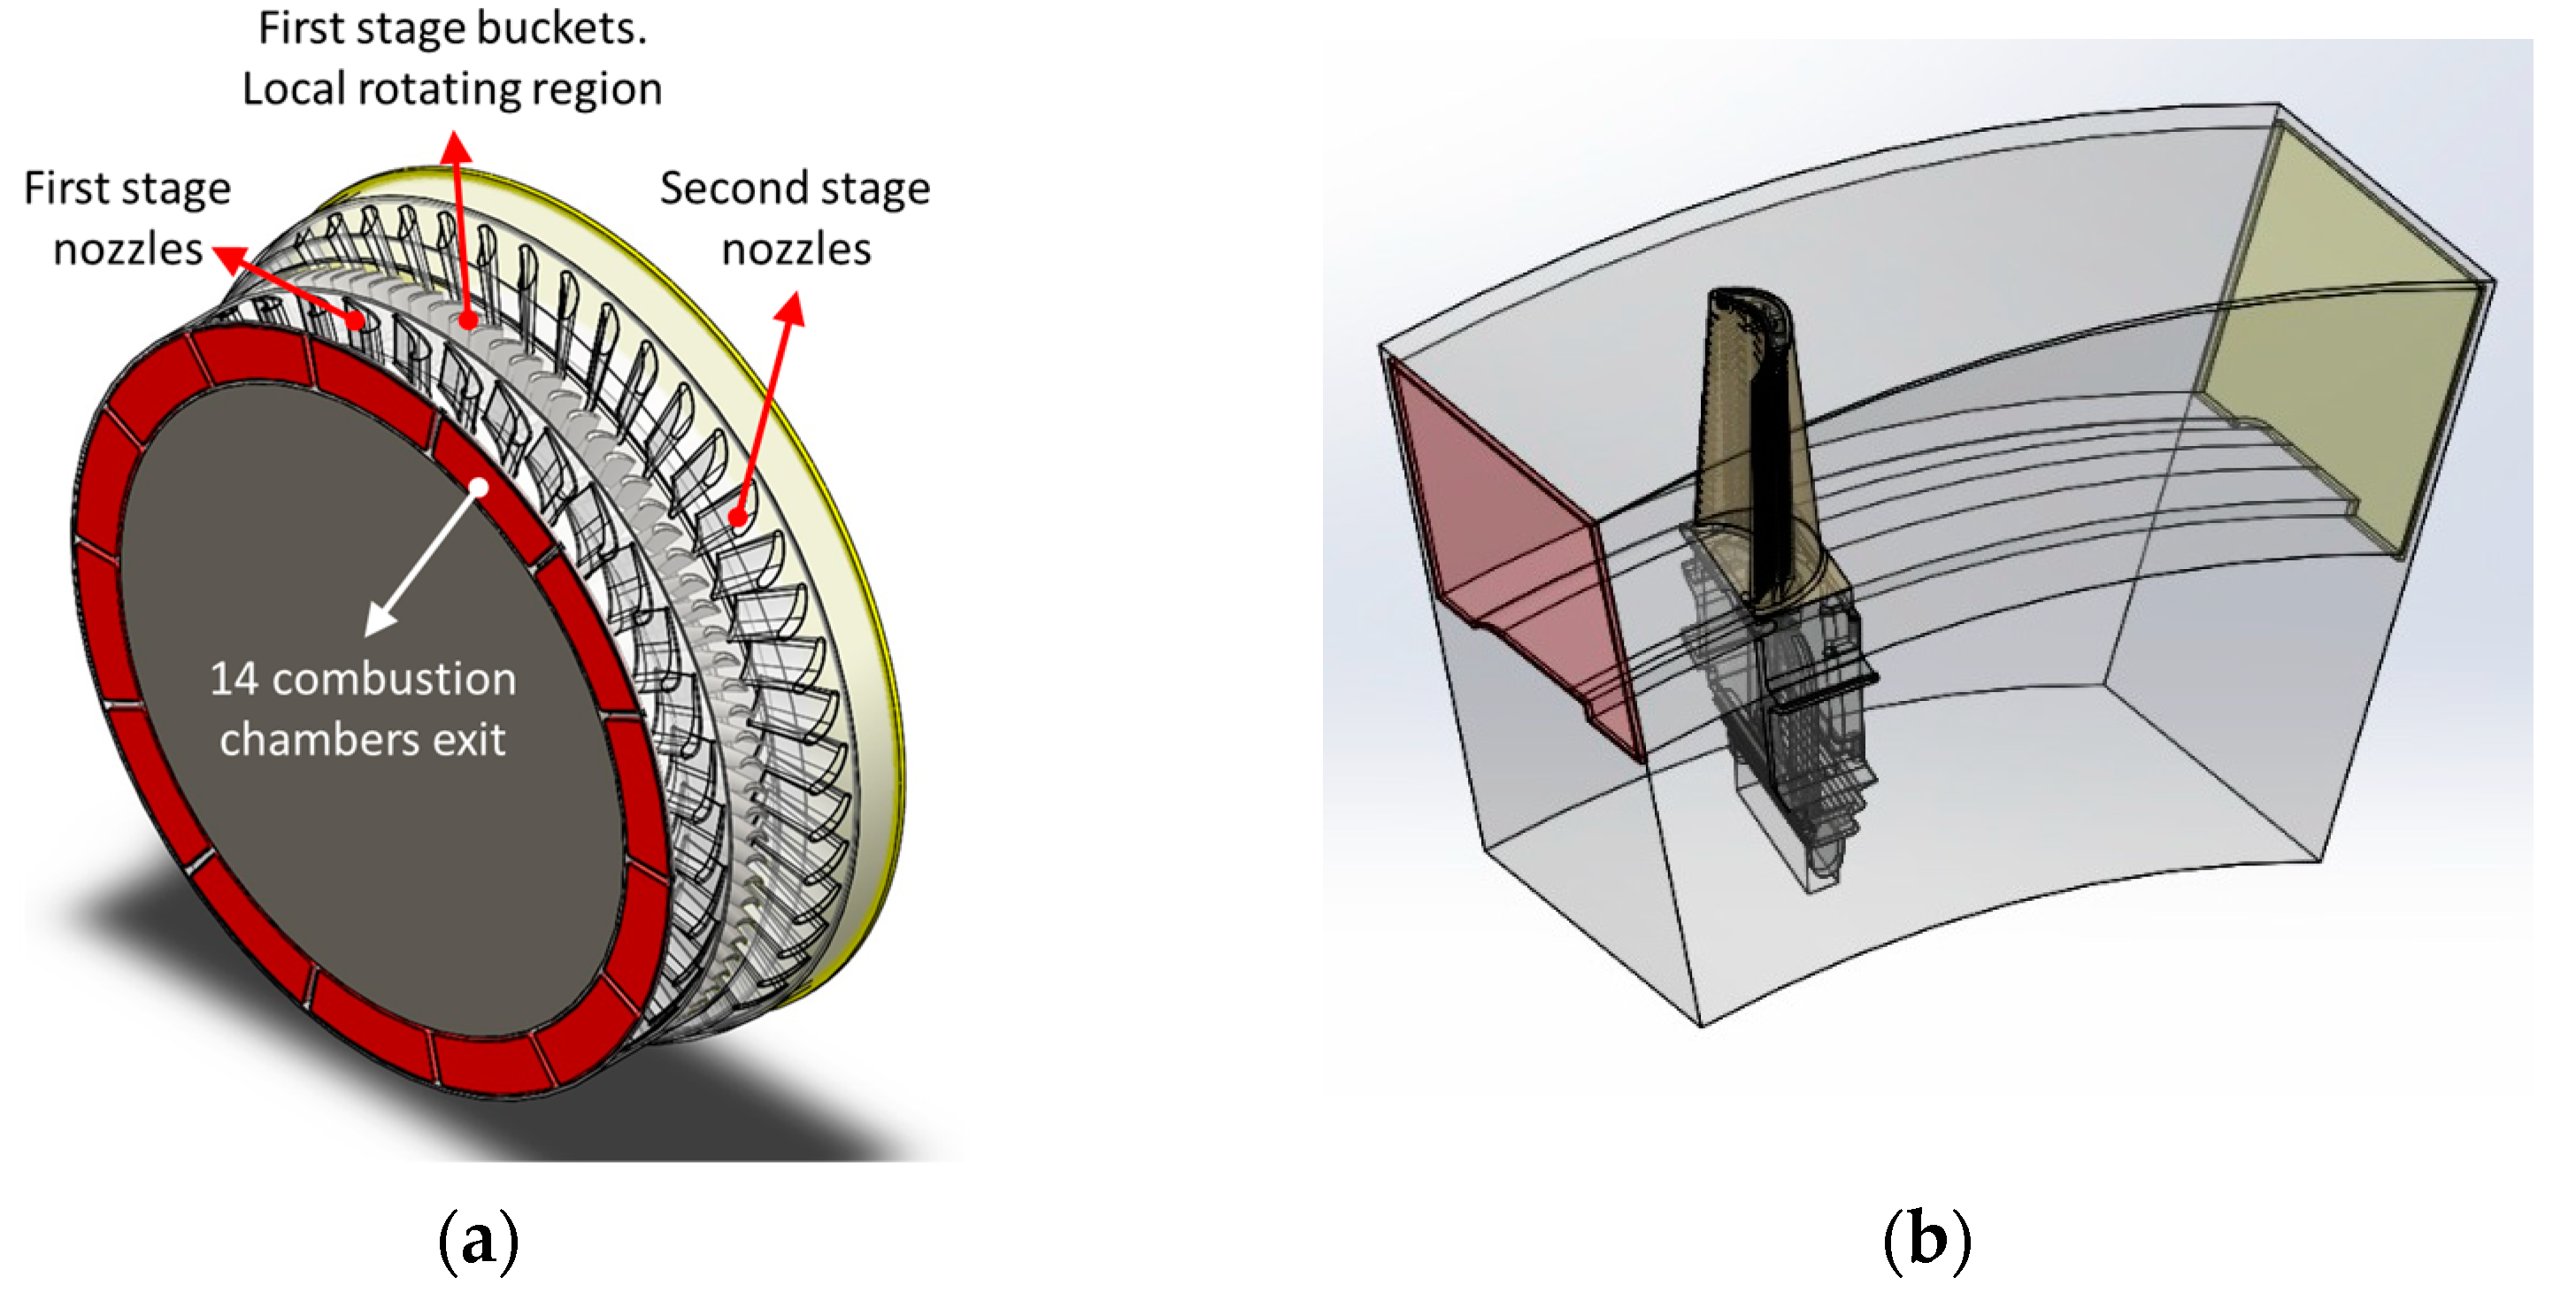
2.2.1. Main Domain
2.2.2. Sub-Domain
3. Results and Discussion
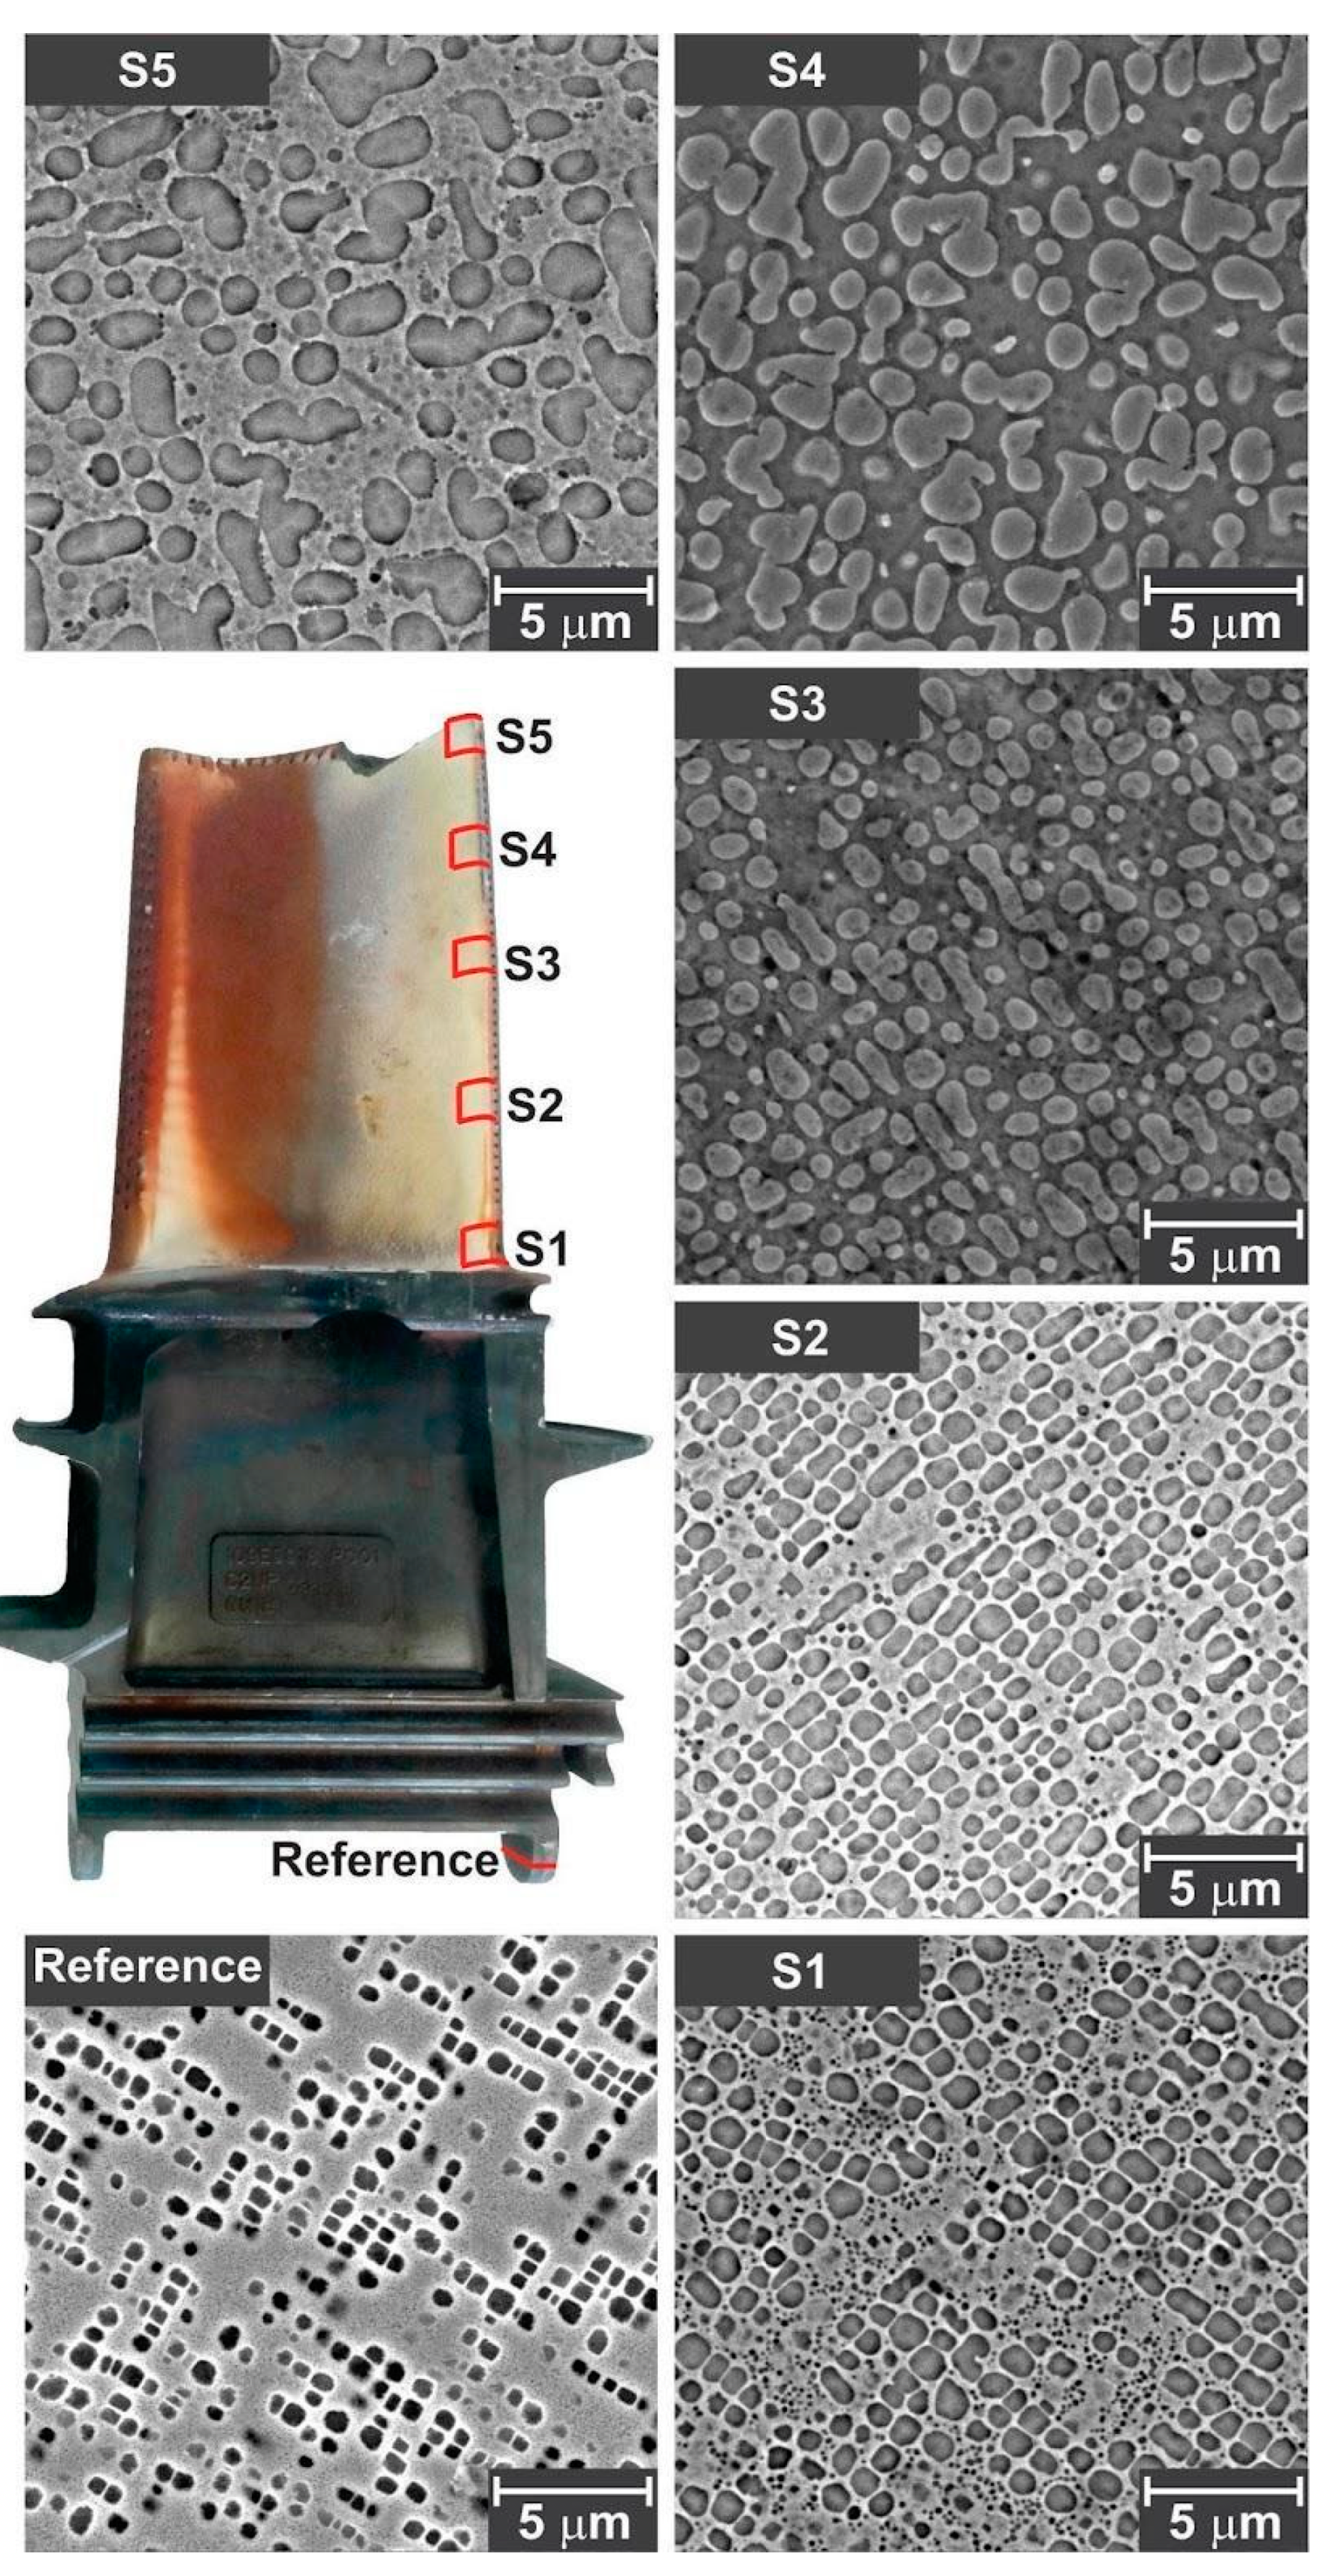
3.1. Microstructural Analysis
3.2. Simulation Approach
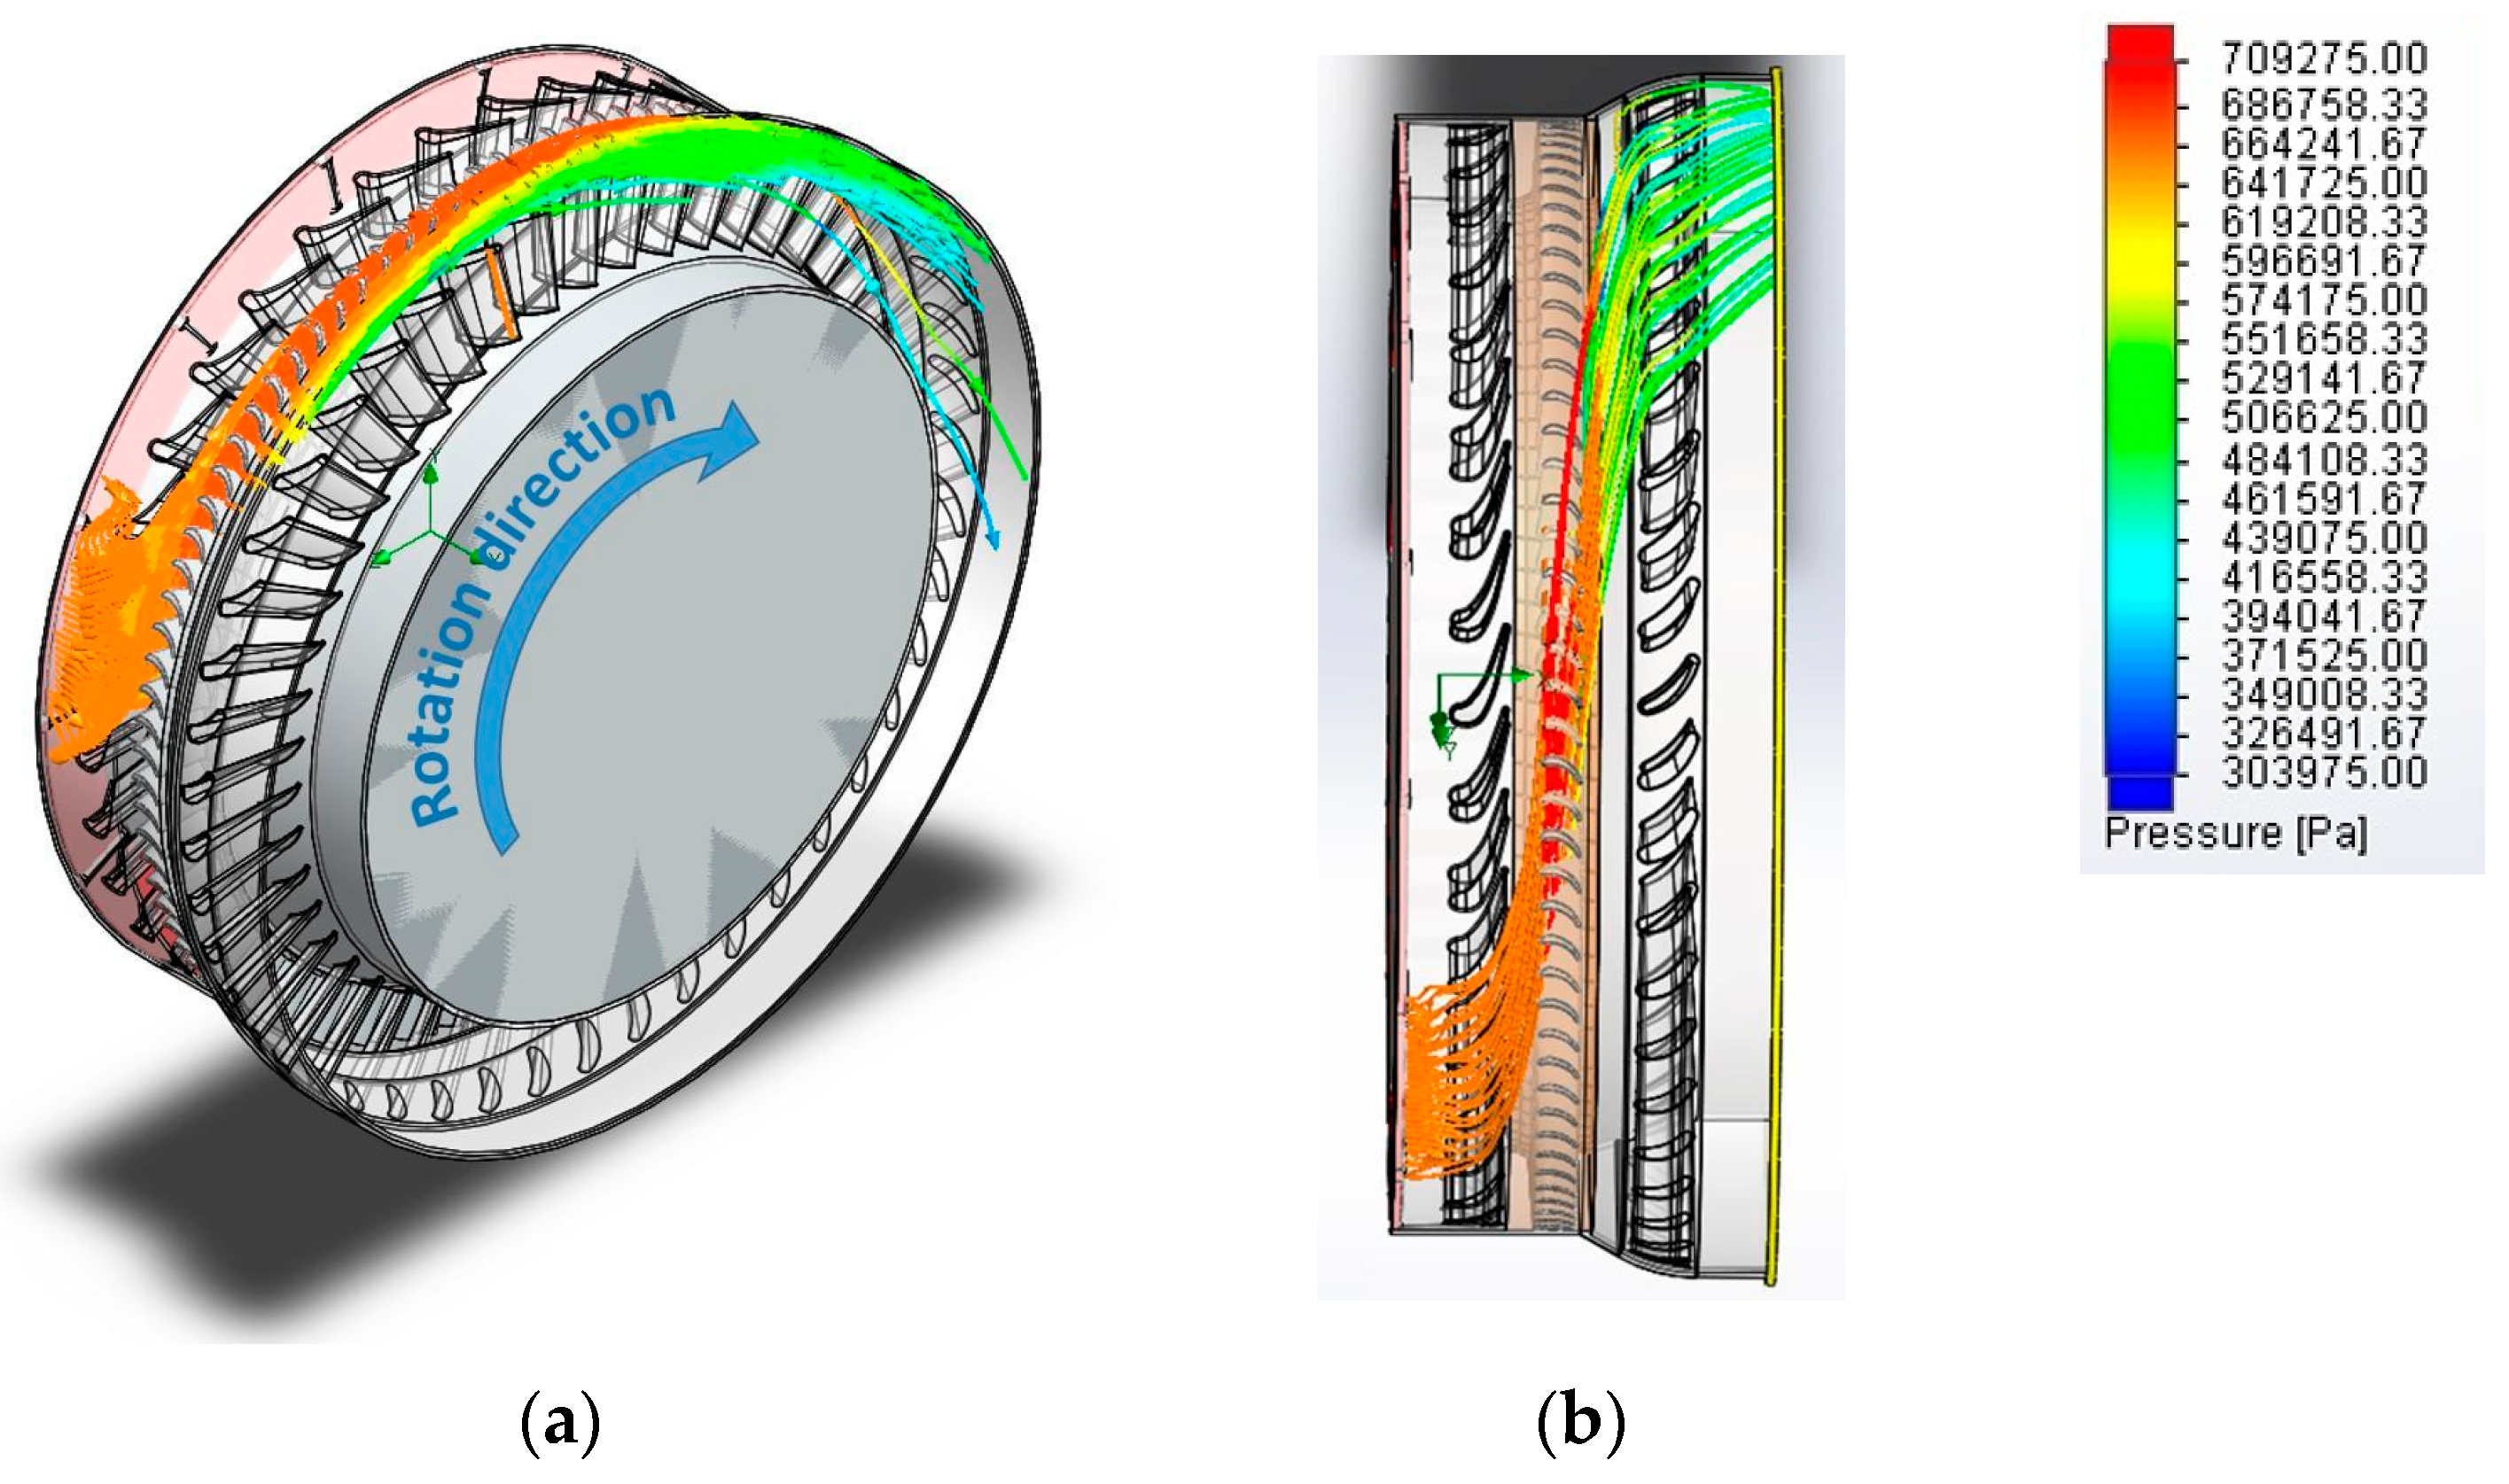
3.2.1. Main Domain Simulation
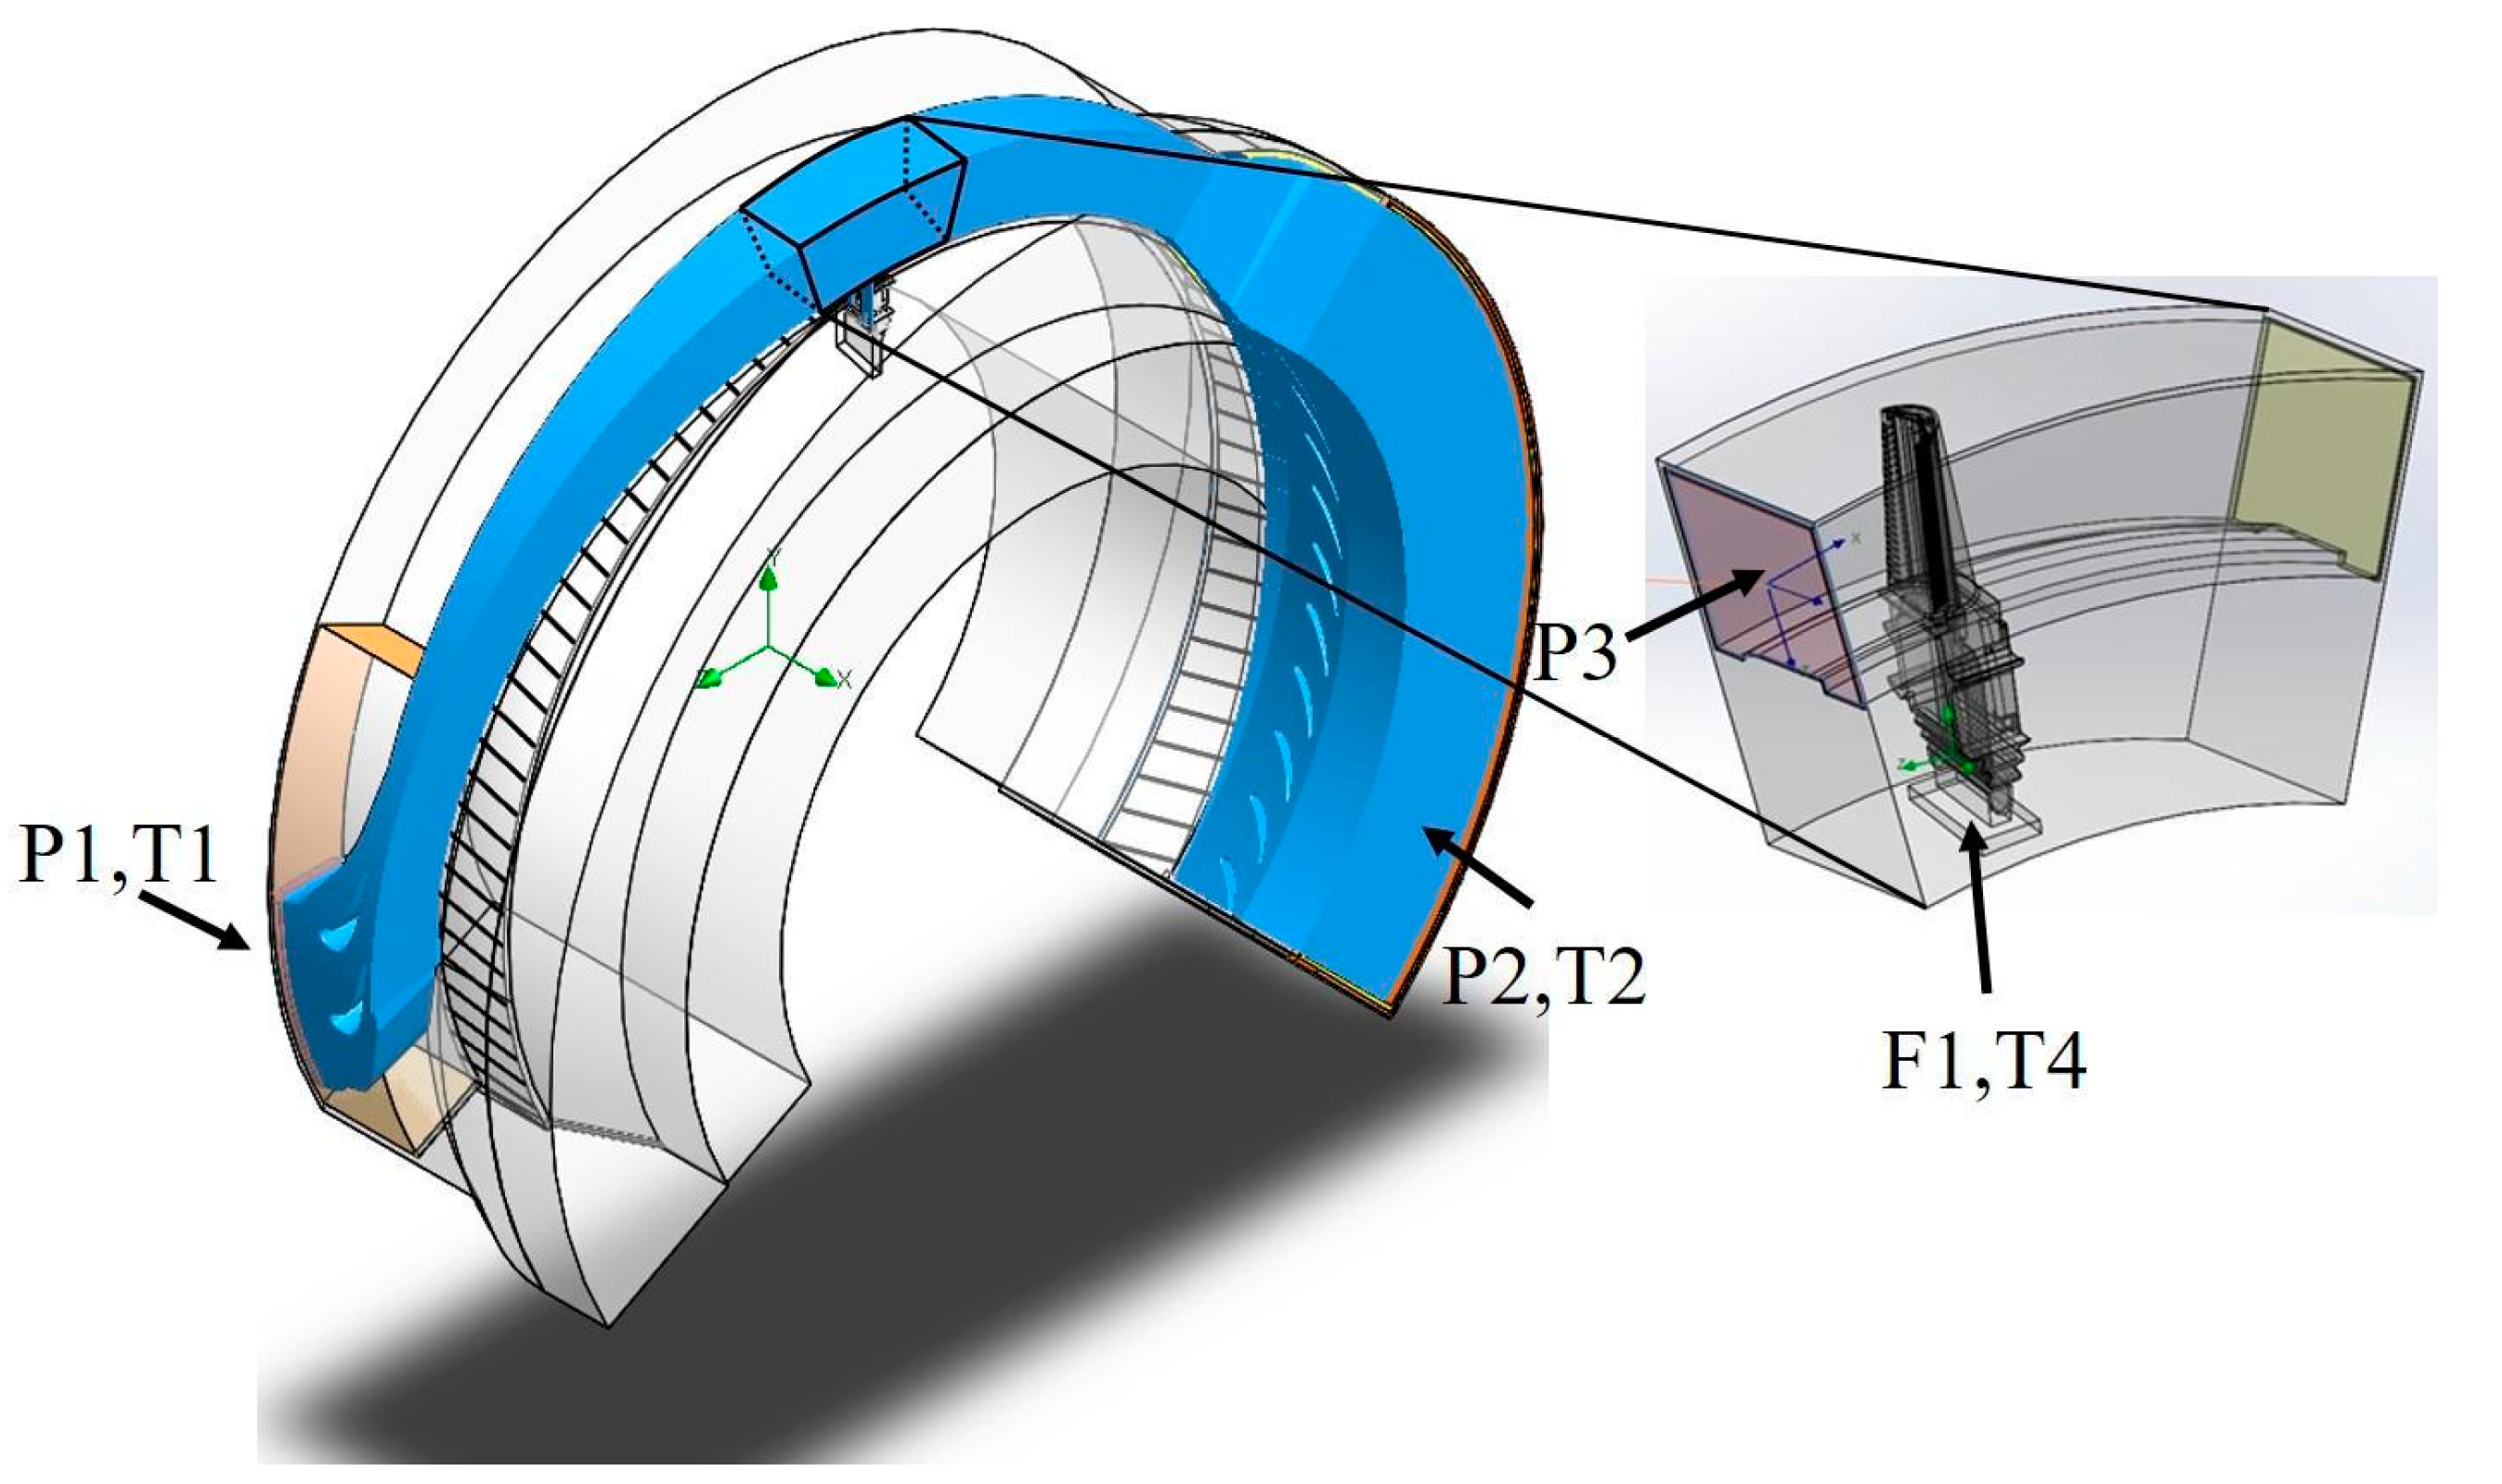
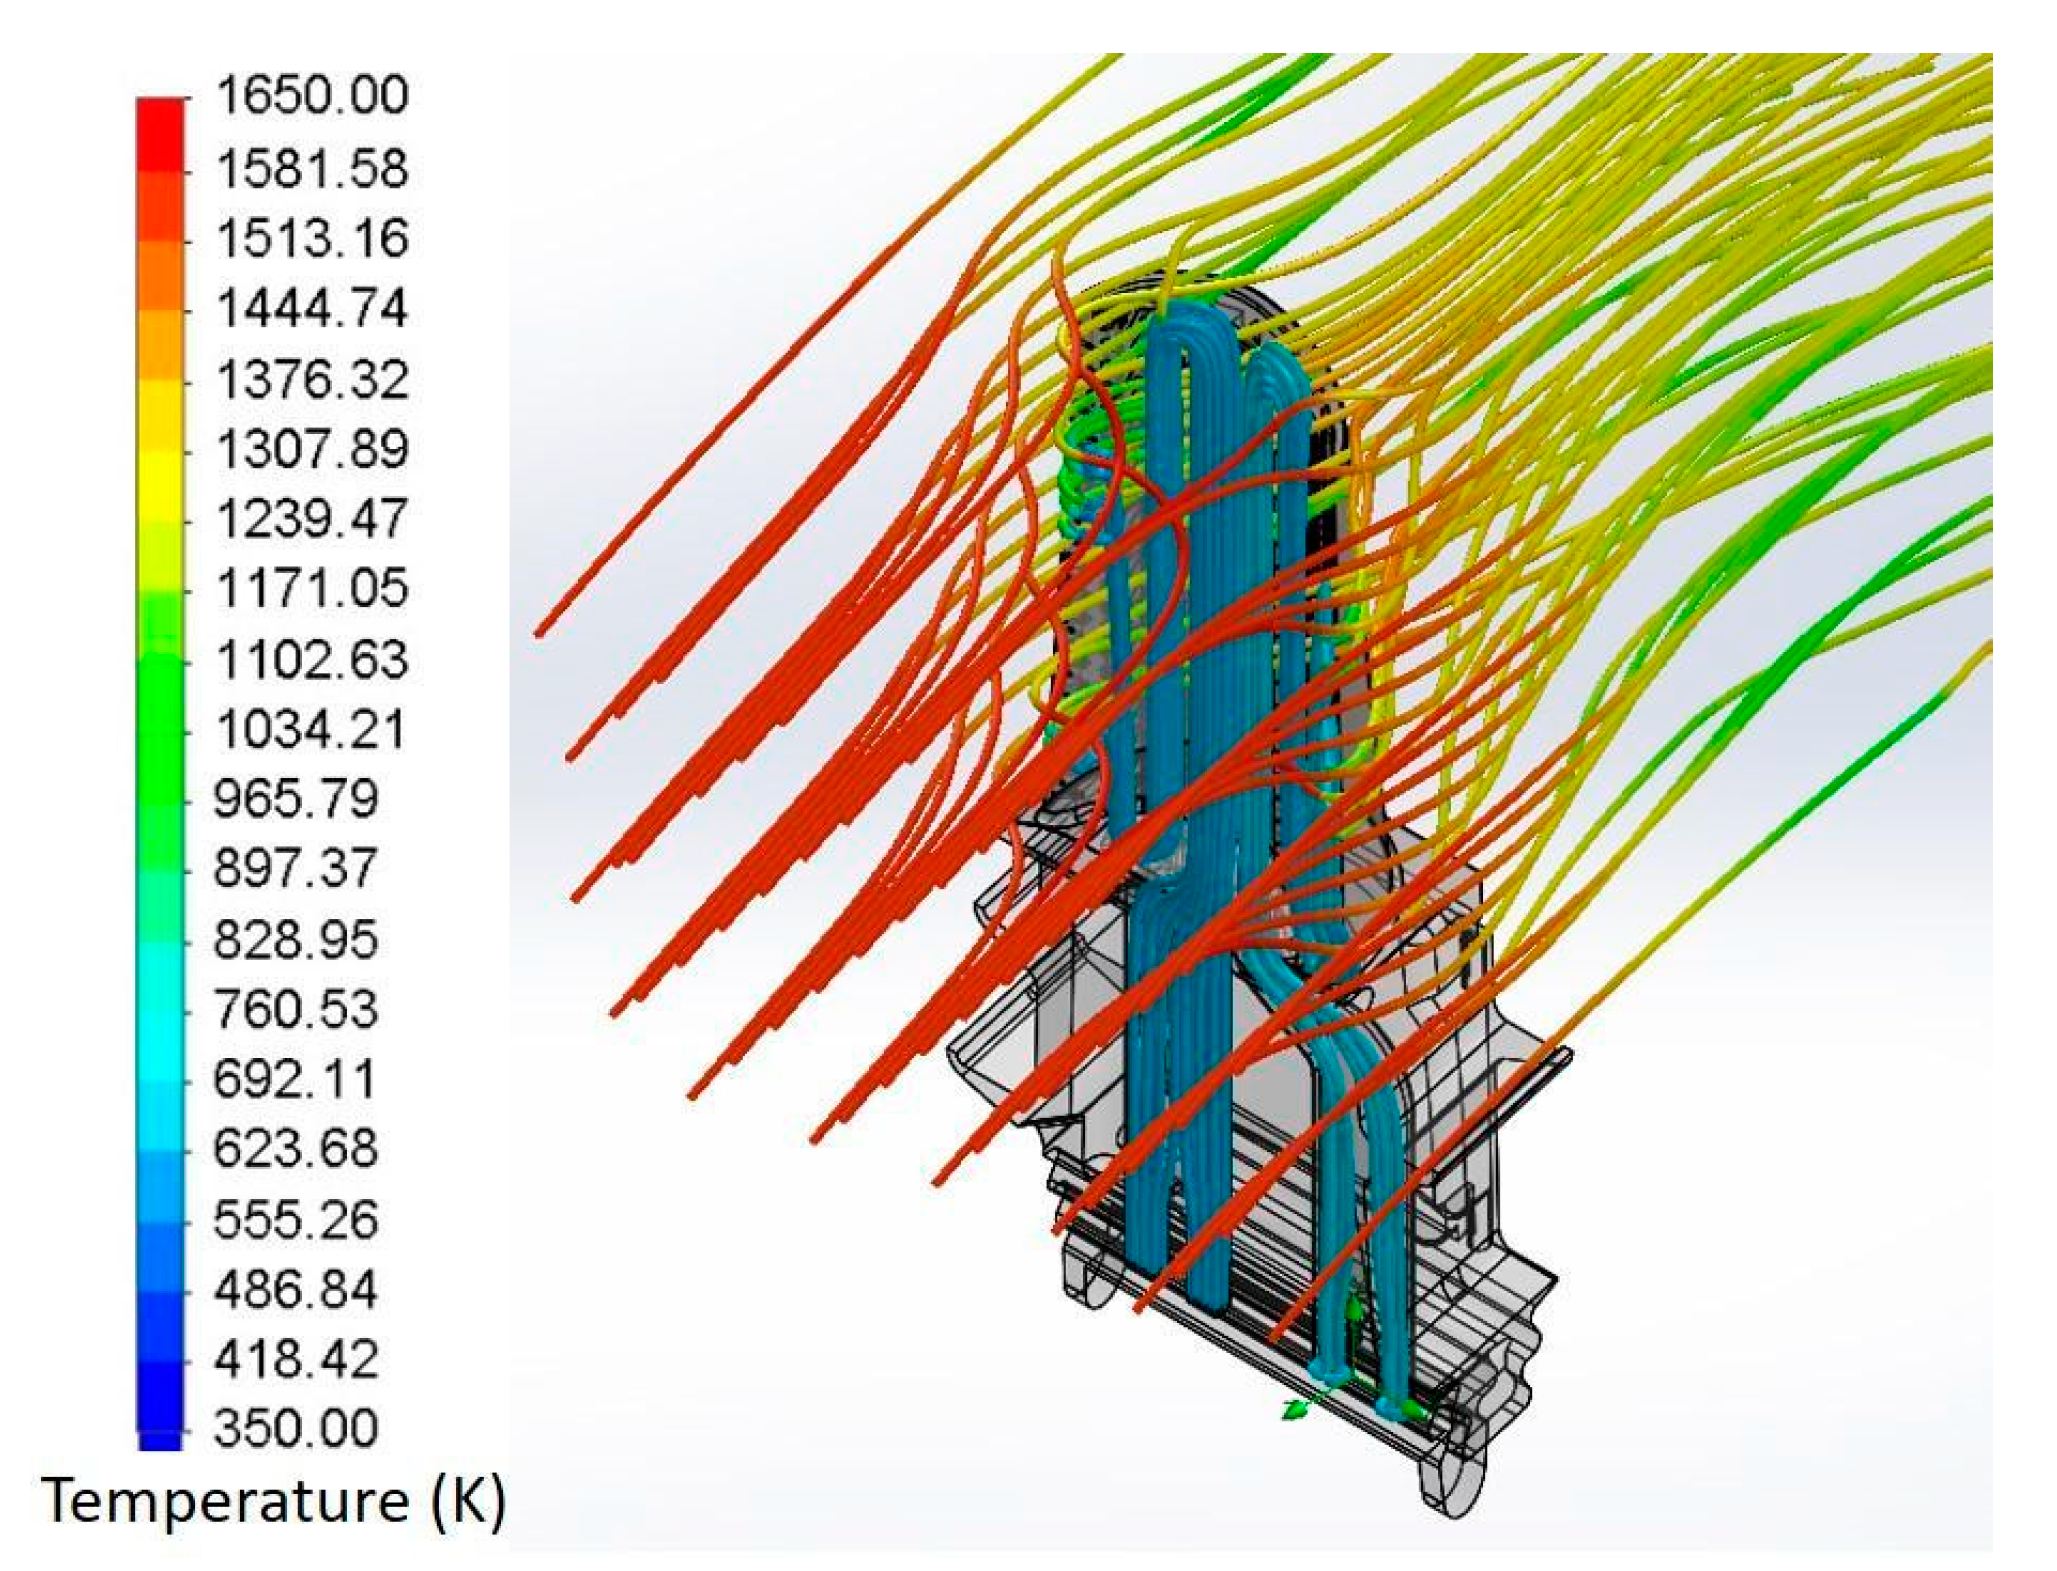
3.2.2. Sub-Domain Simulation
4. Conclusions
Author Contributions
Funding
Data Availability Statement
Acknowledgments
Conflicts of Interest
References
- Chen, L.; Shen, J.; Ge, Y.; Wu, Z.; Wang, W.; Zhu, F.; Feng, H. Power and efficiency optimization of open Maisotsenko-Brayton cycle and performance comparison with traditional open regenerated Brayton cycle. Energy Convers. Manag. 2020, 217, 113001. [Google Scholar] [CrossRef]
- Oliveira, M.C.; Iten, M.; Cruz, P.L.; Monteiro, H. Review on energy efficiency progresses, technologies and strategies in the ceramic sector focusing on waste heat recovery. Energies 2020, 13, 6096. [Google Scholar] [CrossRef]
- Salwan, G.K.; Subbarao, R.; Mondal, S. Comparison and selection of suitable materials applicable for gas turbine blades. Mater. Today Proc. 2021, 46, 8864–8870. [Google Scholar] [CrossRef]
- Puspitasari, P.; Andoko, A.; Kurniawan, P. Failure analysis of a gas turbine blade: A review. IOP Conf. Series: Mater. Sci. Eng. 2021, 1034, 012156. [Google Scholar] [CrossRef]
- Chowdhury, T.S.; Mohsin, F.T.; Tonni, M.M.; Mita, M.N.H.; Ehsan, M.M. A critical review on gas turbine cooling performance and failure analysis of turbine blades. Int. J. ThermoFluids 2023, 18, 100329. [Google Scholar] [CrossRef]
- Pauzi, A.A.; Ghazali, M.J.; Zamri, W.F.H.W.; Rajabi, A. Wear Characteristics of Superalloy and Hardface Coatings in Gas Turbine Applications–A Review. Metals 2020, 10, 1171. [Google Scholar] [CrossRef]
- Swain, B.; Mallick, P.; Patel, S.; Roshan, R.; Mohapatra, S.S.; Bhuyan, S.; Priyadarshini, M.; Behera, B.; Samal, S.; Behera, A. Failure analysis and materials development of gas turbine blades. Mater. Today: Proc. 2020, 33, 5143–5146. [Google Scholar] [CrossRef]
- Du, W.; Luo, L.; Jiao, Y.; Wang, S.; Li, X.; Sunden, B. Heat transfer in the trailing region of gas turbines—A state-of-the-art review. Appl. Therm. Eng. 2021, 199, 117614. [Google Scholar] [CrossRef]
- Taniguchi, T.; Sanbonsugi, K.; Ozaki, Y.; Norimoto, A. Temperature measurement of high speed rotating turbine blades using a pyrometer. In Proceedings of the ASME Turbo Expo 2006: Power for Land, Sea, and Air, Barcelona, Spain, 8–11 May 2006; pp. 521–529. [Google Scholar]
- Gao, S.; Zhang, X.; Chen, L.; Cui, Y.; Jiang, J.; Zhang, Z.; Yu, P.; Wang, C. Radiation temperature measurement methods for engine turbine blades and environment influence. Infrared Phys. Technol. 2022, 123, 104204. [Google Scholar] [CrossRef]
- Ghorbani, H.; Farhangi, H.; Malekan, M. Microstructural investigation and creep behavior of long-term exposed directionally solidified GTD-111 nickel based superalloy. Mater. Sci. Eng. A 2023, 145811. [Google Scholar] [CrossRef]
- Ghorbani, H.; Farhangi, H.; Malekan, M. Material characterization of long-term service-exposed GTD-111 nickel based superalloy. Eng. Fail. Anal. 2023, 148, 107061. [Google Scholar] [CrossRef]
- Ellison, K.A.; Daleo, J.A.; Hussain, K. A new method of metal temperature estimation for service-run blades and vanes. In Proceedings of the 10th International Symposium on Superalloys 2000, Champion, IL, USA, 17 September 2000; pp. 759–768. [Google Scholar] [CrossRef]
- Zhang, P.; Zhou, X.; Wang, X.; Lu, Y.; Cheng, X.; Zhang, W. Study on the microstructural degradation and rejuvenation heat treatment of directionally solidified turbine blades. J. Alloys Compd. 2020, 829, 154474. [Google Scholar] [CrossRef]
- Villada, J.A.; Bayro-Lazcano, R.G.; Martinez-Franco, E.; Espinosa-Arbelaez, D.G.; Gonzalez-Hernandez, J.; Alvarado-Orozco, J.M. Relationship Between γ′ Phase Degradation and In-Service GTD-111 First-Stage Blade Local Temperature. J. Mater. Eng. Perform. 2019, 28, 1950–1957. [Google Scholar] [CrossRef]
- Voorhees, P.W. The theory of Ostwald ripening. J. Stat. Phys. 1985, 38, 231–252. [Google Scholar] [CrossRef]
- Pinto, R.N.; Afzal, A.; D’souza, L.V.; Ansari, Z.; Samee, A.D.M. Computational fluid dynamics in turbomachinery: A review of state of the art. Arch. Comput. Methods Eng. 2016, 24, 467–479. [Google Scholar] [CrossRef]
- Wee, S.; Do, J.; Kim, K.; Lee, C.; Seok, C.; Choi, B.-G.; Choi, Y.; Kim, W. Review on mechanical thermal properties of superalloys and thermal barrier coating used in gas turbines. Appl. Sci. 2020, 10, 5476. [Google Scholar] [CrossRef]
- Masci, R.; Sciubba, E. A lumped thermodynamic model of gas turbine blade cooling: Prediction of first-stage blades temperature and cooling flow rates. J. Energy Resour. Technol. 2017, 140, 020901. [Google Scholar] [CrossRef]
- Zeng, L.; Chen, P.; Li, X.; Ren, J.; Jiang, H. Influence of simplifications of blade in gas turbine on film cooling performance. Appl. Therm. Eng. 2018, 128, 877–886. [Google Scholar] [CrossRef]
- He, W.; Deng, Q.; Zhou, W.; Gao, T.; Feng, Z. Film cooling and aerodynamic performances of a turbine nozzle guide vane with trenched cooling holes. Appl. Therm. Eng. 2019, 150, 150–163. [Google Scholar] [CrossRef]
- He, K. Investigations of film cooling and heat transfer on a turbine blade squealer tip. Appl. Therm. Eng. 2016, 110, 630–647. [Google Scholar] [CrossRef]
- Moritz, N.; Kusterer, K.; Bohn, D.; Sugimoto, T.; Tanaka, R.; Taniguchi, T. Conjugate calculation of a film-cooled blade for improvement of the leading edge cooling configuration. Propuls. Power Res. 2013, 2, 1–9. [Google Scholar] [CrossRef]
- Mensch, A.; Thole, K.A. Conjugate heat transfer analysis of the effects of impingement channel height for a turbine blade endwall. Int. J. Heat Mass Transf. 2015, 82, 66–77. [Google Scholar] [CrossRef]
- Reyhani, M.R.; Alizadeh, M.; Fathi, A.; Khaledi, H. Turbine blade temperature calculation and life estimation—A sensitivity analysis. Propuls. Power Res. 2013, 2, 148–161. [Google Scholar] [CrossRef]
- Mazaheri, K.; Zeinalpour, M.; Bokaei, H.R. Turbine blade cooling passages optimization using reduced conjugate heat transfer methodology. Appl. Therm. Eng. 2016, 103, 1228–1236. [Google Scholar] [CrossRef]
- Zhang, G.; Zhu, R.; Xie, G.; Li, S.; Sundén, B. Optimization of cooling structures in gas turbines: A review. Chin. J. Aeronaut. 2022, 35, 18–46. [Google Scholar] [CrossRef]
- Kusterer, K.; Bohn, D.; Sugimoto, T.; Tanaka, R. Conjugate calculations for a film-cooled blade under different operating conditions. In Proceedings of the ASME Turbo Expo 2004: Power for Land, Sea, and Air, Vienna, Austria, 14–17 June 2004; pp. 675–684. [Google Scholar]
- Darsono, F.B.; Widodo, R.D.; Rusiyanto; Nurdin, A. Analysis of the Effect of Flow Rate and Speed on Four Blade Tubular Water Bulb-Turbine Efficiency Using Numerical Flow Simulation. J. Adv. Res. Fluid Mech. Therm. Sci. 2022, 90, 1–8. [Google Scholar] [CrossRef]
- Matsson, J. An Introduction to SOLIDWORKS Flow Simulation 2023; SDC Publications: Mission, KS, USA, 2023. [Google Scholar]
- Arteaga-López, E.; Ángeles-Camacho, C.; Bañuelos-Ruedas, F. Advanced methodology for feasibility studies on building-mounted wind turbines installation in urban environment: Applying CFD analysis. Energy 2018, 167, 181–188. [Google Scholar] [CrossRef]
- Sun, Z.; Jiang, X.; Qiu, C.; Cheng, S.; Liu, X.; Li, H.; Liu, X.; Wang, Y.; Dong, J.; Lou, L. The investigations of rejuvenation heat treatment on the microstructure and mechanical properties of a serviced gas turbine blade. J. Alloys Compd. 2023, 948, 169759. [Google Scholar] [CrossRef]
- Sabri, K.; Gaceb, M.; Si-Chaib, M.O. Analysis of a directionally solidified (DS) GTD-111 turbine blade failure. J. Fail. Anal. Prev. 2020, 20, 1162–1174. [Google Scholar] [CrossRef]
- Choi, B.G.; Kim, I.S.; Kim, D.H.; Jo, C.Y. Temperature dependence of MC decomposition behavior in Ni-base superalloy GTD 111. Mater. Sci. Eng. A 2008, 478, 329–335. [Google Scholar] [CrossRef]
- Schroeder, A.B.; Dobson, E.T.A.; Rueden, C.T.; Tomancak, P.; Jug, F.; Eliceiri, K.W. The ImageJ ecosystem: Open-source software for image visualization, processing, and analysis. Protein Sci. 2020, 30, 234–249. [Google Scholar] [CrossRef] [PubMed]
- Baldan, A. Review Progress in Ostwald ripening theories and their applications to nickel-base superalloys Part I: Ostwald ripening theories. J. Mater. Sci. 2002, 37, 2171–2202. [Google Scholar] [CrossRef]
- Ratke, L.; Voorhees, P.W. Growth and Coarsening: Ostwald Ripening in Material Processing; Springer: Berlin/Heidelberg, Germany, 2013; ISBN 978-3-642-07644-2. [Google Scholar]
- Lifshitz, I.; Slyozov, V. The kinetics of precipitation from supersaturated solid solutions. J. Phys. Chem. Solids 1961, 19, 35–50. [Google Scholar] [CrossRef]
- Wagner, C. Theorie der alterung von niederschlägen durch umlösen (Ostwald reifung). Phys. Chem. Chem. Phys. 2010, 65, 581–591. [Google Scholar] [CrossRef]
- Wan, E.S.; Crimi, P.; Scheibel, J.; Viswanathan, R. Combustion turbine F-class life management of 1st stage turbine blades. In Proceedings of the ASME Turbo Expo 2002: Power for Land, Sea, and Air, Amsterdam, The Netherlands, 3–6 June 2002; pp. 683–690. [Google Scholar]
- Wan, E.; Hong, C.; Dewey, R.; Bernstein, H.; Norsworthy, D. Life Management System for Advanced F Class Gas Turbine; EPRI Report No. 1008319; EPRI: Palo Alto, CA, USA, 2005. [Google Scholar]
- Ginter, T.; Bouvay, T. “Uprate Options for the MS7001 Heavy Duty Gas Turbine,” General Electric Reference Document GER-3808C. 2006. Available online: https://www.ge.com/content/dam/gepower-pgdp/global/en_US/documents/technical/ger/ger-3808c-uprate-options-ms7001-heavy-duty-gas-turbine.pdf (accessed on 5 May 2023).
- Material Property Data. Available online: http://www.matweb.com (accessed on 11 September 2022).
- Liu, Z.; Qi, H. Numerical simulation of transport phenomena for a double-layer laser powder deposition of single-crystal superalloy. Met. Mater. Trans. A 2014, 45, 1903–1915. [Google Scholar] [CrossRef]
- Lam, C.K.G.; Bremhorst, K. A modified form of the k-ε model for predicting wall turbulence. J. Fluids Eng. 1981, 103, 456–460. [Google Scholar] [CrossRef]
- Balakin, V.; Churbanov, A.G.; Gavriliouk, V.; Makarov, M.; Pavlov, A. Verification and Validation of EFD.Lab code for predicting heat and fluid flow. In Proceedings of the International Symposium on Advances in Computational Heat Transfer, Norway, 19–24 April 2004; Available online: http://cadflo.ru/fileadmin/user_upload/FOR_PREDICTING_HEAT_AND_FLUID_FLOW.pdf (accessed on 7 August 2023).
- Van Driest, E.R. On turbulent flow near a wall. J. Aeronaut. Sci. 1956, 23, 1007–1011. [Google Scholar] [CrossRef]
- Sobachkin, A.; Dummov, G. Numerical Basis of CAD-Embedded CFD. In Proceedings of the NAFEMS World Congress 2013, Salzburg, Austria, 9–12 June 2013; Available online: https://pdfs.semanticscholar.org/56f5/4b31c528c588cfb465d953c2b0f24ea9e297.pdf (accessed on 5 February 2023).
- Hasbestan, J.J.; Senocak, I. Binarized-octree generation for Cartesian adaptive mesh refinement around immersed geometries. J. Comput. Phys. 2018, 368, 179–195. [Google Scholar] [CrossRef]
- Anderson, M.J.; Liao, L.; Basoalto, H.C. An assessment of statistical models of competitive growth during transient Ostwald ripening in turbine disc nickel-based superalloys. Model. Simul. Mater. Sci. Eng. 2022, 30, 075005. [Google Scholar] [CrossRef]
- Oriani, R.A. Ostwald ripening of precipitates in solid matrices. Acta Metallurgica 1964, 12, 1399–1409. [Google Scholar] [CrossRef]
- WolframAlpha. Available online: https://www.wolframalpha.com/calculators/equation-solver-calculator (accessed on 3 May 2023).
- Geranmayeh, A.; Malekan, M.; Forghani, F.; Ghorbani, H. Microstructural and mechanical investigations on the heat treatment rejuvenation of a long-term service-exposed GTD-111 Ni-based superalloy. Mater. Sci. Eng. A 2023, 862, 144381. [Google Scholar] [CrossRef]
- Taheri, M.; Jam, J.E.; Beni, M.H.; Khorram, A.; Kashani-Bozorg, S.F.; Torkamany, M.J. The effect of service temperature on the impact strength and fracture toughness of GTD-111 superalloy. Eng. Fail. Anal. 2021, 127, 105507. [Google Scholar] [CrossRef]
- Mattingly, J.D. Elements of Gas Turbine Propulsion; McGraw-Hill Science, Engineering & Mathematics: New Delhi, India, 1996; Volume 1. [Google Scholar]


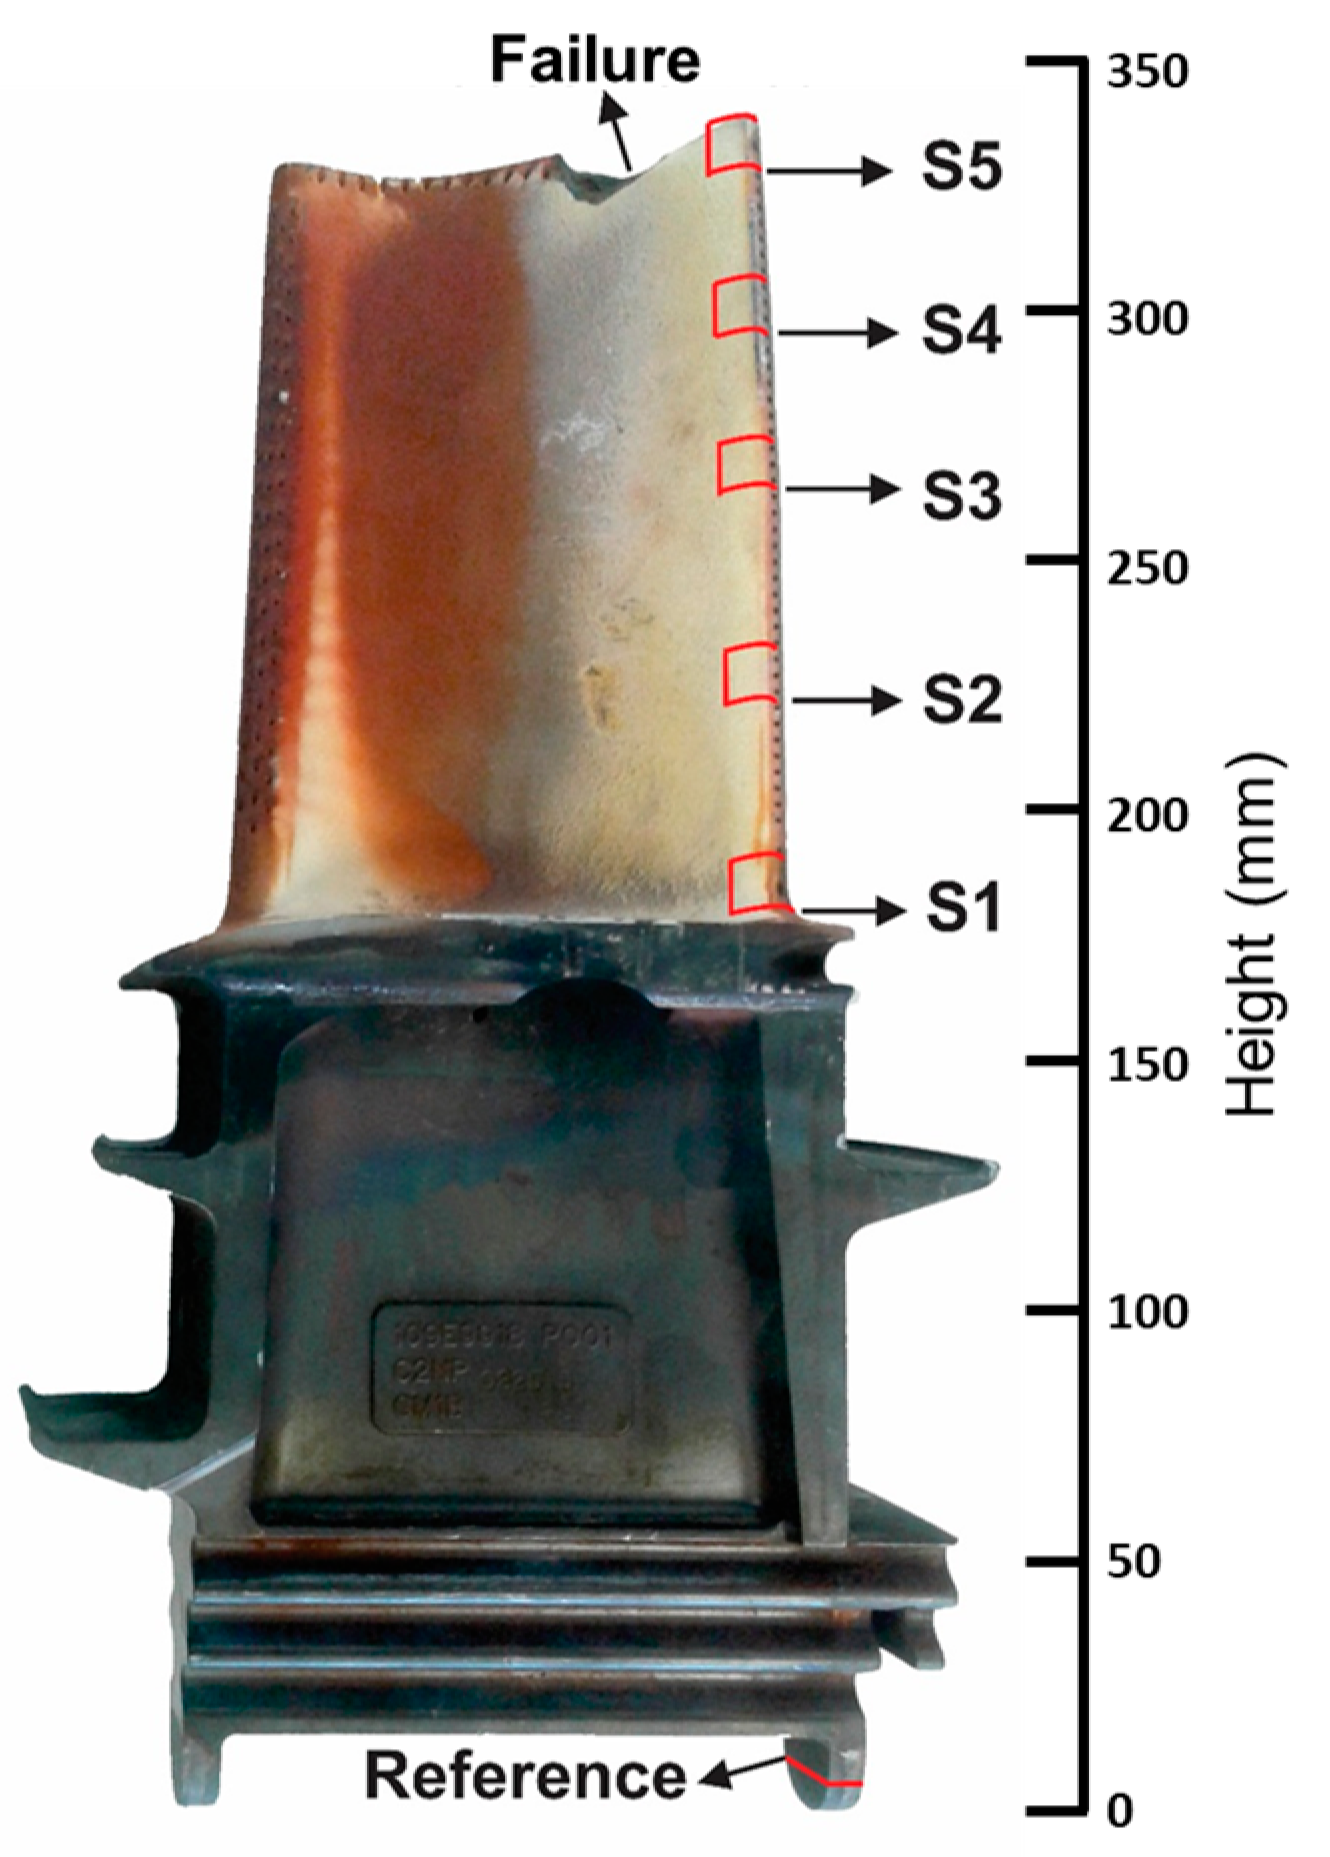
| Sample ID | Height | Description |
|---|---|---|
| Reference | 10 | From the dovetail tip |
| S1 | 180 | From the airfoil-root interface |
| S2 | 220 | From ¼ of the airfoil height |
| S3 | 250 | From ½ of the airfoil height |
| S4 | 290 | From ¾ of the airfoil height |
| A5 | 330 | From the trailing edge tip |
| Label | Parameter | Value |
|---|---|---|
| P1 | Pressure ratio | 14.8 |
| P2 | Pressure at the end of the 2nd nozzles stage | 5 atm. |
| T1 | Firing Temp. | 1600 K |
| T2 | Gas temp. at the end of the 2nd nozzles stage | 1000 K |
| T3 | Exhaust gas temp. | 874 K |
| T4 | Cooling Air Temp. | 569 K |
| F1 | Airflow | 432 Kg/s |
| S1 | Gas Turbine Speed (rpm) | 3600 RPM |
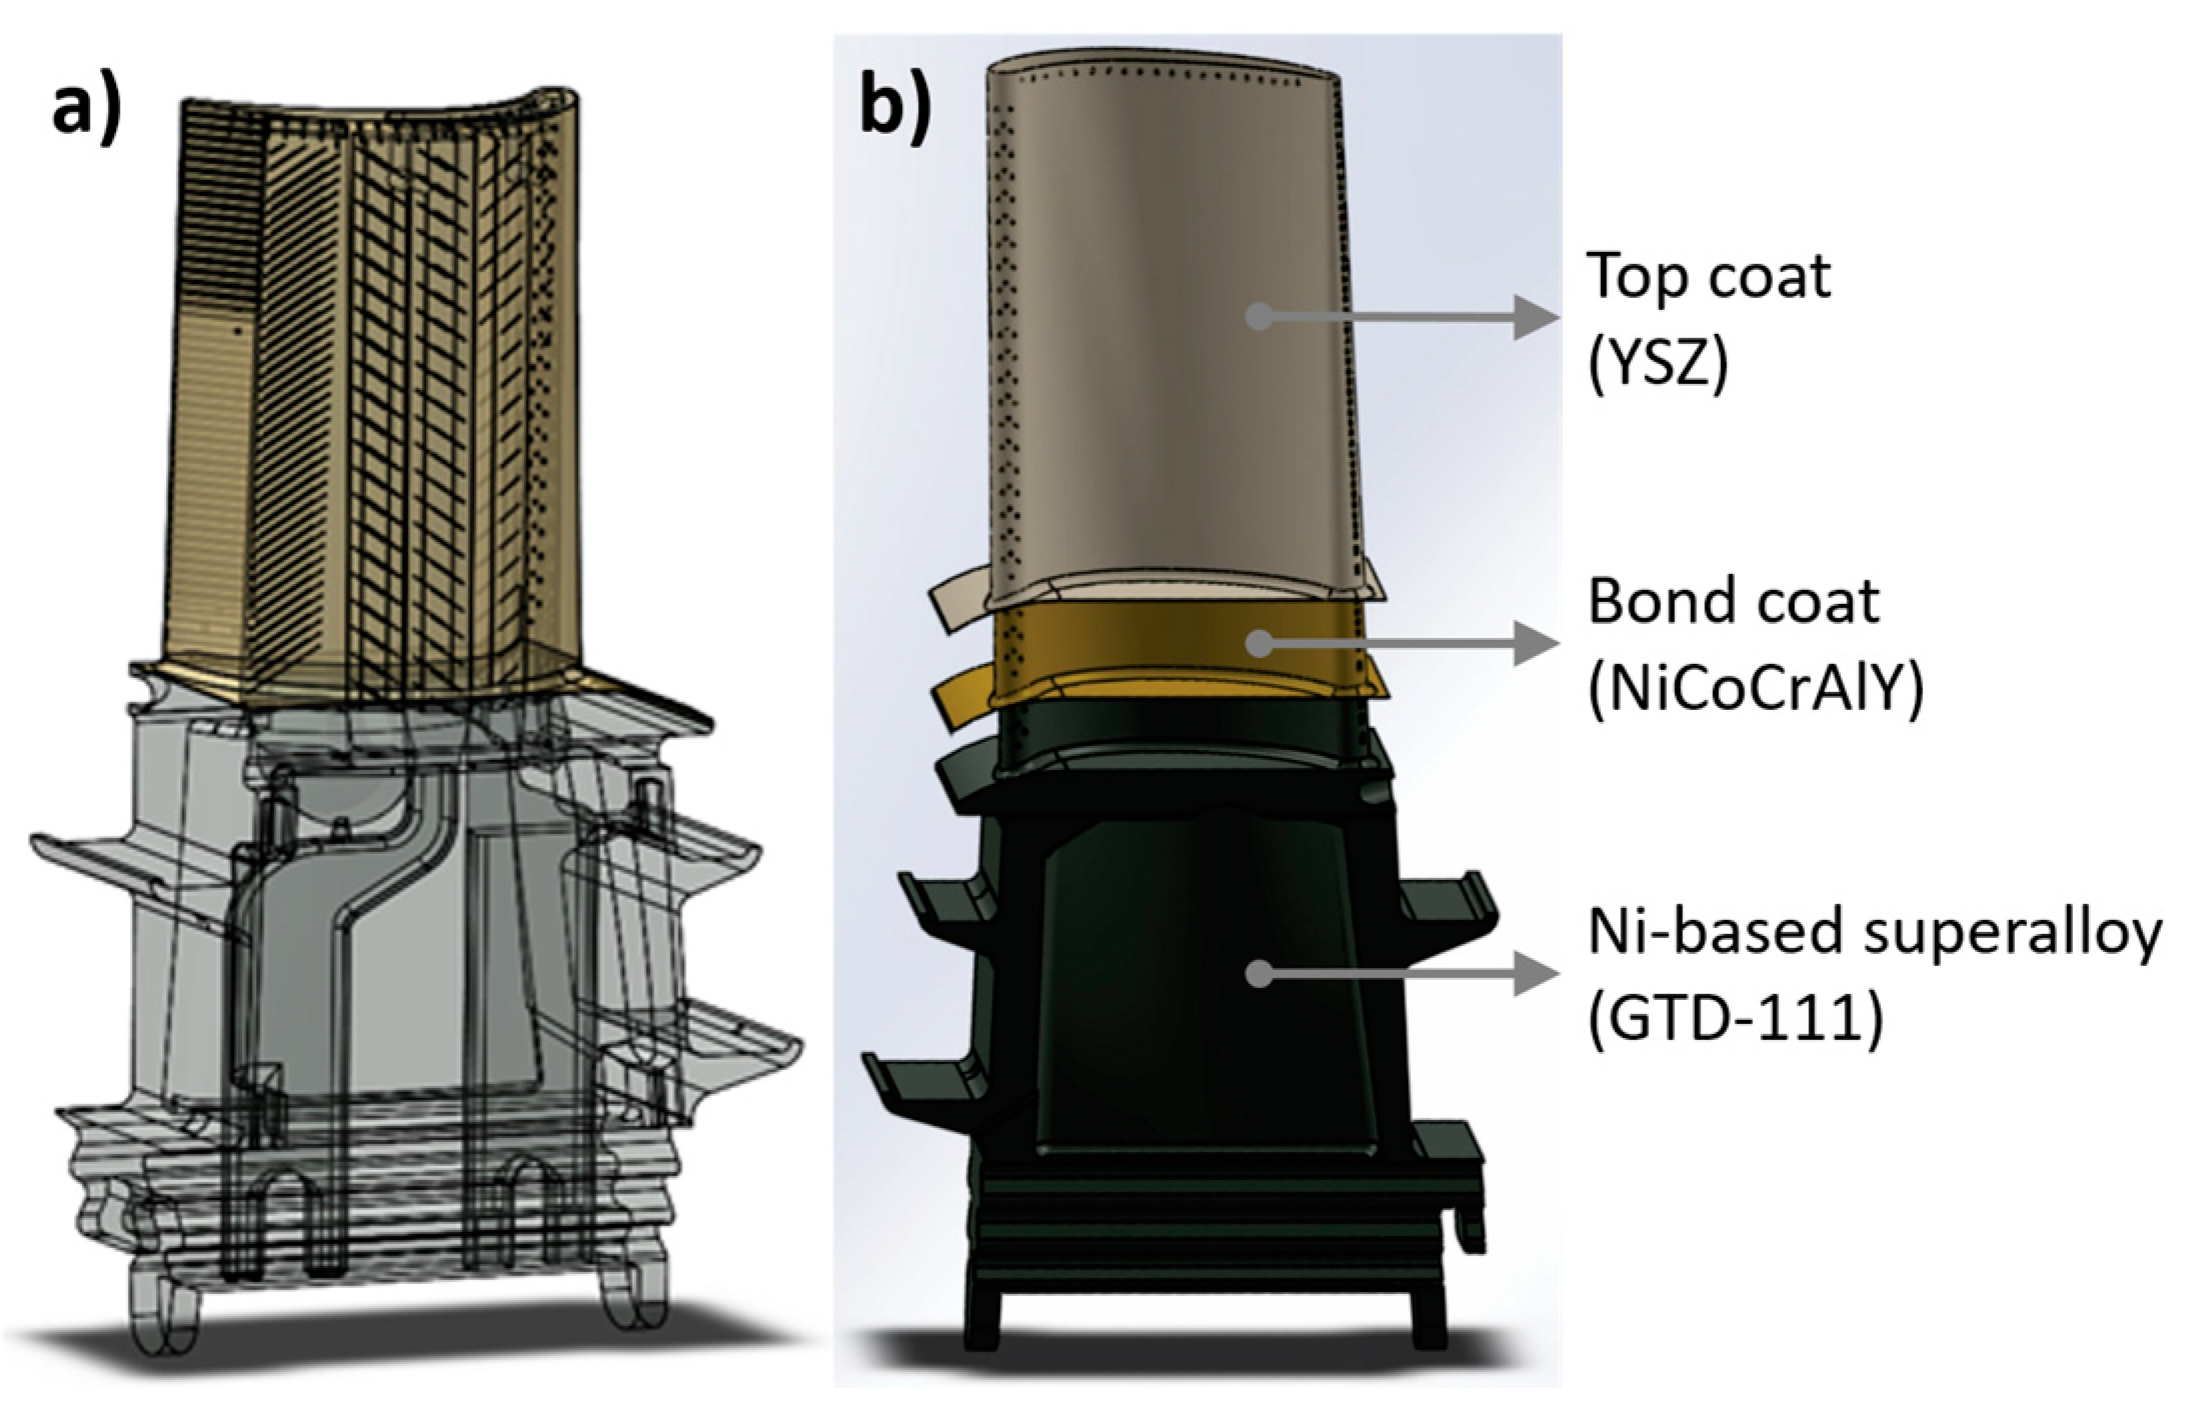
| Parameter | GTD-111 | NiCoCrAlY | YSZ | GTD-222 | FSX-414 | 2 1/2-CrMo |
|---|---|---|---|---|---|---|
| First-Stage Blade | Bond-Coat | Top-Coat | Second-Stage Nozzles | First-Stage Nozzles | Shell | |
| Density (kg/m3) | 8170 | 8420 | 6100 | 7900 | 8300 | 7850 |
| Thermal Conductivity (W/(m·K)) | Temp. function [44]. (11 + 0.0125 T) | 18 | 2.5 | 200 | 16 | 44.5 |
| Specific Heat Capacity (J/(kg·K)) | Temp. function [44]. (370 + 0.250 T) | 430 | 550 | 149 | 500 | 475 |
| Melting Point (K) | 1523 | 1593 | 2698 | 1402 | 1673 | 1690 |
| Sample | Height (mm) | d (µm) | K (µm3/h × 10−5) | T (K) |
|---|---|---|---|---|
| S1 | 180 | 1.49 (0.11) | 19.569 (1.815) | 1288.69 |
| S2 | 220 | 1.54 (0.11) | 21.491 (2.020) | 1293.98 |
| S3 | 250 | 1.89 (0.16) | 40.903 (6.225) | 1331.61 |
| S4 | 290 | 2.01 (0.14) | 49.758 (7.484) | 1343.51 |
| S5 | 330 | 2.21 (0.24) | 66.416 (19.722) | 1361.46 |
Disclaimer/Publisher’s Note: The statements, opinions and data contained in all publications are solely those of the individual author(s) and contributor(s) and not of MDPI and/or the editor(s). MDPI and/or the editor(s) disclaim responsibility for any injury to people or property resulting from any ideas, methods, instructions or products referred to in the content. |
© 2023 by the authors. Licensee MDPI, Basel, Switzerland. This article is an open access article distributed under the terms and conditions of the Creative Commons Attribution (CC BY) license (https://creativecommons.org/licenses/by/4.0/).
Share and Cite
Bayro-Lazcano, R.G.; Piedra-Gonzalez, S.; García-Moreno, A.-I.; Espinosa-Arbelaez, D.G.; Villada-Villalobos, J.A. Computational and Experimental Study on Failure Mechanism of a GTD-111 First-Stage Blade of an Industrial Gas Turbine. Metals 2023, 13, 1968. https://doi.org/10.3390/met13121968
Bayro-Lazcano RG, Piedra-Gonzalez S, García-Moreno A-I, Espinosa-Arbelaez DG, Villada-Villalobos JA. Computational and Experimental Study on Failure Mechanism of a GTD-111 First-Stage Blade of an Industrial Gas Turbine. Metals. 2023; 13(12):1968. https://doi.org/10.3390/met13121968
Chicago/Turabian StyleBayro-Lazcano, Roberto Guillermo, Saúl Piedra-Gonzalez, Angel-Iván García-Moreno, Diego German Espinosa-Arbelaez, and Jhon Alexander Villada-Villalobos. 2023. "Computational and Experimental Study on Failure Mechanism of a GTD-111 First-Stage Blade of an Industrial Gas Turbine" Metals 13, no. 12: 1968. https://doi.org/10.3390/met13121968
APA StyleBayro-Lazcano, R. G., Piedra-Gonzalez, S., García-Moreno, A.-I., Espinosa-Arbelaez, D. G., & Villada-Villalobos, J. A. (2023). Computational and Experimental Study on Failure Mechanism of a GTD-111 First-Stage Blade of an Industrial Gas Turbine. Metals, 13(12), 1968. https://doi.org/10.3390/met13121968