Article

Characteristics of Pore Morphology in Aluminum Alloy Foams Fabricated by Semi-Solid Route among Multiple Experimental Runs

1
Department of Materials Science, Graduate School of Fundamental Science and Engineering, Waseda University, Tokyo 169-8555, Japan
2
Department of Applied Mechanics and Aerospace Engineering, School of Fundamental Science and Engineering, Waseda University, Tokyo 169-8555, Japan
3
Kagami Memorial Research Institute for Materials Science and Technology, Waseda University, Tokyo 169-0051, Japan
*
Authors to whom correspondence should be addressed.
Metals 2023, 13(10), 1654; https://doi.org/10.3390/met13101654
Submission received: 7 September 2023 / Revised: 19 September 2023 / Accepted: 22 September 2023 / Published: 27 September 2023
(This article belongs to the Special Issue Advanced Metallic Foams)

Abstract

:
A semi-solid route is expected to be a fabrication method that can fabricate aluminum alloy foams with a variety of mechanical properties, but the allowance fluctuation of the fabrication conditions of aluminum alloy foams with high reproducibility is not clear. The objective of this study was to reveal the allowance fluctuation between the setting temperature and the actual temperature of the melt to fabricate stable foams, having pores with small pores and high circularity, and the influence of the increasing volume fraction of the solid on the pore morphology. Al-Si alloy foams were fabricated five times by adding a blowing agent into a semi-solid slurry under the same setting fabrication conditions, such as the temperature and concentration of oxygen in the atmosphere. The results of small relative standard deviations of pore diameter and circularity indicated that the conducted fabrication process had high reproducibility, even if the volume fraction of the solid changed in a range of 5%. When the volume fraction of the solid exceeds the minimal fraction of primary crystals for prevention of drainage, the clogging effect works more efficiently because the ratio of clogged cell walls increases. Additionally, the preferred range of the volume fraction of the solid for the fabrication of stable foam was revealed to be around 15% to 35%.

1. Introduction

Aluminum alloy foam has been attracted in recent years under high demand for lighter and more durable materials to reduce the environmental load [1]. The aluminum alloy foam shows a variety of unique properties, such as lightweight, shock-absorbing ability, sound-absorbing ability, and thermal isolating ability, which are suitable for the aforementioned requirements, owing to its closed cell structure inside the foam [1,2]. Because of these properties, aluminum alloy foams have already been put to practical use and have been studied in various fields, such as architectural materials, crash-absorbing materials in automobiles, heat insulators, and acoustic materials [3,4,5,6,7,8,9,10,11]. It is well known that these properties are easily lowered due to the non-uniformity of the pore structure in the foam. Therefore, we have to focus on how to fabricate the stable foam, which was defined to have uniform pores with small diameters and high circularity in this study, with every fabrication method.
Pores become non-uniform and heterogeneous when the cell wall ruptures because of liquid metal flowing out from the cell wall [12,13]. This liquid flow is called drainage. Preventing drainage is one of the effective ways to keep the structure uniform and stable. The melt route, one of the fabrication methods, uses a thickening agent to prevent drainage by increasing the apparent viscosity of the melt [14]. Thickening agents, such as Al2O3, MgO, and SiC, are impurities in the base alloy and cause risk to lower the mechanical properties of the foam. Hanafusa et al. developed another fabrication method called the semi-solid route, which is one of the rheocasting ways [15]. There are some previous studies that use the ingot in the semi-solid state as a precursor [16]. However, the semi-solid route foams the ingot in the semi-solid state by adding a blowing agent into the semi-solid slurry directly. The important fact is that the semi-solid route does not use any additional thickening agent to increase the apparent viscosity of the melt but uses primary crystals as the thickening agent. As primary crystals are inherently included in the alloy, the addition of impurity elements is not necessary.
Interestingly, the primary crystals prevent drainage, but it is not only because of the increasing apparent viscosity of the melt. The average size of thickening agents for the proper fabrication of the melt route is located in the 10 to 50 μm range [17,18]. They are suitable to prevent drainage by increasing the apparent viscosity of the melt. On the other hand, the average size of the primary crystals is around 150 μm. As this value is quite large, it was considered that another factor would prevent the drainage instead of increasing the apparent viscosity of the mixture of the primary crystals and the melt. How the primary crystals prevent the drainage is that they stop the flow of the drainage physically by clogging the cell wall, which is a flow path of the drainage. Kuwahara et al. revealed that many primary crystals were clogged in cell walls, and the drainage in those cell walls was prevented by simulating the drainage in one cell wall using alloy films [19]. Our previous research also revealed that if the area ratio of the primary crystals exceeds the percolation threshold, the drainage in the whole foam is prevented by adopting the percolation theory to the structure of the foam [20,21]. However, it is not unclear whether the clogging effect still works when the volume fraction of the solid exceeds the percolation threshold and then increases further. It is possible that the cell walls will become too thick to keep the foam structure uniformly if the fraction of the primary crystals in one cell wall increases considerably. By revealing whether the increment of the volume fraction of the solid increases the number of clogged cell walls or increases the fraction of the primary crystals in the clogged cell walls, it will be clear that increasing the volume fraction of the solid is effective for the fabrication of aluminum alloy foam.
Another remarkable point is the need for high reproductivity for the fabrication of the aluminum alloy foam through the semi-solid route. As the temperature of the semi-solid slurry during the foaming process is influential for high reproducibility, severe temperature control is required to hold the temperature constant. However, it is possible that the temperature of the melt always differs a little from the setting temperature in every experiment, even under the same setting temperature with severe temperature control. If the temperature of the melt becomes much higher than the setting temperature, the pores become coarse because of the drainage. Therefore, the following information must be revealed: the allowance fluctuation of temperature from the setting temperature to fabricate the foams with high reproducibility and the influence of the increasing or decreasing temperature on the pore morphology.
It is considered that the aluminum–silicon alloy is suitable for this study because it has already been used in many previous studies for fabrication of the aluminum alloy foams [22,23]. The porosities of the aluminum–silicon alloy foams via the melt route were around 60% to 70%, and the pore diameters were around 2 mm to 7 mm. The plateau stress of the aluminum–silicon foam with around 70% porosity was reported as around 20 MPa, and the energy absorption efficiency was around 30% [24]. Moreover, aluminum alloy foams can be easily fabricated by recycling the waste aluminum–silicon alloy, which is commonly distributed in the marketplace as an industrial material [25]. Therefore, we adopt the aluminum–silicon alloy as a base alloy for the fabrication of the foam in this study.
The objectives of this study are the assessment of reproducibility and the influence of increment of the volume fraction of the solid on the clogging effect. To achieve this objective, the aluminum alloy foams were fabricated through the semi-solid route under the same setting of fabrication conditions. After that, the volume fraction of the solid calculated from the actual temperature of the melt and pore morphologies were compared. Finally, the influence of changing the volume fraction of the solid on the clogging effect was discussed by adopting the percolation theory. There is no precedent for the expected outcomes in this study, such as the reproducibility of the semi-solid route and the influence of fluctuating volume fraction of the solid on the pore morphology in the semi-solid route. Moreover, the semi-solid route has not been studied systematically with a temperature control. This study will offer new insights into the fabrication conditions of the semi-solid route.

2. Materials and Methods

Firstly, the fabrication apparatus that was used in this study is explained in Section 2.1. Secondly, the fabrication processes of the aluminum alloy foam are indicated in Section 2.2. In this section, the chemical composition of used aluminum alloy and high-purity air is also shown. The five aluminum alloy foams were fabricated through the semi-solid route under the same setting conditions. After the fabrication, each foam was analyzed to measure the porosity, pore diameter, and circularity of the cross-section of the foam.

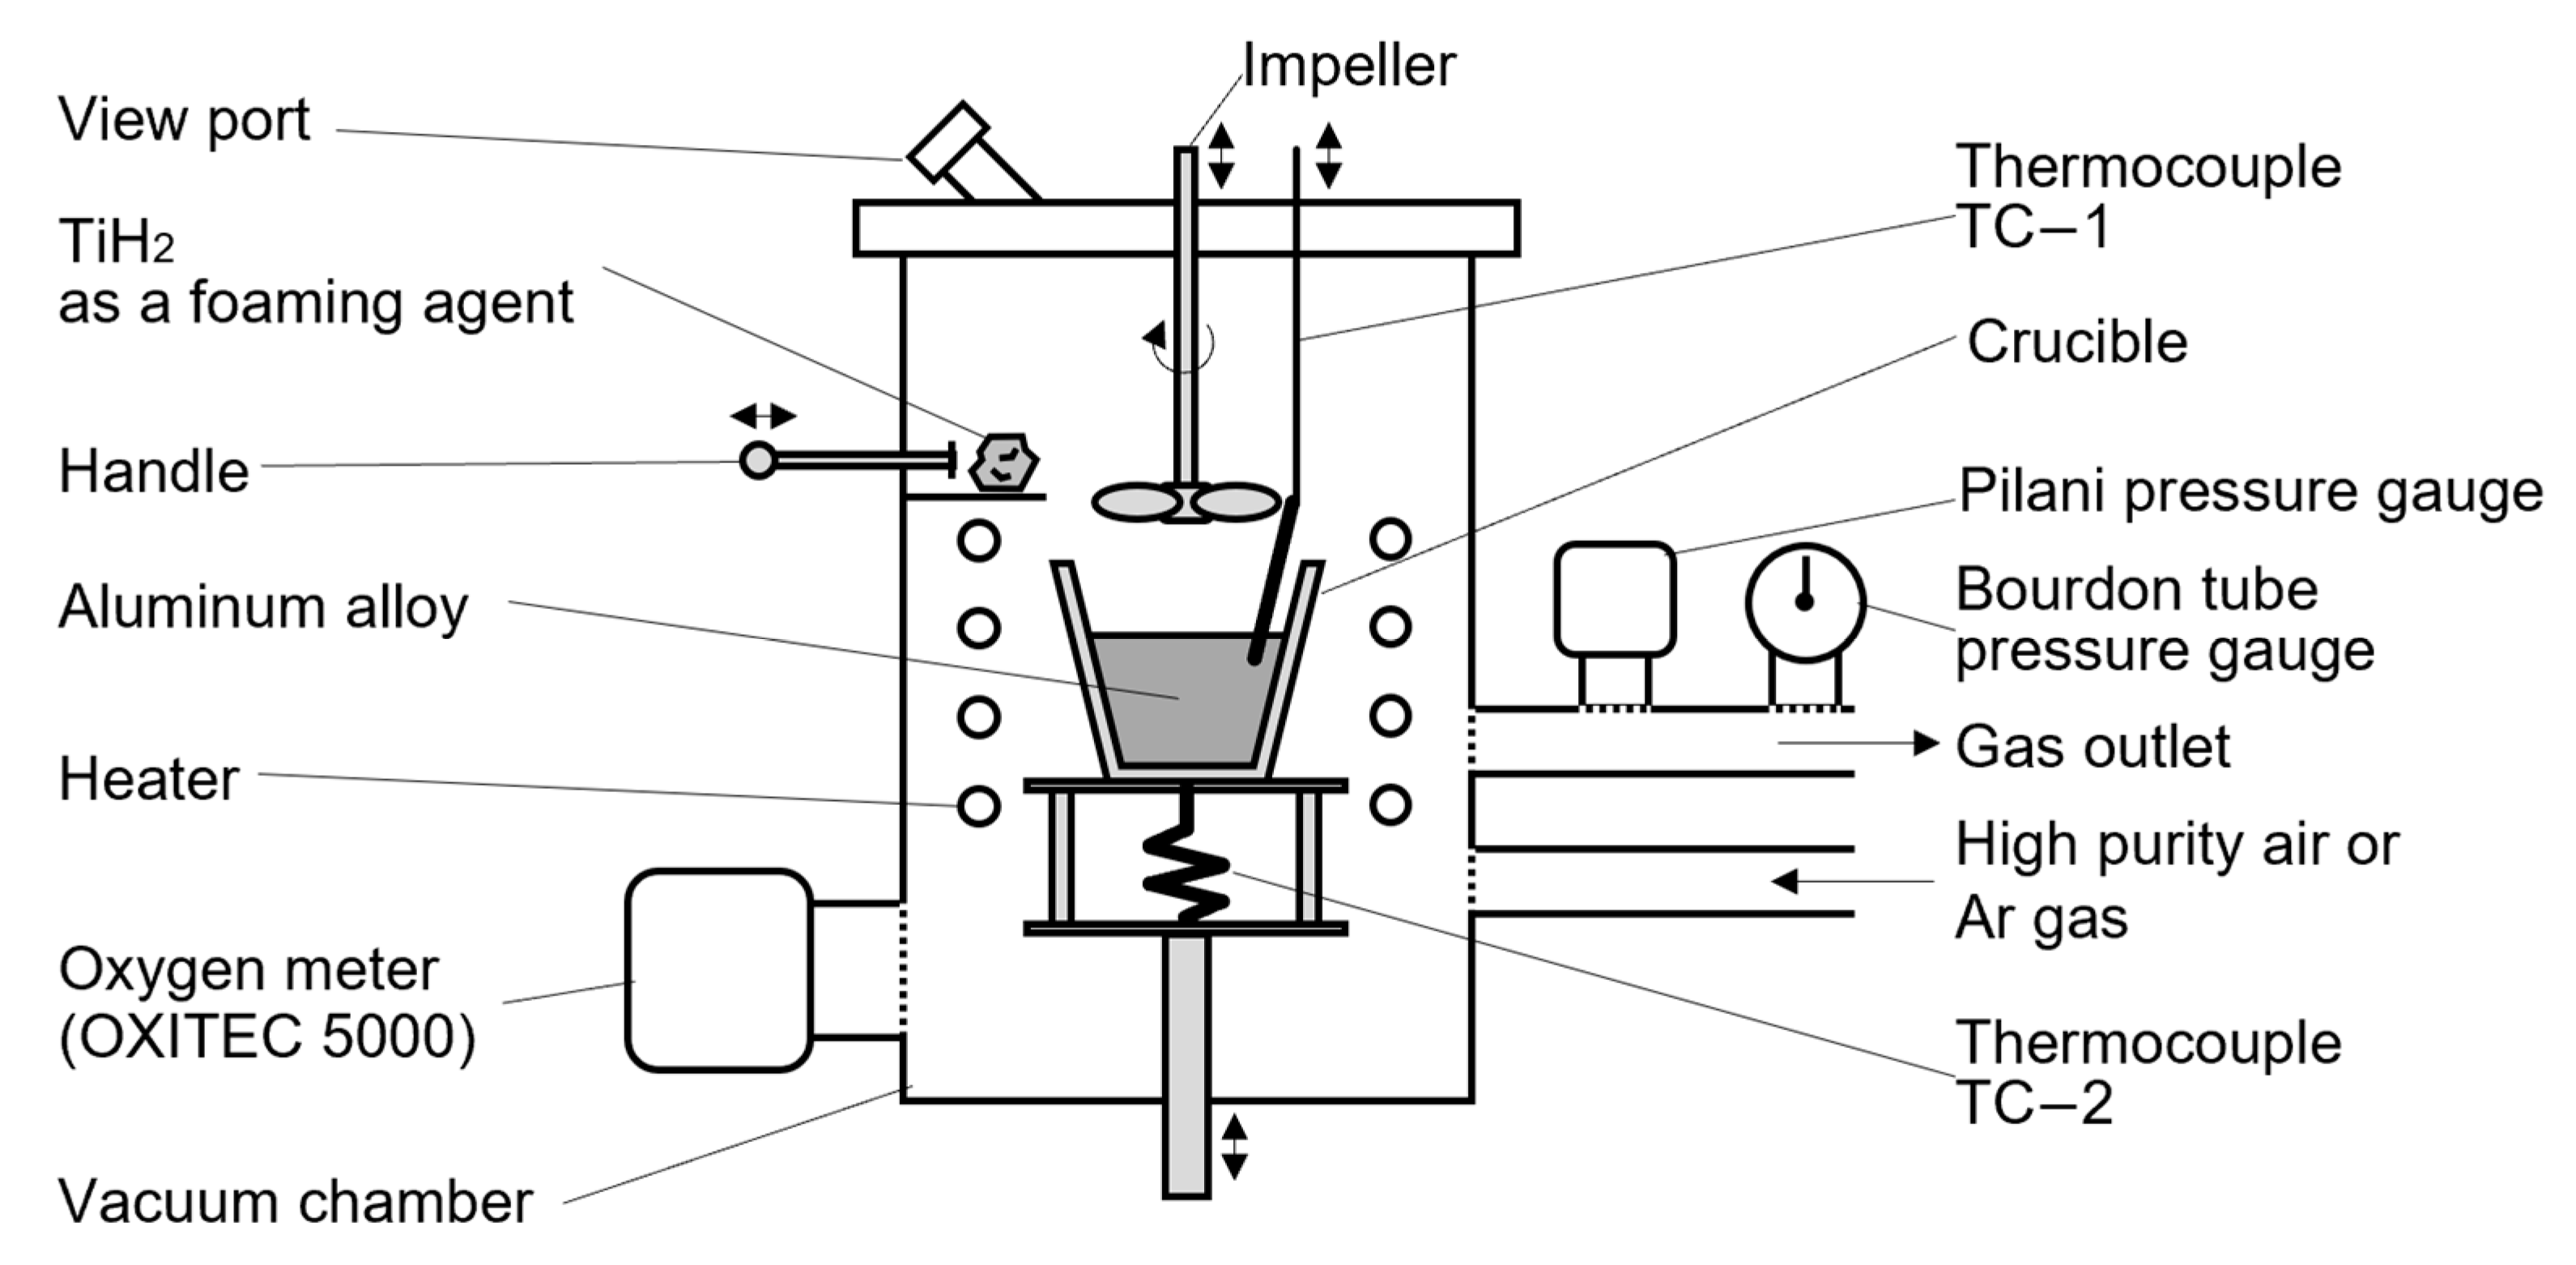
2.1. Fabrication Apparatus

Figure 1 shows a scheme of the electronic furnace used in this study. The furnace was installed in a vacuumed chamber so that the alloy inside would not be affected by outside air. The chamber was connected to a vacuum pump and gas cylinders of high-purity air and Ar gas. A Bourdon tube pressure gauge (AT1/4R×60×-0.1MPa, Migishita Seiki Mfg. Co., Ltd., Hyogo, Japan) and a Pilani pressure gauge (M-350PG-SD, Canon Anelva Corp., Kanagawa, Japan) were set to measure the total pressure in the furnace Pt. A zirconia-type oxygen meter (OXITEC5000, ENOTEC GmbH, Nordrhein-Westfalen, Germany) was set to measure the concentration of oxygen C in the furnace.
The two type-K thermocouples TC−1 and TC−2 were set inside the furnace to measure the temperatures of the melt T1 and the bottom of the crucible T2, respectively. The edge of the TC−2 was pressed against the center of the bottom of the crucible using the elastic force of the curved TC−2. TC−2 worked as an indirect measurement device instead of TC−1, which cannot measure the accurate temperature of the alloy during the foaming process because TC−1 may measure the temperature of the gas inside a pore. The heater was controlled by a PID controlling system, which used T2 as a feedback temperature.

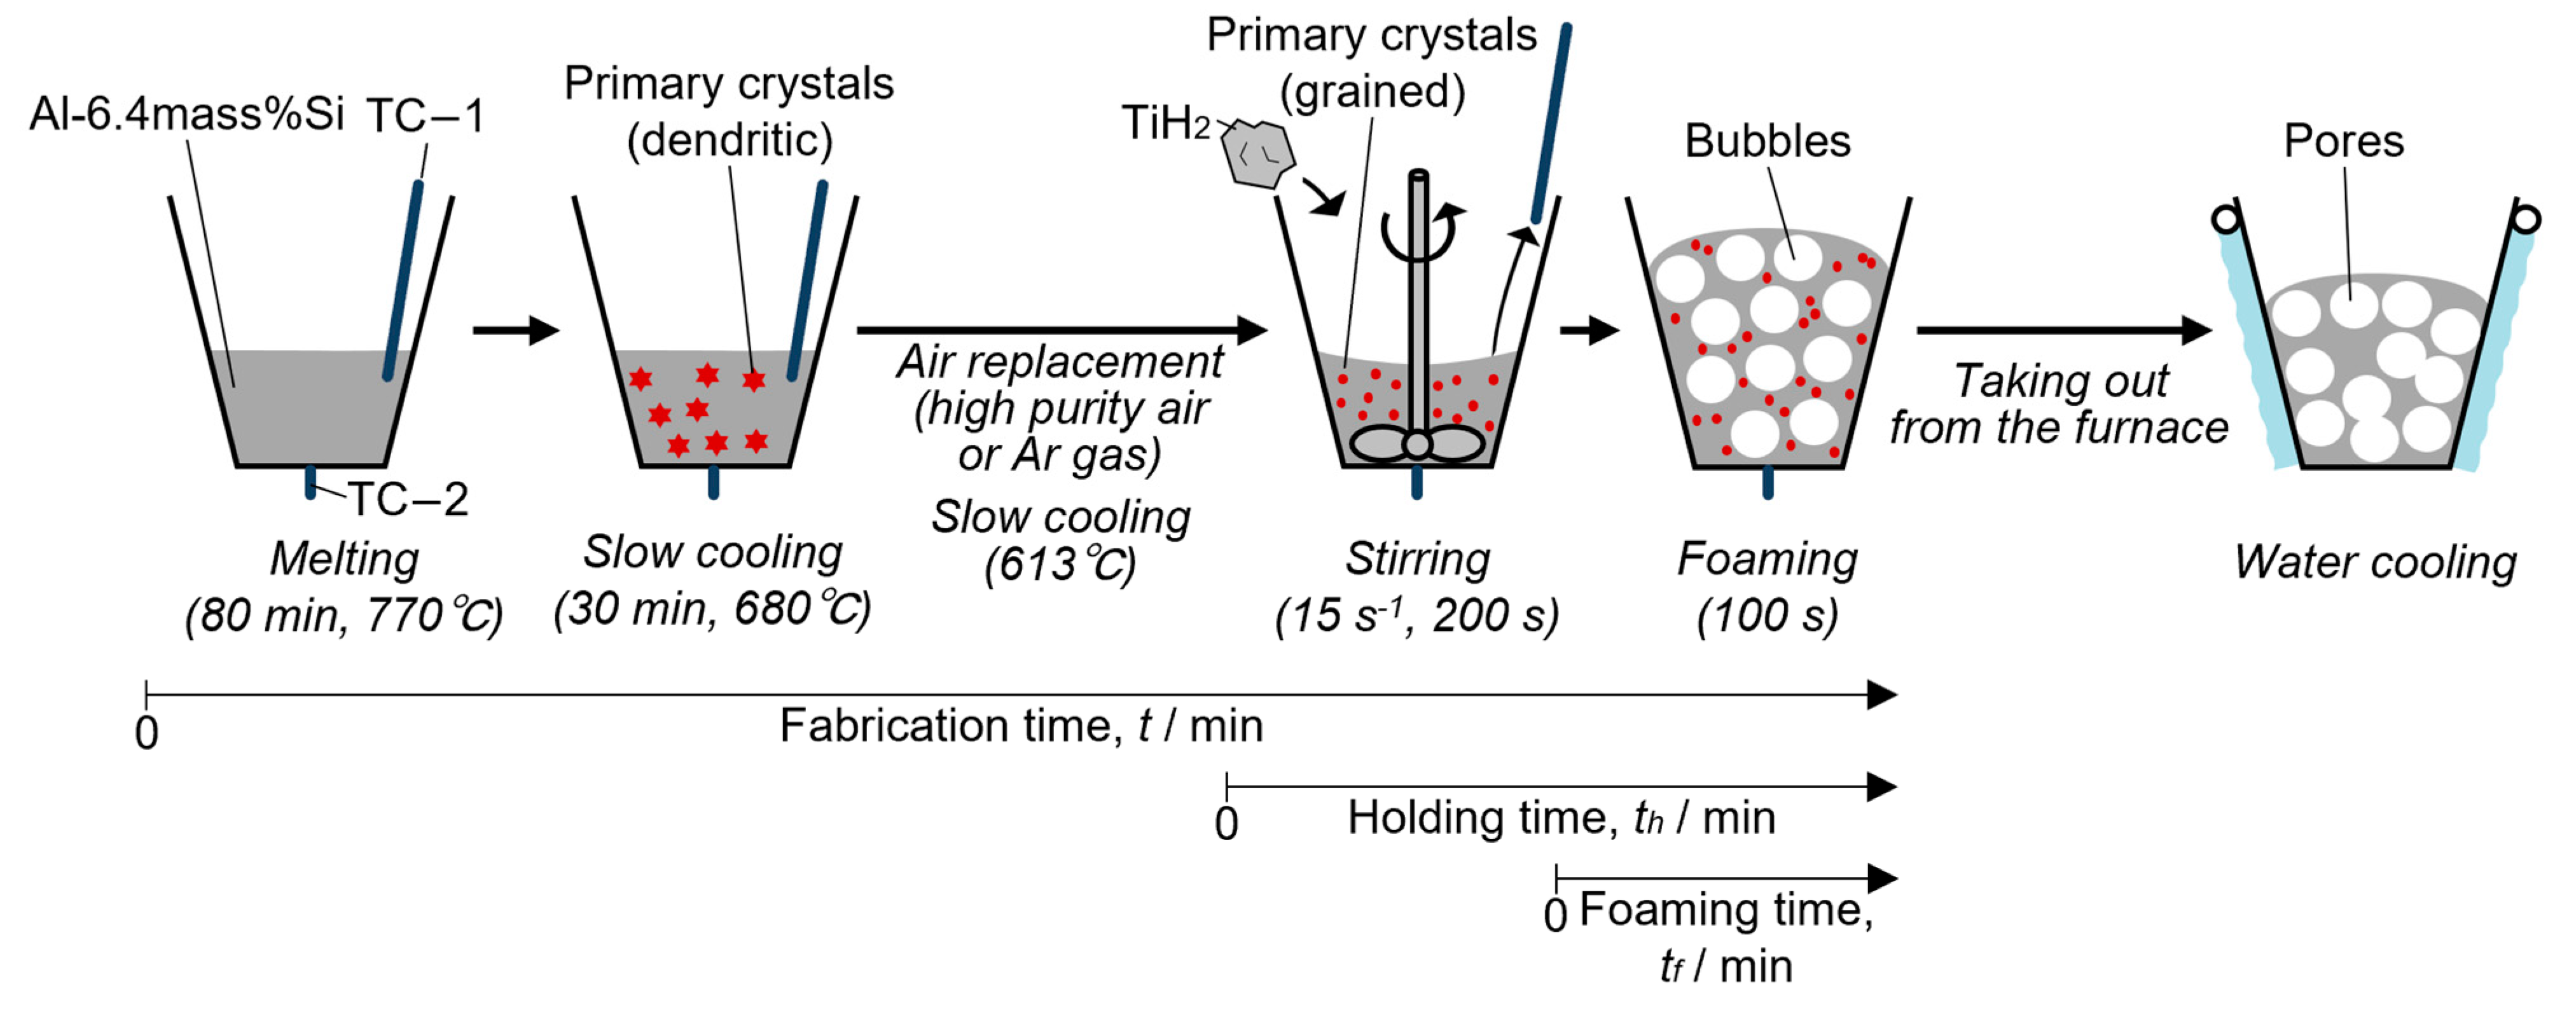
2.2. Fabrication of Aluminum Alloy Foam through the Semi-Solid Route

Figure 2 shows a schematic illustration of the fabrication processes of Al-Si alloy foam through the semi-solid route. Five aluminum alloy foams were fabricated through the semi-solid route under the same setting conditions. The processes of the semi-solid route conducted in this study are indicated as follows. Al-6.4mass%Si alloy was used as a base alloy for the fabrication so that the volume fraction of the solid should be around 15% at 613 °C [26]. Then, 100 g of Al-6.4mass%Si alloy supplied by UACJ Corporation (Aichi, Japan) was weighed and set into the stainless crucible coated with ceramic inside. Table 1 shows the chemical composition of the Al-6.4mass%Si alloy described in the mill sheet provided by the supplier. During the entire fabrication process, TC−1 and TC−2 measured the temperatures at the same time.
First, the Al-6.4mass%Si alloy was heated in the vacuumed furnace for around 80 min until T2 reached 770 °C. The aluminum alloy was completely melted via this process. Second, the molten alloy was cooled slowly, taking 30 min until T2 reached around 680 °C. After that, the high-purity air with 20% oxygen was inserted into the furnace to replace the remained air in the furnace. The high-purity air was provided from a commercial gas cylinder purchased from Suzuki Shokan Co., Ltd. (Saitama, Japan) Table 2 shows the gas composition of the high-purity air described in the mill sheet provided by the supplier. As the high-purity air includes little H2O inside, there will not be any pores made from water vapor. Replacement of the air, including the processes of vacuuming and inserting was repeated three times to avoid the influence of the outside air. The gas was inserted until the pressure became 0.1 MPa.
The molten alloy was slowly cooled again to crystalize the primary crystals until T1 reached the setting temperature, which aimed 613 °C. At this temperature, the volume fraction of the solid of the semi-solid slurry fs was 15%, calculated using thermodynamics calculation software Thermo-calc 2020a (Thermo-Calc Software, Stockholm, Sweden). After T1 became constant at the set temperature, TC−1 was pulled out. Since T1 during the foaming could not be measured directly hereafter, the calibrated alloy temperature T1′ was calculated via the calibration equation. The calibration equation was generated by calculating the coefficients α and β, which satisfied Equation (1) using T1 and T2 measured in the entire fabrication process.
T 1 ° C = α T 2 ° C + β
The impeller was lowered to just above the surface of the semi-solid slurry in order to preheat the impeller. Two packs of 1 g TiH2 as a blowing agent in a 10 × 10 mm2 aluminum foil were added into the semi-solid slurry immediately after the removal of TC−1. TiH2 was placed in the electronic furnace in advance, as shown in Figure 1. The impeller stirred the semi-solid slurry at a rotational speed of 15 s−1 for 100 s. After stirring, the impeller was pulled out. T2 was controlled to be constant in the range of ±0.5 °C from the temperature just before the addition of TiH2 for 5 min. Then, the slurry was held for 200 s for the foaming. After foaming, the foamed slurry was taken out from the furnace and solidified by water cooling immediately. This experiment was repeated five times under the same setting fabrication conditions.

2.3. Analysis of Fabricated Foams

The densities of five fabricated foams ρp were measured using Archimedes’ principle with the following steps. First, the mass of the foam in air Mair was measured using a spring balance. Second, the foam was sunk into the water completely. The mass of the foam in the water Mwater was measured using a spring balance. Finally, the density ρp was calculated from Equation (2).
ρ p = M a i r M a i r M w a t e r × ρ H 2 O
Here, ρH2O is the density of H2O at room temperature, 1 × 10³ kg/m3. Each porosity p was calculated from Equation (3) using the density of Al-6.4mass%Si alloy ρnp of 2.67 × 10³ kg/m3 [27].
p ( % ) = 1 ρ p ρ n p × 100
Each fabricated foam was cut on a plane through the center. The cross-section of the foam was observed. The equivalent pore diameter of the cross-sectional pore d and the pore circularity e were measured from the cross-sectional image using the image analysis software ImageJ 1.53c (National Institutes of Health, Bethesda, MD, USA). Also, the distributions of d and e were obtained. After that, the half specimens were cut into six pieces, and each specimen was filled in epoxy resin. The cross-section was polished with the proper polishing process using waterproof abrasive papers and abrasive agents. The cross-section was also etched with Weck’s reagent, which can visualize the solute segregation in a primary crystal of Al-Si alloy [28]. Weck’s reagent was prepared by mixing 4 g KMnO4, 1 g NaOH, and 100 g distilled water [29]. After the etching, the microstructure of each foam on the cross-section before and after the etching was observed from the microscopic images to recognize the primary crystals.

3. Results

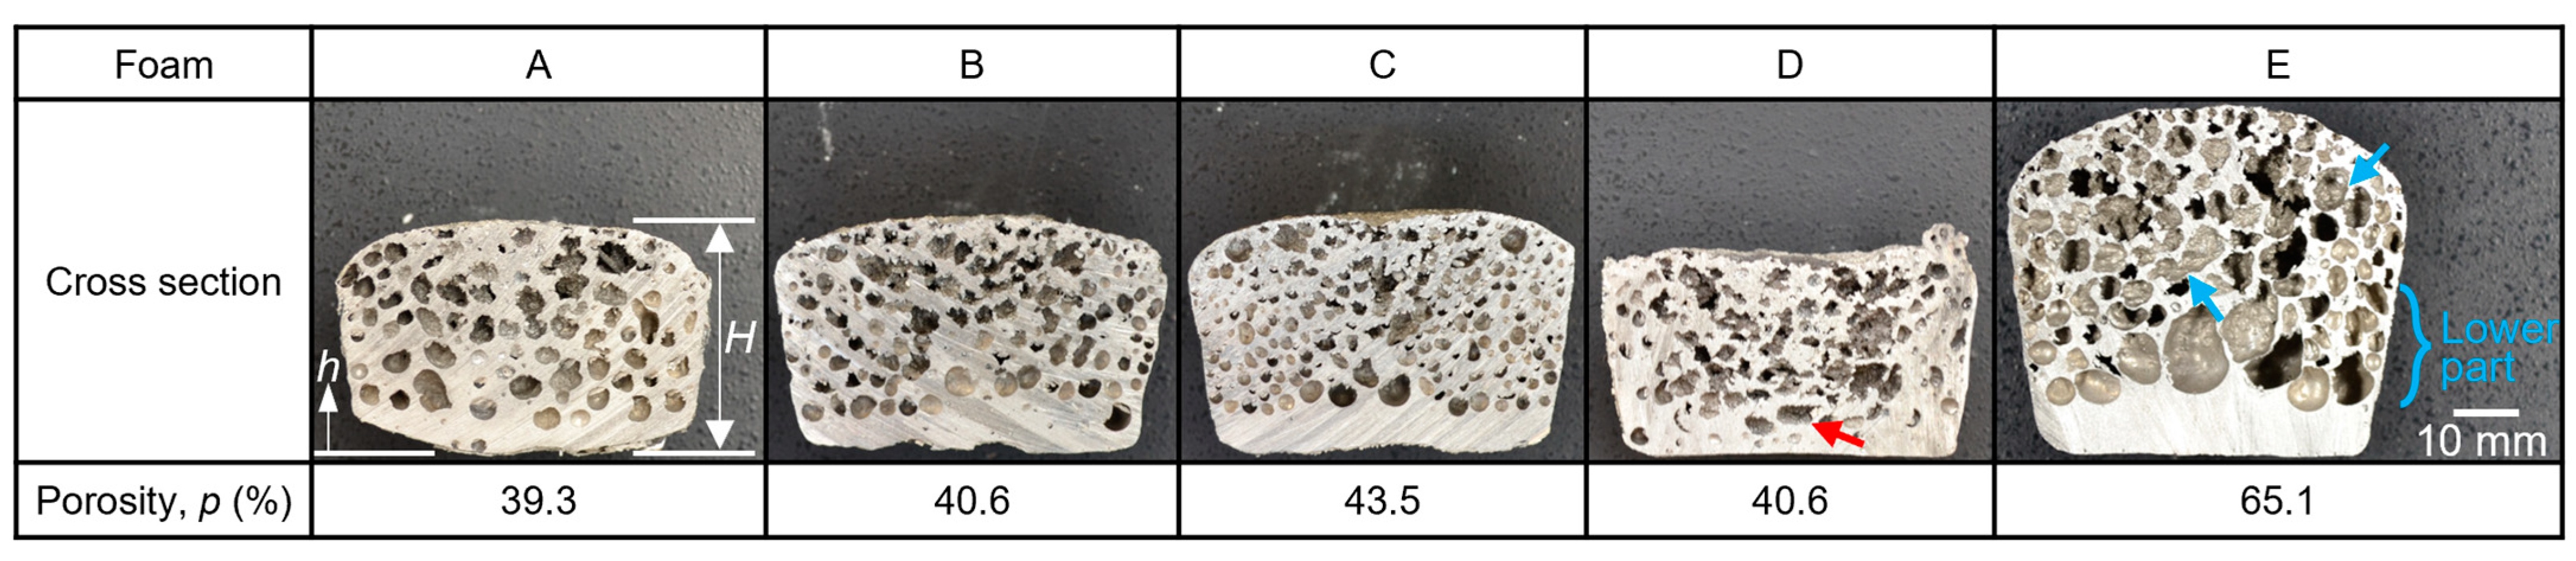
3.1. Fabricated Aluminum Alloy Foams

Figure 3 shows the cross-sectional images of aluminum alloy foams fabricated at the same setting temperature. The porosities p are indicated under the corresponding foam. The foams A, B, and C seem to have uniform and stable pores inside because the pores seem to have small diameters and high circularity. The foam D has flattened pores, which seem to collapse after foaming, as indicated by the red arrow. The foam E has connected pores indicated with the light blue arrows. In addition, there are large pores, especially in the lower part of the foam E.
The porosity p has varied quite a bit through the foams A, B, C, and D. The relative standard deviation σp of the foams A, B, C, and D was calculated as 4% using Equation (4). Here, the parameter pi is each porosity of the foams A, B, C, D, and E. The parameter p ¯ is an average of the porosities.
σ p   ( % ) = i = 1 5 ( p i p ¯ ) 2 5 1 p ¯ × 100
On the other hand, the relative standard deviation of all foams was calculated as 23%, which is around six times larger than the value calculated except for the foam E. The foam E had a larger porosity compared with others. This is because of the large and low circularity pores of the foam E.
Figure 4 shows the distribution of the pore morphologies of each fabricated foam in the height direction. The top position of the colored area on each graph shows the maximum height H of each foam. As shown in Figure 4, the distributions of the circularity e of the foams A, B, and C are biased towards 1.0. Also, the foams A, B, and C have small pores inside, as indicated in the distribution of the diameter d. Therefore, the pores in the foams A, B, and C are recognized as stable pores.
On the other hand, the distributions of circularity e of the foams D and E spread across the wide area compared with the distribution of foams A, B, and C. These distributions represent the actual coarse pores of foams D and E. The flattened pores in the foam D and the connected pores in the foam E lower the circularity e. The average pore diameters of the foams D and E are around 8.1 mm and 15.5 mm, respectively, while that of the foams A, B, and C are around 3.4 mm, 2.6 mm, and 2.5 mm, respectively. The average pore diameters of the foams A, B, and C are close to the previous research [23]. The plot of the foam E placed around 60 mm in diameter is the largest pore located in the lower part of the foam, as shown in Figure 3. This pore broadens the distribution of the pore diameter d. Therefore, the pores in the foams D and E are not stable. The pores that have low circularity and large diameter are recognized as in the poor state, while pores with small diameter and high circularity are recognized as stable pores.

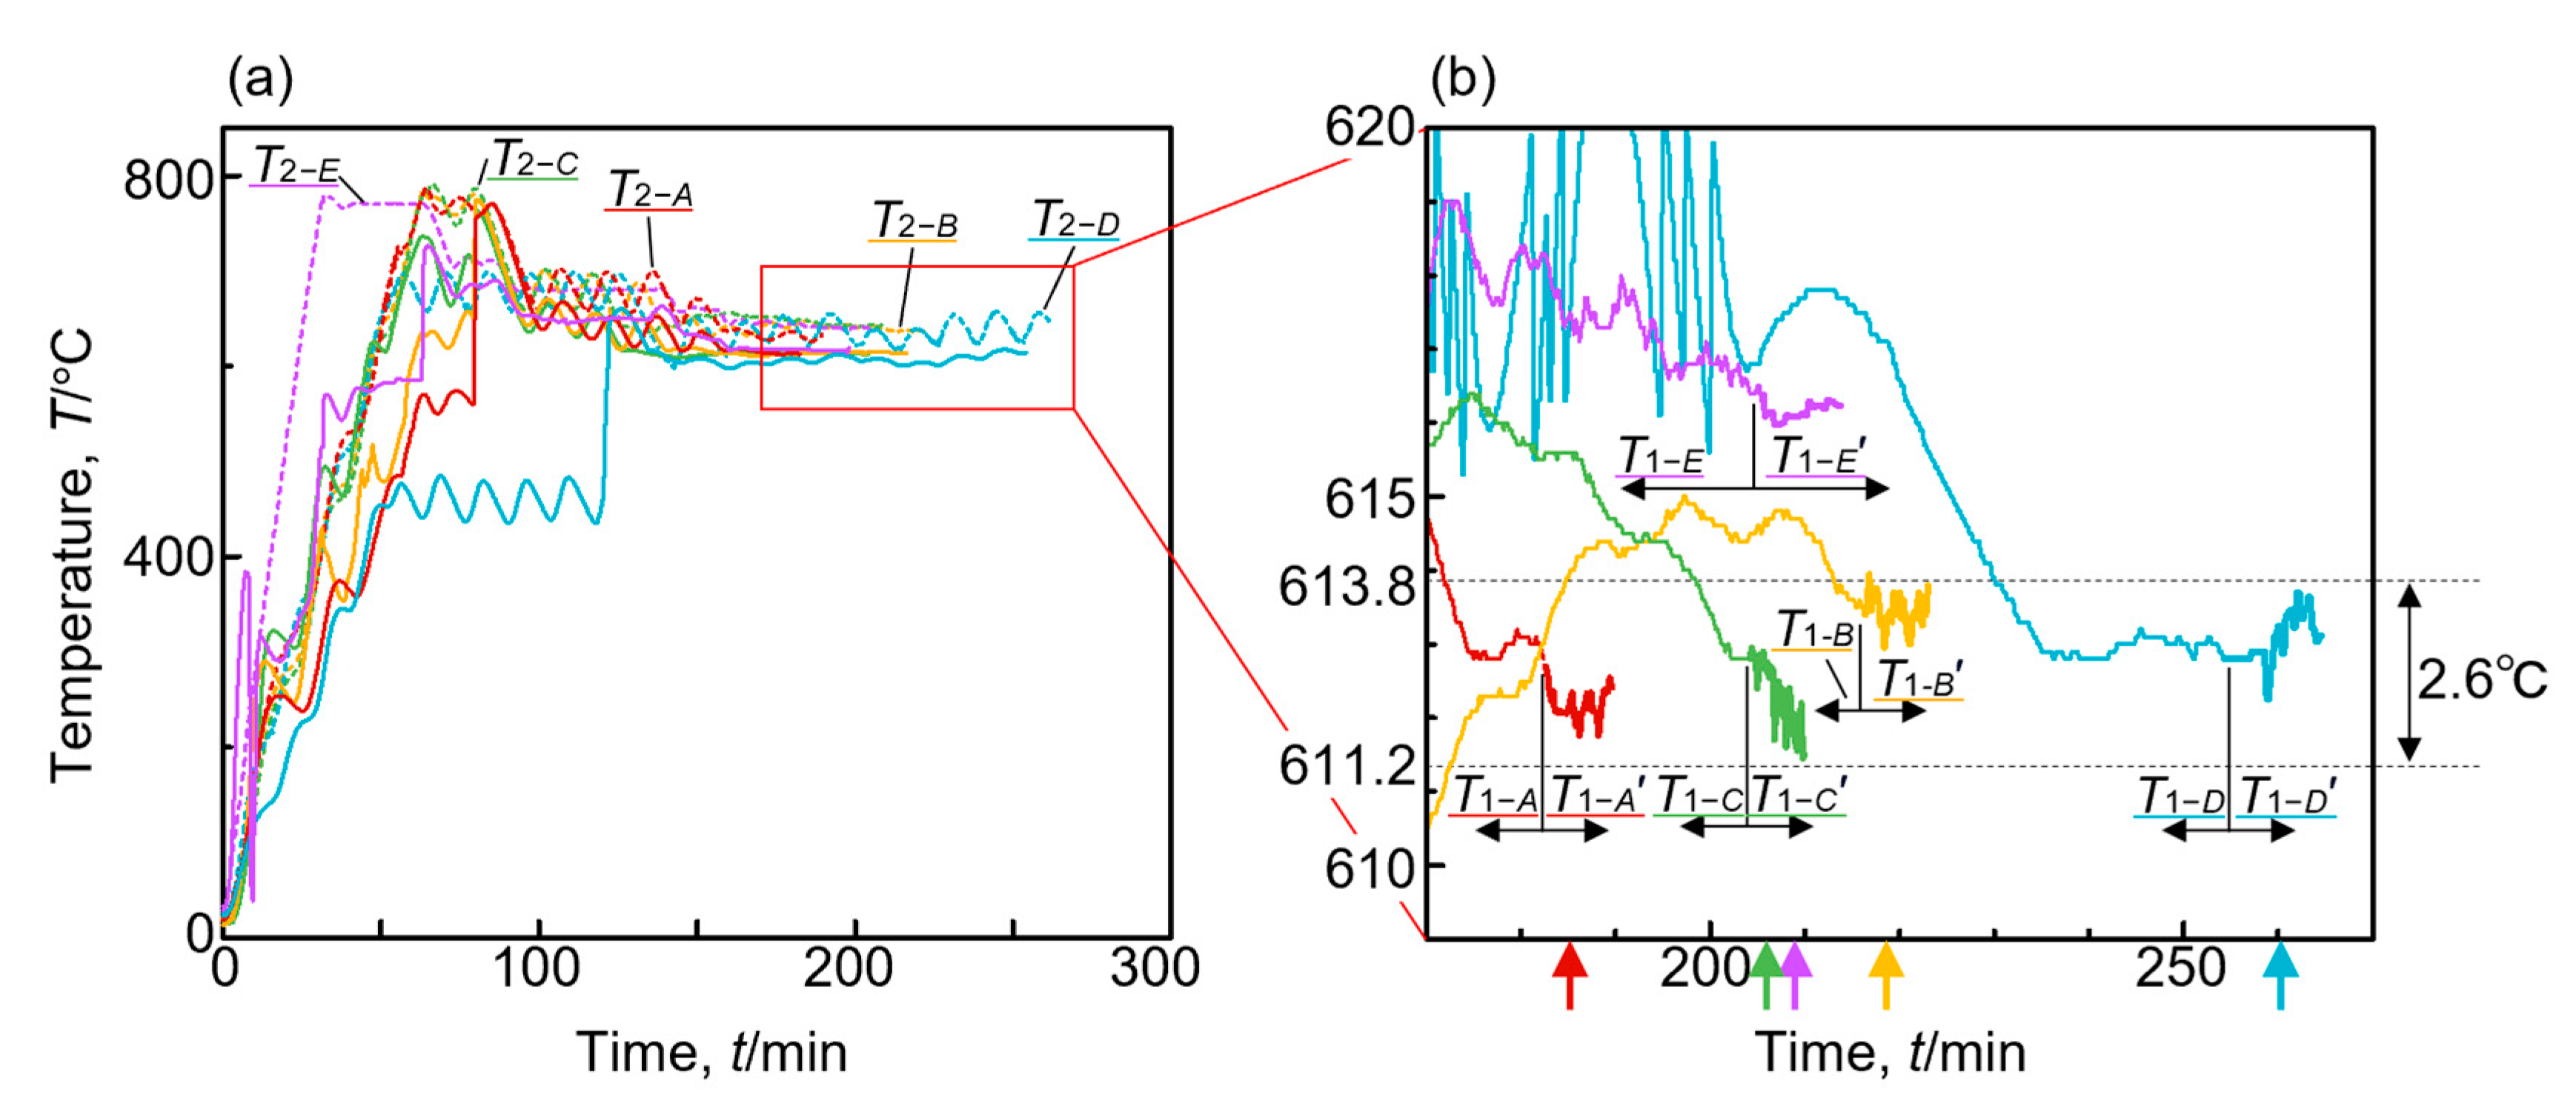
3.2. Temperature and Pressure history during fabrication

Figure 5 shows the temperature history of the fabrication process conducted in this study. Figure 5a shows the entire fabrication process, and Figure 5b shows the close-up history of around 170 min to 270 min. Each color indicates each foam, which was already shown in Figure 3 and Figure 4. Solid lines indicate the temperature of the melt T1, and dashed lines indicate the temperature of the bottom of the crucible T2. Thick lines indicate the calibrated temperature of the melt T1′, as shown in Figure 5b. The arrows vertical to the horizontal axis indicate the removal of the impeller and the start of the foaming process.
The calibration temperature T1′ was calculated by calibrating Equation (5) obtained by substituting coefficients α and β into Equation (1).
T 1 ° C = 0.96 T 2 ° C + 7.8
The coefficients in Equation (1) were determined to coincide with the history of T1 in 5 min just before the foaming. Figure 6 shows the relation between the temperature of the melt T1−A and the calibrated temperature T1−A during the fabrication of the foam A. The determination coefficient R2 was calculated as 0.974. As the determination coefficient indicated, the calibration equation was well matched for the prediction of the temperature of the melt during foaming.
Each temperature history had a different fabrication time, which started when the heater was turned on and ended when the foaming process ended. The results indicated that the temperature oscillation lengthens the time for controlling the temperature constant. As indicated in the right-side graph, each foaming temperature differed slightly. The foam E has the highest temperature of the melt during foaming. Also, the foam D has the longest fabrication time and temperature oscillation. The foams A, B, and C seem to have quite similar temperature histories throughout the entire fabrication process.

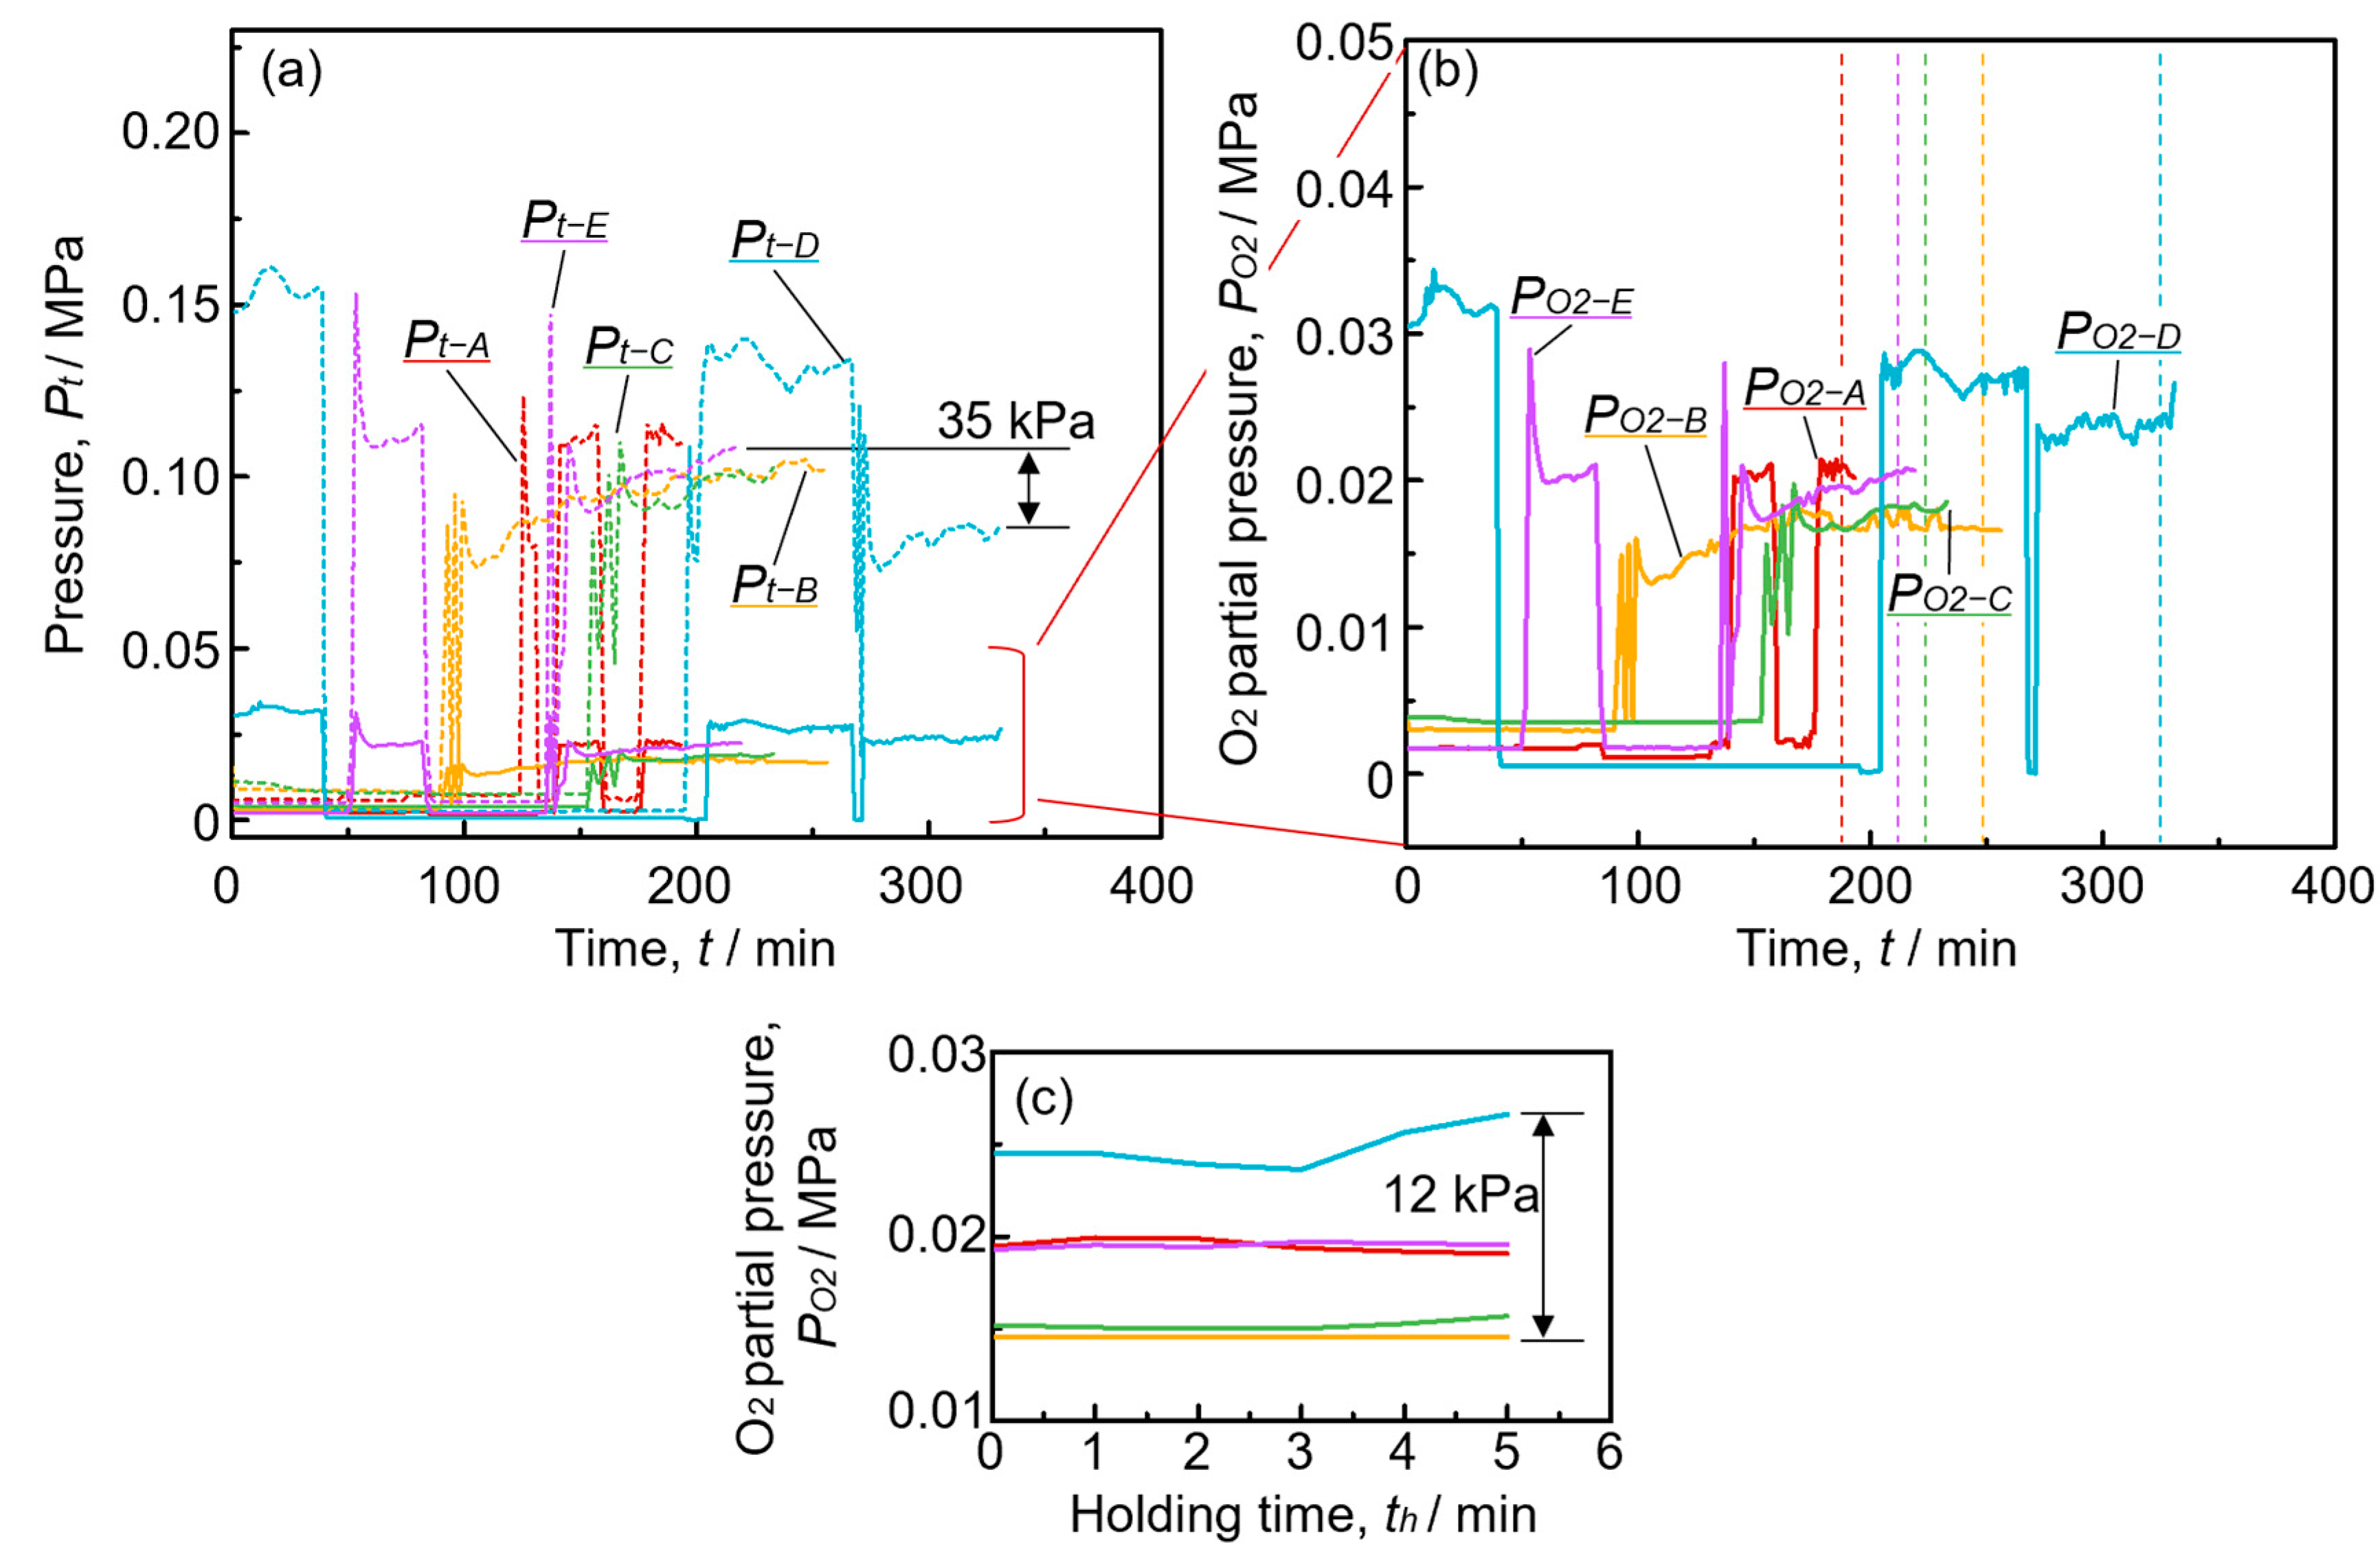
3.3. Pressure History during Fabrication

Figure 7a shows the total pressure Pt measured using the Pilani pressure gauge and O2 partial pressure PO2 calculated by multiplying Pt by the concentration of oxygen C. Figure 7b shows the close-up graph of O2 partial pressure PO2. Each vertical dashed line indicates the start of the holding time of each foam. Figure 7c shows the O2 partial pressure PO2 during the foaming process on the axis of the holding time, which starts after the addition of TiH2 and ends when the foaming process ends. Each color corresponds to the fabricated foam, as shown in previous figures. According to the results, when the foaming process ended, the highest partial pressure was the foam D, and the lowest partial pressure was the foam B. The difference between the highest and the lowest pressure was 12 kPa. Also, the difference between the highest total pressure and the lowest total pressure when the foaming process ended was 35 kPa.

4. Discussion

4.1. Influence of H2 Generated through Decomposition of TiH2 during the Foaming Process

As mentioned in Section 3.3, the difference between the highest and lowest O2 partial pressure PO2 when the foaming process ended was 12 kPa. In addition, the relative standard deviation of the concentration of oxygen C of each foam when the foaming process ended was calculated as small as 8%.
According to Figure 7, the total pressure Pt during the foaming process of each fabrication increased by around 0.1 kPa. In this process, TiH2, as the blowing agent added into the semi-solid slurry, was thermally decomposed and generated H2 gas. If 2 g of added TiH2 is thermally decomposed, the generated H2 gas is calculated to be around 8.9 × 10⁻⁴ m3. The volume of the furnace is around 0.19 m3. Therefore, the pressure, which is raised during foaming, can be calculated as 0.5 kPa using Boyle–Charles’s law. However, there is also TiH2, which remains undecomposed in the foam [30]. Therefore, the amount of the generated H2 gas would have been much smaller. The results indicate that the increment of the total pressure Pt was caused by the generated H2 gas. On the other hand, it is considered that the concentration of oxygen C was not affected by the generated H2 gas. The O2 partial pressure PO2 changed during foaming because it is affected by changes in the total pressure Pt. In fact, the concentration of oxygen C changed little. Therefore, it is considered that the generated H2 gas remained in the foam as pores.

4.2. Reproductivity among Multiple Experimental Runs through the Semi-Solid Route

As indicated in Figure 5, even though the fabrication processes and conditions were controlled, there were still differences in the temperature history between the fabricated five foams. To discuss the influence of the increment of the volume fraction of the solid on the clogging effect, an allowance range of fabrication conditions to obtain high reproductivity through the semi-solid route must be provided. To confirm the allowance of fabrication conditions, the foams A, B, and C are compared because their temperature histories are remarkably similar to each other, especially in the cooling and foaming processes. The relative standard deviation of the porosity σp was calculated as 5%. Also, the relative standard deviation of the average circularity σc and that of the average equivalent pore diameter σd were calculated as small as 11% and 5%, respectively. Therefore, it is considered that the foams A, B, and C were fabricated under the high reproductivity fabrication process. The calibrated temperature T1′ of the foams B and C when the foaming process ended were 613.8 °C and 611.2 °C, respectively. The difference between the two temperatures is 2.6 °C, as shown in Figure 5. According to the phase diagram calculated by Thermo-Calc, there was a change of 5% in the volume fraction of the solid within the foams A, B, and C. Therefore, it can be considered that the fabrication processes through the semi-solid route conducted in this study show high reproductivity when the change in the volume fraction of the solid is under 5%.

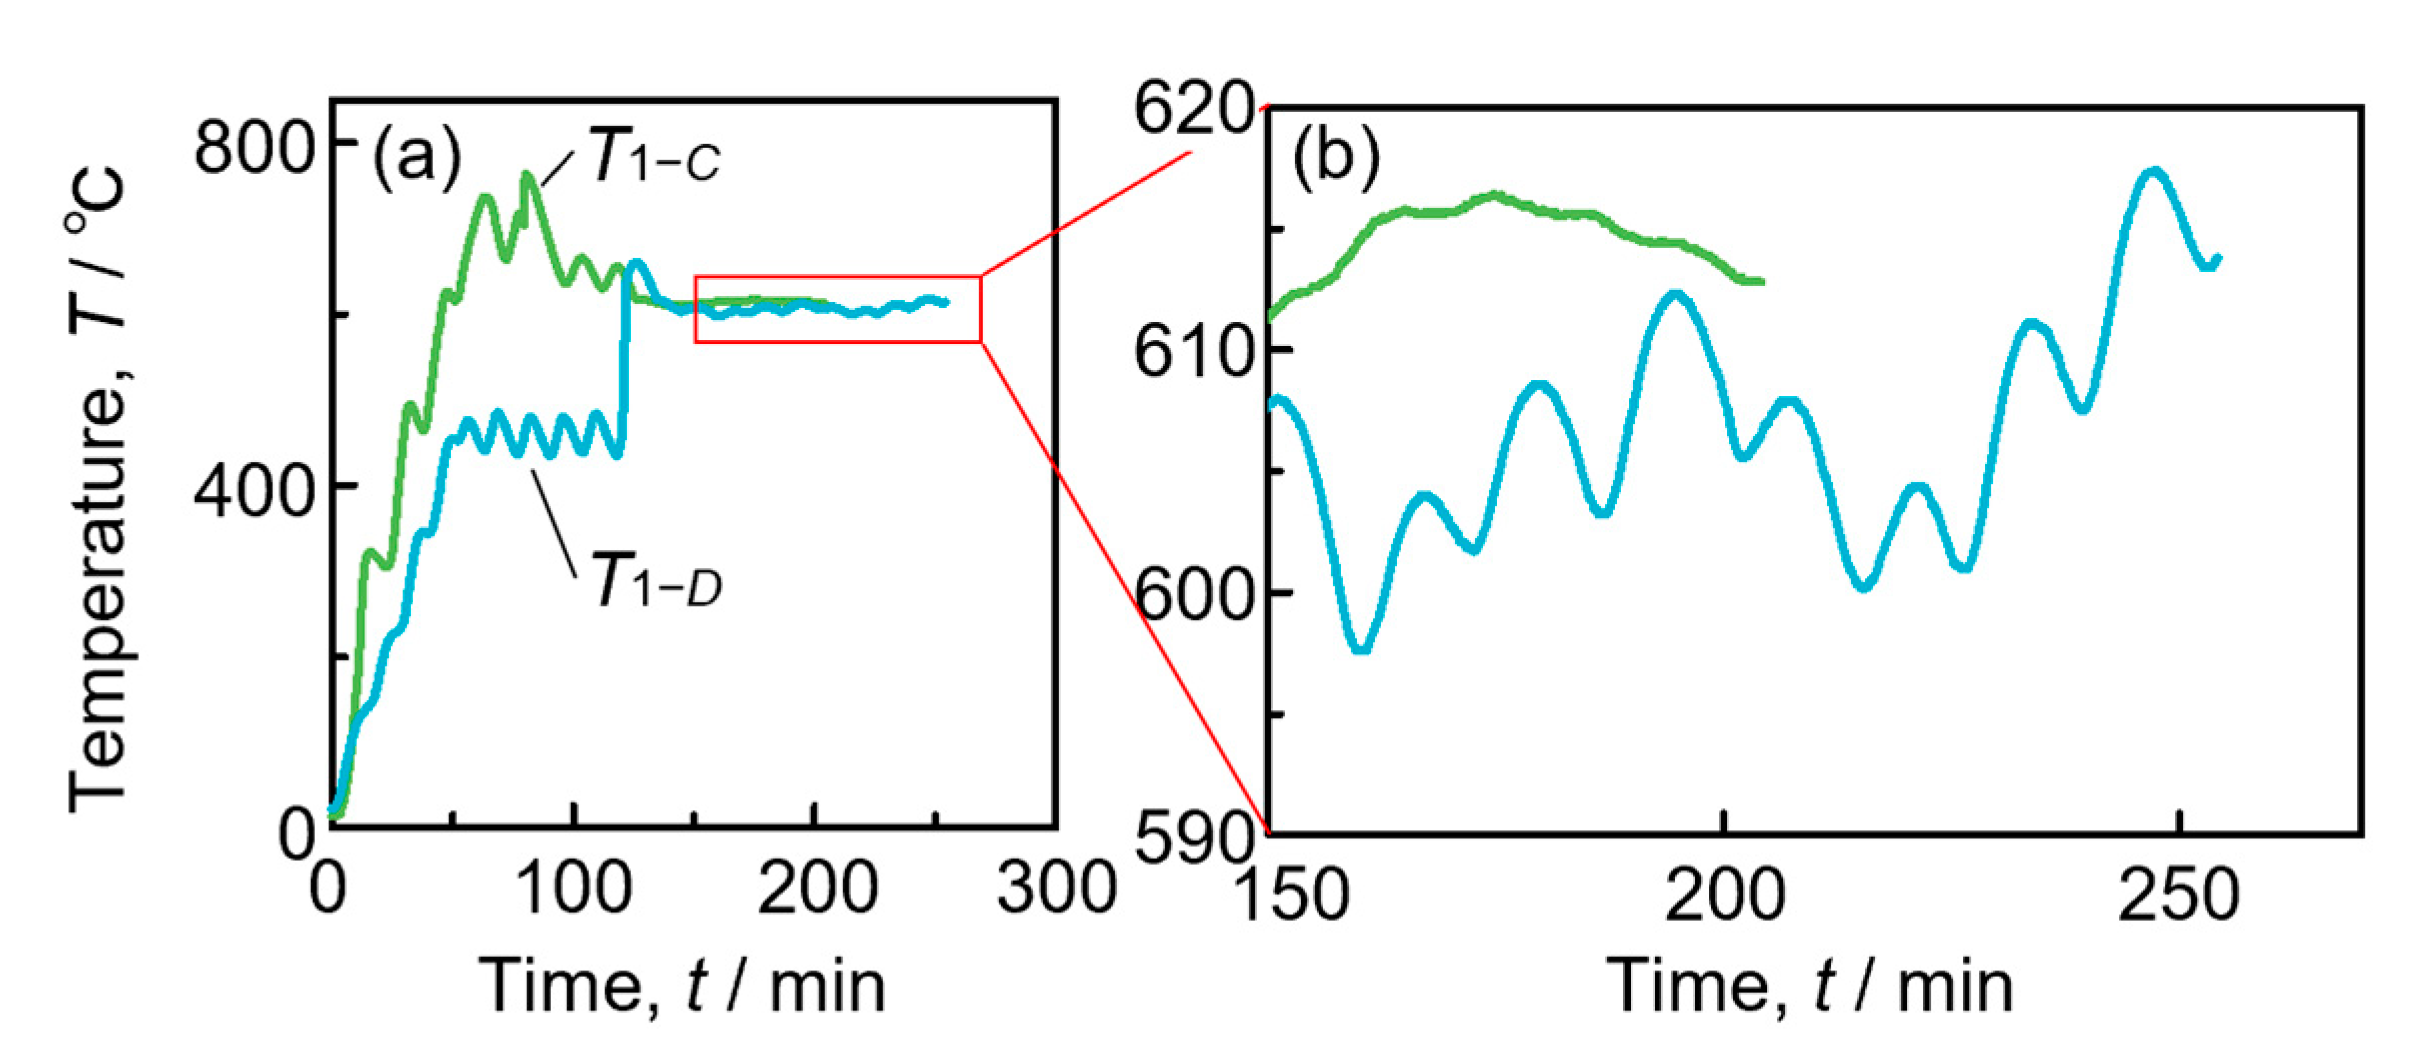
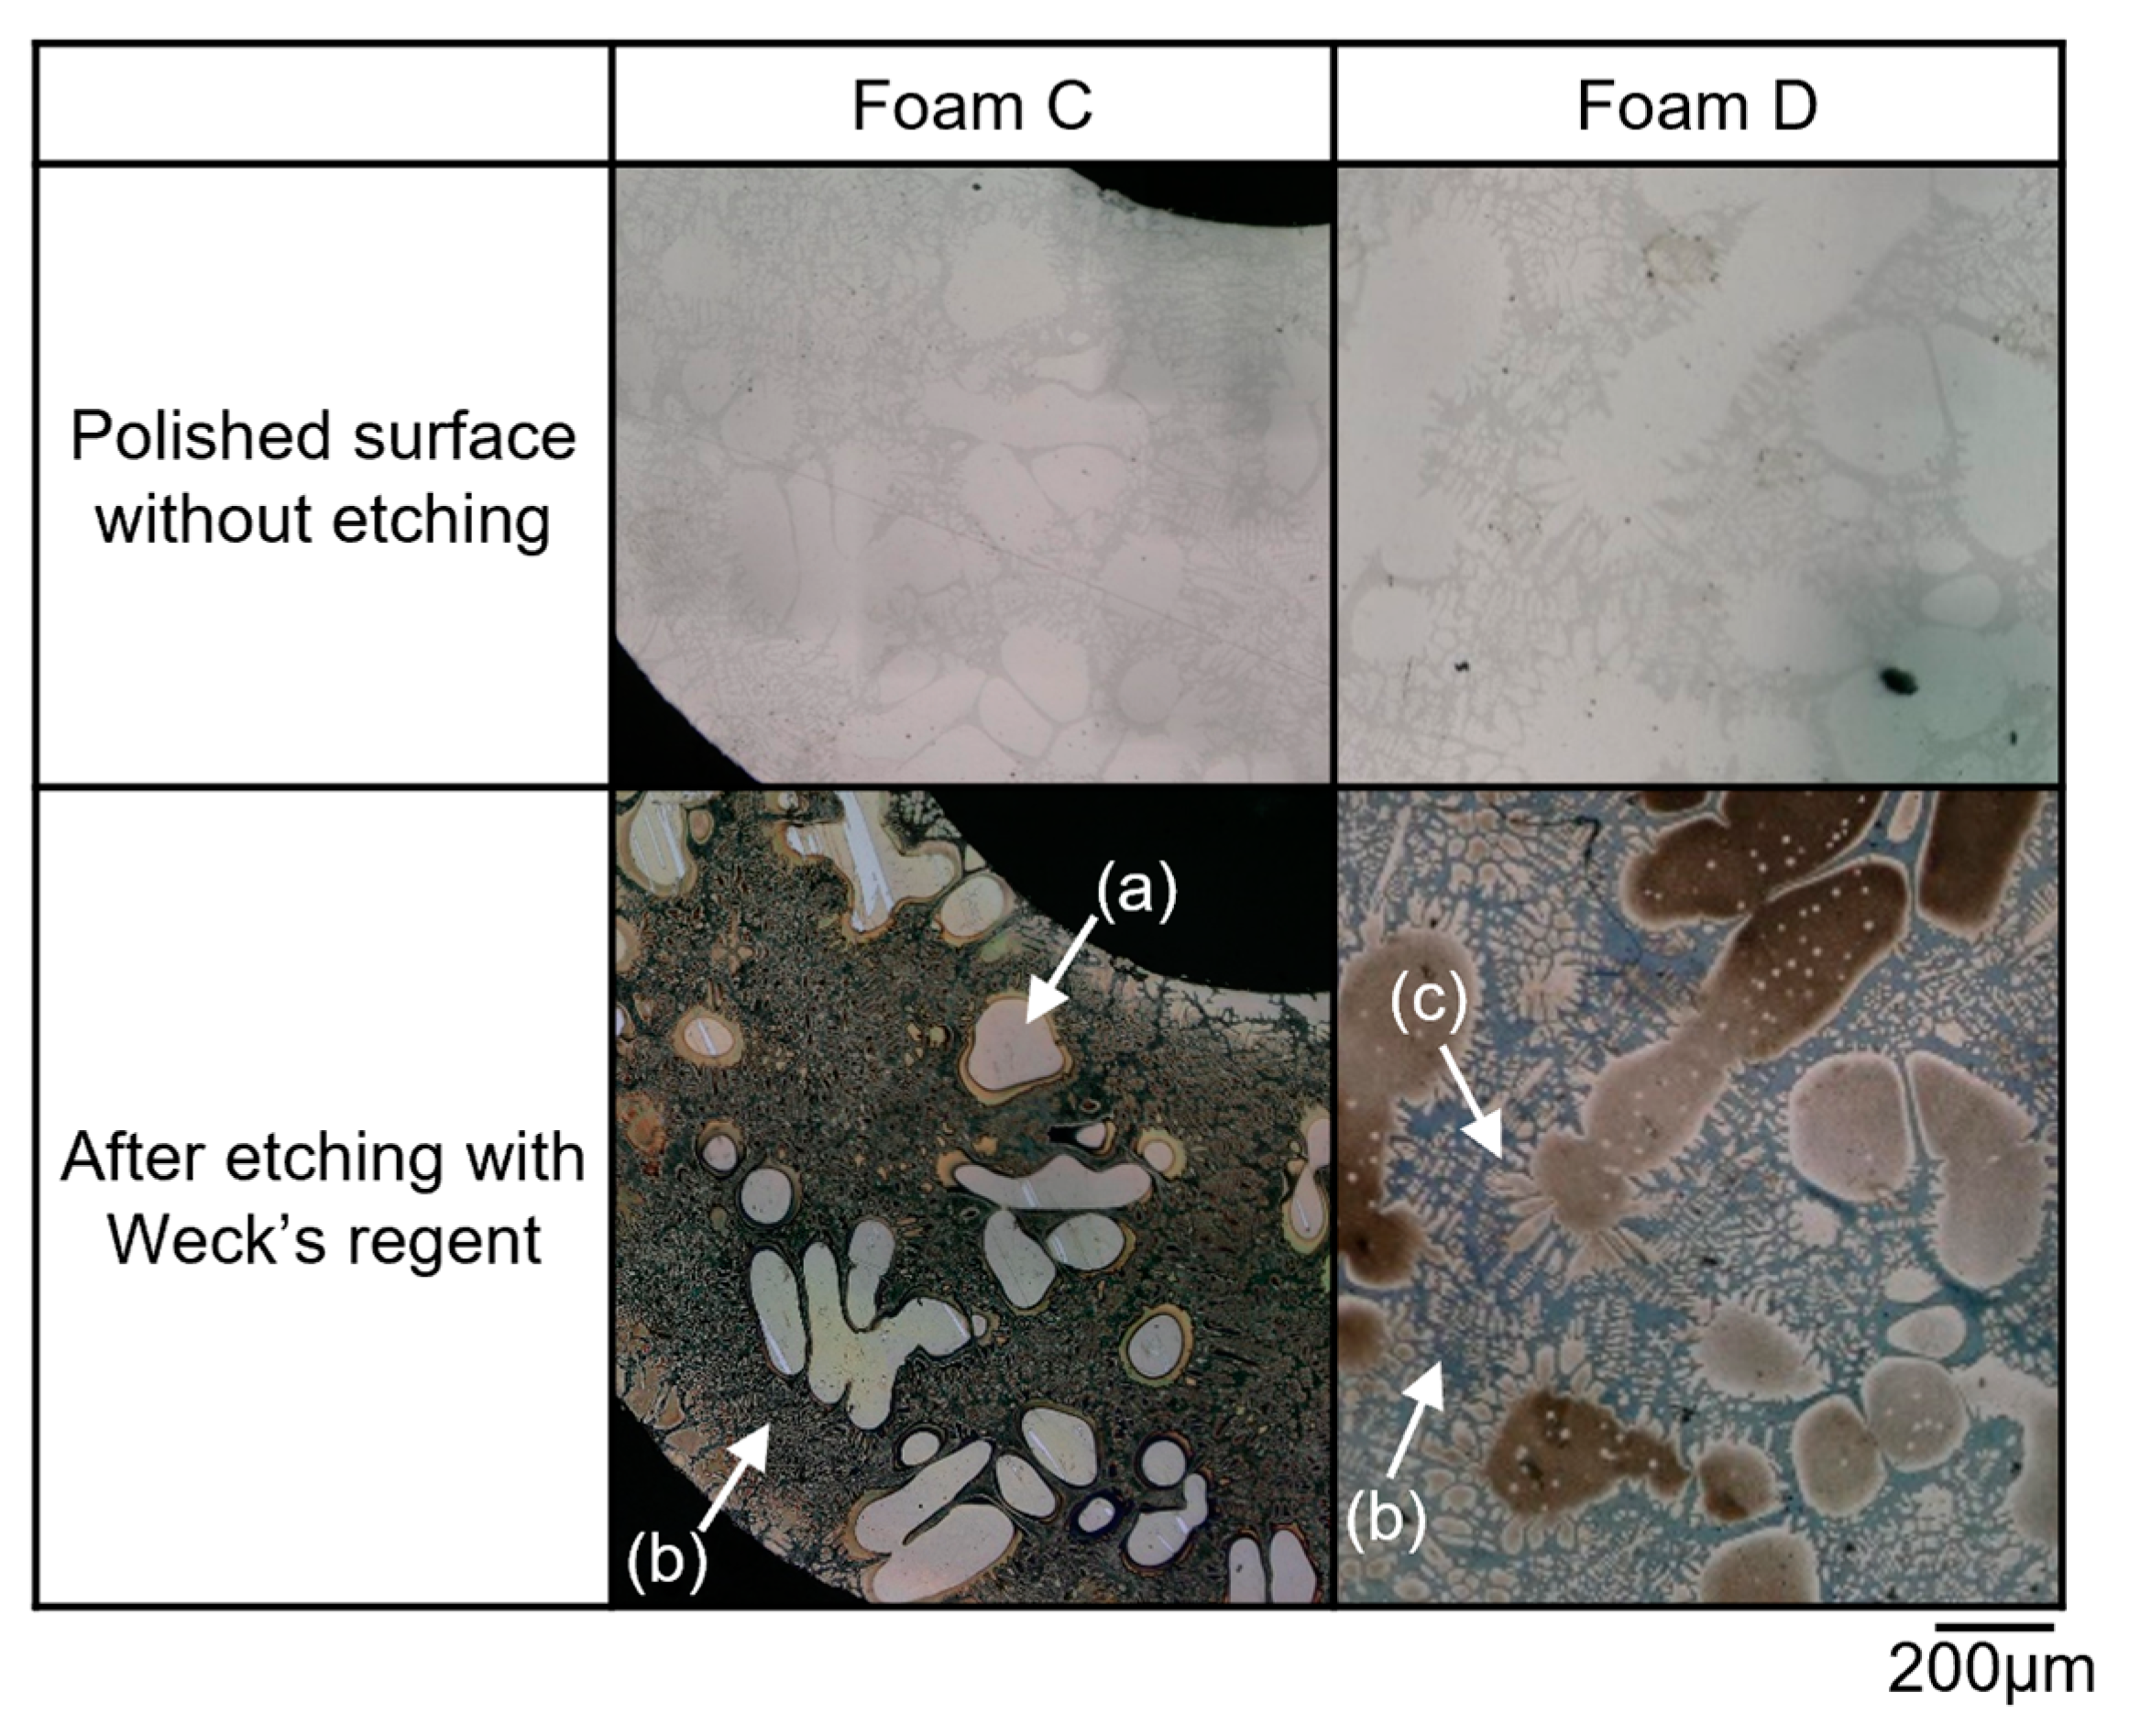
4.3. Characteristics of the Temperature and the Microstructure of the Foam with Poor Pore Morphology

The foams C and D should be compared because their temperatures of the melt during foaming were almost the same around 613 °C. However, the foam D took a long time to control the temperature constant. Also, the pores in the foam D were in a poor state, while the pores in the foam C were stable, as mentioned in Section 3.1. Figure 8a shows the temperature history of the foams C and D again. Figure 8b indicates the close-up temperature history around 150 min to 250 min. As shown in Figure 8b, the temperature history of the foam D changed at frequent intervals with a large temperature gradient. As mentioned in Section 3.2, the temperature oscillation lengthens the fabrication time. Therefore, the longer fabrication time caused by the temperature oscillation may lower the pore morphologies.
Figure 9 shows the microscopic images of the cross-section of the foams C and D. The upper row shows the microstructure polished without etching, and the lower row shows the microstructure after etching with Weck’s reagent. According to the microscopic images after etching, the foam C has granular primary α, which is a white area surrounded by a brown circle, indicated by a white arrow (a). The white part is recognized as the original primary crystals that existed during the foaming process. The brown circle around the white part is recognized as solute segregation. Also, the eutectic crystals were observed in the foam C, indicated by the white arrow (b). On the other hand, the foam D has both the dendritic primary α and the granular primary α. Most dendritic parts are colored brown, indicated by the white arrow (c). The eutectic crystals were also observed in the foam D. It is considered that those dendritic crystals grew during foaming. Here, the average size of grained primary α, except for the brown circle in the foams C and D, were calculated as 102 μm and 131 μm, respectively. The average size of dendritic primary α in the foam D was calculated as 180 μm. Additionally, the average circularities e ¯ of the foams C and D were calculated as 0.60 and 0.49, respectively. Therefore, it is considered that the dendritic primary α also may lower the pore circularity.

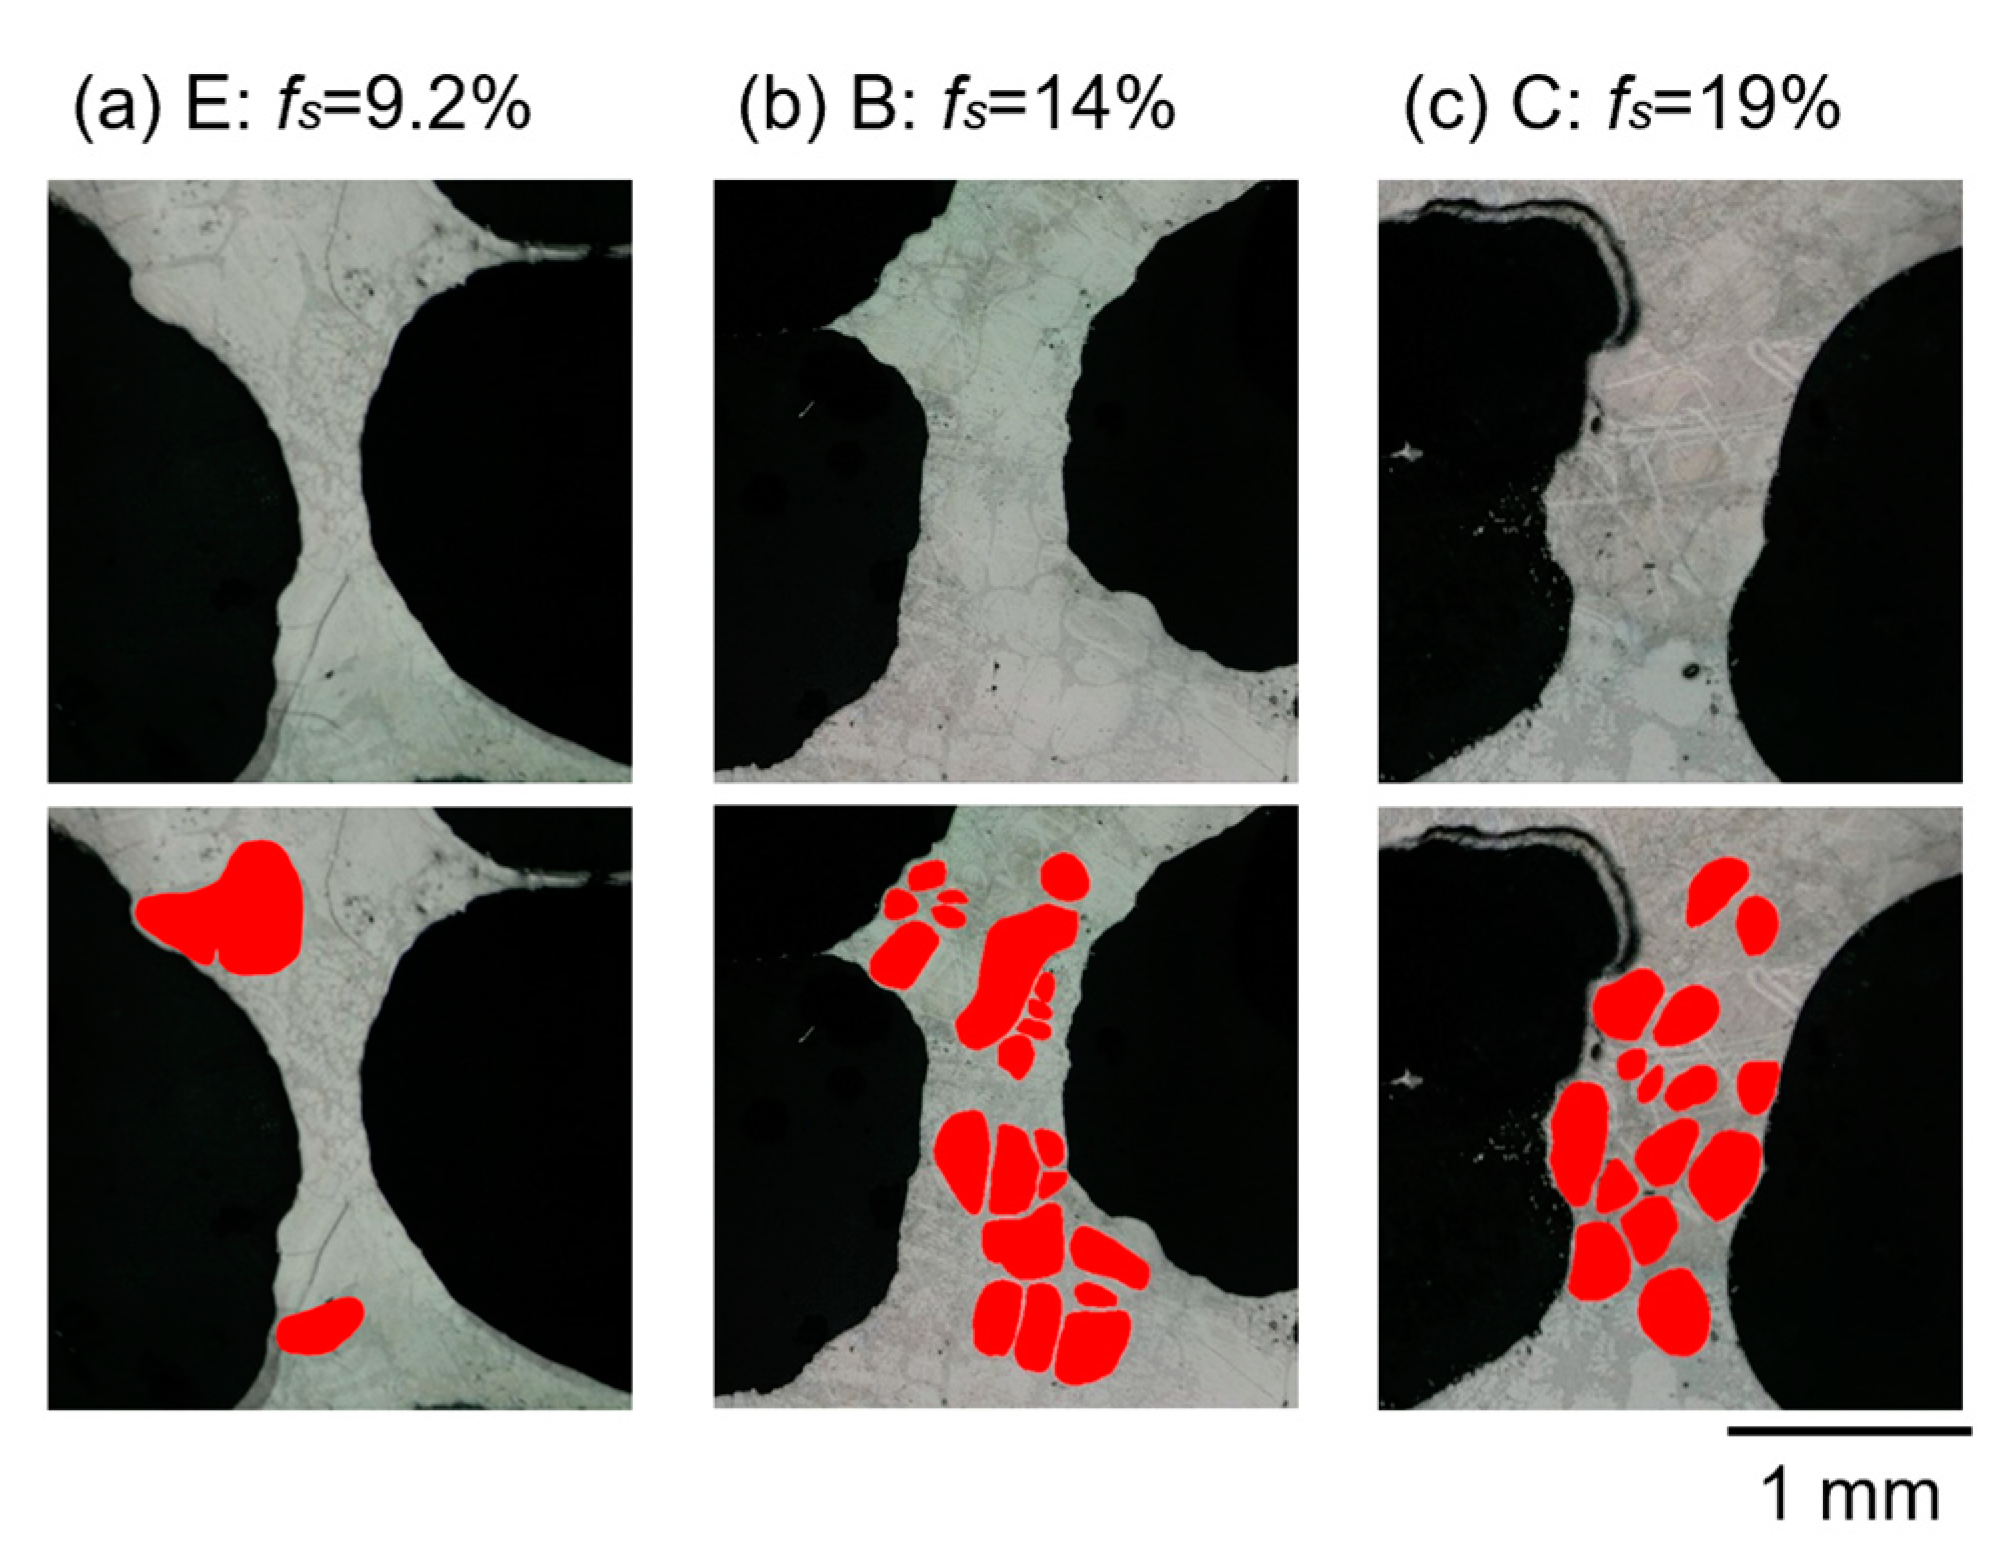
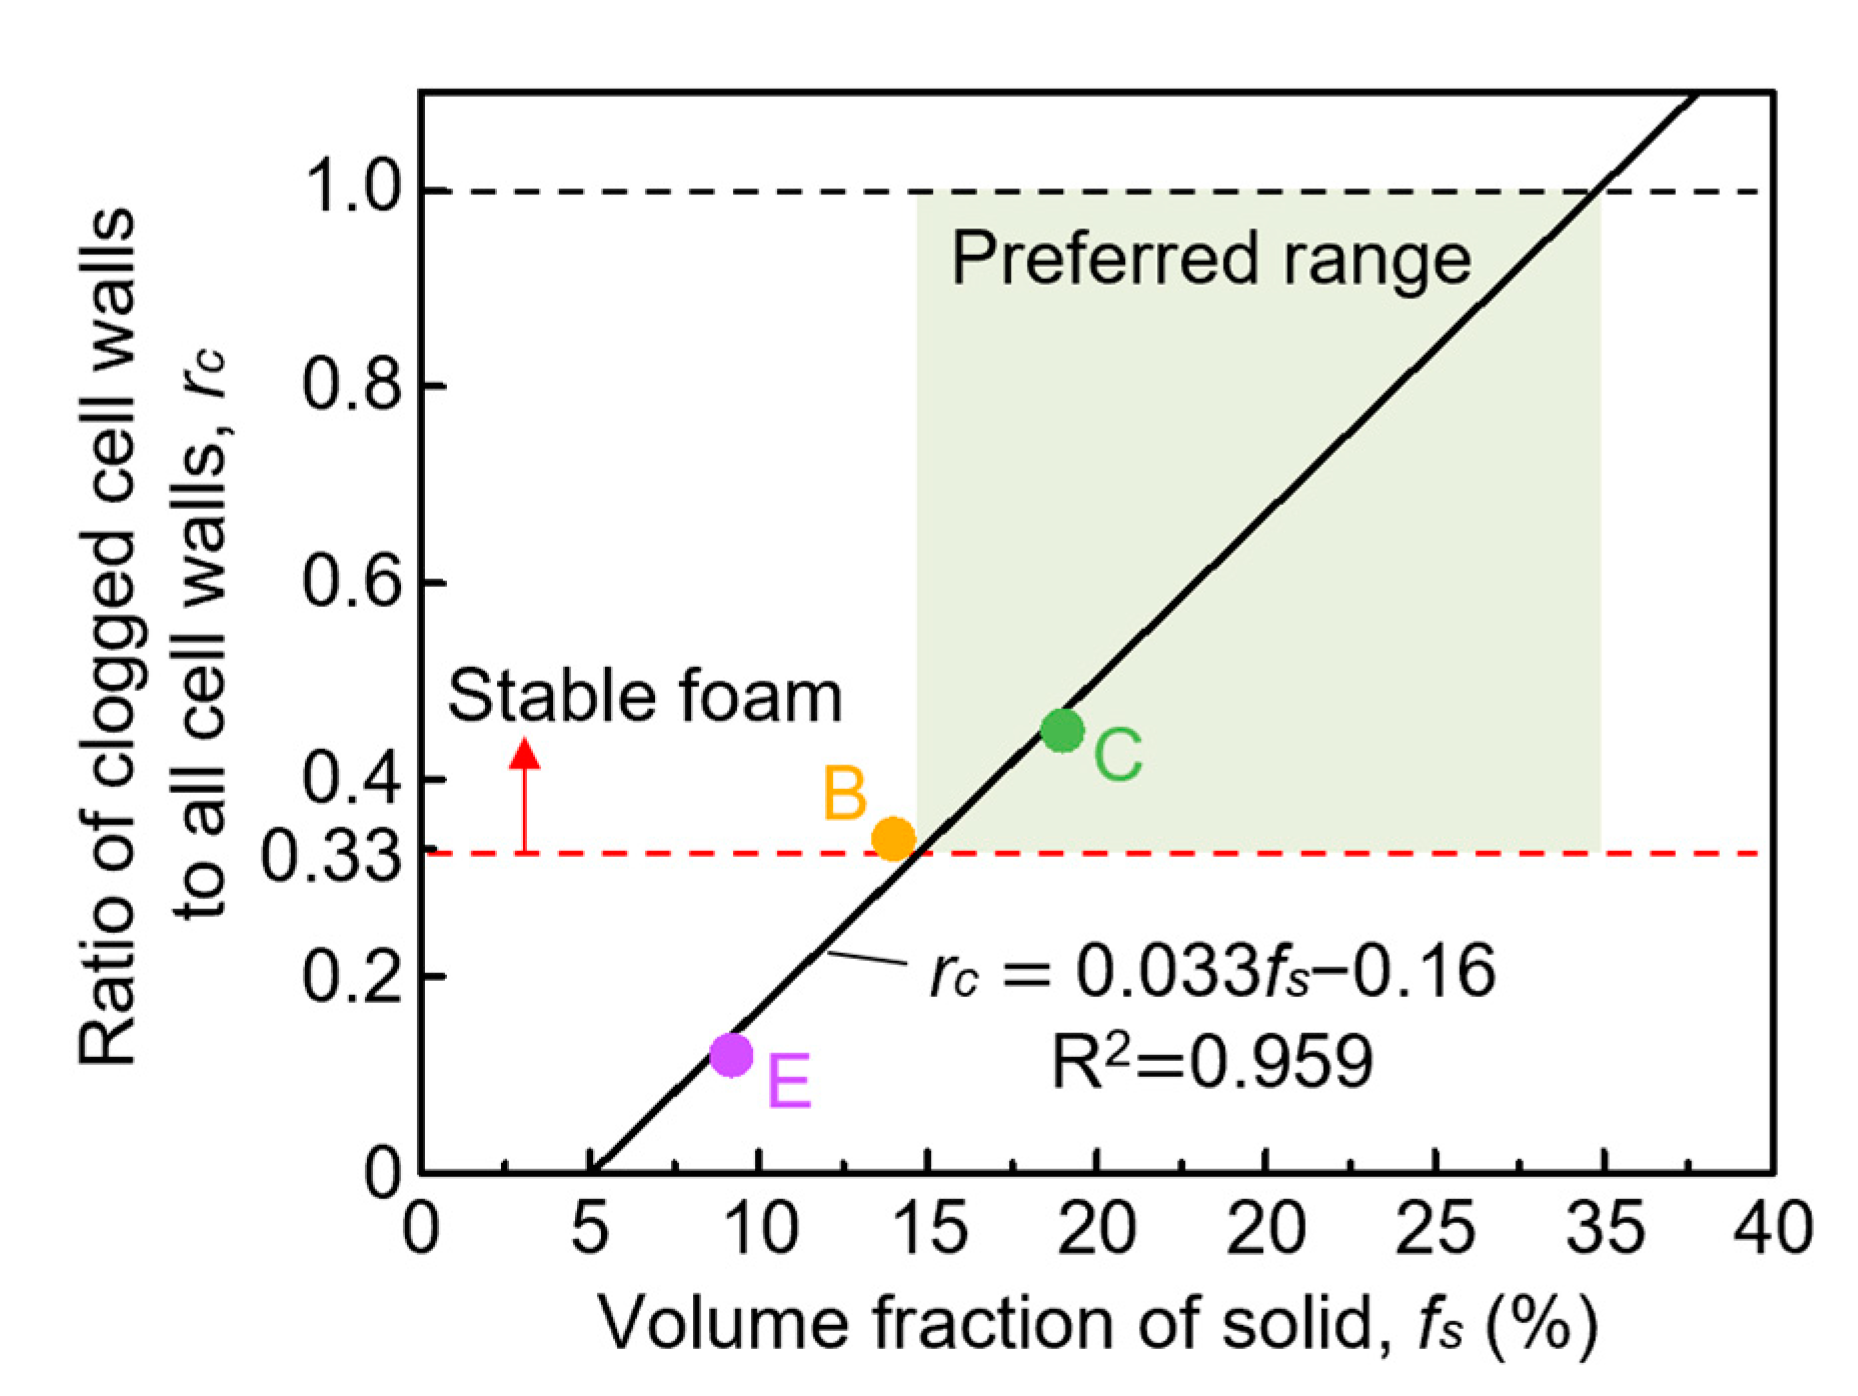
4.4. Relationship between Clogged Cell Wall and the Volume Fraction of the Solid

The objective of this study was to reveal the reproducibility of the semi-solid route by fabricating the foams with the same setting temperature. According to the results so far, the fabrication conditions, except for the volume fraction of the solid during the foaming of the foams B, C, and E, were almost the same. In fact, the foams fabricated with different volume fractions of the solids can be compared. In this section, the influence of increasing the volume fraction of the solid on the clogging effect.
The maximum difference in the calibrated temperature T1 between the foams C and E was calculated as 4.5 °C. According to the calculation of Thermo-Calc, the difference in the volume fraction of the solid was 9.8%. When the volume fraction of the solid increases, two effects are possible: one is that the number of clogged cell walls will increase. The other is that the fraction of primary crystals in already clogged cell walls will increase, and thus, the number of clogged cell walls will not increase. In the former case, the foam structure can be recognized as more stable because the drainage of each cell wall itself is prevented. Based on these hypotheses, we will discuss the influence of an increment of 9.8% in the volume fraction of the solid on the clogging effect in this section.
Figure 10 shows the microscopic images for a closer look at one cell wall inside the foams E, B, and C. The primary crystals are colored red to improve the visibility of the microstructure. Each average size of primary crystals in the foams B, C, and E was calculated as 112 μm, 109 μm, and 110 μm, respectively.
Figure 11 shows the graph, which indicates the area ratio of primary crystals in one cell wall to the area of one cell wall Apr/Acw in the foams B, C, and E. Each plot indicates one cell wall. When the area ratio of primary crystals in the cell wall Apr/Acw exceeds the percolation threshold, 0.58, in this case, the plots are located in the red area [31]. In these cases, the cell walls are recognized as clogged cell walls, and the drainage in the clogged cell walls is prevented by the primary crystals. According to Figure 10a, which shows the cell wall of the foam E, the cell wall did not have enough primary crystals to prevent drainage. In fact, the area ratio Apr/Acw of this cell wall was calculated as 0.21. On the other hand, the area ratio Apr/Acw of the foams B and C, shown in Figure 10b,c, was calculated as 0.63 and 0.60, respectively. Therefore, Figure 10b,c show the clogged cell walls with prevented drainage. Based on the percolation theory, the foam can be recognized as stable foam when the percentage of clogged cell walls exceeds the percolation threshold of 0.33 [21]. This time, the percentage of clogged cell walls to all cell walls in the foam E was calculated as 0.12, which is smaller than the threshold. Therefore, the foam E was not the stable foam according to both the distributions of the pore morphologies and the percolation theory.
The distributions of the foams B and C in Figure 11 show that the distribution of Apr/Acw located in the red area is not significantly different. The percentages of clogged cell walls to all cell walls of the foams B and C were calculated as 0.34 and 0.45, respectively. Both values exceeded the percolation threshold of 0.33. Therefore, the foams B and C were recognized as stable foams.
Figure 12 shows the relationship between the ratio of the clogged cell wall to all cell walls rc and the volume fraction of the solid fs for the foams B, C, and E. The plots on the area above the red dashed line, which is the percolation threshold 0.33, indicate the stable foam. The fitting curve was obtained using Equation (6) via a linear approximation. The determination coefficient R2 was calculated as 0.959.
r c = 0.033 f s 0.16
According to Figure 12, as the volume fraction of the solid increases, the ratio of clogged cell walls to all cell walls also increases. Therefore, the results proved the hypothesis mentioned in Section 4.3 that the foams with a higher volume fraction of the solid are more stable because the drainage in more cell walls is prevented. Also, the preferred range of the volume fraction of the solid can be determined from Figure 12. According to the intersecting point of percolation threshold 0.33 and the fitting curve, the minimum limitation of the volume fraction of the solid can be determined as around 15%. The foam will be unstable under 15% in the volume fraction of the solid. In addition, there will be no clogged cell walls under 5% in the volume fraction of the solid. On the other hand, the ratio of the clogged cell walls rc will not change over around 35% in the volume fraction of the solid, according to the intersecting point of the fitting curve and the black dashed line. Therefore, the green area in Figure 12 can be recognized as the preferred range to fabricate the foam stabilized by the clogging effect. Finally, the mechanism of pore stabilization by the primary crystals when the volume fraction of the solid increases.
Figure 13 shows the schematic illustration describing the stabilization of foams in each foaming stage during the foaming time arranged by each volume fraction of the solid. The foaming time indicates the whole foaming process, which starts after the removal of the impeller and ends when the foaming process ends, as shown in Figure 2. Figure 13a–i show how the pores become stable when the volume fraction of the solid is high but lower than 35%, slightly exceeds 15%, and is lower than 15%, respectively. The green area indicates the preferred range of the volume fraction of the solid, as mentioned in the previous paragraph. Each fabricated foam, A, B, C, and E, is indicated at its corresponding part for the volume fraction of the solid. The foam D is excepted from Figure 13 because the foam D had the temperature oscillation during the fabrication.
In the early stage of foaming, the pores are still small. The primary crystals spread broad in cell walls regardless of the volume fraction of the solid, as shown in Figure 13a,d,g.
In the middle stage of the foaming, H2 gas bubbles are newly generated and grow through the decomposition of the blowing agent. Thus, the cell walls become thinner. If the volume fraction of the solid is not enough to prevent the drainage, as shown in Figure 13h, pores will go upwards as the drainage advances, and thus, the liquid phase stands in the lower part. As the primary crystals do not gather in the cell walls, there are few clogged cell walls generated. If the volume fraction of the solid is in the preferred range, as shown in Figure 13b,e, the primary crystals begin to clog the cell walls. The drainage in the clogged cell walls will be prevented based on the clogging effect. An important point is that the ratio of the primary crystals in each clogged cell wall will become almost the same as each other. Also, the ratio of the primary crystals in clogged cell walls will not change even if the volume fraction of the solid increases above 15%. Schematic (x) in Figure 13 describes the two examples of clogged cell walls in the case of a higher volume fraction of the solid than that of Figure 13e. The fraction of the primary crystals in the two cell walls in the schematic (x) is the same as each other. Also, the fraction of the primary crystals indicated in the schematic (x) seems to be the same as the clogged cell wall indicated in Figure 13e. These schemes describe that the primary crystals tend to gather and prevent drainage in more cell walls. Therefore, the primary crystals will not gather in already clogged cell walls as described in the schematic (x’) in Figure 13.
In the late stage of foaming, the cell walls become thinner. As shown in Figure 13c,f, the clogged cell walls remain stable because of the clogging effect with enough fraction of the primary crystals. However, if the volume fraction of the solid is lower than the preferred range, the cell walls will rupture, as shown in Figure 13i. Finally, the pores in the poor state will be generated in this case. Therefore, it can be concluded that the clogging effect works more effectively when the volume fraction of the solid exceeds 15% defined by the percolation theory.

5. Conclusions

The aluminum alloy foams were fabricated through the semi-solid route using hypoeutectic aluminum–silicon alloy. The fabrication process and the influence of the volume fraction of the solid on the clogging effect were discussed. The results can be summarized as follows:
  • The fabrication process through the semi-solid route conducted in this study had reproductivity for the fabrication of the aluminum alloy foam. The fluctuation of ±1.3 °C (±2.5% in the volume fraction of the solid) around 612.5 °C, which is close to the setting temperature of 613 °C, does not have a major influence on the pore morphology.
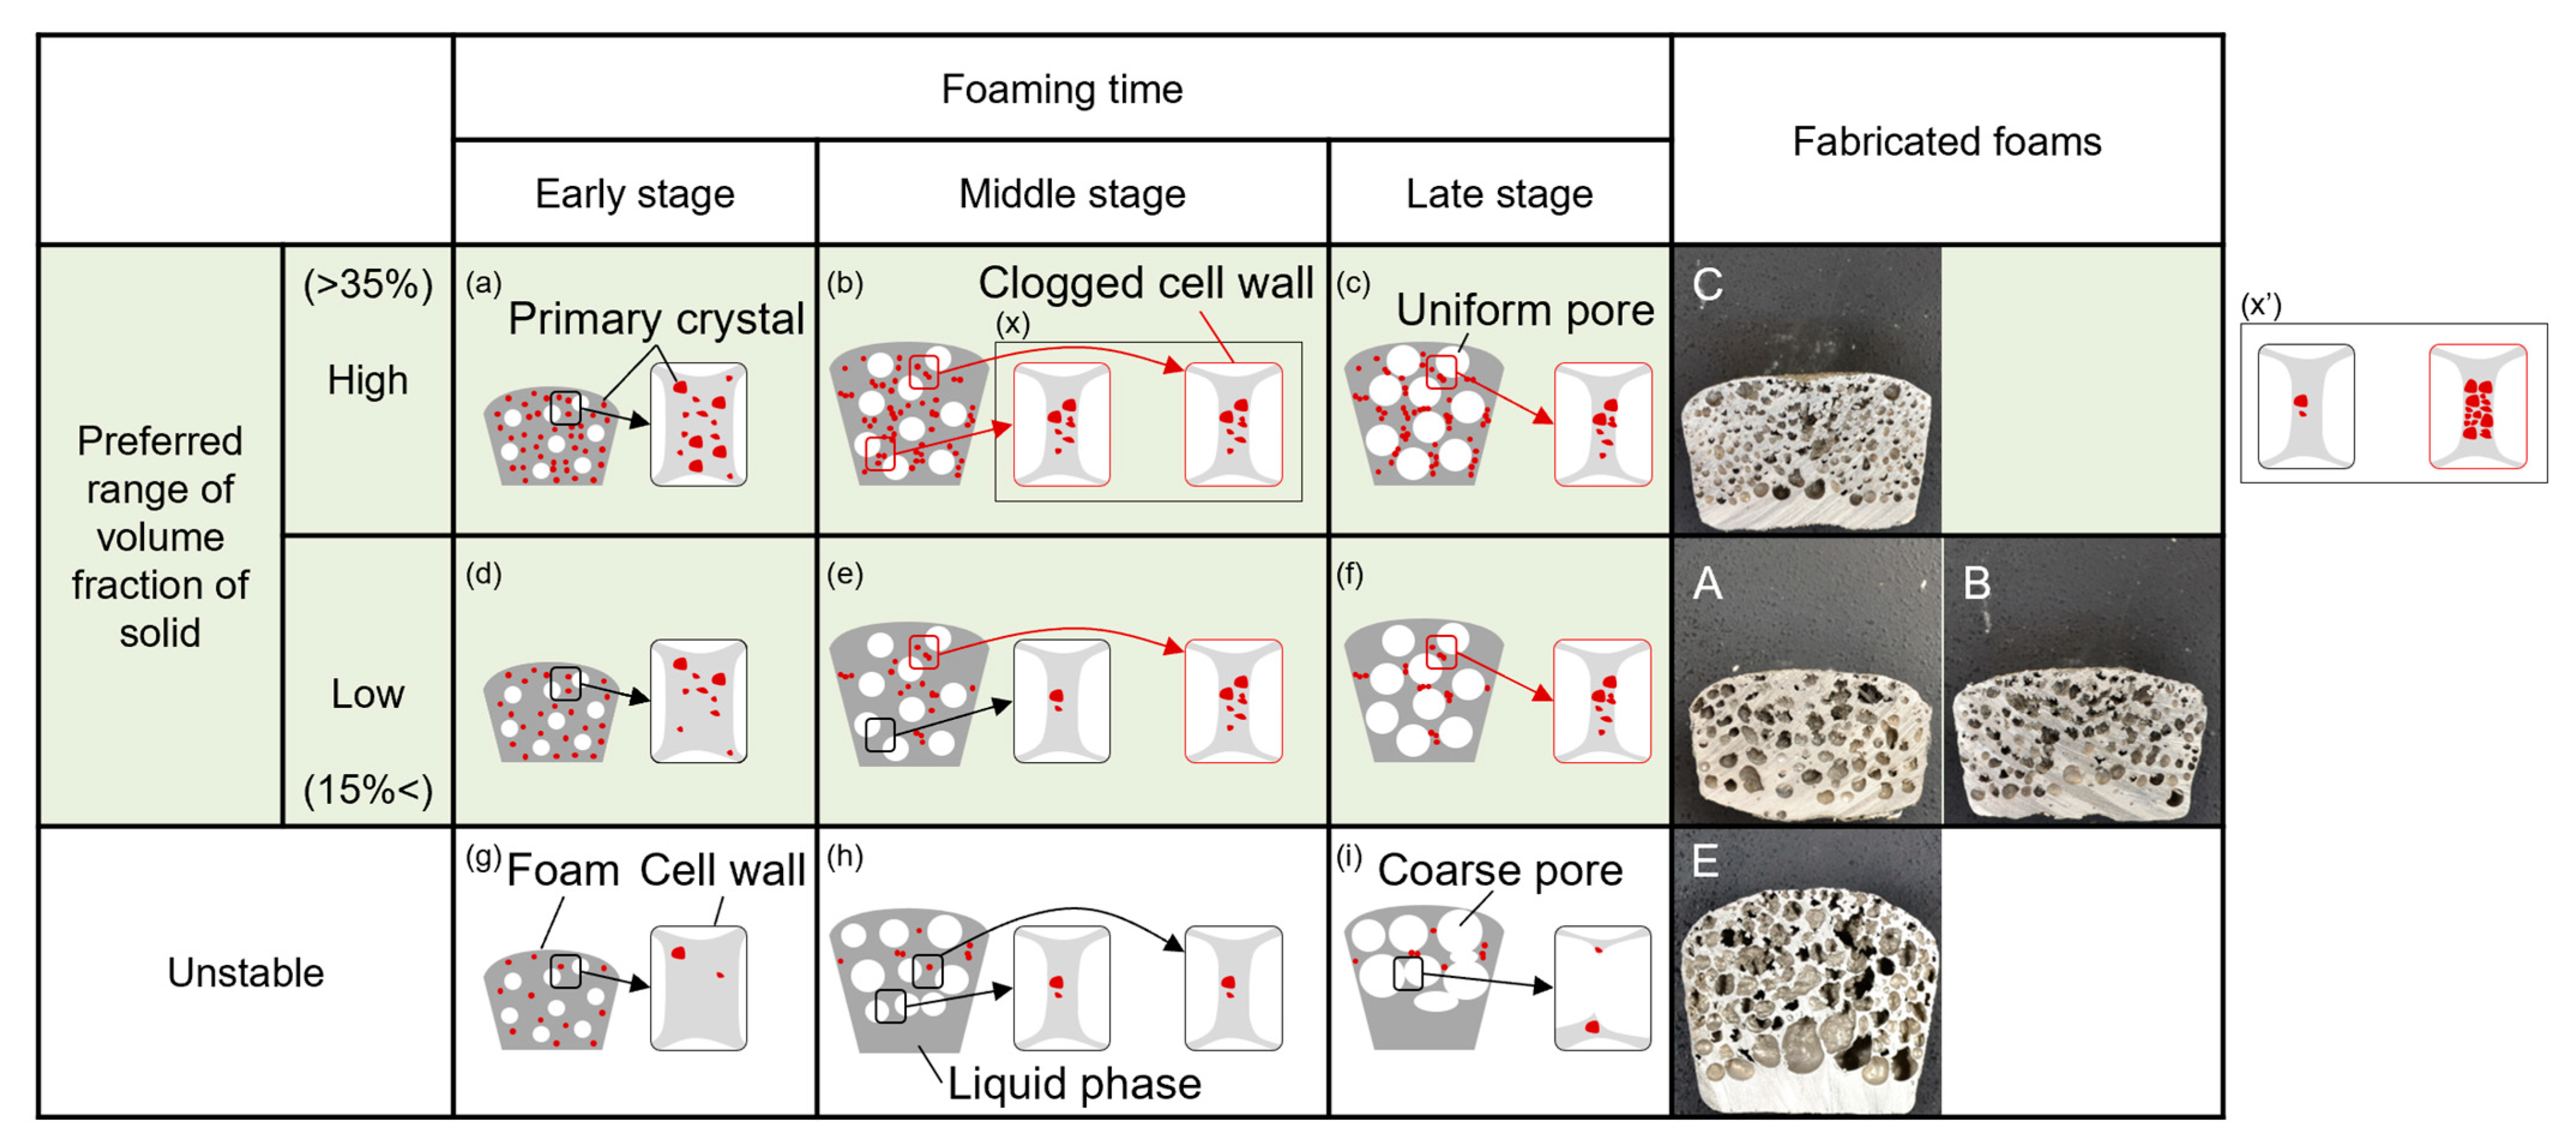
  • When the volume fraction of the solid increases, exceeding 15% in volume fraction of the solid, the number of clogged cell walls increases. An increase in the number of clogged cell walls is more effective for the clogging effect than the fraction of primary crystals in already clogged cell walls increases.
  • The preferred range of the volume fraction of the solid for fabrication of stable foam, which was defined to have uniform pores with small diameter and high circularity in this study, is from around 15% to 35%. If the aluminum–silicon alloy foam is fabricated with a certain volume fraction of the solid, the clogging effect works most effectively, and the cell walls become most stable when the volume fraction of the solid is 35%.
The stabilization mechanism investigated in this study will be able to be adopted for the fabrication of foams of other hypoeutectic aluminum alloys. Also, the effect of temperature control on the deviation of the properties of aluminum alloy foams can be applied to other fabrication processes via the semi-solid route.

Author Contributions

Conceptualization, S.T. and S.S.; methodology, S.T.; software, S.T.; validation, S.T., T.A. and S.S.; formal analysis, S.T.; investigation, S.T. and A.S.; resources, S.T.; data curation, S.T.; writing—original draft preparation, S.T.; writing—review and editing, S.T., T.A. and S.S.; visualization, S.T.; supervision, S.T. and S.S.; project administration, S.T.; funding acquisition, S.T. and S.S. All authors have read and agreed to the published version of the manuscript.

Funding

This research was funded by the Light Metal Educational Foundation Research Scholarship for Young Scientists for the first author, Satomi Takamatsu, and a donation from Kimura Foundry Co., Ltd.

Data Availability Statement

Not applicable.

Acknowledgments

The authors would like to thank the Light Metal Educational Foundation for funding support and scholarship for the first author, Satomi Takamatsu. UACJ Corporation is gratefully acknowledged for supplying the Al-Si alloy used in this study. We are also grateful to Kimura Foundry Co., Ltd. for the financial support.

Conflicts of Interest

The authors declare no conflict of interest.

References

  1. Banhart, J. Manufacture, characterization and application of cellular metals and metals foams. Prog. Mater. Sci. 2001, 46, 559–632. [Google Scholar] [CrossRef]
  2. Ashby, M.F.; Evans, T.; Fleck, N.A.; Hutchinson, J.W.; Wadley, H.N.G.; Gibson, L.J. Metal Foams: A Design Guide, 1st ed.; Butterworth-Heinemann: Boston, MA, USA, 2000; pp. 8–11. [Google Scholar]
  3. García-Moreno, F. Commercial Applications of Metals Foams: Their Properties and Production. Metals 2016, 9, 85. [Google Scholar] [CrossRef] [PubMed]
  4. Stręk, A.M.; Lasowicz, N.; Kwiecien, A.; Zając, B.; Jankowski, R. Highly Dissipative Materials for Damage Protection against Earthquake-Induced Structural Pounding. Materials 2021, 14, 3231. [Google Scholar] [CrossRef]
  5. Latour, M.; D’Aniello, M.; Babcsan, N.; Capone, P.; Landolfo, R.; Rizzano, G. Bending response of sandwich panels with steel skins and aluminum foam core. Steel Constr. 2022, 15, 73–80. [Google Scholar] [CrossRef]
  6. Schäffler, P.; Hanko, G.; Mitterer, H.; Zach, P. Alulight Metal Foam Products. In Proceedings of the 5th International Conference on Porous Metals and Metallic Foams: MetFoam2007, Montreal, QC, Canada, 5–7 September 2007; Lefebvre, L.P., Banhart, J., Dunand, D.C., Eds.; DEStech Publications: Lancaster, PA, USA, 2008; pp. 7–10. [Google Scholar]
  7. Garai, F.; Béres, G.; Weltsch, Z. Development of tubes filled with aluminium foams for lightweight vehicle manufacturing. Mater. Sci. Eng. A 2020, 790, 139743–139751. [Google Scholar] [CrossRef]
  8. Chilla, V.; Mondal, D.P.; Janaki Ram, G.D.; Mukherjee, M.J. Processing of in-situ aluminum foam-filled stainless steel tube with foam-tube bonding for enhanced crashworthiness. Manuf. Process. 2022, 82, 488–500. [Google Scholar] [CrossRef]
  9. Sardari, P.T.; Babaei-Mahani, R.; Giddings, D.; Yasseri, S.; Moghimi, M.A.; Bahai, H. Energy recovery from domestic radiators using a compact composite metal Foam/PCM latent heat storage. J. Clean. Prod. 2020, 257, 120504–120515. [Google Scholar] [CrossRef]
  10. Kováčik, J.; Jerz, J.; Gopinathan, A.; Simančík, F.; Marsavina, L.; Linul, E. Effect of sample shape on compression behavior of aluminum foams. Mater. Today Proc. 2023, 78, 308–313. [Google Scholar] [CrossRef]
  11. Jafari, M.J.; Sharak, M.N.; Khavanin, A.; Ebadzadeh, T.; Fazlali, M.; Madvari, R.F. Improving the Morphological Parameters of Aluminum Foam for Maximum Sound Absorption Coefficient using Genetic Algorithm. Sound. Vib. 2021, 55, 117–130. [Google Scholar] [CrossRef]
  12. Gergely, V.; Clyne, T.W. Drainage in standing liquid metal foams: Modelling and experimental observations. Acta Mater. 2004, 52, 3047–3058. [Google Scholar] [CrossRef]
  13. Heim, K.; Vinod Kumar, G.S.; Garcia-Moreno, F.; Manke, I.; Banhart, J. Drainage of particle-stabilised aluminum composites through single films and Plateau borders. Colloids Surf. A Physicochem. Eng. Asp. 2013, 438, 85–92. [Google Scholar] [CrossRef]
  14. Miyoshi, T.; Itoh, M.; Akiyama, S.; Kitahara, A. ALPORAS Aluminum Foam: Production Process, Properties and Applications. Adv. Eng. Mater. 2000, 2, 179–183. [Google Scholar] [CrossRef]
  15. Hanafusa, T.; Ohishi, K. Making of Porous Metallic Material by the Semi-solid Aluminum Alloy. Bull. Hiroshima Prefect. Technol. Res. Inst. East. Reg. Ind. Res. Cen. 2010, 23, 28–29. [Google Scholar]
  16. Stanzick, H.; Wichmann, M.; Weise, J.; Helfen, L.; Baumbach, T.; Banhart, J. Process Control in Aluminum Foam Production Using Real-Time X-ray Radioscopy. Adv. Eng. Mater. 2002, 4, 814–823. [Google Scholar] [CrossRef]
  17. Jin, I.; Kenny, J.D.; Sang, H. Method of Producing Lightweight Foamed Metal. U.S. Patent 4,973,358, 27 November 1990. [Google Scholar]
  18. Heim, K.; García-Moreno, F.; Banhart, J. Particle size and fraction required to stabilize aluminum alloy foams created by gas injection. Scr. Mater. 2018, 153, 54–58. [Google Scholar] [CrossRef]
  19. Kuwahara, T.; Kaya, A.; Osaka, T.; Takamatsu, S.; Suzuki, S. Stabilization Mechanism of Semi-Solid Film Simulating the Cell Wall during Fabrication of Aluminum Foam. Metals 2020, 10, 333. [Google Scholar] [CrossRef]
  20. Takamatsu, S.; Kuwahara, T.; Kochi, R.; Suzuki, S. Percolation of Primary Crystals in Cell Walls of Aluminum Alloy Foam via Semi-Solid Route. Metals 2020, 10, 847. [Google Scholar] [CrossRef]
  21. Stauffer, D.; Aharony, A. Cluster Numbers. In Introduction to Percolation Theory, 2nd ed.; Taylor & Francis: London, UK, 1994; pp. 26–34. [Google Scholar]
  22. Kitazono, K.; Nishizawa, S.; Sato, E.; Motegi, T. Effect of ARB Cycle Number on Cell Morphology of Closed-Cell Al-Si Alloy Foam. Mater. Trans. 2004, 45, 2389–2394. [Google Scholar] [CrossRef]
  23. Kobashi, M.; Noguchi, M.; Kanetake, N. Observation of Foaming Behavior for Rolled Sheet Precursors Made of Various Aluminum Powders. Mater. Trans. 2011, 52, 934–938. [Google Scholar] [CrossRef]
  24. Campana, F.; Mancini, E.; Pilone, D.; Sasso, M. Strain rate and density-dependent strength of Al-Si7 alloy foams. Mater. Sci. Eng. A 2016, 651, 657–667. [Google Scholar] [CrossRef]
  25. Kanetake, N.; Kobashi, M.; Tsuda, S. Foaming Behavior of Aluminum Precursor Produced from Machined Chip Waste. Adv. Eng. Mater. 2008, 10, 840–844. [Google Scholar] [CrossRef]
  26. Murray, J.L.; McAlister, A.J. The Al-Si (Aluminum-Silicon) system. Bull. Alloy Phase Diagr. 1984, 5, 74–84. [Google Scholar] [CrossRef]
  27. Nikanorov, S.P.; Volkov, M.P.; Gurin, V.N.; Burenkov, Y.A.; Derkachenko, L.I.; Kardashev, B.K.; Regel, L.L.; Wilcox, W.R. Structural and mechanical properties of Al-Si alloys obtained by fast cooling of a levitated melt. Mater. Sci. Eng. A 2005, 390, 63–69. [Google Scholar] [CrossRef]
  28. Weck, E.; Leistner, E. Metallographic Instructions for Colour Etching by immersion Pt. 3., 1st ed.; DVS-Verlag GmbH: Düsseldorf, Germany, 1986; pp. 6–19. [Google Scholar]
  29. Lei, S.; Gao, L.; Harada, Y.; Kumai, S. Microstructure Analysis of Quenched Semi-Solid A356 Aluminum Alloy Slurry by Using Weck’s Reagent. Mater. Trans. 2020, 61, 1077–1083. [Google Scholar] [CrossRef]
  30. Hangai, Y.; Takagi, T.; Koyama, S.; Suzuki, R.; Kamakoshi, Y. Refoaming of deformed aluminum foam fabricated by precursor foaming process using remaining foaming agent and densification using friction stir welding. Mater. Lett. 2023, 351, 135008–135011. [Google Scholar] [CrossRef]
  31. Smith, L.N.; Lobb, C.J. Percolation in two-dimensional conductor-insulator networks with controllable anisotropy. Phys. Rev. B 1979, 20, 3653–3658. [Google Scholar] [CrossRef]
Figure 1. Scheme of the electronic furnace for fabrication of metal foams.
Metals 13 01654 g001
Figure 2. Scheme of the fabrication process for the aluminum alloy foam through the semi-solid route. Fabrication time t started when the heater was turned on. Holding time th started at the time of the addition of TiH2. Foaming time started at the time of the removal of the impeller. Each time ended when the foaming process ended.
Metals 13 01654 g002
Figure 3. Cross-sectional images and porosities of fabricated aluminum alloy foams through the semi-solid route at the same setting temperature. Large characters (AE) indicate the five fabricated foams. The red arrow indicates the flattened pores in the foam (D). Light blue arrows indicate the connected pores in the foam (E).
Metals 13 01654 g003
Figure 4. Distributions of pore morphology (circularity e and equivalent pore diameter d) of fabricated aluminum alloy foams A–E in the height direction through the semi-solid route under the same fabrication conditions. The top position of the colored area on each graph shows the maximum height H of each foam.
Metals 13 01654 g004
Figure 5. Temperature history of each fabricated aluminum alloy foam under the same setting temperature aiming 613 °C. Red, yellow, green, blue, and purple lines indicate the temperature histories of the foams A, B, C, D, and E, respectively. (a) Temperature history during the whole fabrication. Solid lines and dashed lines indicate the temperature of the melt T1 and the temperature of the bottom of the crucible T2, respectively; (b) close-up of the temperature history around 170 min to 270 min. Thick lines are calibrated temperature of the melt T1′ calculated from the calibration equation. The arrows vertical to the horizontal axis indicate the removal of the impeller and the start of the foaming process.
Metals 13 01654 g005
Figure 6. Relation between the temperature of the melt T1−A and the temperature of the bottom of the crucible T2−A to obtain the fitting line between T1−A and T2−A is used to determine the calibrated temperature T1−A for 5 min just before the stirring process during the fabrication of the foam A.
Metals 13 01654 g006
Figure 7. History of pressure during fabrication. Red, yellow, green, blue, and purple lines indicate the pressure histories of the foams A, B, C, D, and E, respectively. (a) Total pressure Pt and O2 partial pressure PO2 during fabrication in the furnace; (b) close-up of O2 partial pressures PO2 during fabrication in the furnace. Vertical dashed lines indicate the start of the holding time; (c) close-up of O2 partial pressures PO2 on the axis of the holding time, which starts after the addition of TiH2 and ends when the foaming process ends.
Metals 13 01654 g007
Figure 8. Temperature history of each fabricated aluminum alloy foam with the same fabrication conditions. Green and blue lines indicate the histories of T1 of the foams C and D, respectively. (a) Temperature history during the whole fabrication; (b) close-up of the temperature history around 150 min to 250 min.
Metals 13 01654 g008
Figure 9. Microscopic images of cross-section surface of fabricated foams C and D before and after etching. White arrow (a) indicates the granular primary α. White arrow (b) indicates the eutectic crystals. White arrow (c) indicates the dendritic primary α.
Metals 13 01654 g009
Figure 10. Microscopic images of cross sections of fabricated foams: (a) The foam E, (b) the foam B, and (c) the foam C. The primary crystals are colored with red in downside images.
Metals 13 01654 g010
Figure 11. Area ratio of primary crystals in one cell wall to the area of a cell wall. Triangle, rectangle, and circle plots indicate the foams E, B, and C, respectively. Plots in the red area are recognized as stable cell walls.
Metals 13 01654 g011
Figure 12. Relationship between the percentage of clogged cell walls to all cell walls and the volume fractions of solid of the foams B, C, and E. Black solid line is the fitting curve by a linear approximation. The red dashed line indicates the percolation threshold of 0.33. The green area indicates the preferred range of volume fraction of the solid.
Metals 13 01654 g012
Figure 13. Schematic illustration showing the stabilization of foams in each foaming stage, arranged by the volume fraction of the solid. (ac) The stabilization of the foam having a higher volume fraction of the solid; (df) the stabilization of the foam with a higher volume fraction of the solid than the percolation threshold a little; (gi) the stabilization of the foam not having enough volume fraction of the solid to be stable; (x) clogged cell walls which will be generated in the foam during the middle stage of foaming; (x’) clogged cell walls which will not be generated. Green area indicates the preferred range of the volume fraction of the solid to fabricate the stable foams. Fabricated foams A–E except the foam D are indicated at their corresponding parts for volume fraction of the solid.
Metals 13 01654 g013
Table 1. Composition of aluminum–silicon alloy.
ComponentSiFeCuAl
mass%6.40.00.0Bal.
Table 2. Composition of the pure air provided from a commercial gas cylinder.
ComponentO2COCO2H2ON2
volppm20 × 104<0.1<0.1<0.54Bal.
Disclaimer/Publisher’s Note: The statements, opinions and data contained in all publications are solely those of the individual author(s) and contributor(s) and not of MDPI and/or the editor(s). MDPI and/or the editor(s) disclaim responsibility for any injury to people or property resulting from any ideas, methods, instructions or products referred to in the content.

