Article

Digital Twin Design of a Turbulence Inhibitor in a Tundish Based on the Production Cluster Mining Algorithm

1
School of Materials and Metallurgy, Wuhan University of Science and Technology, Wuhan 430081, China
2
BAOSTEEL, China Baowu Steel Group Corp., Ltd., Shanghai 430083, China
*
Author to whom correspondence should be addressed.
Metals 2023, 13(10), 1651; https://doi.org/10.3390/met13101651
Submission received: 11 August 2023 / Revised: 18 September 2023 / Accepted: 20 September 2023 / Published: 26 September 2023

Abstract

:
The lack of a direct and linear relation between inclusion removal from tundishes and the design of their turbulence inhibitors is a difficult challenge. In contrast to the traditional method of optimizing flow control devices based on the residence time distribution curve, this study used the inclusion/flow field database production clustering mining algorithm to conduct step-by-step data mining on the tundish flow field; to produce relevant facts of the flow field characteristics in the inclusion aggregation zone; and to extract the data mining results from the fact database to screen a digital twin algorithm that forecasts the inclusion aggregation area in a tundish to optimize the flow control device. The results showed that the inclusion aggregation area in the tundish impact zone is above the turbulence inhibitor and that the inclusion aggregation area outside the tundish impact zone is at the vortex center of the flow field. According to the mining results, a pseudo-code for screening the inclusion aggregation area was developed, and the turbulence inhibitor was optimized with the help of the digital convergence of the digital and physical models. Finally, in a tundish, the inclusion removal rate in molten steel was increased by 14.4%. The turbulence inhibitor designed by the digital twin method is currently being used in a Chinese steel mill.

1. Introduction

The tundish is an important reactor in a continuous casting machine as it controls the quality of steel products. The key point in a tundish’s design is improving the cleanness of molten steel. The functions of the flow control device [1,2] in a tundish include improving the aggregation and floating properties of the inclusions in molten steel. Currently, a turbulence inhibitor is normally designed based on the extending residence time method to increase the inclusion removal rate in a tundish; however, there are no direct or linear relations between the inclusion removal rate or the turbulence inhibitor’s [3] design, making the design of turbulence inhibition a considerable obstacle.
Since the 1980s, with the progress of computer technology and improvements in computational fluid dynamics (CFD), the design of flow control devices in tundishes with the help of mathematical models has become increasingly efficient. For example, Chen Guojun [4] optimized a circular turbulence inhibitor in a tundish with four strands using a three-dimensional flow field model, which increased the floating removal rate of inclusions for particle radii smaller than 80 µm by about 20%. Deng Anyuan [5] studied the trajectory of mixed inclusions based on a three-dimensional coupled model and found that inclusions with smaller diameters tended to remain in the casting billet and were difficult to remove; in contrast, inclusions with larger diameters floated upward for removal. Liu Ziyu [6] studied the influence of an inner-swirling turbulence inhibitor on the trajectory of inclusions in a tundish and found that an inner-swirling turbulence inhibitor could guide the inclusions to collide with each other in the impact zone of the tundish and transport the inclusions that had collided to the molten steel surface for removal. Li Jian [7] studied the three-phase interaction behavior of molten steel bubbles and inclusions based on the Euler–Lagrange model. The interactions between the steel liquid and bubbles, steel liquid and inclusions, and bubbles and inclusions were considered in the model. The results showed that bubble adhesion to the inclusions was one of the important ways to remove inclusions, which could not be ignored in the study of gas curtain baffles in the tundish. Cupek J. [8] used a medium flow and mixing methods to simulate the motion and removal of solid particles in a two-flow tundish model with CFD. The presence of recirculating flow was found to be beneficial, which may have facilitated the removal of small inclusions. Tomasz M. [9] used CFD to build VOF and DPM models. The CFD results were compared with laboratory test results using a tundish water model. The phenomena investigated were the distribution of microparticles and the concentration of mass microparticles in the model fluid. The results showed that the distribution of particles depends on the velocity of liquid flow; therefore, the distribution of particles is different for different flow regions in the tundish.
In order to study the influence of the collision and growth of inclusions in a tundish on the size distribution of inclusions, some researchers have used the Monte Carlo algorithm [10], i.e., the computer random simulation method, and combined it with the Smoluchowski model [11]. Currently, flow control devices in tundishes are designed with the help of computational models; however, the difficulty is that there is no direct and linear relation between the device’s structure and inclusion removal; the design needs additional research to be improved, which results in high costs and a long development cycle [12]. It is of great significance in the design of tundishes to study the inclusion aggregation zone through computer technology [13]. Another difficulty in the study of the tundish flow field is that, with the progress of computer technology, calculation models are becoming increasingly refined and the generated flow field database is becoming larger. However, due to the lack of data mining methods, the key characteristics of the flow field that promote the aggregation and growth of inclusions in tundishes have not been explored thus far.
In order to solve the design problem in a complex assembly system, the digital twin design [14,15,16] has been proposed in the field of modern engineering. The digital twin is a simulation process that makes full use of physical model data, sensor update data, operation historical data, and other data; it integrates multi-disciplinary, multi-physical quantity, multi-scale, and multi-probability approaches; and it completes the mapping in virtual space. This is a significant step in reverse thinking in the industrial field; that is, it provides feedback for everything that occurs in the physical world to the digital space, ensuring the coordination of the digital and physical spheres and ensuring the applicability of device design to real-world physical systems.
Based on the idea of digital twins, this study proposes an algorithm to mine and estimate the inclusion trajectory information in the flow field database and analyze the inclusion aggregation principle to rapidly identify the inclusion aggregation state and the flow field characteristics in the inclusion aggregation zone. Thus, the designed turbulence suppressor can predict the inclusion aggregation zone before the water model experiment and rapidly and reliably improve the inclusion removal rate in a tundish by integrating water model experimental data. This paves the way for the further development and optimization of flow control devices in next-generation tundishes.

2. Simulation of Flow Field

2.1. Simulation

A slab tundish from a domestic steel plant was researched using a simulation mode. The cross-sectional size of the slab is 1900 mm × 230 mm, the casting speed is 1.2 M·min−1, and the tundish capacity is 45 tons. The dimensional parameters are shown in Table 1, and its structural schematic diagram is shown in Figure 1. Due to the turbulent flow of molten steel in the tundish, the standard k and ε dual equation model [17] was used in the numerical simulation. The basic equations include the continuity equation, momentum equation, k–ε double equations, etc. The experimental model is the K–ε turbulence model coupled with a DPM (discrete phase model), and the model boundary conditions applied were the following:
  • For inclusions, the inlet is set as injection, the particles are uniformly arranged, and the inlet speed of the particles is the same as that of liquid steel.
  • The normal velocity and gradient of the free liquid surface are zero. For inclusions, the trap boundary is set. When the inclusions collide with the free liquid surface, they are adsorbed, and the wall surface is set as the non-slip boundary. When the inclusions collide directly with the wall and the velocity is no less than 0.01 m/s, the particles will be directly removed from the calculation domain and the calculation trajectory will be terminated; otherwise, the particles will be reflected by the wall.
  • The water outlet of the tundish is the pressure outlet. For inclusions, the escape boundary is set. When the inclusions reach the lower outlet of the calculation domain, they escape from the outlet.
According to the above model assumptions, governing equations, and boundary conditions, a geometric model of the tundish was established, and the mesh was divided using ANSYS ICEM 16.0 software. Finally, the mathematical model was established via ANSYS FLUENT 16.0 software, and the calculation was completed. The number of grids in the entire tundish computing domain is more than 1.1 million cells, using unstructured grids. The three-dimensional flow field inside the tundish and the trajectory of the inclusions were simulated via a coupling algorithm. The dispersion of each item in the equation was adopted in the second-order upwind format, and the convergence residual was set to 10−5.

2.2. Flow Field Data Analysis

Based on the simulation model, a numerical simulation of three-dimensional unsteady flow [18] of molten steel in the tundish was carried out. The trajectory of the inclusions was simulated using a discrete phase model [19], as shown in Figure 2. A large number of simulations were carried out for different casting speeds, with 32 forms of turbulence inhibitors in the tundish. The experimental parameters are shown in Table 2. Orthogonal experiments (L3×4) were used to form 32 groups of experimental schemes. The obtained flow field data and the trajectory of inclusions with a particle size of 5μm were stored for analysis in the flow field database and the inclusion database; the flow and inclusion data total reached about 6 TB. As shown in Figure 2, the inclusions were not evenly distributed in the tundish, and there were some local cluster zones in the tundish.

3. Algorithm

In order to extract the key information of the flow field that promotes the accumulation of inclusions in the tundish, our research established an inclusion/flow field database production clustering mining algorithm to process the flow and inclusion data.

3.1. The Database

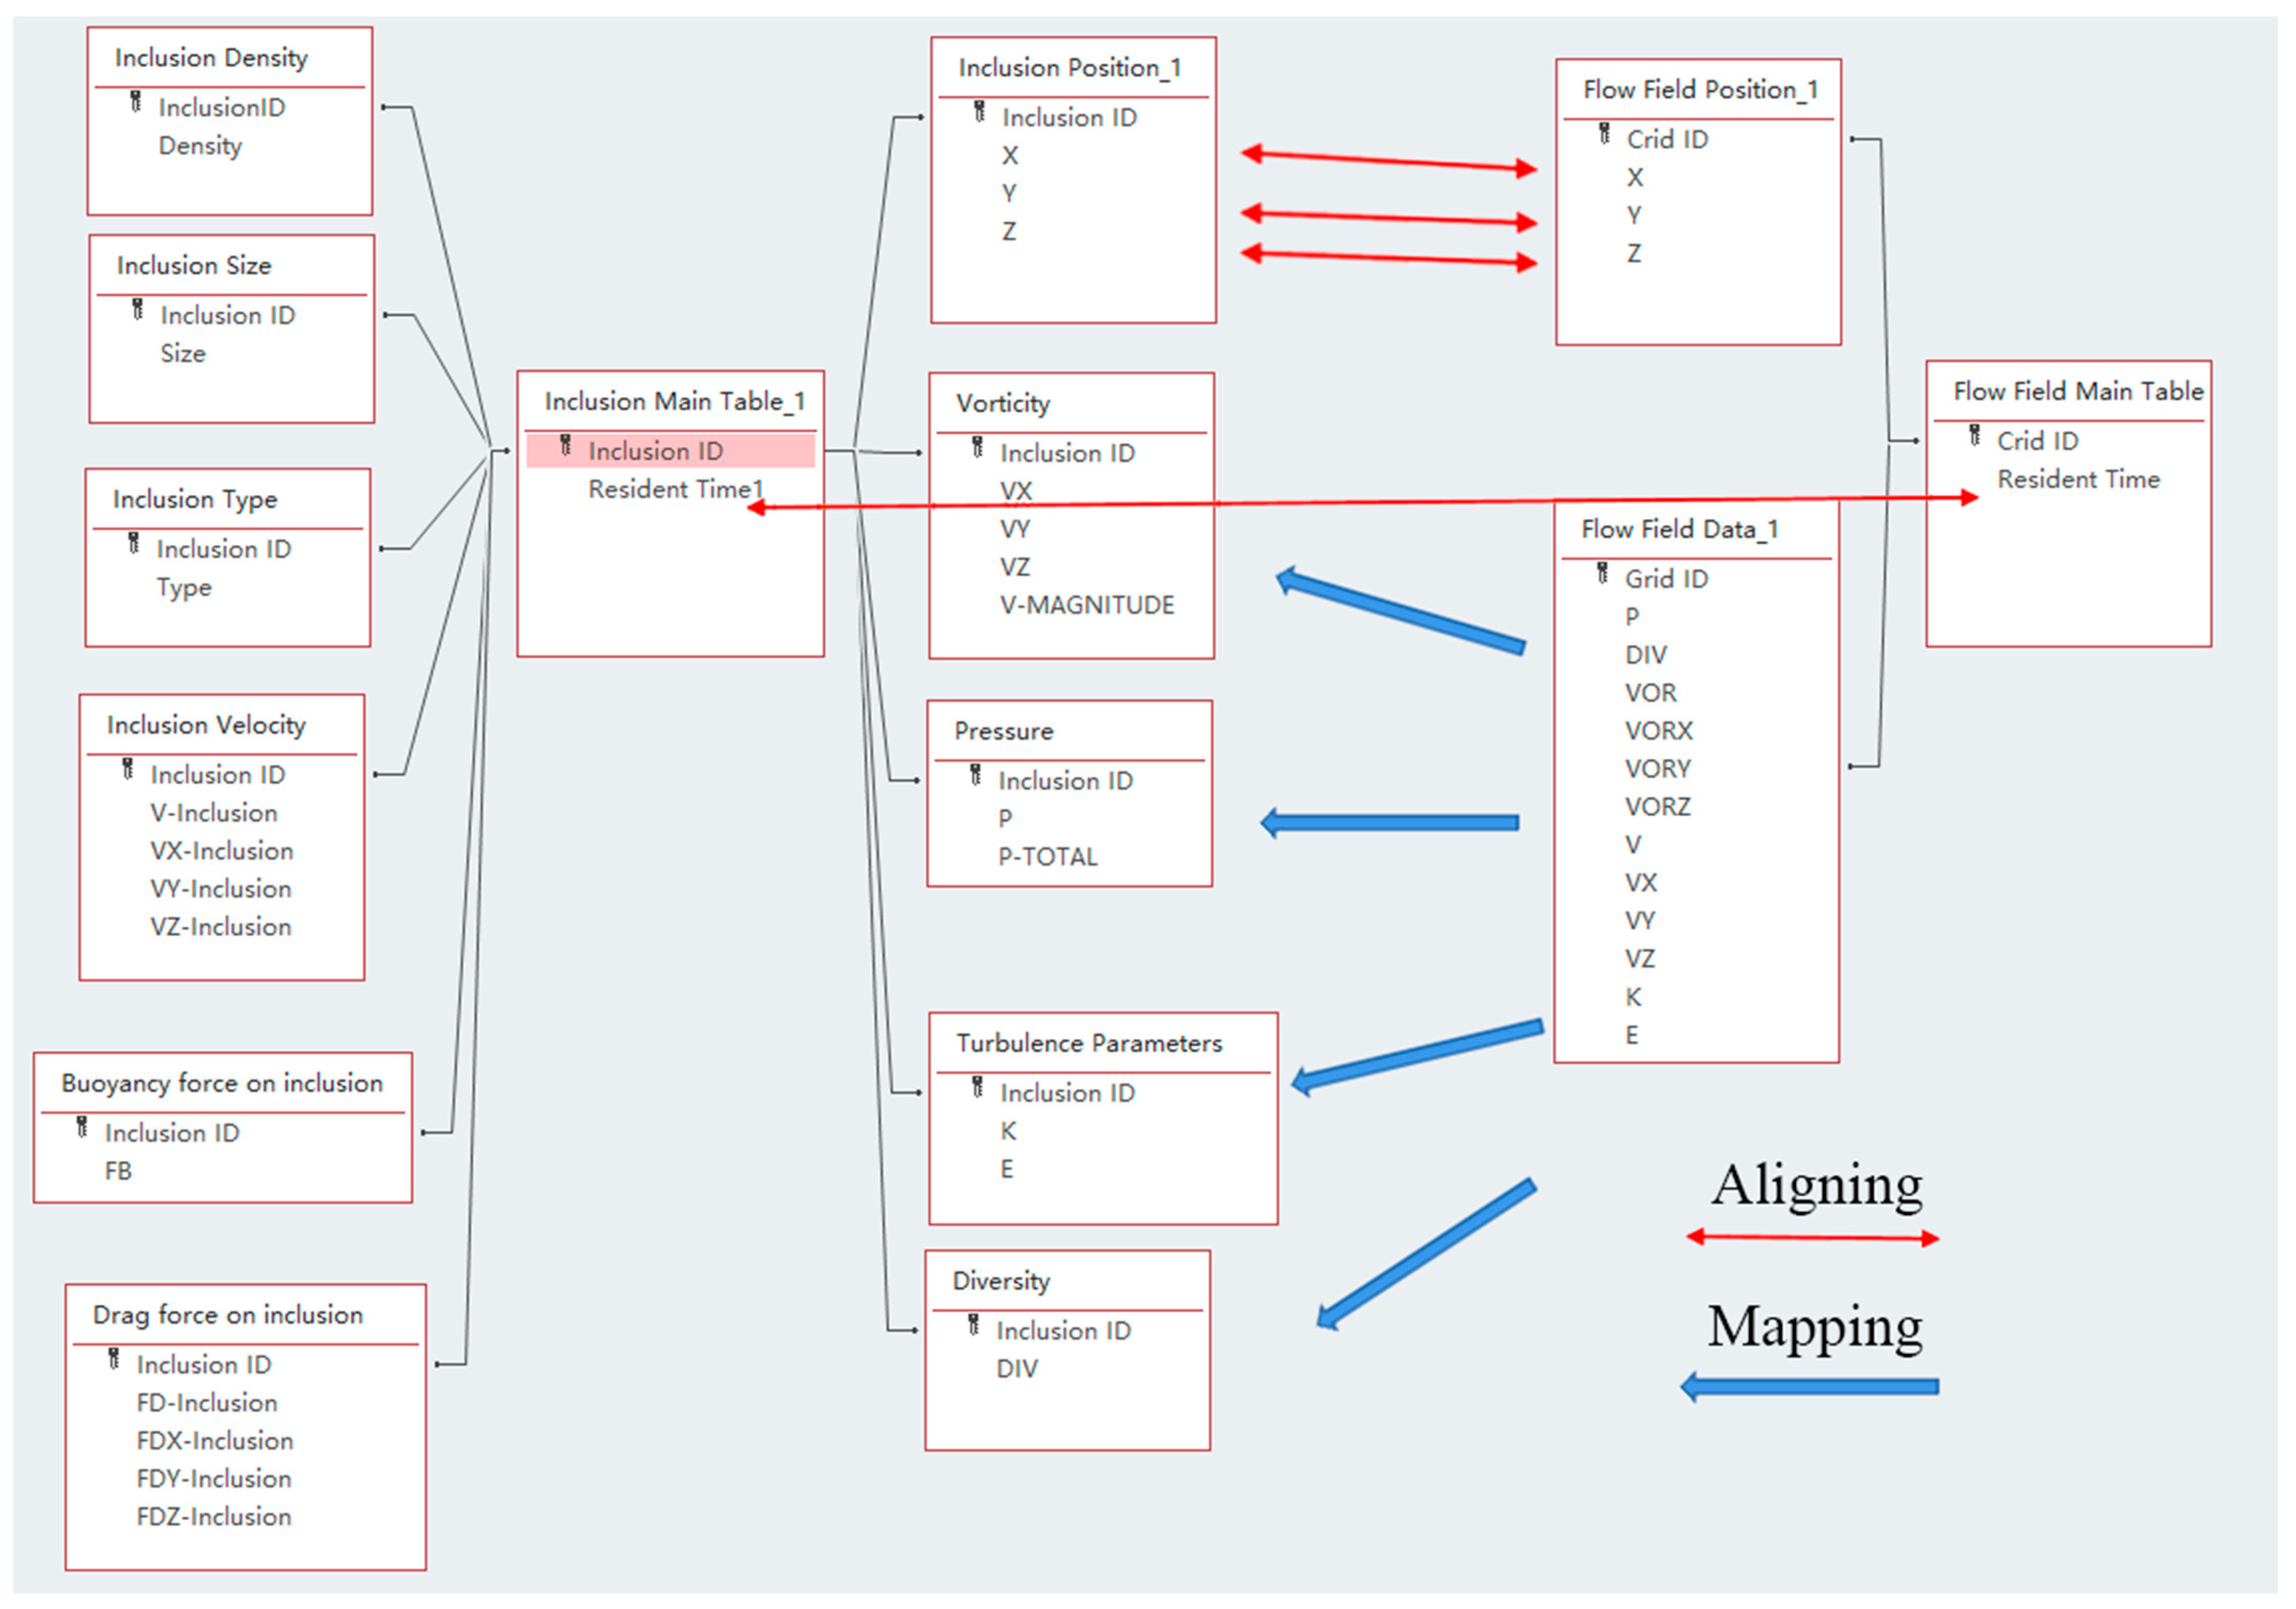
According to the theory of inclusion, the pressure, velocity, turbulence kinetic energy, vorticity, and divergence of the flow field around the inclusion have a significant effect on the trajectory and distribution of the inclusion [20,21]. Based on the calculation characteristics of CFD [22,23], the inclusion identity code was set as the main key in the inclusion database, and the inclusion database was constructed based on the star model. The inclusion database and the flow field database were aligned by the position and the residence time tables, and then the flow field database was mapped to obtain the flow field data around the inclusions, as shown in Figure 3.

3.2. Algorithm Framework for Production Clustering Mining

The production clustering mining algorithm proposed in this study can extract key information of the flow field in the aggregation zone of inclusions in the tundish. The algorithm steps are as follows.

3.2.1. Establishment of the Temporary Library, Reading, and Diversified Output of

Python was used to operate the inclusion database, including the following:
  • Reading the number of rows, columns, row values, and column values in the data table.
  • Reading the value and data type of the data.
  • Adding, deleting, and modifying table data.
The flow field data of inclusions at the same residence time were imported into a temporary library through database operations. In addition to the location information of each inclusion and the flow field data around it, a new label table was created in the temporary library to store the aggregation information of inclusions.
Matplotlib [24] was used to visualize the data in the temporary library and provide diverse output formats to confirm the locations of inclusions in the intermediate package, thereby facilitating data sampling.

3.2.2. Set Aggregation with the BFS Algorithm [25]

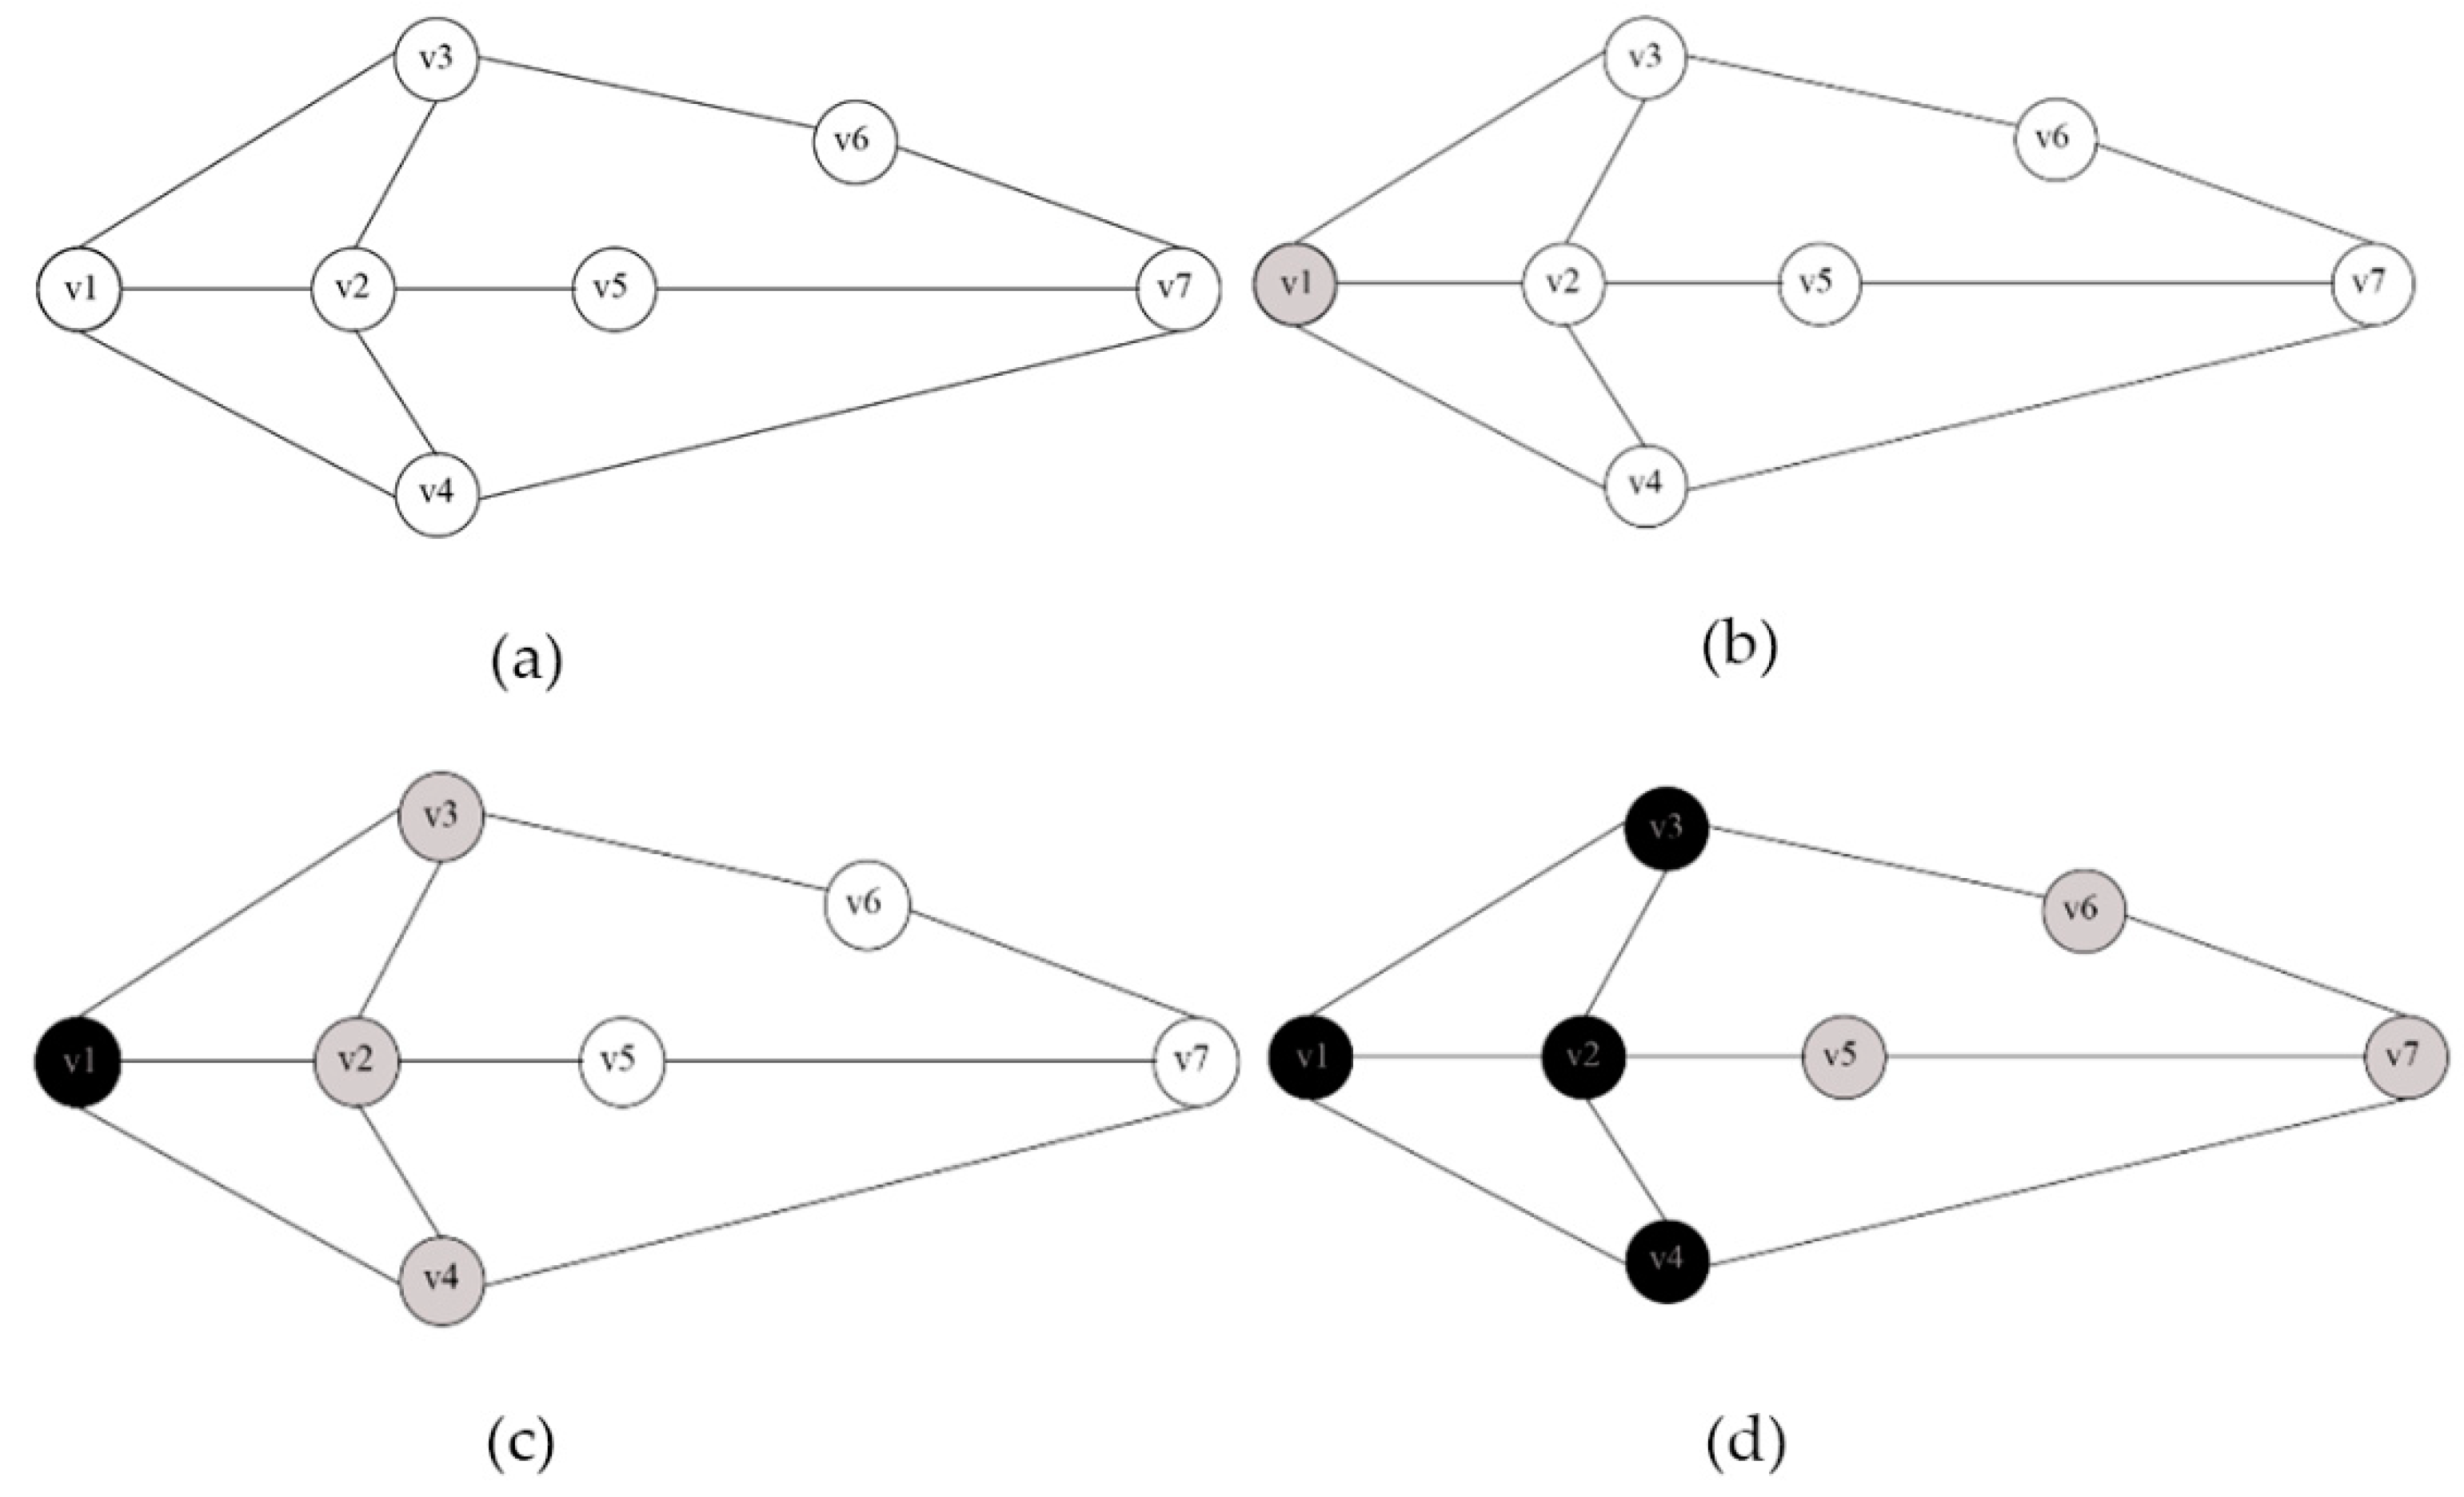
The BFS algorithm is a traversal algorithm for connected graphs, and is also the algorithm prototype of many important graph algorithms. The Dijkstra single-source shortest path algorithm [26,27] and the Prim minimum spanning tree algorithm both adopt the same idea of breadth-first search, which is a uninformed search. The purpose is to systematically expand and check all nodes in a graph to find the desired results. The BFS algorithm does not consider the possible positions of the results and thoroughly searches the entire graph until the results are found. The basic process is that BFS starts from the root node and traverses the nodes of the tree (graph) along its breadth. If all of the nodes are accessed, the algorithm terminates. Usually, queue data structures are used to assist in implementing the BFS algorithm. The schematic diagram is as follows.
Algorithm process:
  • Provide a connected graph and initialize it all in white (not visited), as shown in Figure 4a;
  • The search starting point V1 (gray) is shown in Figure 4b;
  • V1 (black) has been searched, and V2, V3, and V4 (grayed out) are about to be searched, as shown in Figure 4c;
  • Repeat the above operation for V2, V3, and V4 until V7 is found, as shown in Figure 4d.
In this study, the relationship between inclusion points was first determined by establishing a graph; then, the BFS algorithm was used to traverse the entire graph, finding inclusion points with the same key to the maximum extent possible and placing the found points in the same set. Then, the inclusion points in the same set form an inclusion aggregation set; finally, the inclusion in the inclusion aggregation set is marked.

3.2.3. Utilizing a Production Mining Algorithm to Extract Feature Flow Field Information in the Inclusion Aggregation Zone

In the proposed process, t-detection is performed on the local pressure, velocity, turbulence kinetic energy, vorticity, and divergence values of all inclusions based on whether they are aggregated or not. There are usually three types of t-tests [28], namely, one-sample t-tests [29], two-sample t-tests [30,31], and paired sample t-tests [31].
This research is based on the use of Python’s scipy.stats function to carry out two-sample t-tests. The principle is to test the difference between the mean values of two sets of unrelated samples.
  • Proposed Assumptions:
H0. 
μ1 = μ2 (null hypothesis|original hypothesis|null hypothesis, where μ1 is the mean value of sample 1, μ2 is the mean value of sample 2).
H1. 
μ1 ≠ μ2 (alternative hypothesis).
2.
The inspection level is determined (α = 0.05).
3.
The t-value is calculated.
The calculation formulas for the t-values and degrees of freedom in independent sample t-tests vary depending on whether the variances of the two sets of samples are equal.
4.
When the two sets of variances are homogeneous, the Student’s t-method can be used:
t = X 1 ¯ X 2 ¯ S 2 n 1 + S 2 n 2
where X 1 ¯ and X 2 ¯ are the means of the two samples, n 1 and n 2 are the capacities of the two samples, and S is the standard deviation of the samples. The calculation formula of S is the following:
S = i = 1 n 1 x i X 1 ¯ 2 + j = 1 n 2 x j X 2 ¯ 2 n 1 + n 2 2
The degrees of freedom in the Student t-method are as follows:
d f = n 1 + n 2 2
5.
When the variance is heterogeneous, the Welch t-test method is used, and the formula for calculating the t-value is the following:
t = X 1 ¯ X 2 ¯ S 1 2 n 1 + S 2 2 n 2
where X 1 ¯ and X 2 ¯ are the mean values of the two samples, n 1 and n 2 are the capacities of the two samples, and S 1 and S 2 are the variances of the two samples. The calculation formula for the degrees of freedom is the following:
d f = S 1 2 n 1 + S 2 2 n 2 S 1 4 n 1 2 n 2 1 + S 2 4 n 2 2 n 1 1
6.
The boundary value table is checked to determine the p-value; the boundary value table is determined according to degrees of freedom ( d f ) and inspection level (α).
7.
If the calculated t-value is less than the critical value p at the α level, this indicates that p > α at the t value. Therefore, at the α level, the original hypothesis should be accepted and the alternative hypothesis should be rejected, and vice versa.
The local flow field parameters around inclusions, such as pressure, velocity, turbulence kinetic energy, vorticity, and divergence values, were checked, as well as the parameters that differed significantly in and out of the inclusions aggregate zone. Flow field parameters leading to the aggregation of inclusions were generated, and they were marked as primary parameters leading to the aggregation of inclusions. The slot value of this fact also includes the range of characteristic parameters.
In the agenda, t-detection was performed for the inclusions that are marked as significant in the primary flow field parameter slot again. The new fact that marks secondary flow field parameters, leading to the aggregation of inclusions, and its range were then produced. This is repeated until there are no new facts produced. The parameter information from all facts that are marked significant in the fact library was extracted to obtain the characteristic flow field parameters in the inclusion aggregation zone and their ranges.

4. Analysis

4.1. Analysis Objects

In this study, the algorithms of production clustering mining were used to analyze the flow field characteristics of the inclusion aggregation zone in a tundish with an inner-swirling turbulence inhibitor. The inner-swirling turbulence inhibitor was installed on the bottom surface directly below the shroud; the outer shape is a cylinder, and the inner shape is a cylinder combination. There were different types of blocks arranged in a circular pattern on the bottom of the inhibitor, and the blocks were placed according to a certain degree of rotation. The schematic diagram of the model is shown in Figure 5, and the parameters are shown in Table 3.
Based on the residence time of inclusions in the tundish, the inclusion/flow field database production clustering mining algorithm can be used to obtain the range of flow field characteristic parameters for the inclusion aggregation zone in the tundish.

4.2. Characteristic Parameters in the Inclusion Aggregation Zone in the Tundish Impact Zone

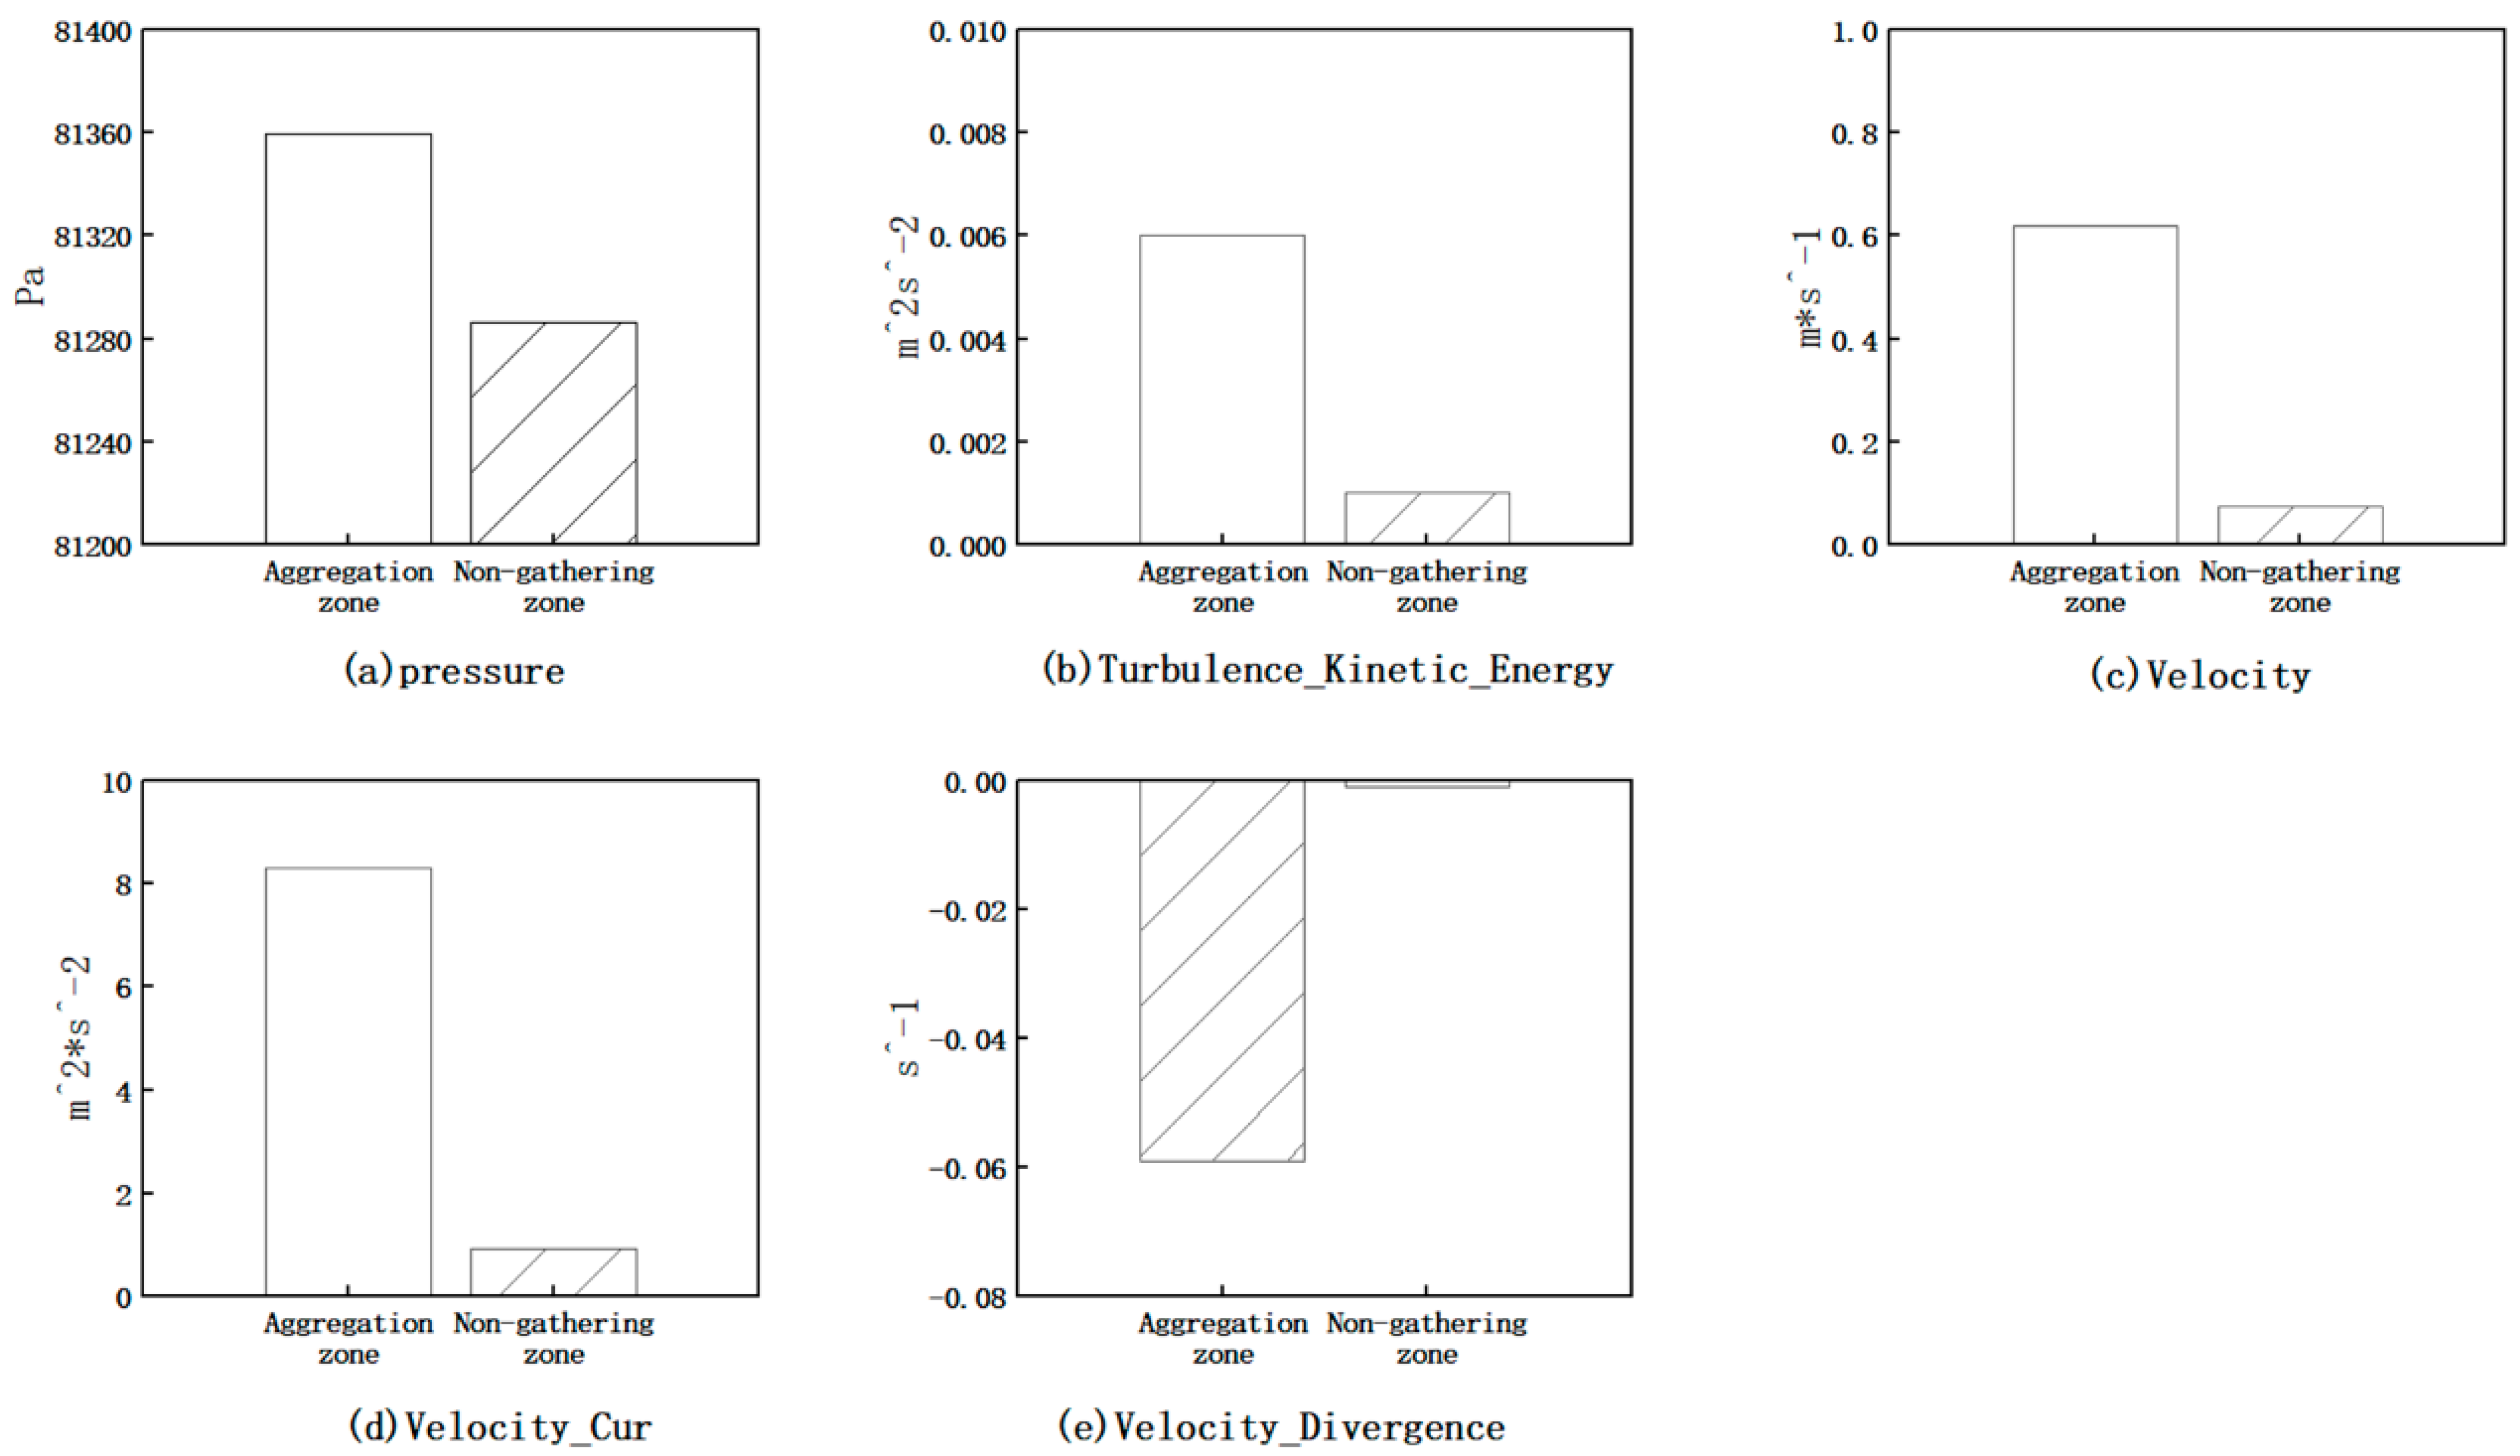
According to the time analysis, the influence of factors on the inclusion aggregation in the impact zone above the turbulence inhibitor was analyzed. According to the inclusion/flow field database production clustering mining results, as shown in Figure 6, it was shown that there is a main aggregation zone of inclusions in the impact zone; the zone is located above the internal swirling turbulence inhibitor and at the boundary between the high-speed zone and the low-speed zone. The primary parameters leading to the aggregation of inclusions are pressure, turbulence kinetic energy, velocity, and vorticity, and no secondary parameters are produced. This shows that the flow in the impact zone is intense, and the inclusions are highly aggregated. In the processing of the inclusion/flow field database production clustering mining algorithm, the inclusion data were analyzed via a t-test, as shown in Table 4. The results were treated using the matplotlib library to convert the data into the diagram in Figure 7. The results show that the p-values of pressure, turbulence kinetic energy, velocity, and vorticity are far lower than 0.05, and the Cohen’s d value is far larger than 0.02.
Through the analysis of Table 4 and Table 5 and Figure 7 and Figure 8, the flow field for the inclusion aggregation zone in the impact zone is characterized by a high pressure, high speed, high turbulence kinetic energy, and a high vorticity environment compared to the non-aggregation zone, in which the velocity and vorticity have a greater influence on inclusion aggregation.

4.3. Flow Field Characteristic Parameters in the Inclusion Aggregation Zone Outside the Impact Zone

The main parameters of the inclusion aggregation zone outside the impact zone were analyzed using the inclusion/flow field database production clustering mining algorithm. The results show that the main inclusion aggregation zone is located at the vortex core in the slow speed zone, below the molten steel stream flowing out of the guide hole. As shown in Figure 9a,b, the data were analyzed via a t-test, and the results are shown in Table 6. The calculation results of the algorithm show that the primary parameter leading to inclusion aggregation is pressure, and there is a significant difference in the flow field pressure in the aggregation zone, p < 0.05, and the difference amplitude Cohen’s d value is > 0.02. A comparison of the p-values for each parameter is shown in Table 5.
According to the above t-test analysis, the inclusions located in the aggregation zone outside the turbulence inhibitor are mainly affected by pressure and secondly by vorticity. It can be seen from Figure 10 and Figure 11 that the aggregation zone of inclusions outside the impact zone is characterized by a high pressure and a low vorticity, that is, the vortex core outside the impact zone.

4.4. Pseudo-Code for Screening the Inclusion Aggregation Zone Location

According to the inclusion/flow field database production clustering mining algorithm, data mining was carried out for the flow field of the tundish equipped with an inner-swirling turbulence inhibitor to screen the location of the inclusion aggregation zone and to determine the flow field characteristics of the inclusion aggregation zone. According to the calculation results, in this paper, a pseudo-code was designed to screen the inclusion aggregation zone used for the digital twin design of the tundish turbulence inhibitor, as shown in Algorithm 1.
Algorithm 1: Occluded foreign substance aggregation area selection; digital twin algorithm for inclusions aggregation area in the tundish
Input: Coordinate Axis X, Y, Z; Parcel_Diameter Pdi; Occluded foreign substance Nodei; Overall Occluded foreign substance data The whole data;
Output: Occluded foreign substance aggregation area gather_area
  • for i in The whole data do
  • for j in The whole datai do
  • If   ( X 1 X 2 ) 2 + ( Y 1 Y 2 ) 2 + ( Z 1 Z 2 ) 2 P d 1 + P d 2 2 then
  • Set the node to each other’s keywords
  • gather_area = bfs(Node1, Node2);
  • return gather_area;

5. Water Model Experiment

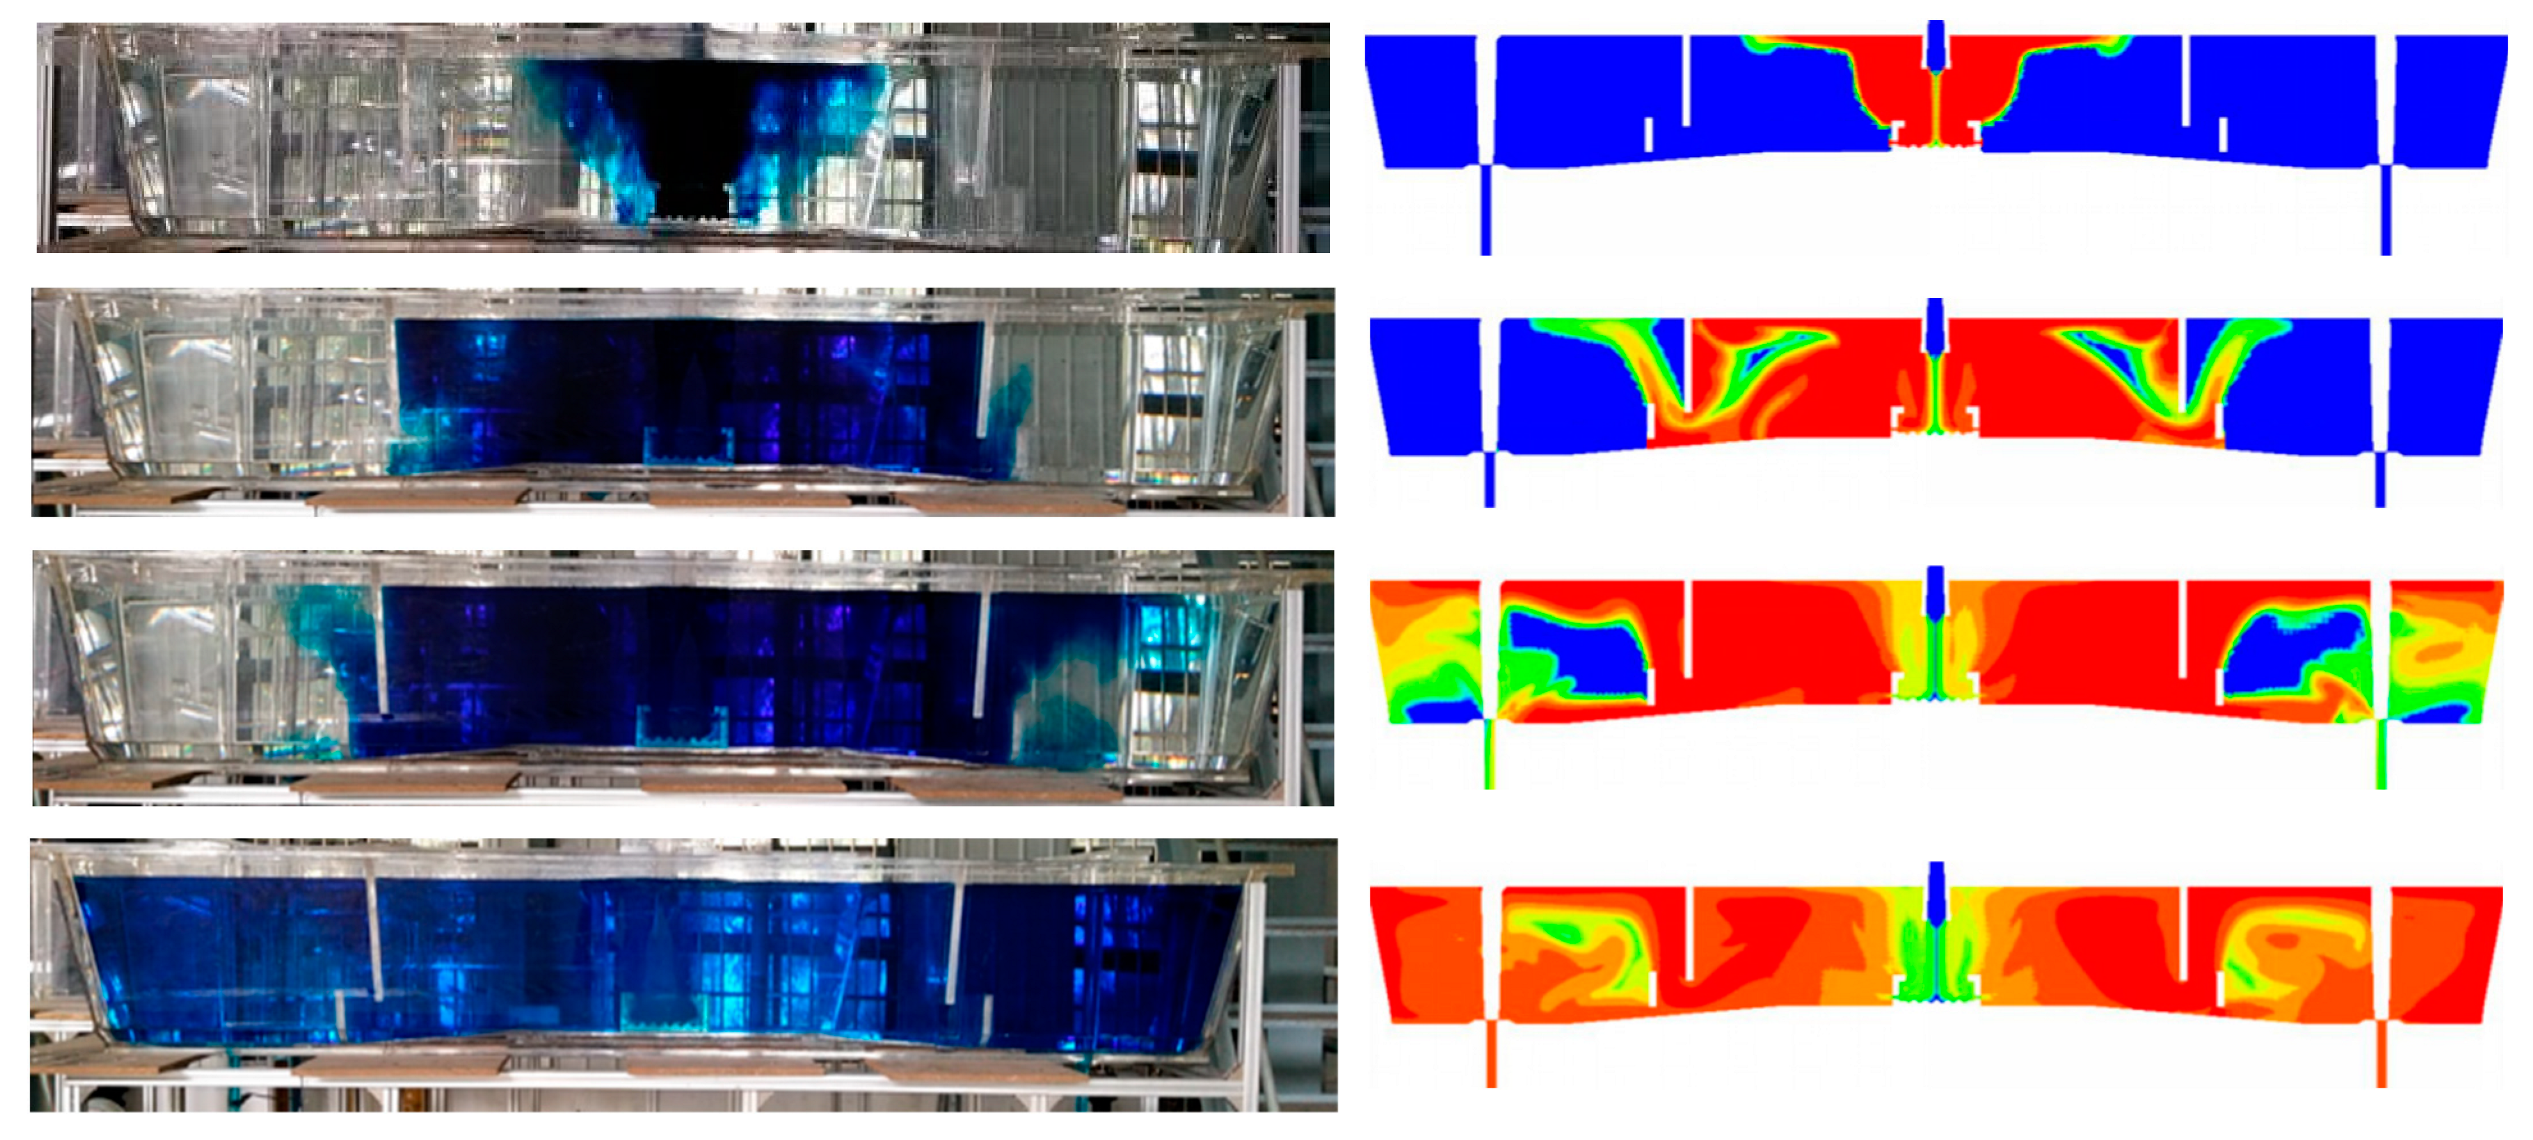
A flow field display experiment was carried out using methylene blue as a tracer on the water model of the tundish and the characteristics of the flow field were determined, as shown in Figure 12. The shape of the flow field of the water model is basically consistent with the position of the characteristic points of the numerical simulation, which indicates that the calculation results of the numerical model are reliable and verified by the water model. The parameters of the water model are shown in Table 7.

6. Digital Twin Design of the Turbulence Inhibitor

According to the results of the production clustering mining algorithm for inclusion/flow field databases, it can be seen that the aggregation zone of inclusions is around the turbulence inhibitor, which has a primary impact on the aggregation of inclusions. On this basis, the turbulence inhibitor was optimized in three aspects, namely, the size of the turbulence inhibitor body, the size of the guide pier, and the size of the guide hole. The goal is to make the aggregation zone of inclusions in the impact zone as close as possible to the mouth of the turbulence inhibitor, so that as many inclusions as possible, especially those <10 µm, can collide with each other and grow. On the other hand, the aggregation zone of inclusions outside the impact zone should be as close to the upwelling stream as possible so that the aggregated and grown inclusions can float up and be removed from the molten steel surface by the steel flow. Therefore, based on the idea of digital twin design, a nonlinear feedback link was established between the inclusion removal rate obtained from the water model experiment and the inclusion aggregation zone location obtained from the inclusion/flow field database production clustering mining algorithm to optimize the turbulence suppressor. Finally, the reasonable design parameters of the turbulence suppressor are shown in Table 8, and the actual image of the improved turbulence inhibitor is shown in Figure 13.
From Figure 14, it can be seen that using the optimized inner-swirling turbulence inhibitor, the 1:3 water model experiment showed that the inclusion removal rate (residence time of 1800 s) increased by 14.4% before and after optimization, effectively improving the cleanliness of the molten steel in the tundish. Currently, the turbulence inhibitor is in practical use and is achieving good inclusion removal rates in both the start-up and stable casting stages in a tundish in a Chinese steel mill.

7. Conclusions

In this study, data mining of the flow field of a tundish was carried out based on the inclusion/flow field database production clustering mining algorithm, and according to the data mining results, the inclusion aggregation zone was screened out. The results showed the following:
(1)
The flow field in the inclusion aggregation zone in the tundish impact zone is characterized by high pressure, high speed, high turbulence kinetic energy, and high vorticity, and it is located in the area above the inhibitor where the median flow velocity is 0.618 m/s with a deviation range of ±0.307 m/s and the median vorticity is 10.25 m2/s2, with a deviation range of ±0.883 m2/s2.
(2)
The flow field in the inclusion aggregation zone outside the tundish impact zone is characterized by high pressure and low vorticity at the vortex center of the flow field, where the median pressure of the flow field is 82,525 Pa and the deviation range is ±7.85 Pa.
(3)
According to the results of algorithm mining, a pseudo-code was designed to screen the inclusion aggregation zone in the tundish.
(4)
Based on the digital twin method, the design of an inner-swirling turbulence inhibitor was optimized through combining data mining and water model experimental data results, resulting in a 14.4% increase in the removal rate of inclusions at the outlet of the water model.

Author Contributions

Y.J., F.G. and J.W. proposed and designed the project process. X.L., Z.L. and P.L. were responsible for data collection. Z.H. and H.L. were responsible for data verification. All authors made considerable contributions to the results and discussion. J.W. and Y.J. wrote and revised the article. All authors have read and agreed to the published version of the manuscript.

Funding

This research received no external funding.

Data Availability Statement

Publicly available datasets were analyzed in this study. These data can be found at the following site: https://orcid.org/0009-0007-7930-7388 (accessed on 11 August 2023).

Conflicts of Interest

The authors declare no conflict of interest.

References

  1. Yazdi, M.R.M.; Khorasani, A.R.F.; Talebi, S. Experimental Investigation of Flow Control Devices Effect on Inclusion Separation in a Four Strand Tundish. Can. Metall. Q. 2019, 58, 379–388. [Google Scholar] [CrossRef]
  2. Zheng, S.G.; Zhu, M.Y. Optimization of Flow Control Devices in a Ten-Strand Billet Caster Tundish. China Foundry 2016, 13, 414–421. [Google Scholar] [CrossRef]
  3. Santos, G.G.; Antônio, D.S.C.; Fernandes, R.R.; Seara, M.R.; Varadarajan, S.; Mol, P.J.J. Inclusion Removal Studies in a Two-Strand Tundish: Effect of Substitution of Turbulence Inhibitor with Dams and Effect of Teeming Ladle and Ladle Shroud Set Asymmetry Employing Physical and Mathematical Modeling. Trans. Indian Inst. Met. 2023, 76, 1853–1861. [Google Scholar]
  4. Cheng, G.J.; Lei, H.; Geng, X.Q.; Han, D.; Chen, J.; He, Y.C. Influence of Turbulence Inhibitor on Removal Rate of Inclusion in a Special-Shaped Continuous Casting Tundish. Steelmaking 2010, 26, 51–54. [Google Scholar]
  5. Deng, A.Y.; He, Y.C.; Jia, G.L. Trajectories of Inclusions during Solidification of Steel Square Billet. J. Northeast. Univ. 2000, 21, 532–535. [Google Scholar]
  6. Liu, Z.Y.; Jin, Y.; Gan, F.F.; Lin, P.; Huang, J.Y.; Li, J. Analysis of Optimization Weights for Flow Field of Internal Rotation Stabilizer Coupled with Porous Retaining Wall. Metals 2021, 11, 1208. [Google Scholar] [CrossRef]
  7. Li, J.; Lu, J.L.; Luo, Z.G.; Zhou, Z.S. Numerical Simulation of Inclusion Removal in Tundish with Gas Curtain. Steelmaking 2023, 39, 52–57. [Google Scholar]
  8. Cupek, J.; Tkadlecková, M.; Merder, T.; Walek, J.; Saternus, M.; Pieprzyca, J. Computational fluid dynamics (CFD) analysis of medium flow and removal of inclusions in a two-strand tundish. Metalurgija 2023, 63, 3–4. [Google Scholar]
  9. Tomasz, M.; Jacek, P.; Marek, W.; Piotr, W.; Aryur, H. Evolution of the Numerical Model Describing the Distribution of Non-Metallic Inclusions in the Tundish. Materials 2021, 14, 9. [Google Scholar]
  10. Dandekar, R.; Rajesh, R.; Subashri, V.; Zaboronski, O. A Monte Carlo Algorithm to Measure Probabilities of Rare Events in Cluster-Cluster Aggregation. Comput. Phys. Commun. 2023, 288, 108727. [Google Scholar] [CrossRef]
  11. Zhang, B.W.; Deng, K.; Lei, Z.S.; Ren, Z.M. A Mathematical Model on Coalescence and Removal of Inclusion Particles in Continuous Casting Tundish. Acta Metall. Sin. 2004, 40, 623. [Google Scholar]
  12. Yang, M.L.; Cheng, C.G.; Li, Y.; Lu, H.B.; Zhou, Y.; Jin, Y. Development of Control Technology and Clogging Mechanism for Tundish Nozzle in Continuous Casting. J. Iron Steel Res. 2017, 29, 773–780. [Google Scholar]
  13. Lei, H.; He, J. Numerical Simulation for Collision and Aggregation of Inclusions in a Slab Continuous Caster. Steel Res. Int. 2016, 78, 659–728. [Google Scholar] [CrossRef]
  14. Lo, C.K.; Chen, C.H.; Zhong, R.Y. A Review of Digital Twin in Product Design and Development. Adv. Eng. Inform. 2021, 48, 101297. [Google Scholar] [CrossRef]
  15. Barricelli, B.R.; Casiraghi, E.; Fogli, D. A Survey on Digital Twin: Definitions, Characteristics, Applications, and Design Implications. IEEE Access 2019, 7, 167653–167671. [Google Scholar] [CrossRef]
  16. Liu, M.N.; Fang, S.L.; Dong, H.Y.; Xu, C.Z. Review of Digital Twin about Concepts, Technologies, and Industrial Applications. J. Manuf. Syst. 2021, 58, 346–361. [Google Scholar] [CrossRef]
  17. Tarek, M.; Faroogh, G.; Tew-Fik, M. Numerical Modeling of Liquid Spills From the Damaged Container and Collision of Two Rising Bubbles in Partially Filled Enclosure Using Modified Volume-of-Fluid (VOF) Method. Eng. Anal. Bound. Elem. 2023, 154, 83–121. [Google Scholar]
  18. Zhang, H.; Fang, Q.; Deng, S.Y.; Liu, C.; Ni, H.W. Multiphase Flow in a Five-Strand Tundish Using Trumpet Ladle Shroud during Steady-State Casting and Ladle Change-Over. Steel Res. Int. 2019, 90, 1800497. [Google Scholar] [CrossRef]
  19. Tkadlečková, M.; Walek, J.; Michalek, K.; Huczal, T. Numerical Analysis of RTD Curves and Inclusions Removal in a Multi-Strand Asymmetric Tundish with Different Configuration of Impact Pad. Metals 2020, 10, 849. [Google Scholar] [CrossRef]
  20. Zhu, M.M.; Peng, S.K.; Jiang, K.C.; Luo, J.; Zhong, Y.; Tang, P. Fluid Flow and Heat Transfer Behaviors under Non-Isothermal Conditions in a Four-Strand Tundish. Metals 2022, 12, 840. [Google Scholar] [CrossRef]
  21. Gupta, K.V.; Pradeep, K.J.; Pramod, K.J. Numerical Investigation on Gas Bubbling Assisted Inclusion Transport and Removal in Multistrand Tundish. Met. Mater. Int. 2022, 28, 2146–2165. [Google Scholar] [CrossRef]
  22. Holzinger, G.; Thumfart, M. Flow Interaction in Continuous Casting Tundish Due to Bubble Curtain Operation. Steel Res. Int. 2019, 90, 1800642. [Google Scholar] [CrossRef]
  23. Wang, Q.; Liu, Y.; Huang, A.; Yan, W.; Gu, H.Z.; Li, G.Q. CFD Investigation of Effect of Multi-hole Ceramic Filter on Inclusion Removal in a Two-Strand Tundish. Metall. Mater. Trans. 2020, 51, 276–292. [Google Scholar] [CrossRef]
  24. Barrett, P.; Hunter, J.; Miller, J.T.; Hsu, J.-C.; Greenfield, P. Matplotlib--A Portable Python Plotting Package. In Astronomical Data Analysis Software and Systems XIV ASP Conference Series, Proceedings of the XIV ASP Conference, Pasadena, CA, USA, 24–27 October 2004; Astronomical Society of the Pacific: San Francisco, CA, USA, 2005; Volume 347, pp. 24–27. [Google Scholar]
  25. Tahlyan, D.; Pinjari, A.R. Performance Evaluation of Choice Set Generation Algorithms for Analyzing Truck Route Choice: Insights from Spatial Aggregation for the Breadth First Search Link Elimination (BFS-LE) Algorithm. Transp. A: Transp. Sci. 2020, 16, 1030–1061. [Google Scholar] [CrossRef]
  26. Jasika, N.; ALispahic, N.; Elma, A.; Ilvana, K.; Elma, L.; Nosovic, N. Dijkstra’s Shortest Path Algorithm Serial and Parallel Execution Performance Analysis. In Proceedings of the IEEE 35th International Convention MIPRO 2012, Opatija, Croatia, 21–25 May 2012; pp. 1811–1815. [Google Scholar]
  27. Martel, C. The Expected Complexity of Prim’s Minimum Spanning Tree Algorithm. Inf. Process. Lett. 2002, 81, 197–201. [Google Scholar] [CrossRef]
  28. Kyun, K.T. T test as a parametric statistic. Korean J. Anesthesiol. 2015, 68, 540–546. [Google Scholar]
  29. Posten, H.O. The Robustness of the One-Sample t-Test Over the Pearson System. J. Stat. Comput. Simul. 1979, 9, 133–149. [Google Scholar] [CrossRef]
  30. Schober, P.; Vetter, T.R. Two-Sample Unpaired t Tests in Medical Research. Anesth. Analg. 2019, 129, 911. [Google Scholar] [CrossRef]
  31. Xu, M.F.; Fralick, D.; Zheng, J.Z.; Wang, B.K.; Tu, X.M.; Feng, C.Y. The Differences and Similarities Between Two-Sample t-Test and Paired t-Test. Shanghai Arch. Psychiatry 2017, 29, 184–188. [Google Scholar]
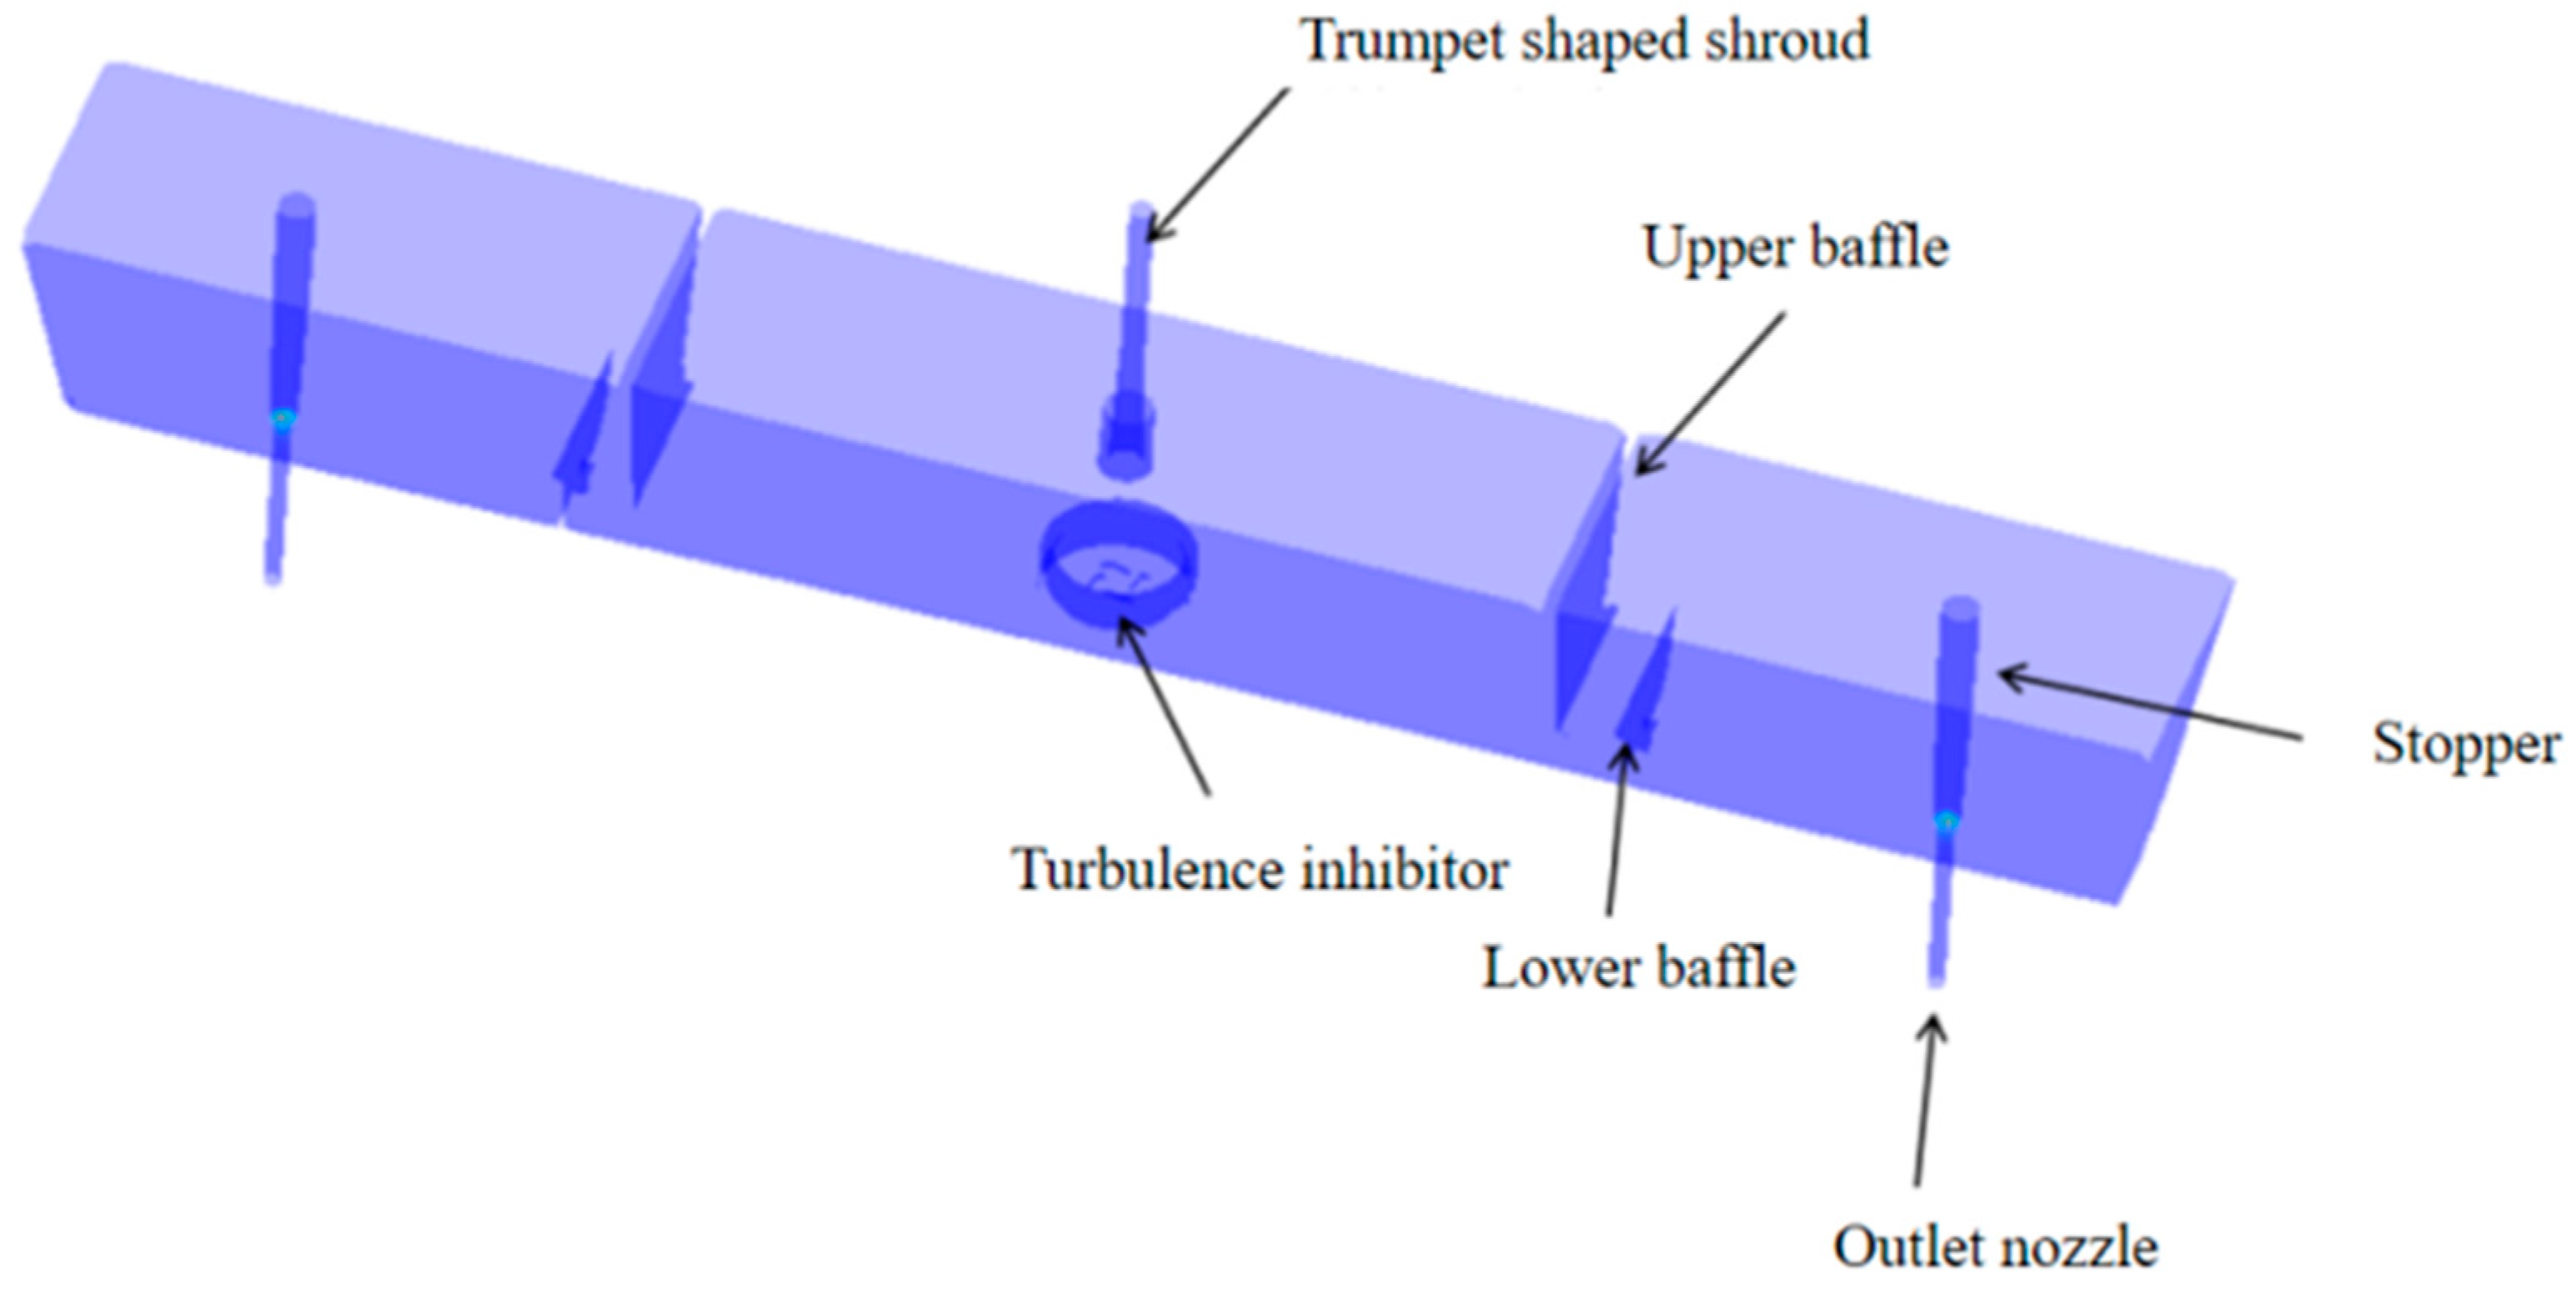
Figure 1. Schematic diagram of tundish.
Metals 13 01651 g001
Figure 2. Distribution of 5 µm inclusions in the tundish at a pull rate of 1.2 m/min.
Metals 13 01651 g002
Figure 3. Structure and data source of inclusion database.
Metals 13 01651 g003
Figure 4. Traversal diagram of the BFS algorithm.
Metals 13 01651 g004
Figure 5. Internal turbulence suppressor.
Metals 13 01651 g005
Figure 6. Location map and velocity cloud map of the main aggregation zone of inclusions in the impact zone: (a) the inclusion aggregation zone in the impact zone of the tundish at 100 s, (b) the combination of the inclusion aggregation zone and the velocity distribution in the tundish. Note: The red dots in the figure represent the aggregation zone of inclusions.
Metals 13 01651 g006
Figure 7. t-test analysis diagram of the flow field parameters driving inclusion aggregation in the impact zone.
Metals 13 01651 g007
Figure 8. Comparisons of the mean values of each flow field factor in the impact zone.
Metals 13 01651 g008
Figure 9. Location map and velocity cloud map of the main aggregation area of inclusions outside the impact area: the red dot in the figure indicates the aggregation area of inclusions. (a) The inclusion aggregation zone outside the impacting zone of the tundish at 100 s; (b) the combination of the inclusion aggregation zone and the velocity distribution in the tundish. Note: the red dots in the figure are the aggregation zone of inclusions.
Metals 13 01651 g009
Figure 10. t-test analysis diagram of the flow field parameters driving inclusion aggregation outside the impact zone.
Metals 13 01651 g010
Figure 11. Comparisons of the mean values of each factor.
Metals 13 01651 g011
Figure 12. Comparison of flow fields between the water model and numerical simulation.
Metals 13 01651 g012
Figure 13. Turbulence inhibitor in the tundish after algorithm-assisted optimization.
Metals 13 01651 g013
Figure 14. Removal rates of inclusions in the tundish before and after algorithm-assisted optimization.
Metals 13 01651 g014
Table 1. Main geometric parameters of tundish prototype.
ParametersValueParametersValue
The top length of tundish/mm9000Submerged depth of shroud/mm300
The bottom length of tundish/mm8800Inner diameter of shroud (upper opening)/mm105
The top width of tundish/mm1200External diameter of shroud (lower opening)/mm235
Operation depth of molten steel/mm1100Inner diameter of outlet nozzles/mm80
Table 2. Orthogonal experimental parameter table.
Experimental Group NumberDiameter of Diversion Hole
(mm)
Diversion Pier Height
(mm)
Diversion Pier Position
(mm)
Outer Diameter of Turbulence
(mm)
1973090370
210760110390
311790130410
Table 3. Parameters of the internal turbulence suppressor.
Shape of Guide HolesDiameter (mm)Width (mm)Area (m2)Hole Angle (°)
Long circular50570.008959
Table 4. Test and analysis results of flow field parameters driving inclusion aggregation in the impact zone.
Parameters CheckedPressureTurbulence Kinetic EnergyVelocityVelocity CurVelocity Divergence
p0.002736.322 × 10−94.01 × 10−72.93 × 10−90.166
Cohen’s d value1.0694.8276.6285.1010.322
Mean (inclusion aggregation zone)81,3590.0060.6188.304−0.059
Std (inclusion aggregation zone)920.0020.3073.01 s0.136
Table 5. Analysis results of a secondary t-test of the flow field parameters driving inclusion aggregation in the impact zone.
Parameters CheckedPressureTurbulence Kinetic EnergyVelocity CurVelocity Divergence
p0.320.0760.0360.923
Cohen’s d value0.4250.7790.9330.041
Mean (inclusion aggregation zone)81,3320.00710.25−0.012
Std (inclusion aggregation zone)890.0020.8830.083
Table 6. Primary t-test analysis results of the flow field parameters driving inclusion aggregation outside the impact zone.
Parameters CheckedPressureTurbulence Kinetic EnergyVelocityVelocity CurVelocity Divergence
p0.0190.6500.9550.9750.725
Cohen’s d value0.9640.1860.0230.0130.144
Mean (inclusion aggregation zone)82,5250.000 180.0440.5070.005
Std (inclusion aggregation zone)7.850.0000550.0070.2150.01
Table 7. The main geometric parameters of tundish prototype and model.
ParameterPrototype TundishModel Tundish
Total length of inner top and bottom of tundish
(mm)
9300\88233100\2941
Maximum width of inner top surface
(mm)
1304435
Depth of liquid level
(mm)
1200400
Inside diameter and outside diameter of the top of the long nozzle
(mm)
105\18535\62
Long nozzle insertion depth
(mm)
300100
Inner diameter of water outlet
(mm)
8027
Diversion pier thickness
(mm)
6020
Plug diameter at liquid level
(mm)
16254
Table 8. Parameters of the internal turbulence inhibitor after optimization.
Guide Hole ShapeWidth (mm)Area (m2)Guide Hole Angle (°)
Long circular620.010946
Disclaimer/Publisher’s Note: The statements, opinions and data contained in all publications are solely those of the individual author(s) and contributor(s) and not of MDPI and/or the editor(s). MDPI and/or the editor(s) disclaim responsibility for any injury to people or property resulting from any ideas, methods, instructions or products referred to in the content.