

The Effect of Cooling Rate on Microstructure and Mechanical Properties of the Zr-4Hf-3Nb (wt%) Alloy

Abstract
:1. Introduction
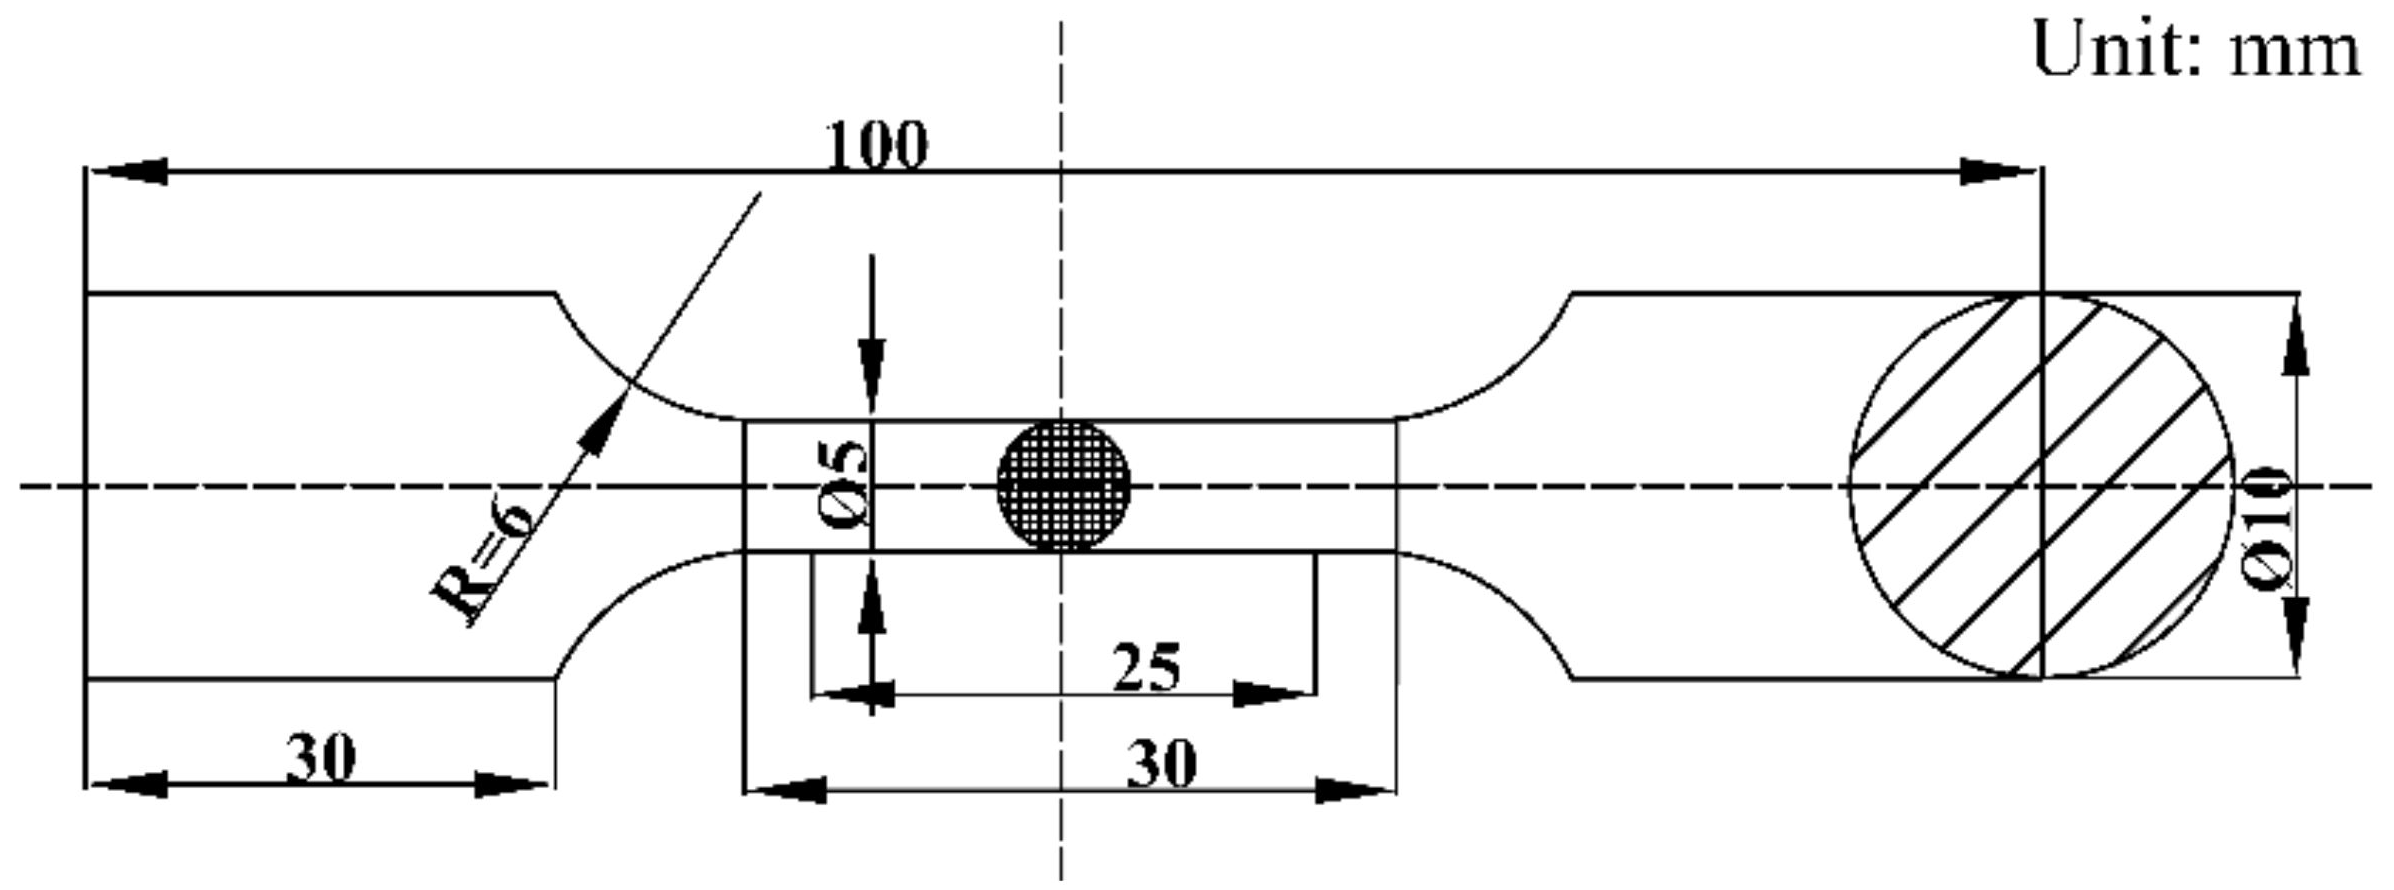
2. Experimental
3. Results and Discussion
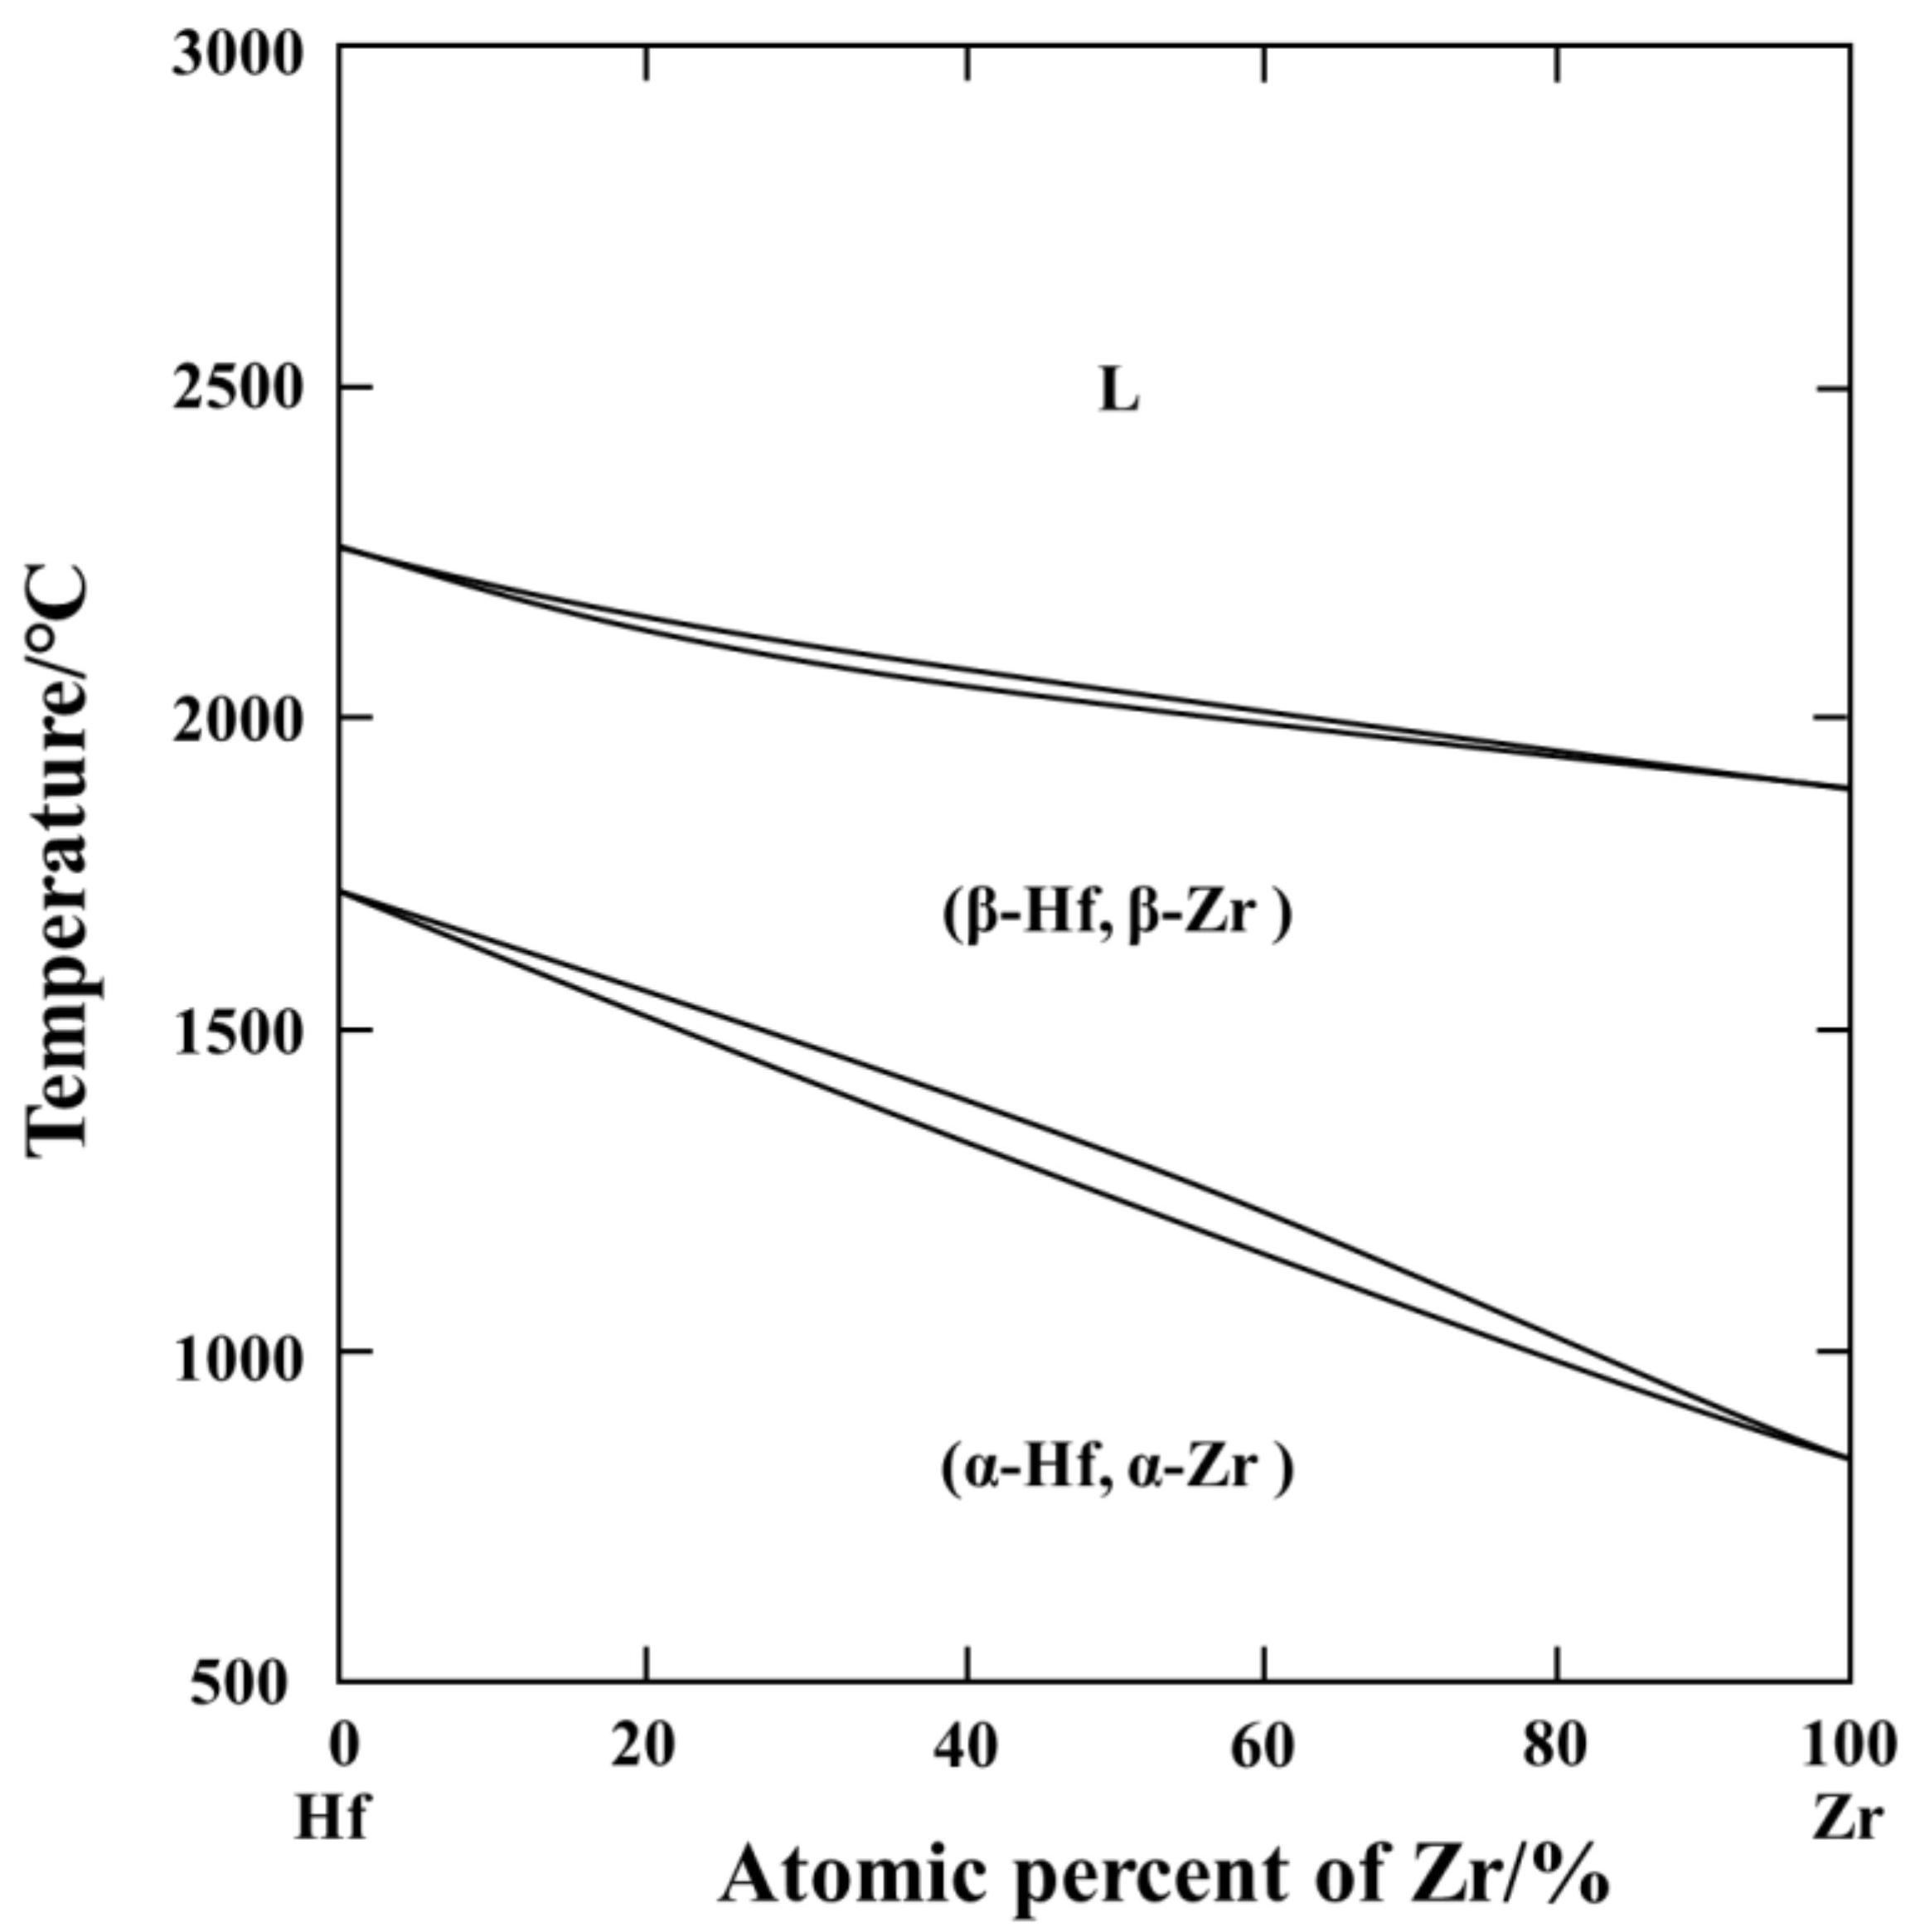
3.1. Phase Composition Analysis
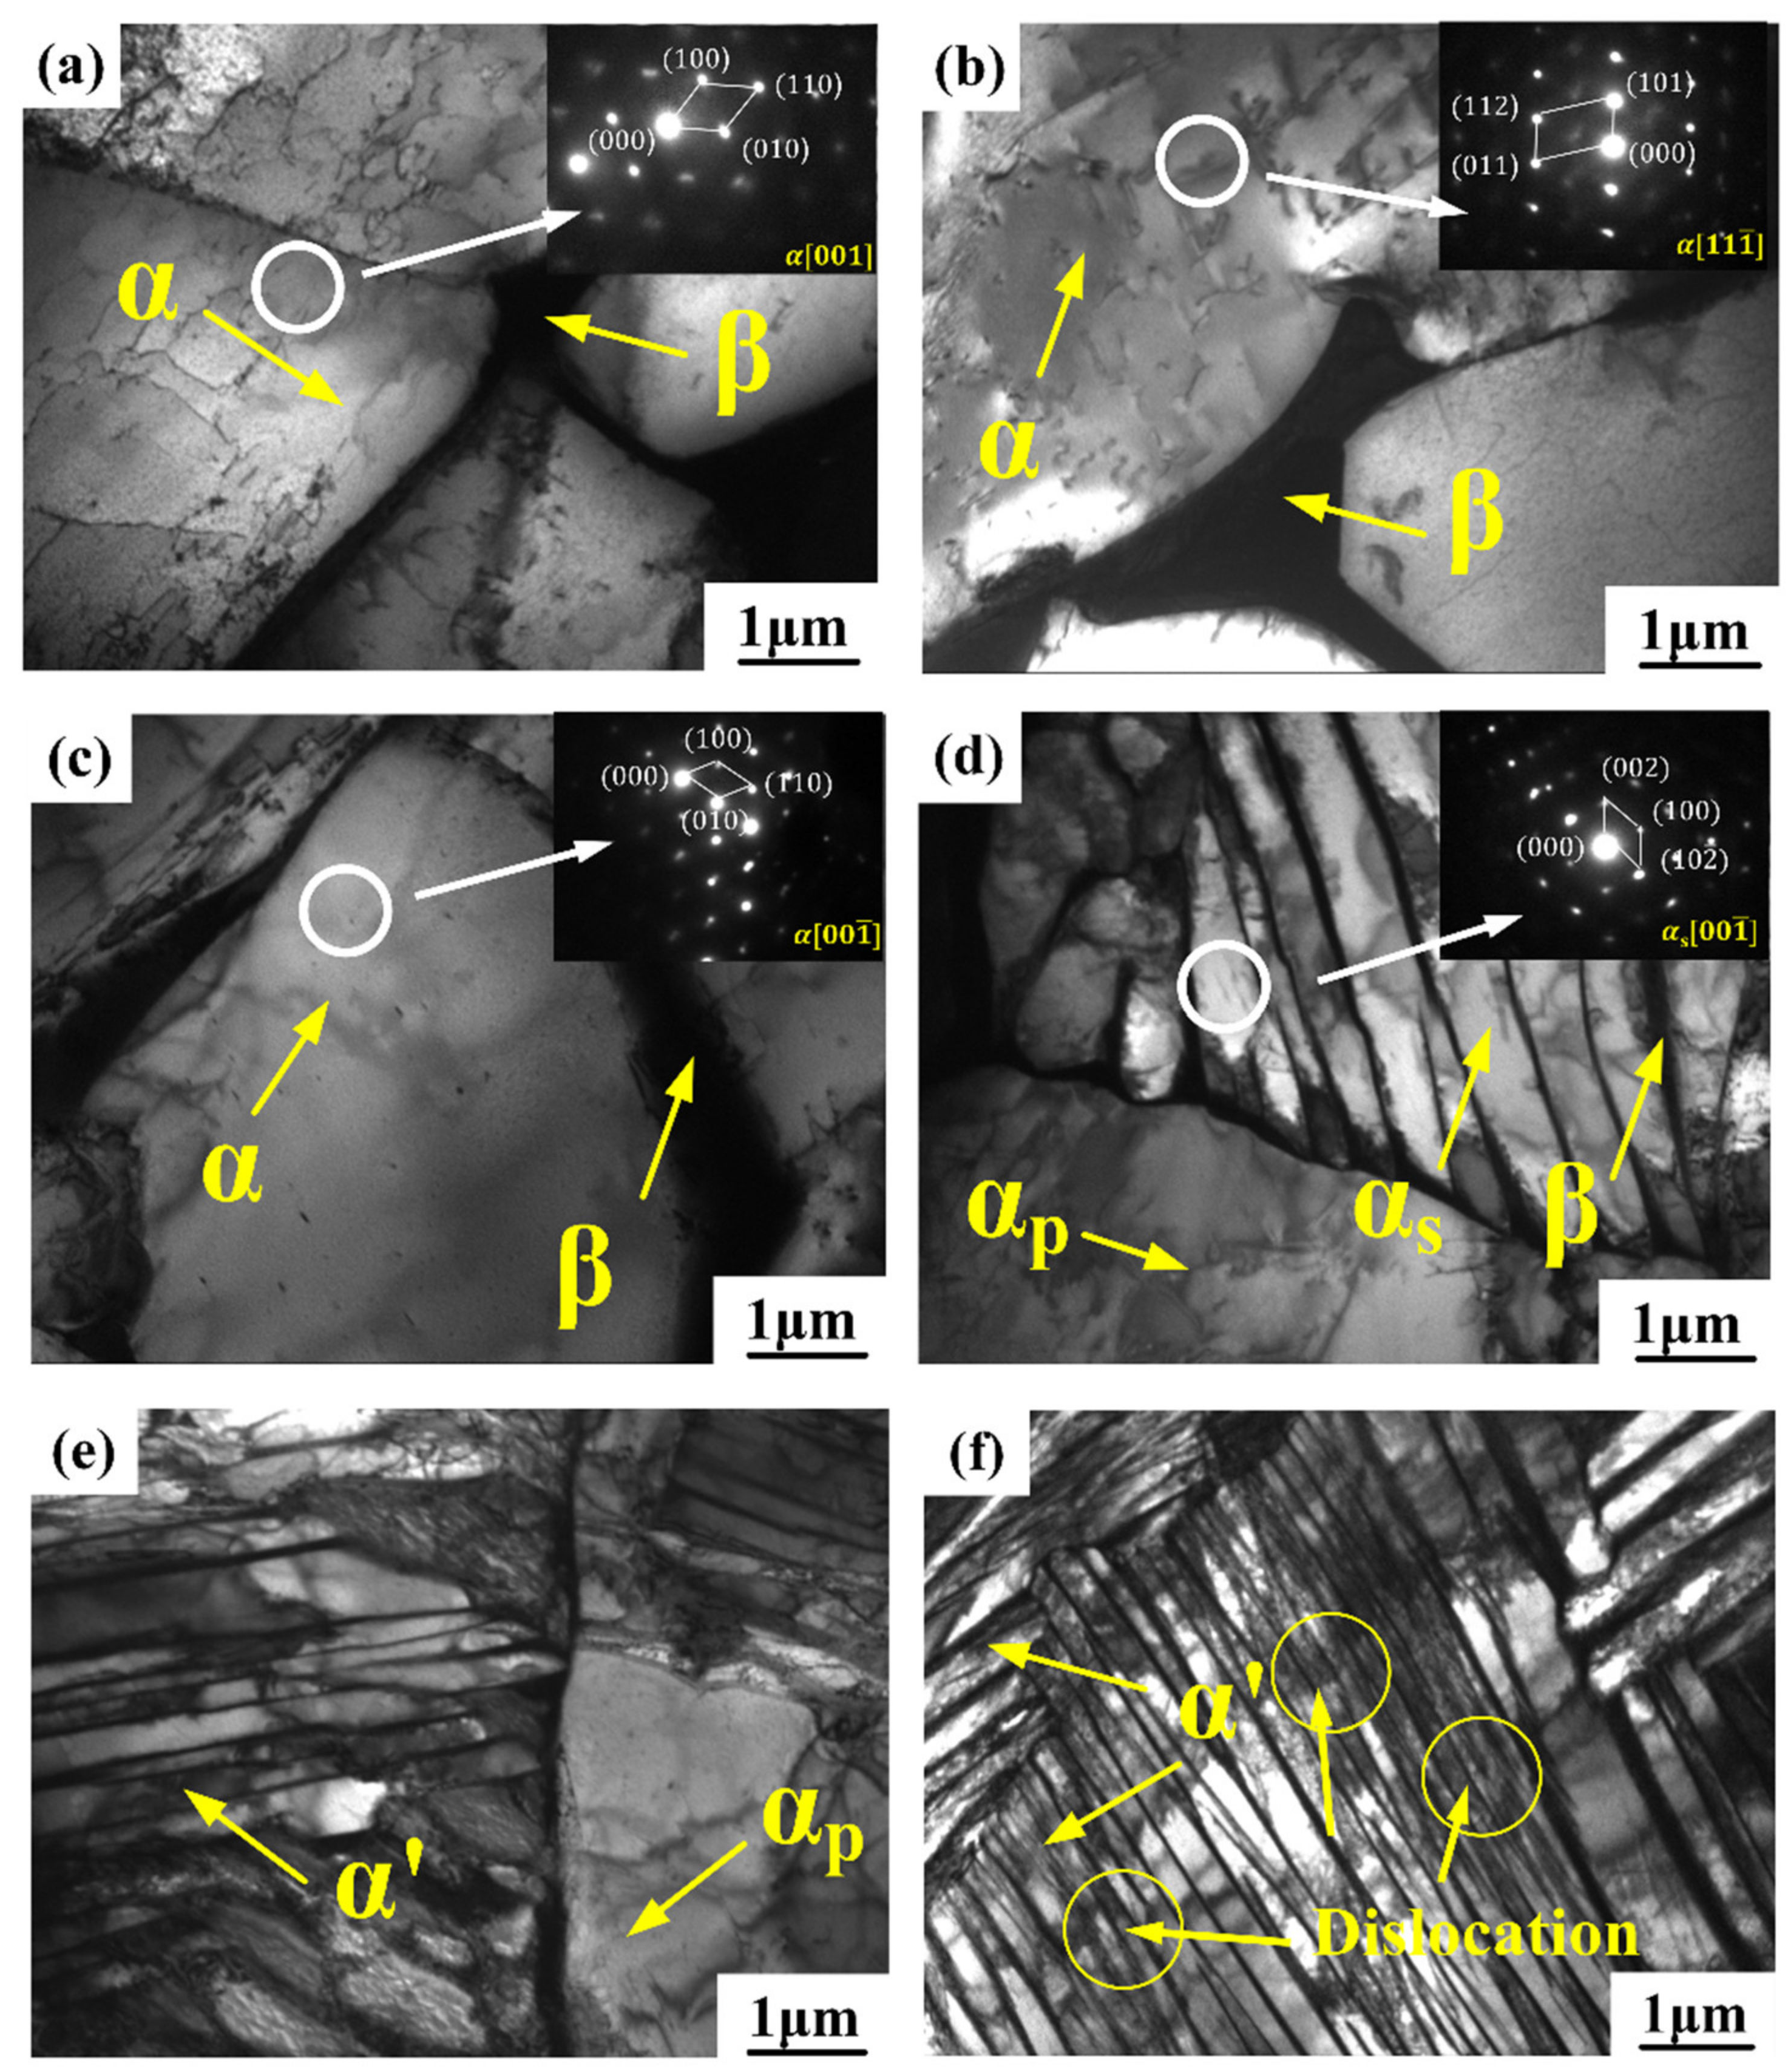
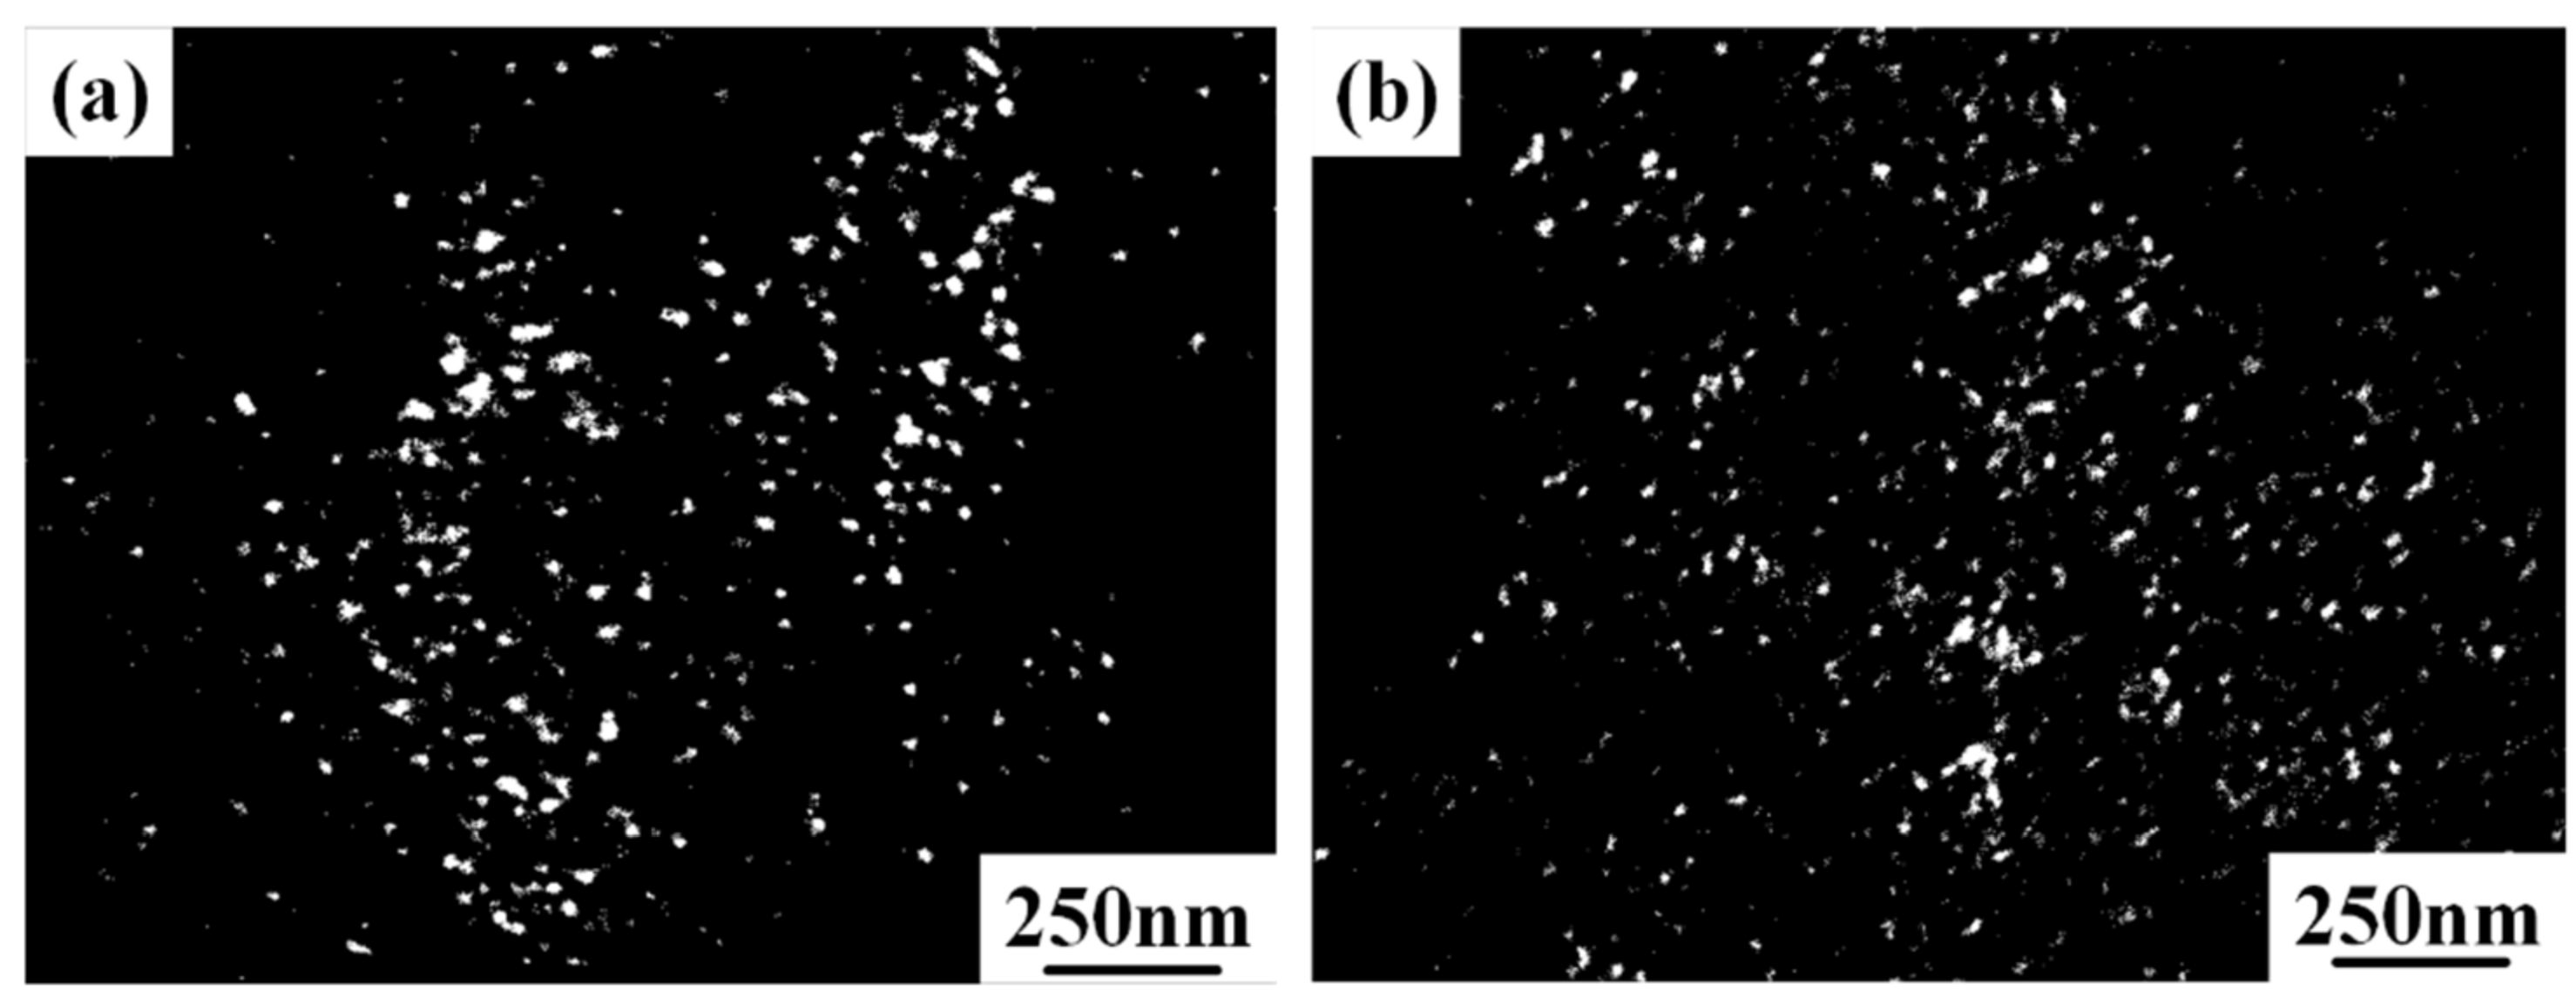
3.2. Microstructure Analysis
3.3. Mechanical Properties Analysis
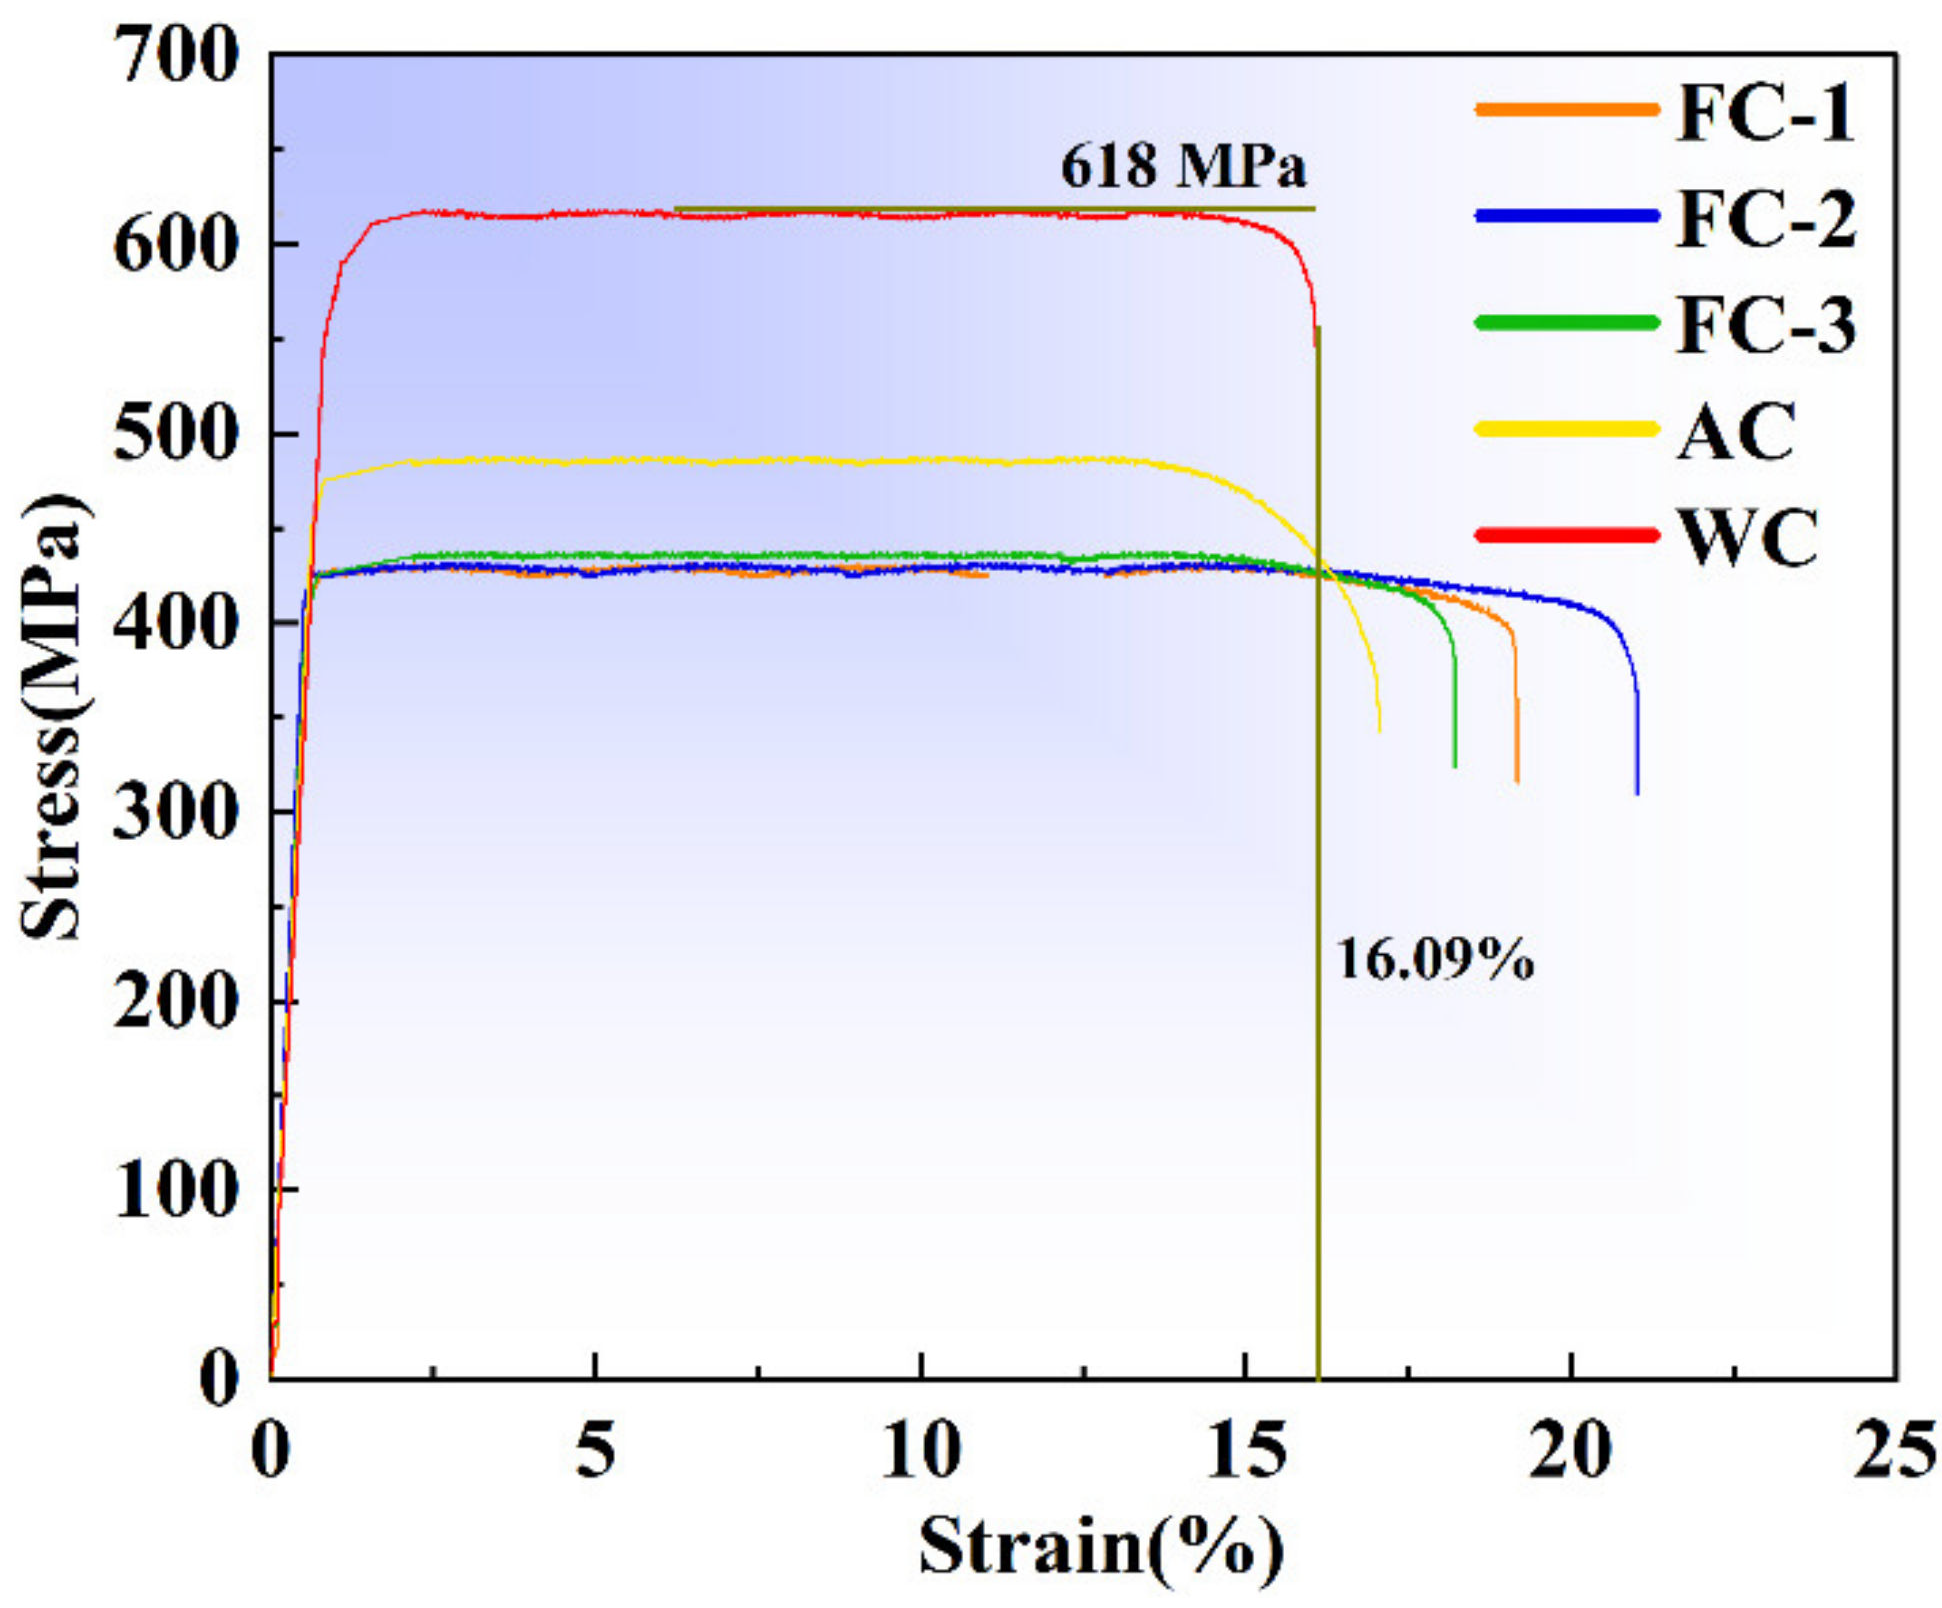
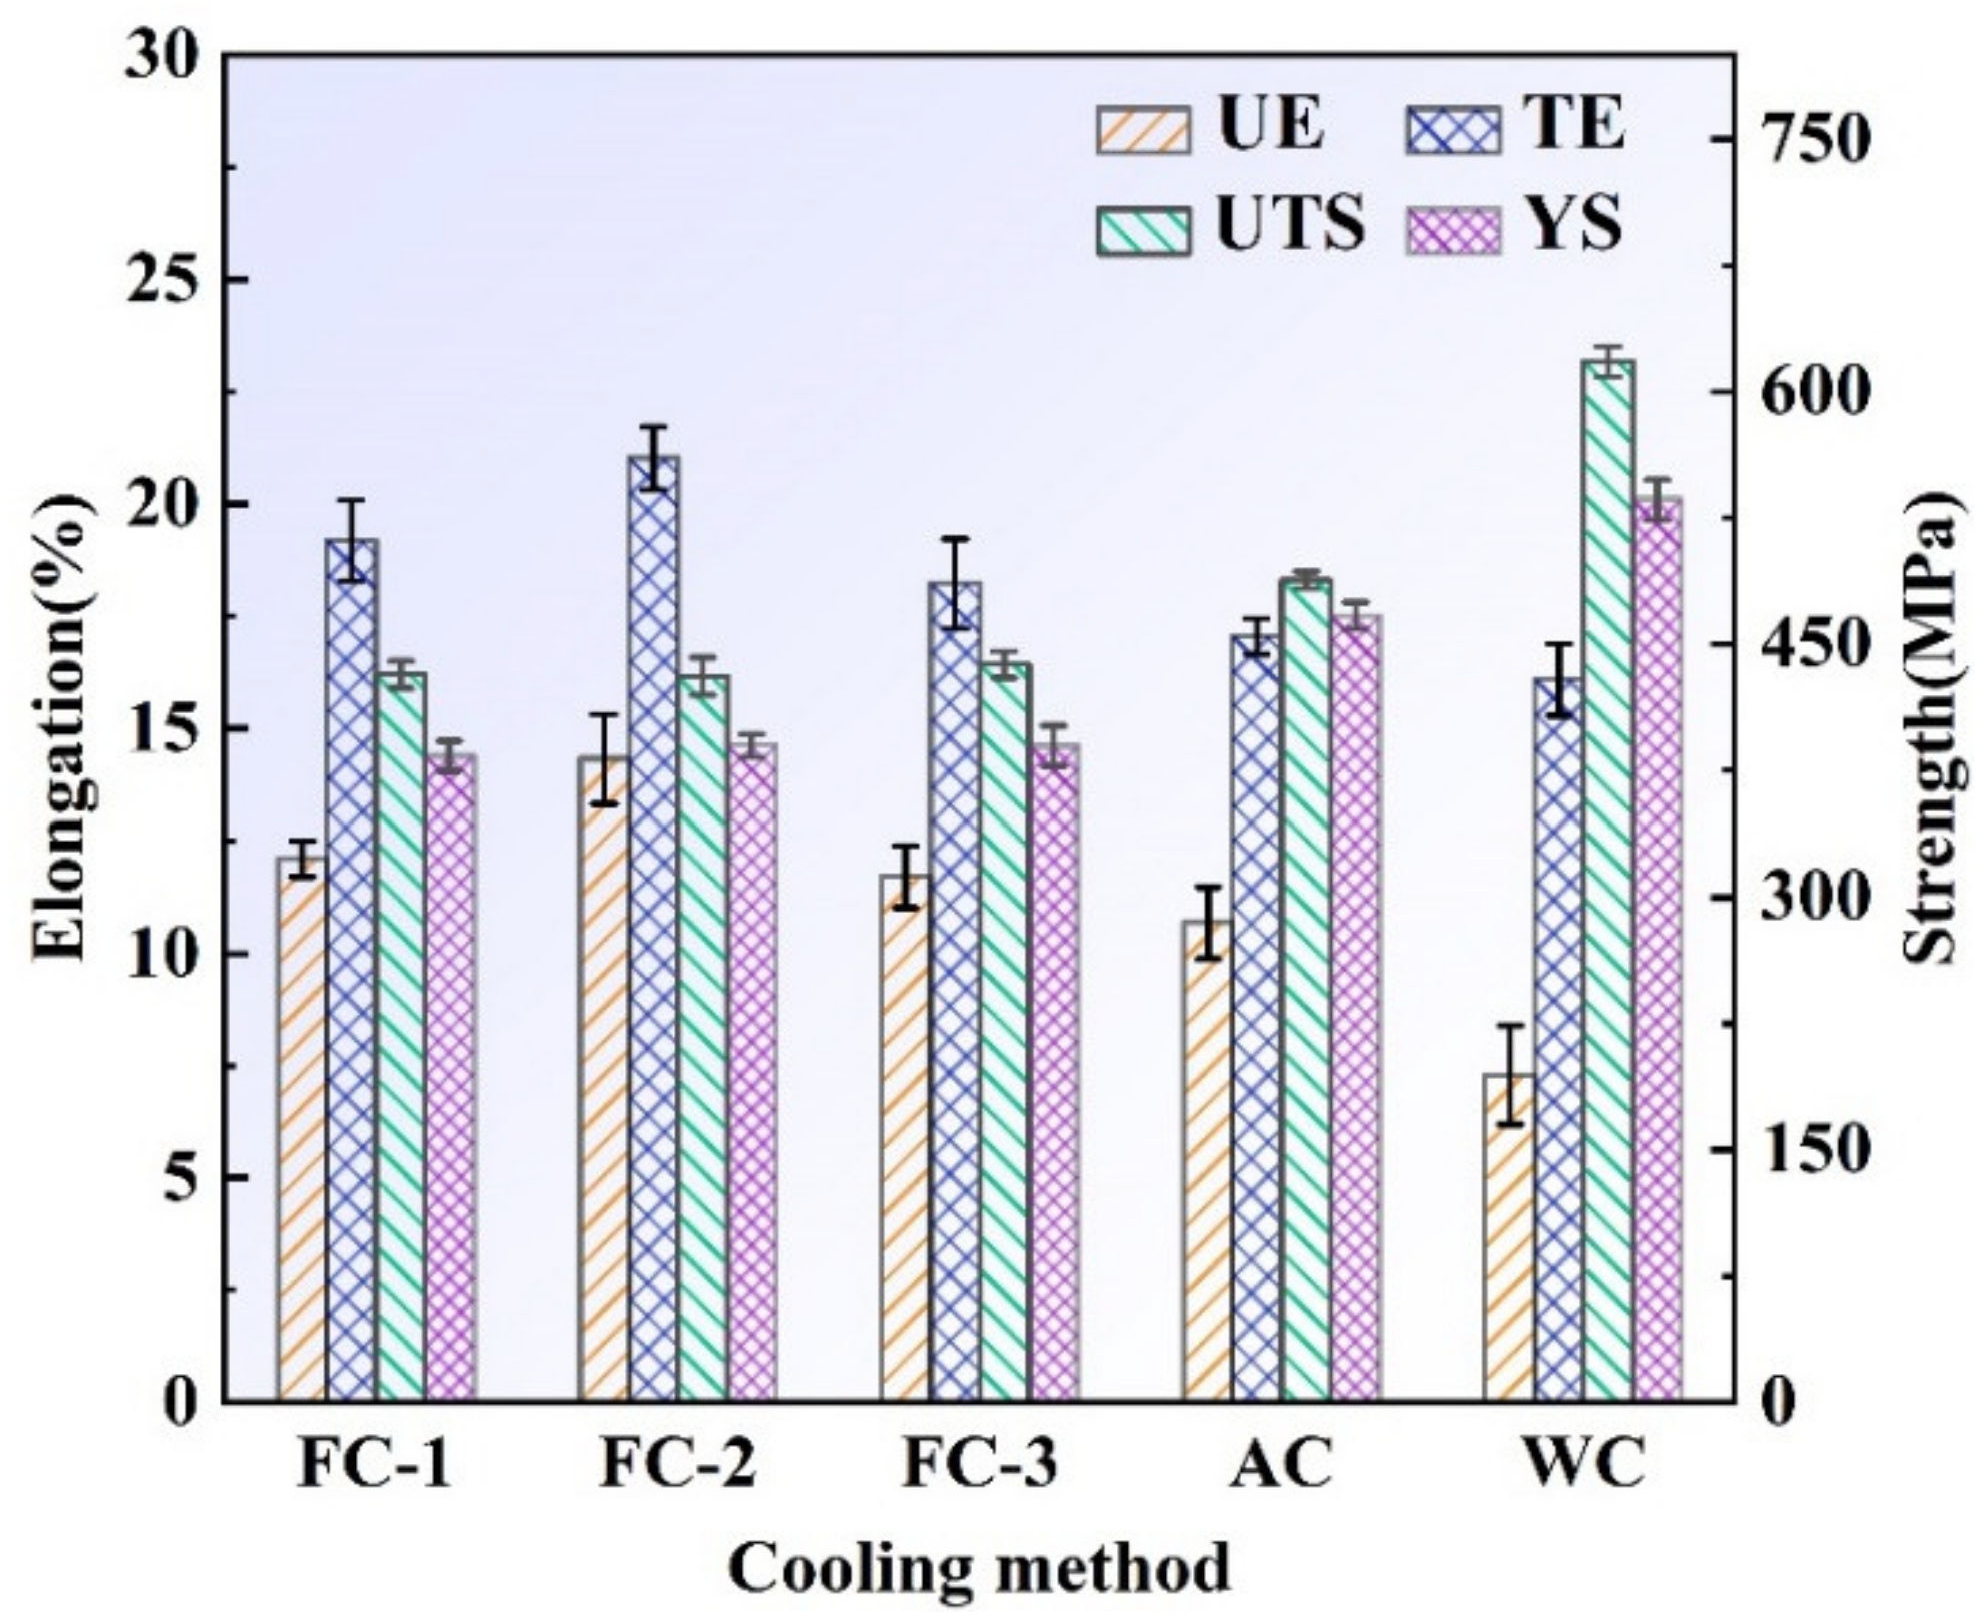
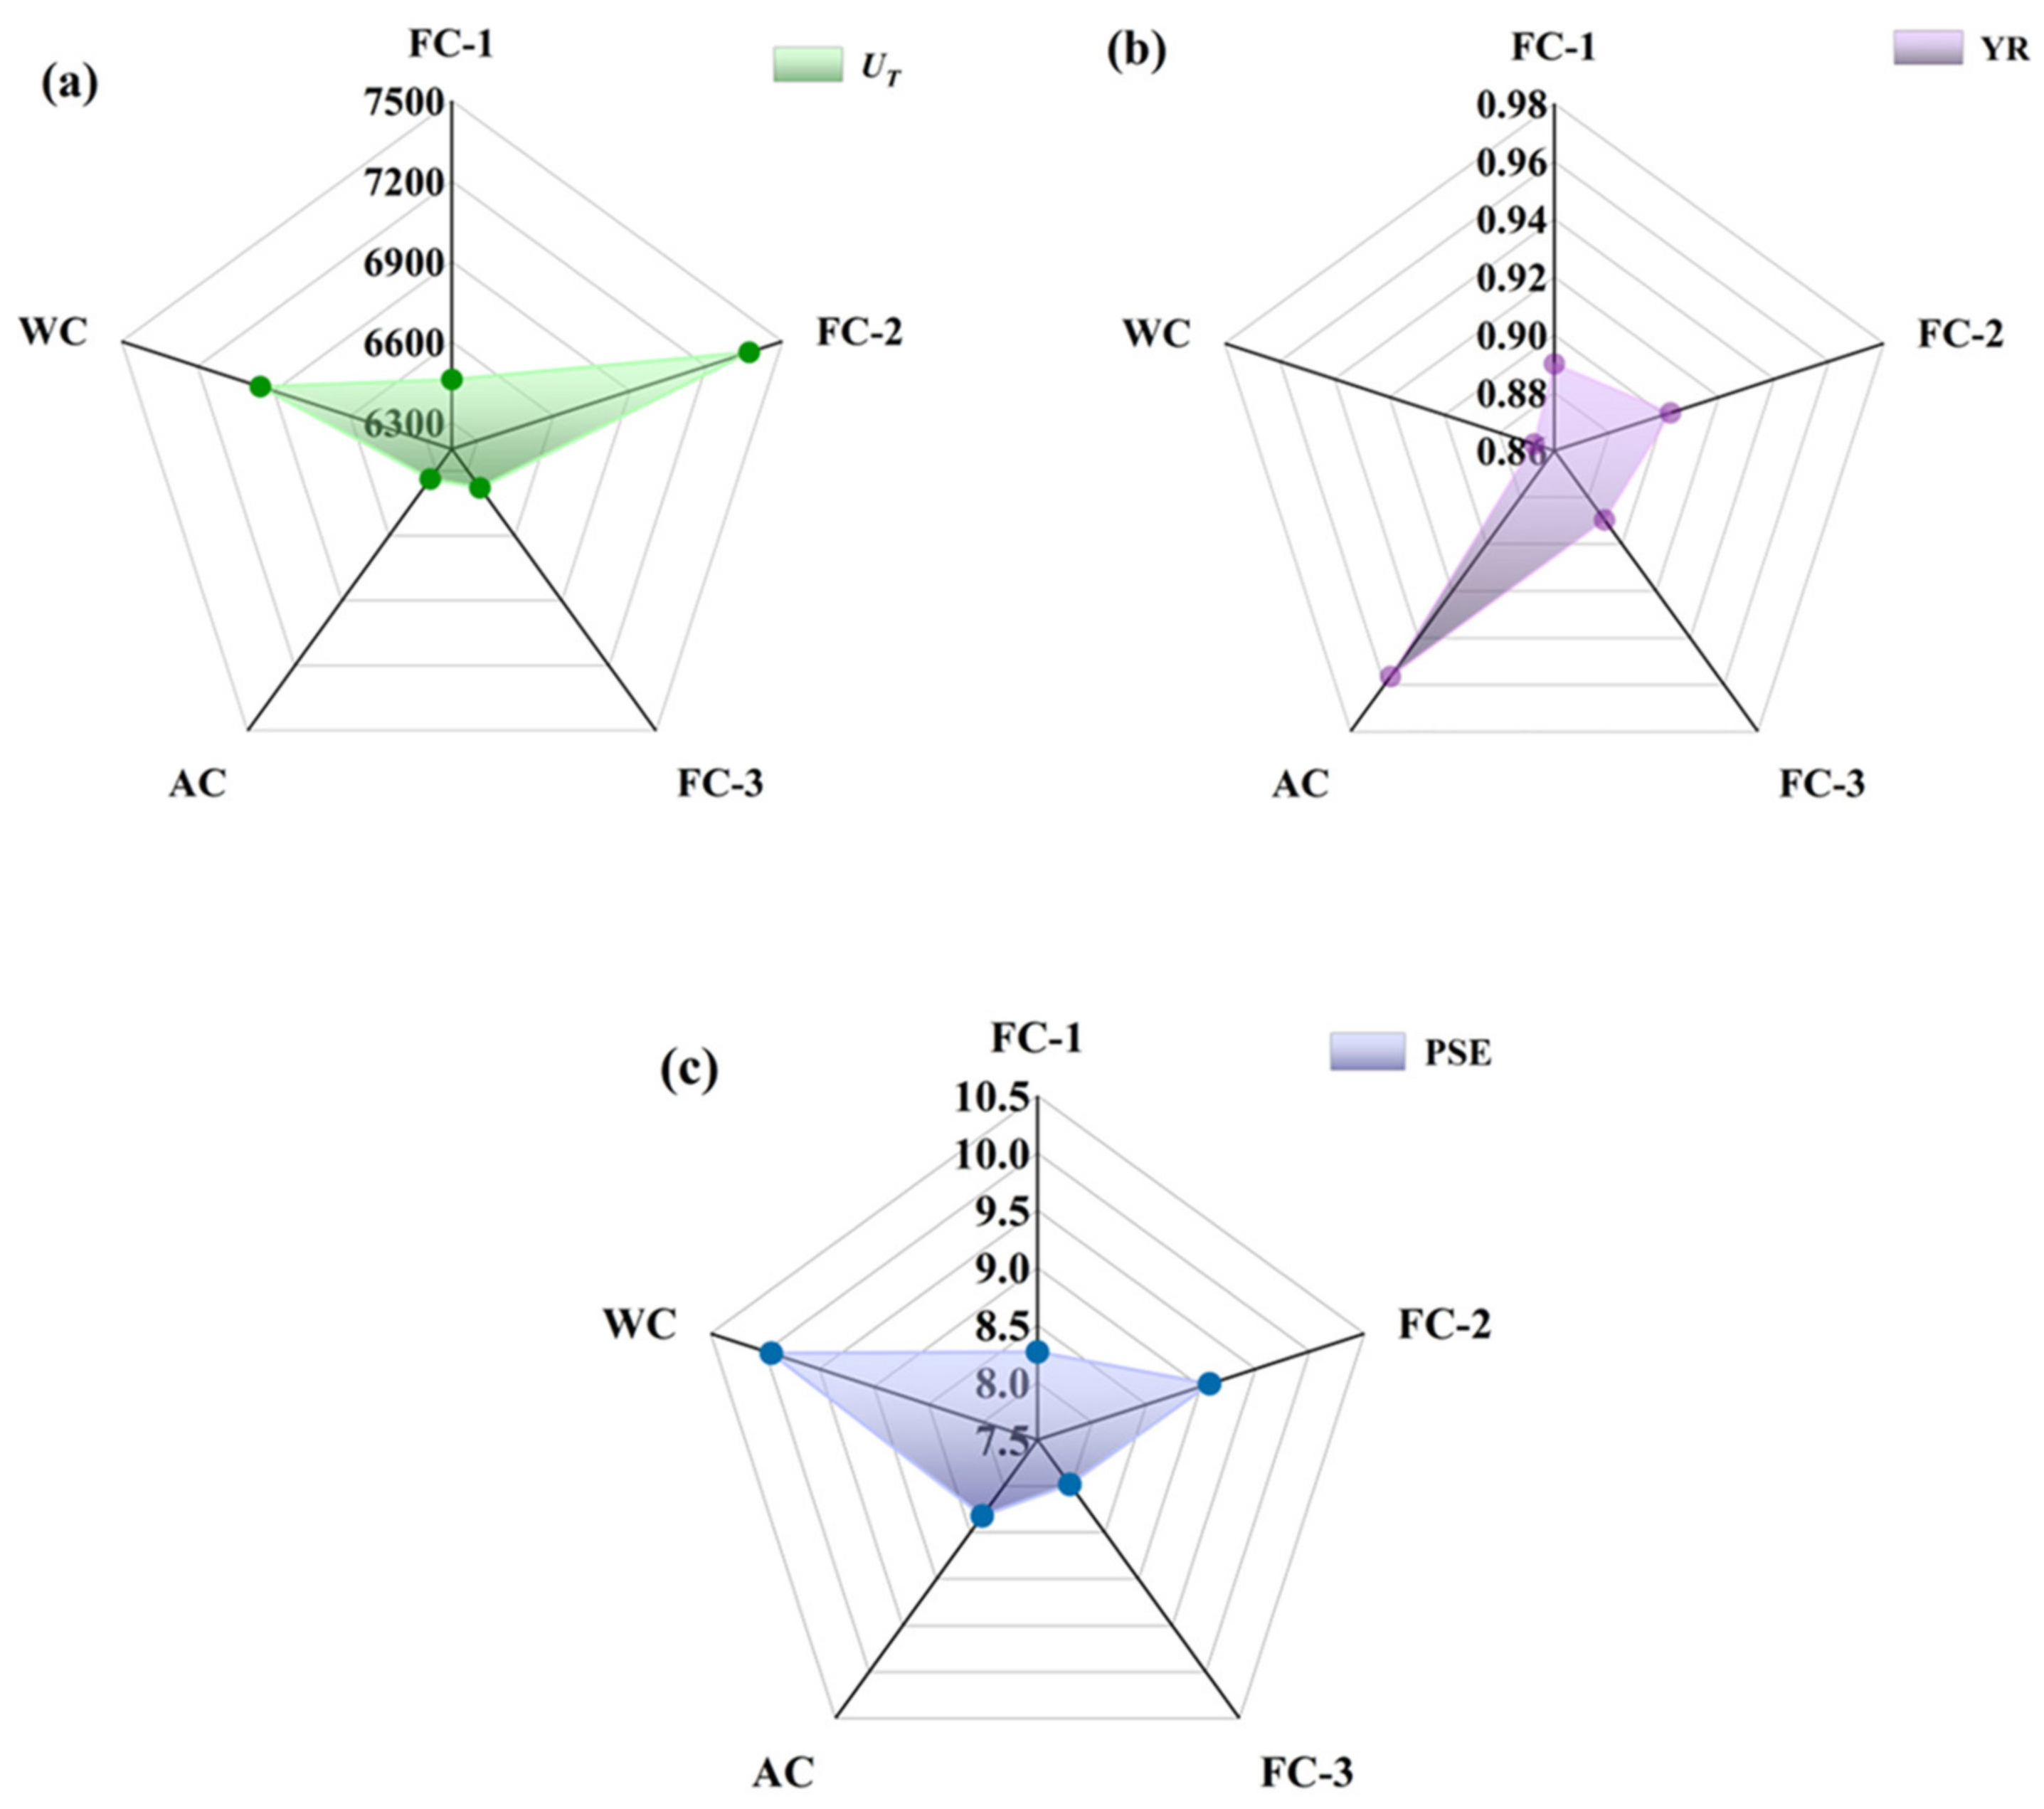
3.3.1. Tensile Properties
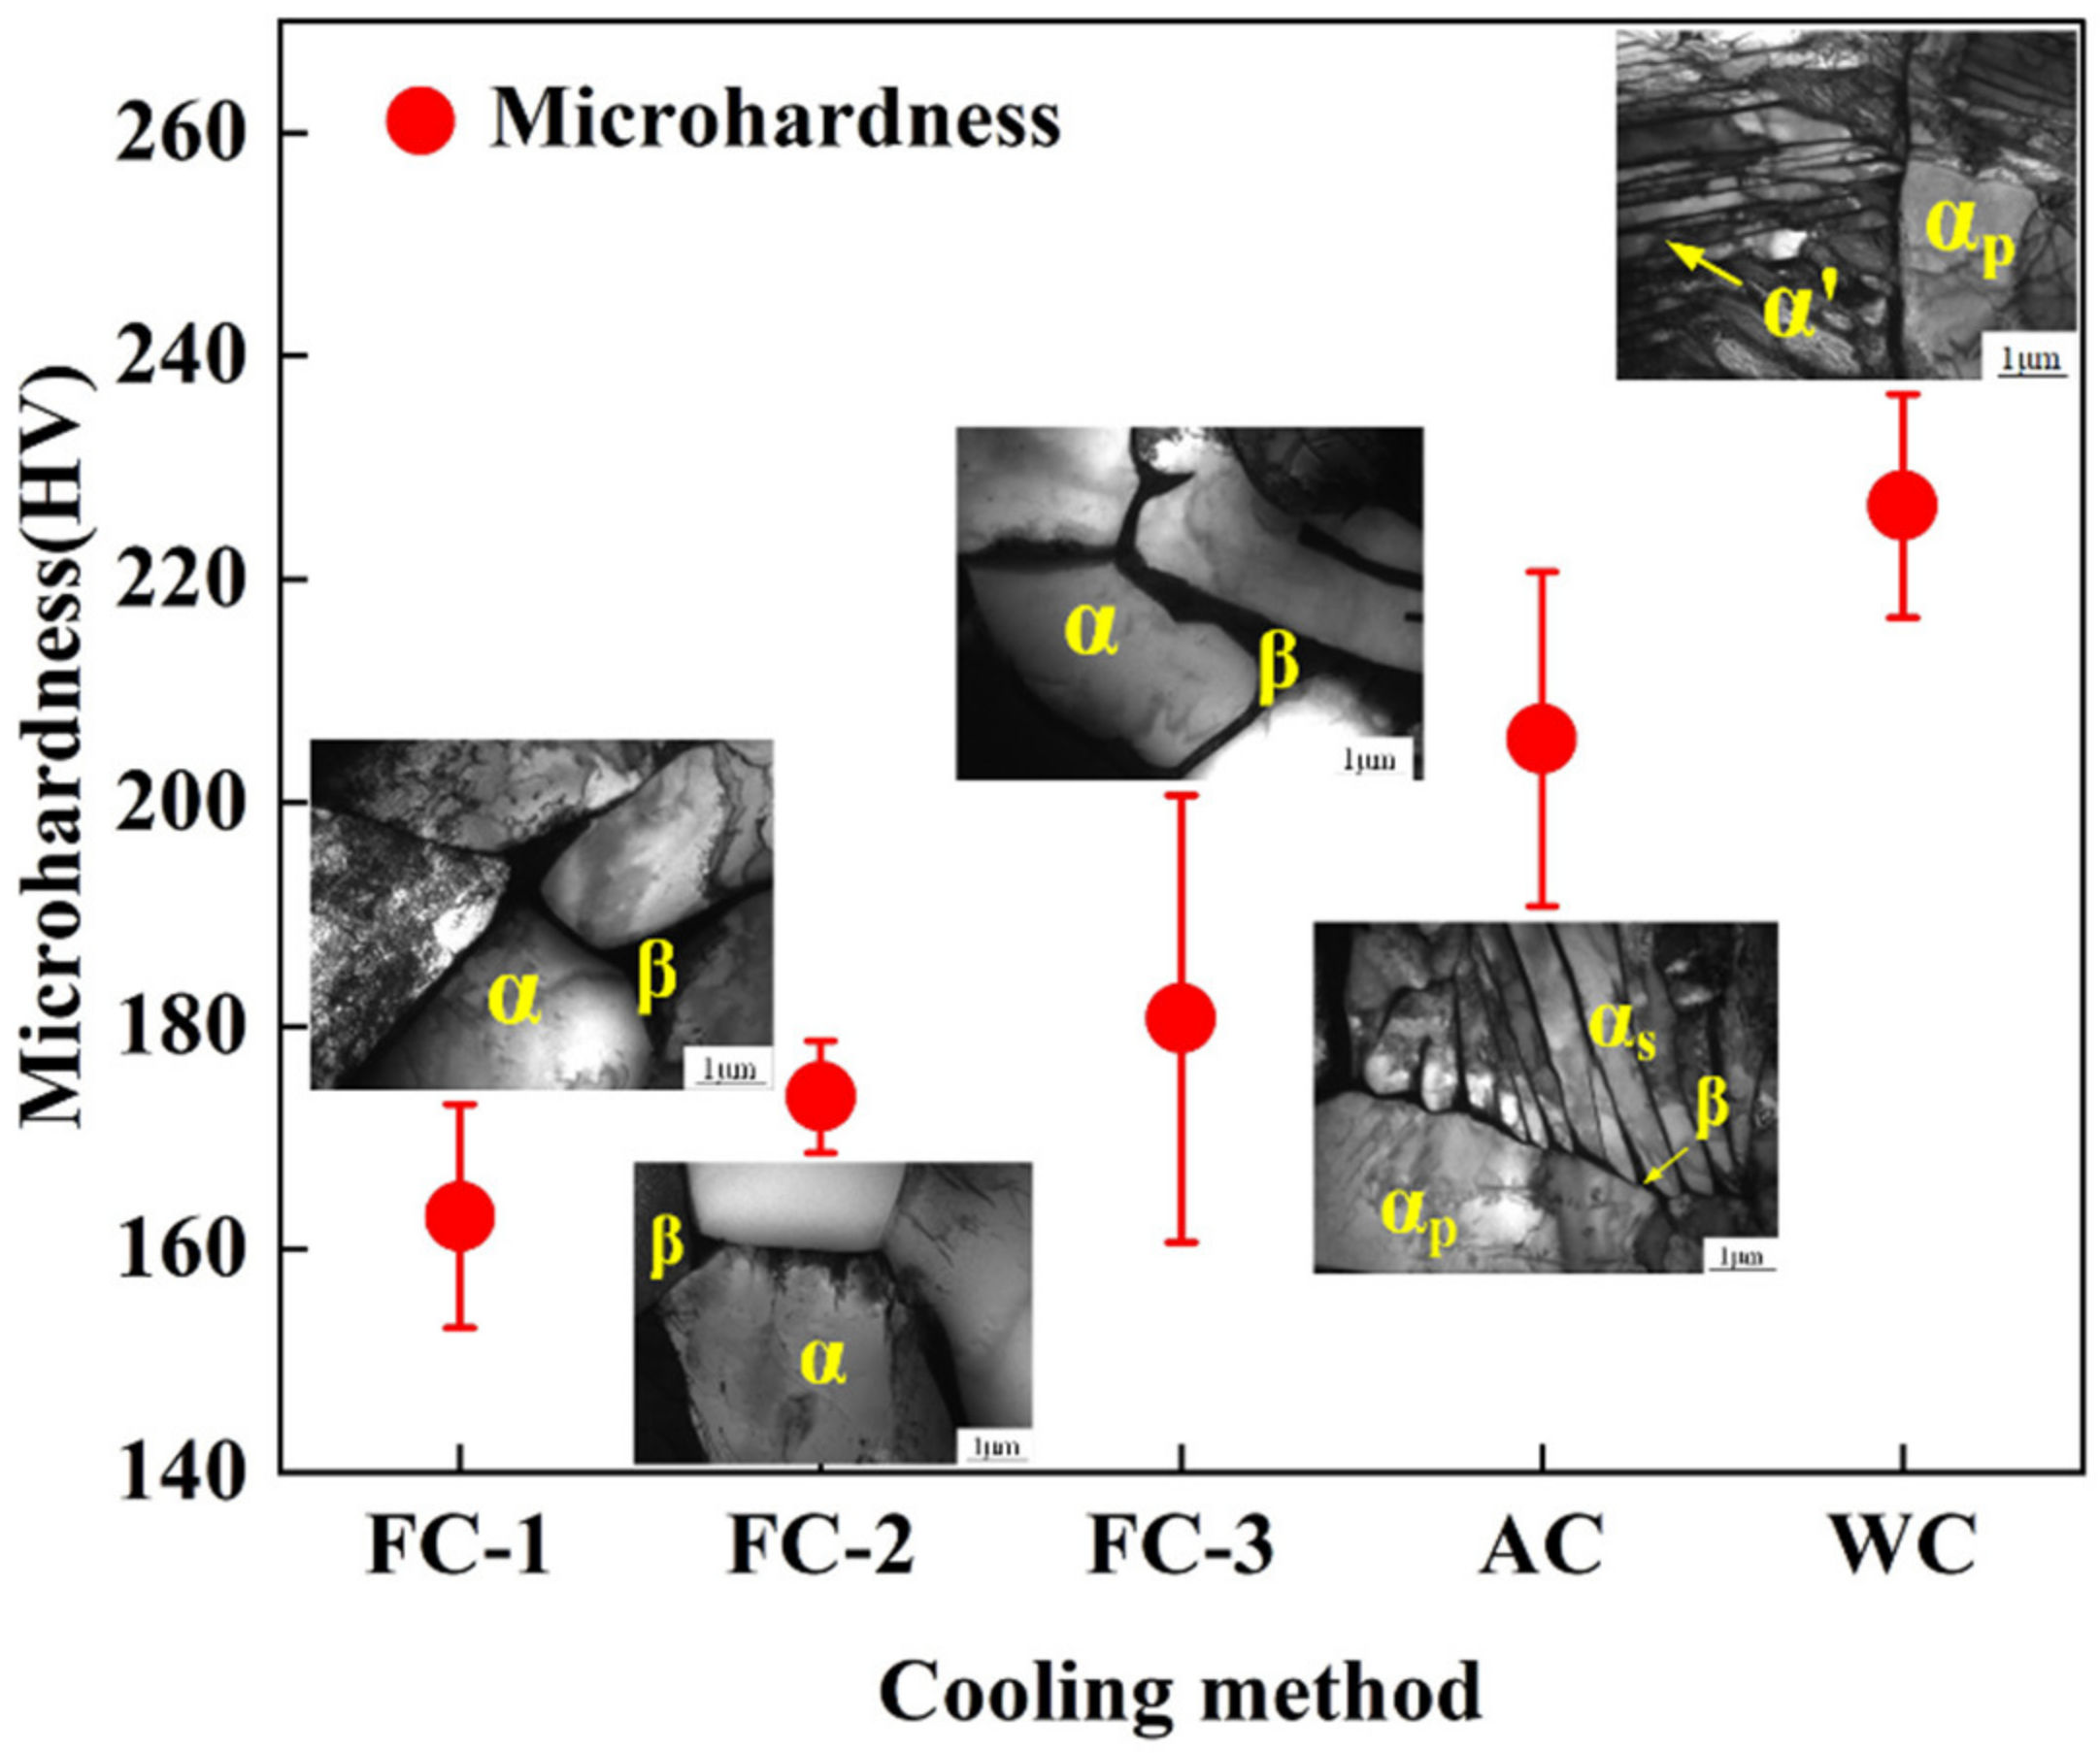
3.3.2. Microhardness
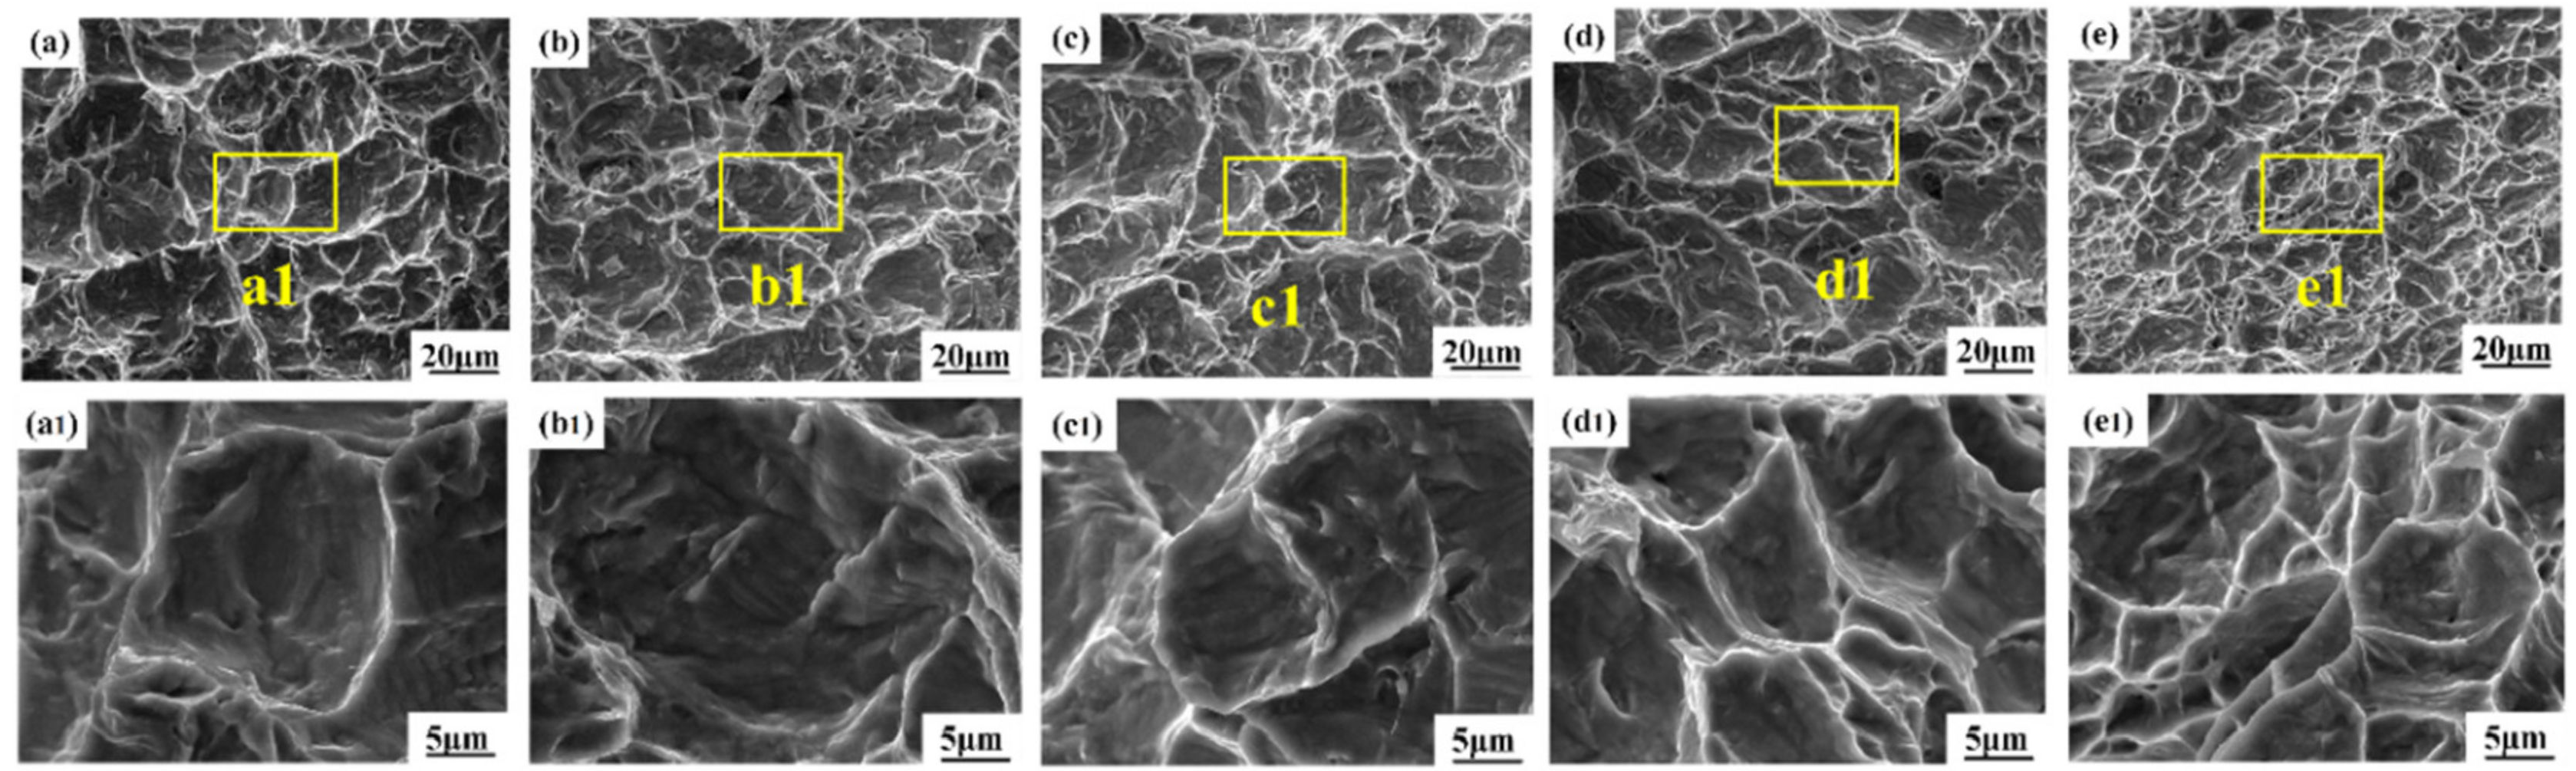
3.4. Fracture Characteristics
4. Conclusions
- (1)
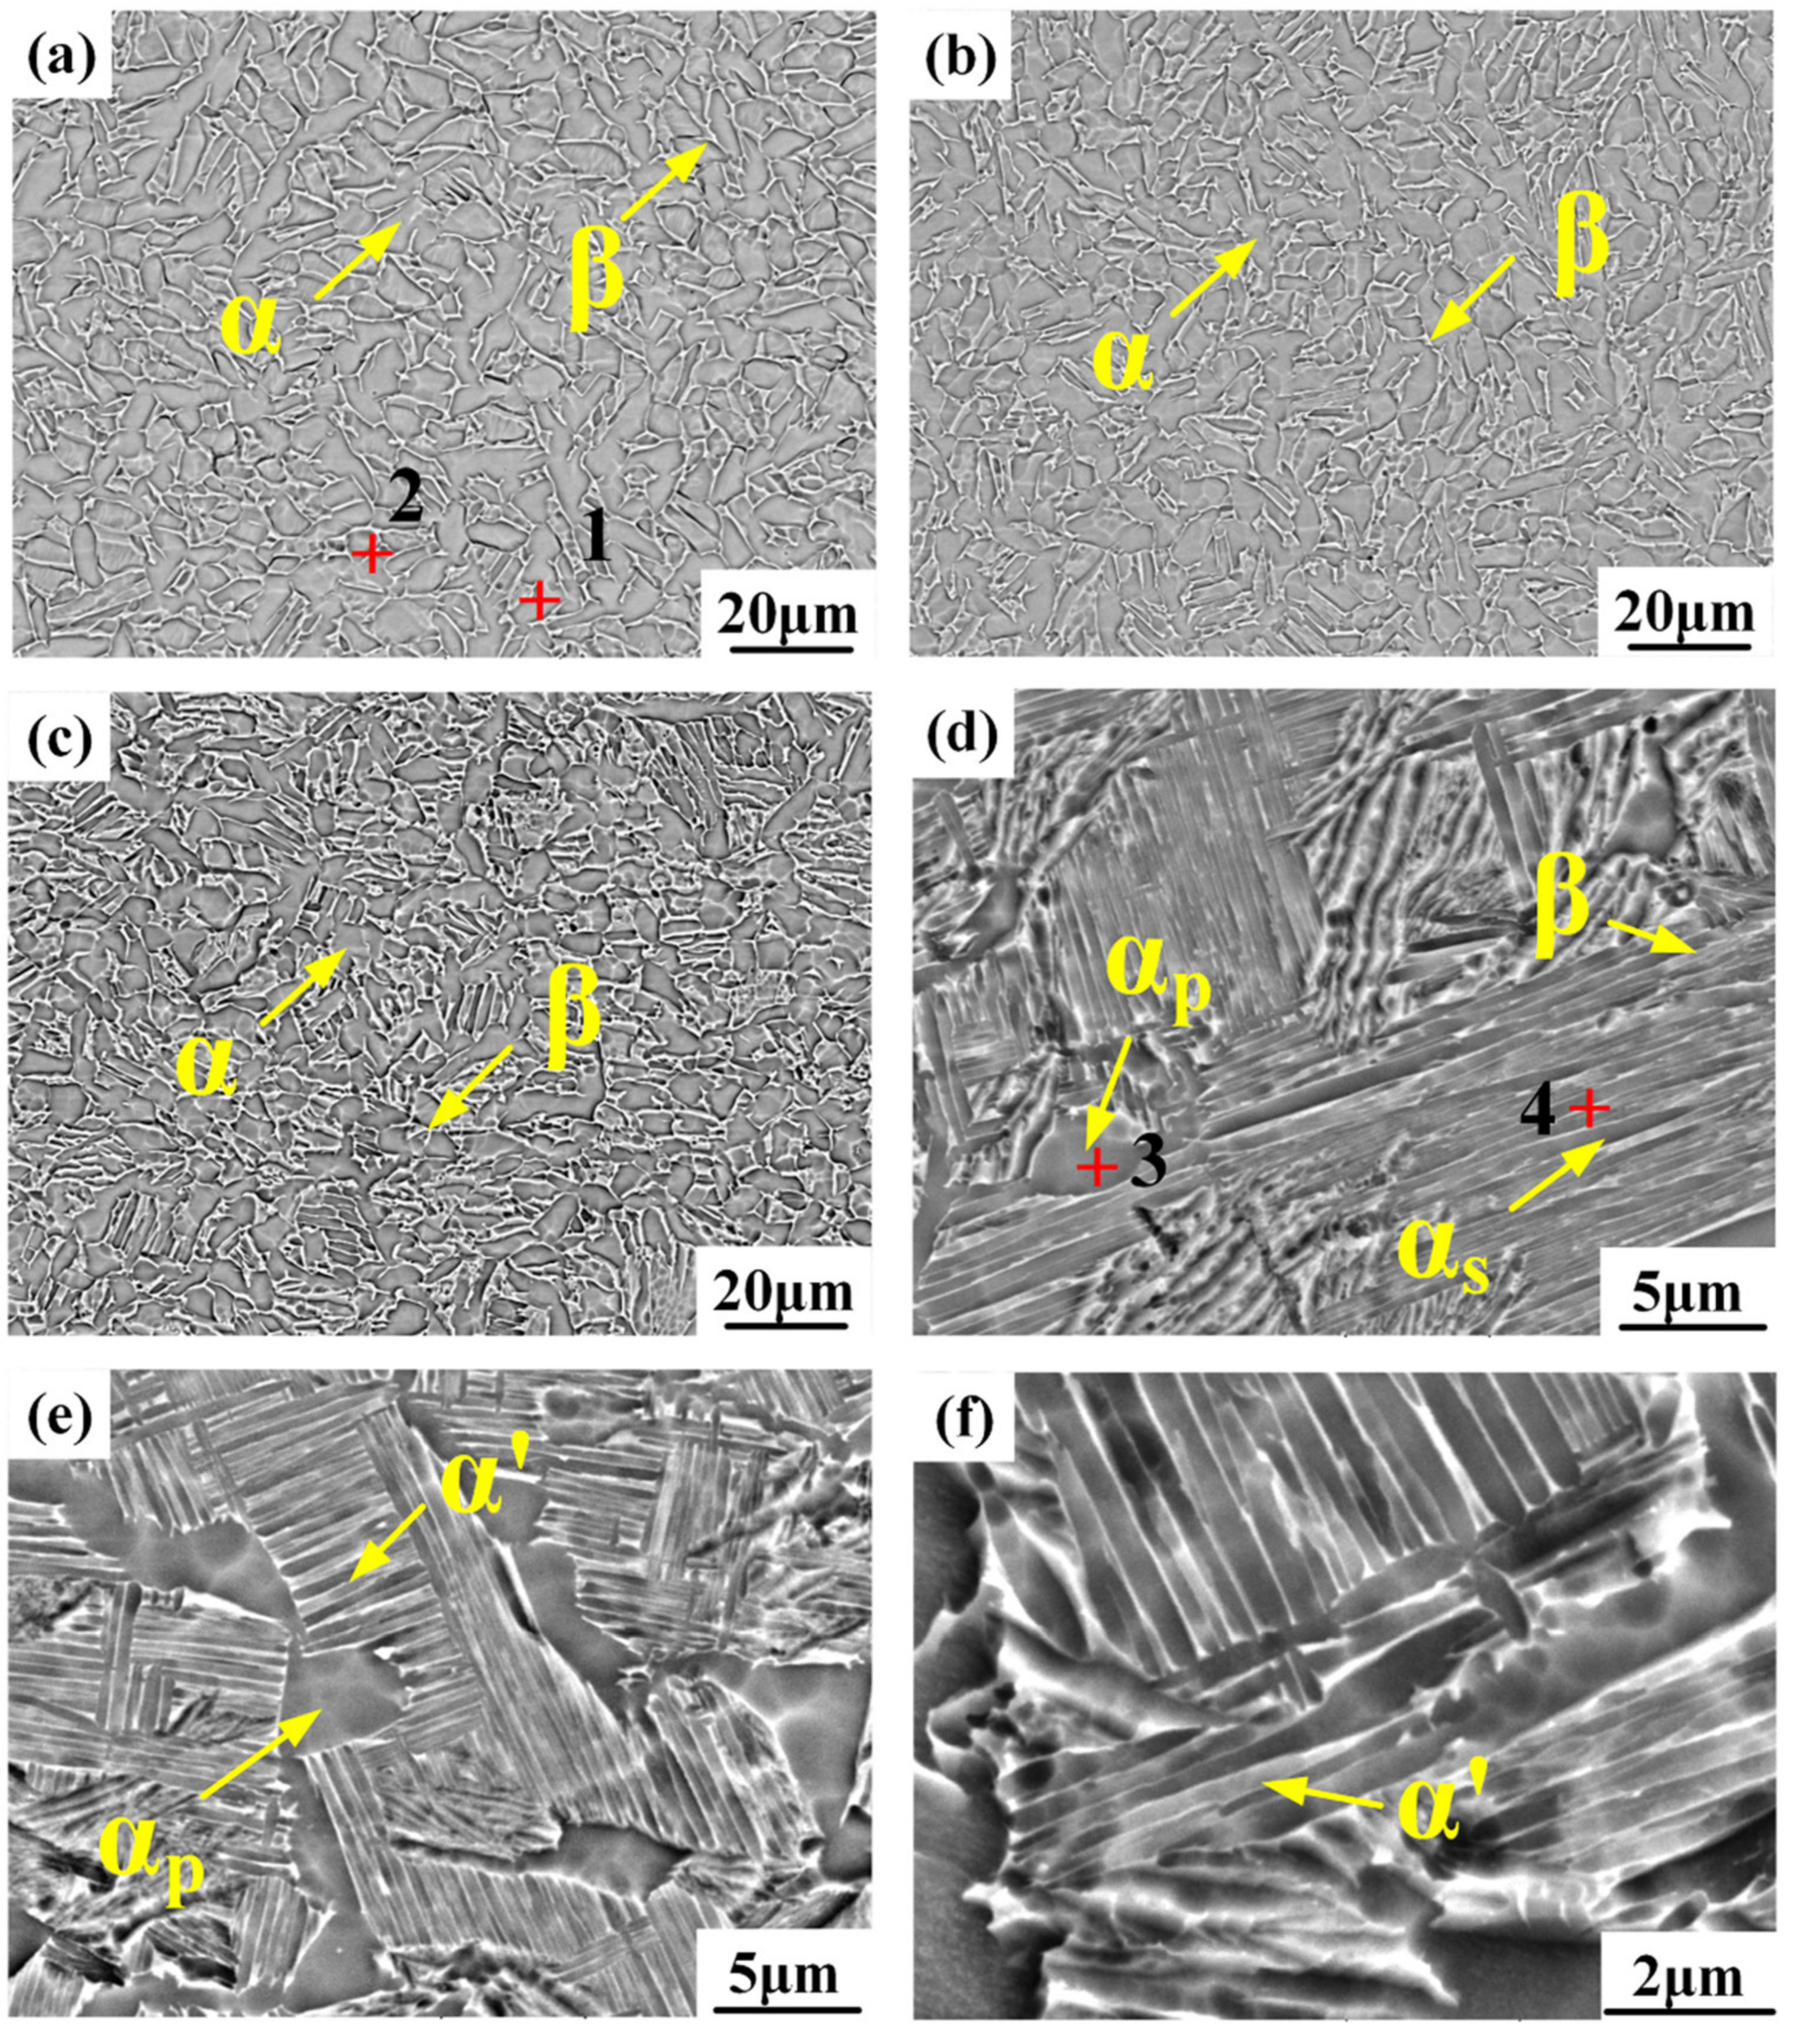
- The lower cooling rate promoted the phase transformation of β to α. Additionally, the phase of the alloy samples transformed from β→α to β→ω, and, finally, to β→α’ with increasing cooling rate.
- (2)
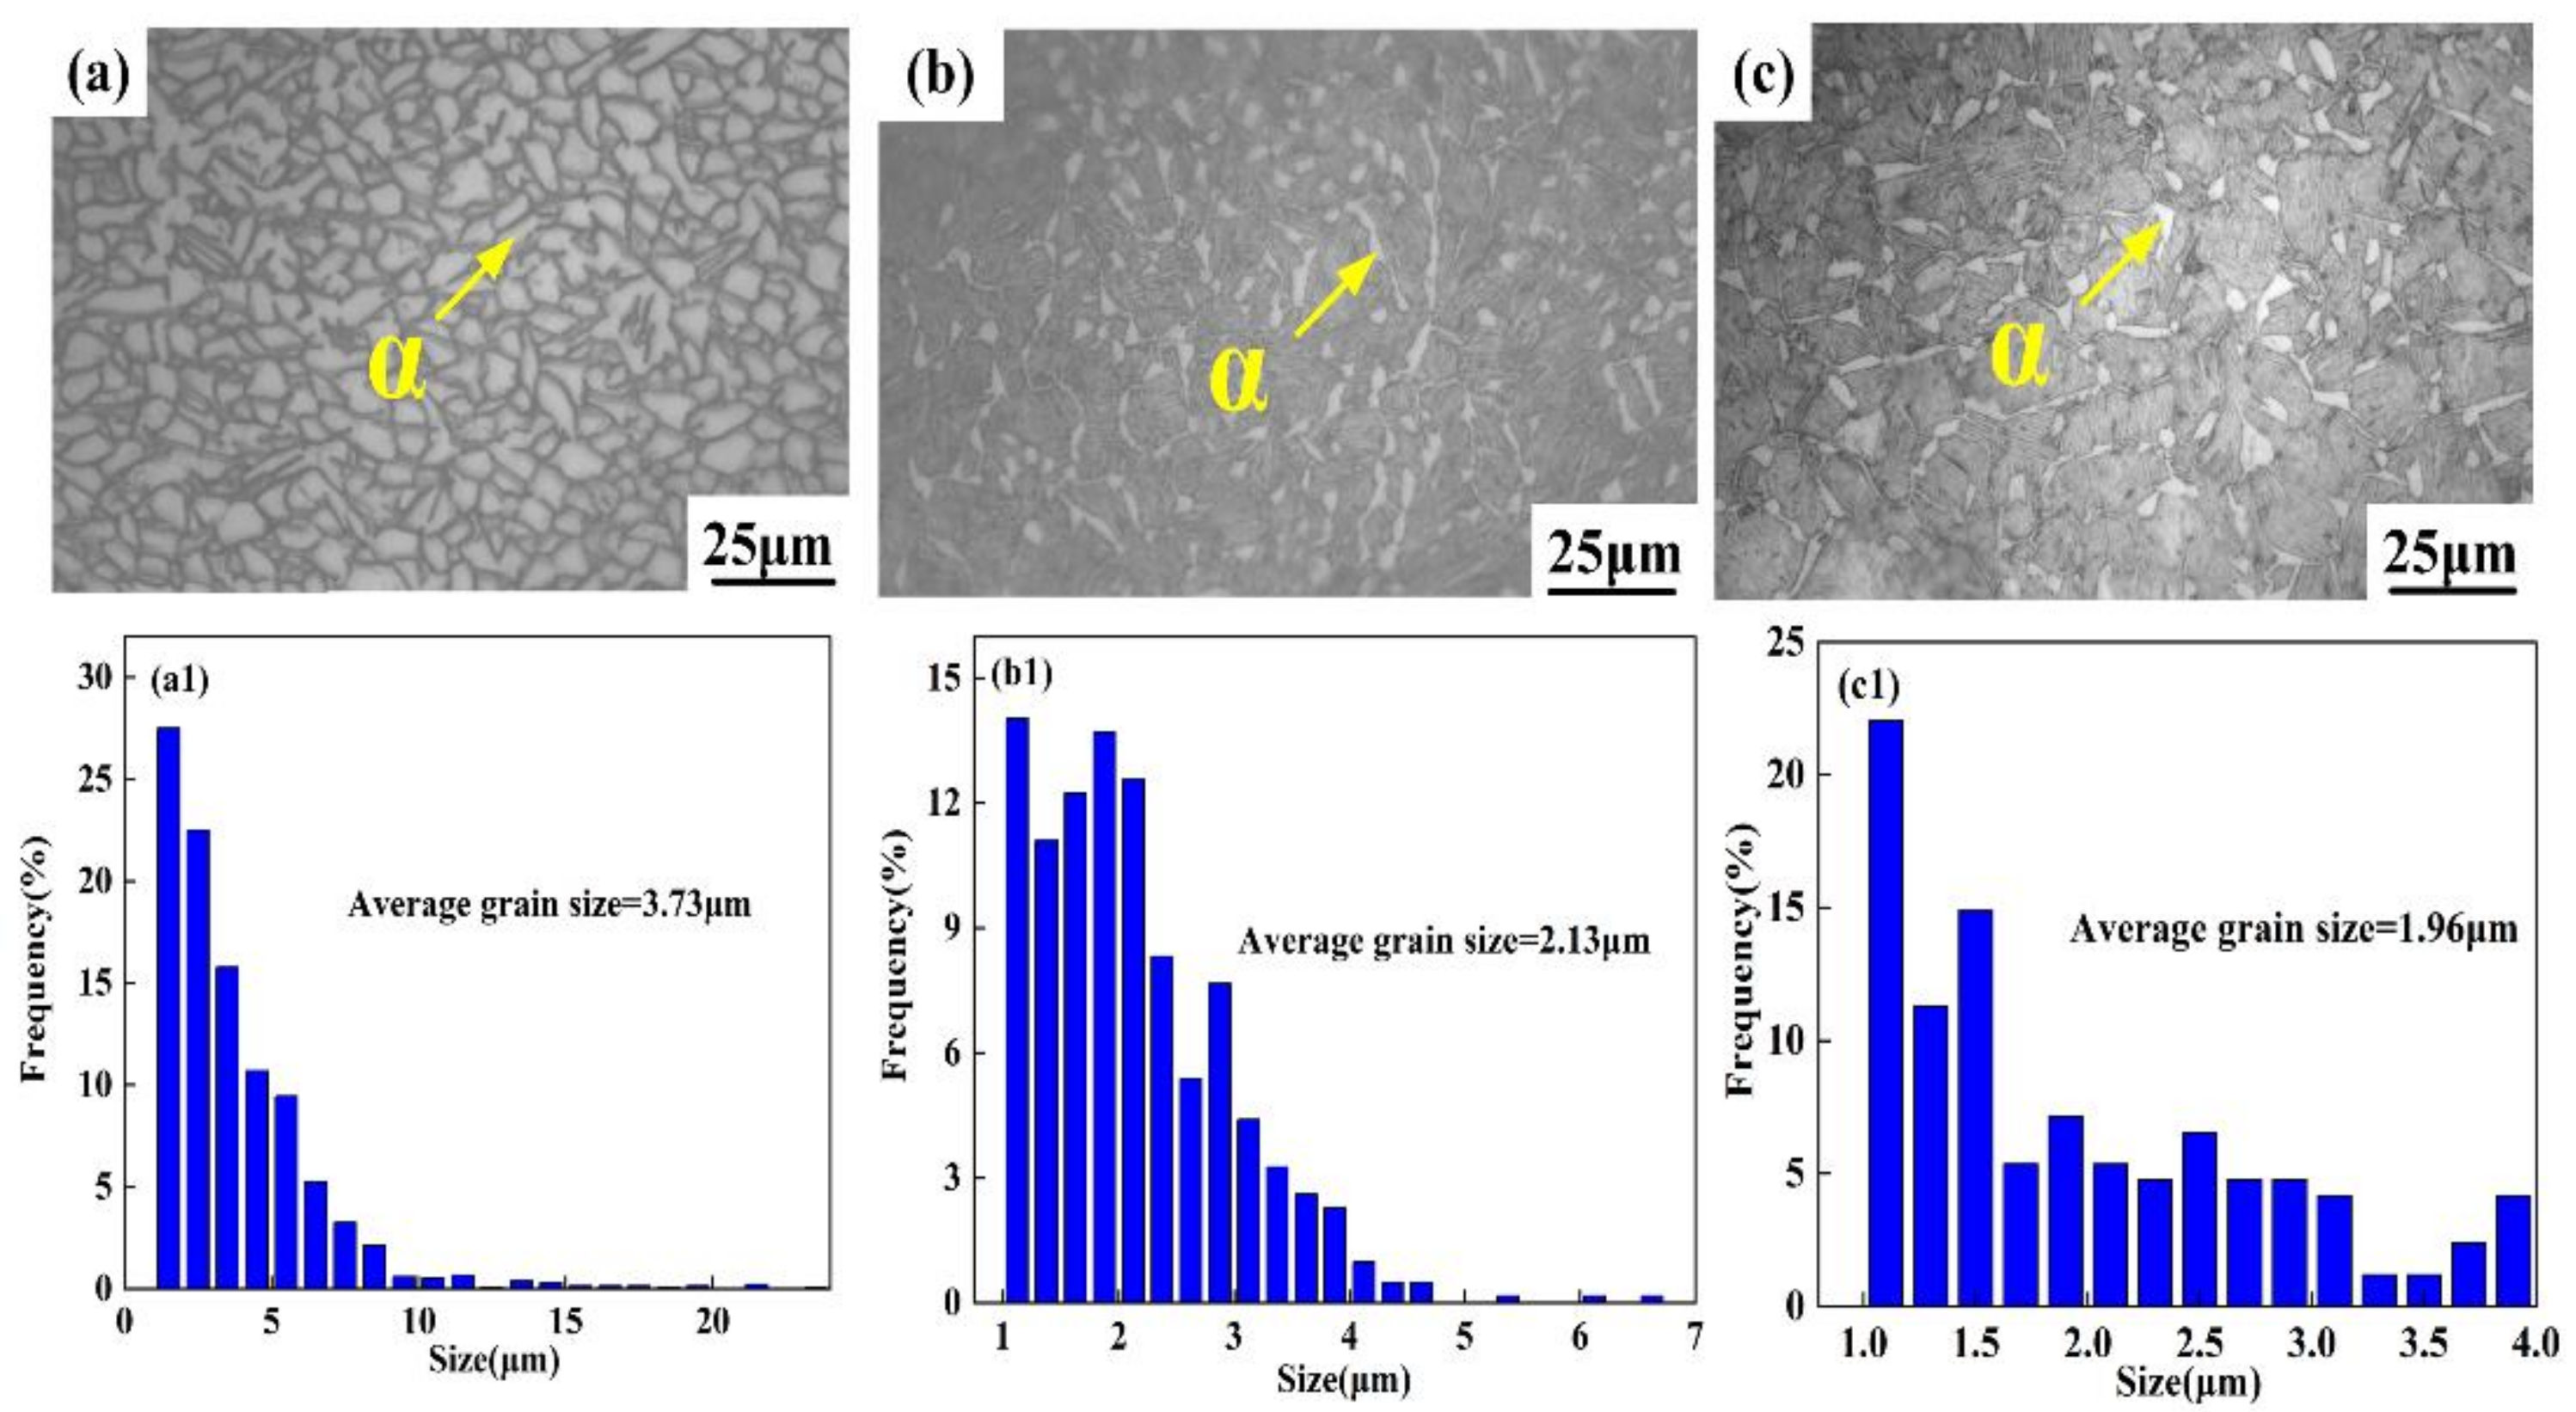
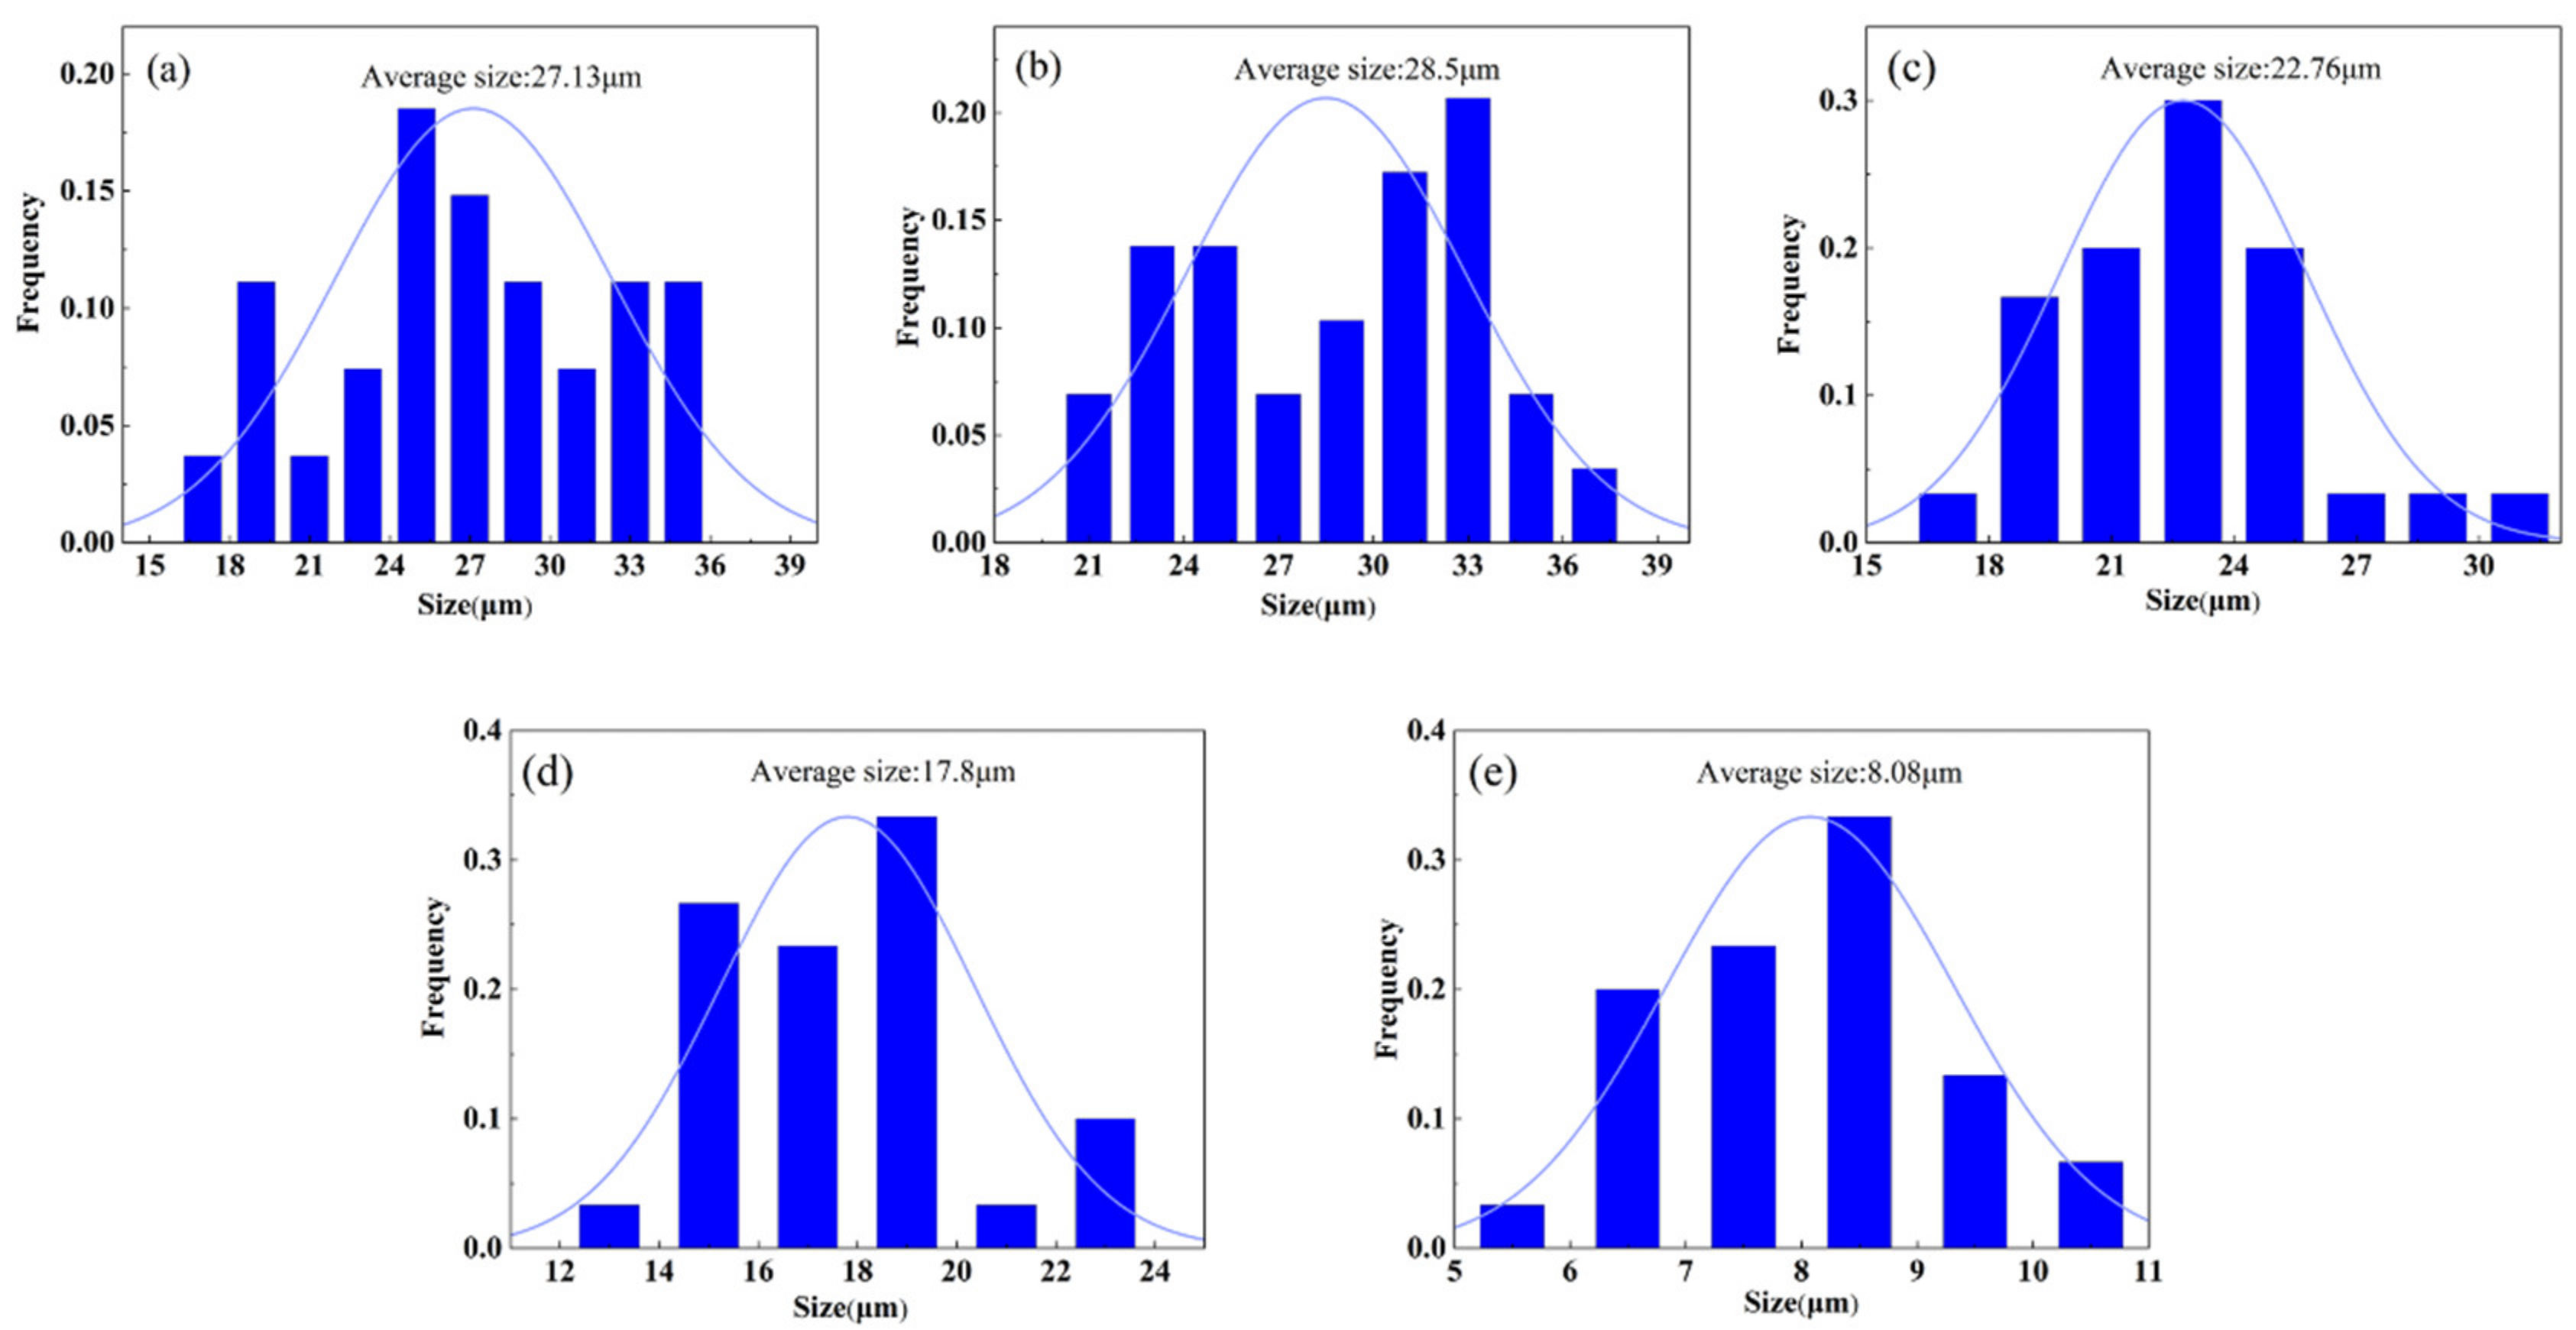
- The average grain size and volume fraction of α phase decreased, and the distribution of α phase varied from compact to scattering with increasing cooling rate. The high cooling rate caused the appearance of α’ phase in WC sample and presented a strip structure and crisscross distribution.
- (3)
- The cooling rate significantly affected the content of Hf in α and β phase. Hf tended to distribute in β phase, and the lower cooling rate was beneficial to the existence of Hf.
- (4)
- The lower cooling rate improved the plasticity but devastated the strength and microhardness. The elongation first increased, then decreased with increasing cooling rate. Nevertheless, the strength and microhardness enhanced monotonously.
Author Contributions
Funding
Data Availability Statement
Acknowledgments
Conflicts of Interest
References
- Zhou, Y.; Liang, S.; Jing, R.; Jiang, X.; Ma, M.; Tan, C.; Liu, R. Microstructure and tensile properties of hot-rolled Zr50-Ti50 binary alloy. Mater. Sci. Eng. A 2015, 621, 259–264. [Google Scholar] [CrossRef]
- Feng, Z.; Dong, H.; Kang, J.; Li, J.; Zhang, X.; Ma, M.; Liu, R. Study on the correlation between microstructures and corrosion properties of novel ZrTiAlV alloys. Mater. Sci. Eng. C 2019, 101, 92–102. [Google Scholar] [CrossRef] [PubMed]
- Guan, H.; Chai, L.; Wang, Y.; Xiang, K.; Wu, L.; Pan, H.; Yang, M.; Teng, C.; Zhang, W. Microstructure and hardness of NbTiZr and NbTaTiZr refractory medium-entropy alloy coatings on Zr alloy by laser cladding. Appl. Surf. Sci. 2021, 549, 149338. [Google Scholar] [CrossRef]
- Zhao, Y.; Li, H.; Huang, Y. The structure, mechanical, electronic and thermodynamic properties of bcc Zr-Nb alloy: A first principles study. J. Alloys Compd. 2021, 862, 158029. [Google Scholar] [CrossRef]
- Wei, T.; Zhang, L.; Miao, Z.; Liu, H.; Luan, B.; Wang, W.; Long, C. Microstructure and corrosion behavior of Zr–1.0Cr–0.4Fe–xMo alloys. Rare Metals. 2013, 34, 118–124. [Google Scholar] [CrossRef]
- Souza, A.C.; Aristone, F.; Rossi, J.L.; Martinez, L.G.; Cione, F.C.; Tsakiropoulos, P.; Grandini, C.R.; da Silva, W.F. Microstructural characterization of Zr1Nb alloy after hot rolling. Int. J. Refract. Met. Hard Mater. 2019, 80, 216–224. [Google Scholar] [CrossRef]
- Nagase, T.; Anada, S.; Rack, P.D.; Noh, J.H.; Yasuda, H.; Mori, H.; Egami, T. Electron-irradiation-induced structural change in Zr–Hf–Nb alloy. Intermetallics 2012, 26, 122–130. [Google Scholar] [CrossRef]
- Qiu, R.; Song, Z.; Luan, B.; Yue, Q.; Wang, L.; Yuan, G.; Murty, K.L.; Liu, Q. Evolution of microstructure and second-phase particles in Zr–Sn–Nb–Fe alloy tube during Pilger processing. J. Nucl. Sci. Technol. 2017, 54, 1321–1329. [Google Scholar] [CrossRef]
- Coury, F.G.; Kaufman, M.; Clarke, A.J. Solid-solution strengthening in refractory high entropy alloys. Acta Mater. 2019, 175, 66–81. [Google Scholar] [CrossRef]
- Ukai, S.; Yano, Y.; Inoue, T.; Sowa, T. Solid-solution strengthening by Al and Cr in FeCrAl oxide-dispersion-strengthened alloys. Mater. Sci. Eng. A 2021, 812, 141076. [Google Scholar] [CrossRef]
- Wang, H.; Wang, A.; Wang, Y.; Yang, Z.; Yang, J.; Han, N.; Chen, Y. <110>-growth orientation dependence of Ga2O3 nanowires on Cu3As seeds via vapor-solid-solid mechanism. J. Alloys Compd. 2021, 864, 158786. [Google Scholar] [CrossRef]
- Lan, J.; Shen, X.; Liu, J.; Hua, L. Strengthening mechanisms of 2A14 aluminum alloy with cold deformation prior to artificial aging. Mater. Sci. Eng. A 2019, 745, 517–535. [Google Scholar] [CrossRef]
- Mineta, T.; Sato, H. Simultaneously improved mechanical properties and corrosion resistance of Mg-Li-Al alloy produced by severe plastic deformation. Mater. Sci. Eng. A 2018, 735, 418–422. [Google Scholar] [CrossRef]
- Wang, B.; Wang, N.; Yang, Y.; Zhong, H.; Ma, M.; Zhang, X.; Liu, R. Microstructure and mechanical properties of ZrO2 particle dispersion strengthened 16MnV steel. Mater. Sci. Eng. A 2017, 692, 168–173. [Google Scholar] [CrossRef]
- Ma, K.; Wen, H.; Hu, T.; Topping, T.D.; Isheim, D.; Seidman, D.N.; Lavernia, E.J.; Schoenung, J.M. Mechanical behavior and strengthening mechanisms in ultrafine grain precipitation-strengthened aluminum alloy. Acta Mater. 2014, 62, 141–155. [Google Scholar] [CrossRef]
- Masuda, T.; Sauvage, X.; Hirosawa, S.; Horita, Z. Achieving highly strengthened Al-Cu-Mg alloy by grain refinement and grain boundary segregation. Mater. Sci. Eng. A 2020, 793, 139668. [Google Scholar] [CrossRef]
- Lee, D.H.; Park, J.M.; Yang, G.; He, J.; Lu, Z.; Suh, J.Y.; Kawasaki, M.; Ramamurty, U.; Jang, J. Nano-graining a particle-strengthened high-entropy alloy. Scripta Mater. 2019, 163, 24–28. [Google Scholar] [CrossRef]
- Dong, H.; Feng, Z.; Liang, S.; Sun, X.; Li, J.; Wu, D.; Su, R.; Zhang, X. Evolution of microstructure, mechanical properties and corrosion behaviors using cooling rate regulation in a novel ZrTi-based alloy. J. Mater. Res. Technol. 2020, 9, 3471–3480. [Google Scholar] [CrossRef]
- Yi, Y.; Li, Q.; Xing, J.; Fu, H.; Yi, D.; Liu, Y.; Zheng, B. Effects of cooling rate on microstructure, mechanical properties, and residual stress of Fe-2.1B (wt%) alloy. Mater. Sci. Eng. A 2019, 754, 129–139. [Google Scholar] [CrossRef]
- Li, J.; Ding, R.; Guo, Q.; Li, C.; Liu, Y.; Wang, Z.; Li, H.; Liu, C. Effect of solution cooling rate on microstructure evolution and mechanical properties of Ni-based superalloy ATI 718Plus. Mater. Sci. Eng. A 2021, 812, 141113. [Google Scholar] [CrossRef]
- Jiang, D.; Zhang, L. Influence of cooling parameters on the microstructure and primary carbide precipitation in GCr15 steel. Steel Res. Int. 2021, 92, 2100208. [Google Scholar] [CrossRef]
- Zhang, M.; Zhang, F.; Yang, Z.; Li, Y.; Qu, L.; Zhen, H. Effect of cooling process on the formation of duplex microstructure in Zr-2.3Nb alloy. J. Alloys Compd. 2015, 651, 316–321. [Google Scholar] [CrossRef]
- Kulkarni, R.V.; Mani Krishna, K.V.; Neogy, S.; Srivastava, D.; Ramadasan, E.; Shriwastaw, R.S.; Rath, B.N.; Saibaba, N.; Jha, S.K.; Dey, G.K. Mechanical properties of Zr-2.5%Nb pressure tube material subjected to heat treatments in α+β phase field. J. Nucl. Mater. 2014, 451, 300–312. [Google Scholar] [CrossRef]
- Hsu, H.; Wu, S.; Hsu, S.; Sung, Y.; Ho, W. Effects of heat treatments on the structure and mechanical properties of Zr-30Ti alloys. Mater. Charact. 2011, 62, 157–163. [Google Scholar] [CrossRef]
- Jiang, X.J.; Jing, R.; Ma, M.Z.; Liu, R.P. The orthorhombic α″ martensite transformation during water quenching and its influence on mechanical properties of Ti-41Zr-7.3Al alloy. Intermetallics 2014, 52, 32–35. [Google Scholar] [CrossRef]
- Zhang, T.X.; Zhao, X.T.; Liu, J.H.; Zhang, R.J.; Wang, X.F.; Yuan, Y.; Li, Z.Q.; Han, Z.Q. The microstructure, fracture mechanism and their correlation with the mechanical properties of as-cast Mg-Nd-Zn-Zr alloy under the effect of cooling rate. Mater. Sci. Eng. A 2021, 801, 140382. [Google Scholar] [CrossRef]
- Alexopoulos, N.D.; Tiryakioĝlu, M. On the uniform elongation of cast Al-7%Si-0.6%Mg (A357) alloys. Mater. Sci. Eng. A 2009, 507, 236–240. [Google Scholar] [CrossRef]


| Element | Zr | Nb | Hf | Fe | Ti |
|---|---|---|---|---|---|
| wt% | 92.27 | 3.01 | 4.47 | 0.16 | 0.09 |
| Samples | FC-1 | FC-2 | FC-3 | AC | WC |
|---|---|---|---|---|---|
| Volume fraction of α phase | 91.91% | 85.94% | 76.26% | 13.60% | 11.37% |
| Cooling Rate | Phase | Position | Element | Weight/% | Atomic/% |
|---|---|---|---|---|---|
| FC-1 | α | 1 | Zr | 91.91 | 93.29 |
| Hf | 5.11 | 5.09 | |||
| Nb | 2.92 | 1.52 | |||
| Ti | 0.06 | 0.10 | |||
| Total | 100 | 100 | |||
| β | 2 | Zr | 85.71 | 86.66 | |
| Hf | 11.96 | 11.87 | |||
| Nb | 2.15 | 1.11 | |||
| Ti | 0.18 | 0.36 | |||
| Total | 100 | 100 | |||
| AC | α | 3 | Zr | 92.31 | 93.24 |
| Hf | 5.00 | 4.96 | |||
| Nb | 2.38 | 1.23 | |||
| Ti | 0.32 | 0.57 | |||
| Total | 100 | 100 | |||
| β | 4 | Zr | 89.38 | 90.56 | |
| Hf | 8.26 | 8.22 | |||
| Nb | 2.07 | 0.91 | |||
| Ti | 0.29 | 0.31 | |||
| Total | 100 | 100 |
Disclaimer/Publisher’s Note: The statements, opinions and data contained in all publications are solely those of the individual author(s) and contributor(s) and not of MDPI and/or the editor(s). MDPI and/or the editor(s) disclaim responsibility for any injury to people or property resulting from any ideas, methods, instructions or products referred to in the content. |
© 2022 by the authors. Licensee MDPI, Basel, Switzerland. This article is an open access article distributed under the terms and conditions of the Creative Commons Attribution (CC BY) license (https://creativecommons.org/licenses/by/4.0/).
Share and Cite
Guo, S.; Wang, Q.; Xing, X.; Du, Y.; Zheng, J.; Wang, S.; Shen, Z. The Effect of Cooling Rate on Microstructure and Mechanical Properties of the Zr-4Hf-3Nb (wt%) Alloy. Metals 2023, 13, 15. https://doi.org/10.3390/met13010015
Guo S, Wang Q, Xing X, Du Y, Zheng J, Wang S, Shen Z. The Effect of Cooling Rate on Microstructure and Mechanical Properties of the Zr-4Hf-3Nb (wt%) Alloy. Metals. 2023; 13(1):15. https://doi.org/10.3390/met13010015
Chicago/Turabian StyleGuo, Shenglan, Qi Wang, Xiangdong Xing, Yueli Du, Jianlu Zheng, Sunxuan Wang, and Zhenghua Shen. 2023. "The Effect of Cooling Rate on Microstructure and Mechanical Properties of the Zr-4Hf-3Nb (wt%) Alloy" Metals 13, no. 1: 15. https://doi.org/10.3390/met13010015
APA StyleGuo, S., Wang, Q., Xing, X., Du, Y., Zheng, J., Wang, S., & Shen, Z. (2023). The Effect of Cooling Rate on Microstructure and Mechanical Properties of the Zr-4Hf-3Nb (wt%) Alloy. Metals, 13(1), 15. https://doi.org/10.3390/met13010015