Article

Ductile Fracture Investigation of High-Strength Steel SM570 under Low Stress Triaxiality

1
Department of Civil Engineering, Meijo University, Nagoya 468-8502, Japan
2
National Engineering Research Center of Biomaterials, Nanjing Forestry University, Nanjing 210037, China
*
Authors to whom correspondence should be addressed.
Metals 2022, 12(8), 1394; https://doi.org/10.3390/met12081394
Submission received: 20 July 2022 / Revised: 15 August 2022 / Accepted: 17 August 2022 / Published: 22 August 2022
(This article belongs to the Special Issue Modelling, Test and Practice of Steel Structures)

Abstract

:
A comprehensive understanding of the fracture behavior of high-strength steel is of great significance for its structural application. In this study, experiments were conducted to investigate the ductile fracture mechanism of high-strength steel SM570, one type of conventional structural steel. Two types of shear specimens, one with symmetrical notches and the other with asymmetrical notches, were designed, and by changing the notch angles, a wide range of low-stress triaxiality could be obtained. Based on the discussion of the experimental results, crack initiation, and its propagation up to fracture failure were clarified. Compared with the fracture behavior of SM490 (one type of conventional normal-strength structural steel), the SM570 with higher yield stress has relatively severe stress concentration, the crack initiation appears earlier, and the brittle fracture is more likely to occur. Numerical simulations based on the finite element method (FEM) were performed with ABAQUS to obtain the stress triaxialities and equivalent plastic strain of the symmetrical and asymmetrical specimens. A modified N-VG model with a fracture criterion at a negative and low-stress triaxiality range from −0.6 to 1/3 was proposed for evaluating the fracture behavior of steel SM570.

1. Introduction

Fracture prediction in steel structures is of great significance, and has been studied comprehensively for decades [1,2,3,4,5,6,7,8,9,10]. Numerous parameters are utilized for ductile fracture prediction, among which the stress triaxiality is confirmed to be an important parameter for predicting the crack initiation of ductile fractures [5,6,7,8,9,10,11]. Stress triaxiality is an index representing the degree of multiaxial restraint and is given by the following equation [7]:
η = σ h σ e q
where σ h is the hydrostatic stress and σ e q is the Huber–Mises–Hencky (HMH) equivalent stress. They are defined by Equations (2) and (3), respectively.
σ h = 1 3 ( σ 1 + σ 2 + σ 3 )
σ e q = 1 2 [ ( σ 1 σ 2 ) 2 + ( σ 2 σ 3 ) 2 + ( σ 3 σ 1 ) 2 ]
where σ 1 , σ 2 , and σ 3 are the principal stresses.
Until now, the authors have conducted several studies on a type of normal-strength structural steel, SM490, standardized by the Japanese Industrial Standards (JIS) Committee in the code JIS G 3160 [12]. The ductile fracture behavior of SM490 under high-stress triaxiality ( η 1 / 3 ), including crack initiation, propagation, and final failure, has been experimentally and analytically studied via monotonic tensile tests on specimens with different notch angles and notch radii [13]. The failure mechanism of SM490 under low-stress triaxiality ( η < 1 / 3 ), that is, under a complex stress state where tensile stress and shear stress act simultaneously, has also been clarified [14,15].
On the other hand, the number of structures using high-yield stress steel has been increasing in recent years, such as the Tokyo Gate Bridge using a type of steel for high-performance bridge structures [16]. Subsequently, researchers also turned their attention to the study of high-performance steel. Kinoshita et al. [17] studied the effect of using high-yield stress steel on the weight reduction in steel trusses. Hirohata et al. [18] carried out a series of experiments to clarify the effects of the heating-cooling history of an assumed fire scenario on the mechanical properties of steel for high-performance bridge structures. Furthermore, the authors clarified the mechanical properties of high-strength steel up to fracture failure under high-stress triaxiality, as well as the crack initiation and propagation [19].
Recent works demonstrate that only stress triaxiality-dependent ductile fracture models appear to have some limitations in predicting crack initiation at negative and low-stress triaxiality [8,9,11,14,20,21]. For the steels under negative or low-stress triaxiality, the actual crack initiation may occur far earlier than the prediction. Although numerous studies under low-stress triaxiality have been conducted, research on the ductile fracture of high-strength steel has not been fully carried out [20,21,22,23,24,25,26,27,28,29,30,31,32,33]. Additionally, the crack initiation often occurs in a relatively local region (hotspot region) and the damage accumulation at the hotspot region is sensitive to the stress triaxiality and the equivalent plastic strain. To evaluate the fracture locus for different stress states, more tests, especially shear tests, are needed. Therefore, this study aims to investigate the ductile fracture behavior of high-strength steel under low-stress triaxiality through experiments and numerical analysis, so as to provide a more comprehensive understanding of the characteristics of high-strength steel.

2. Specimens and Loading Method

The test specimens were composed of SM570, a high-strength general-structural steel (hereinafter referred to as SM570), standardized by JIS G 3140 [34]. The mechanical properties of the base material were first, investigated using tensile specimens. All test specimens, including the shear specimens to be mentioned later, were cut from sheet metal of a 12 mm thick rolled steel plate with the longitudinal axis along the rolling direction. The steel plate had not been heat treated. Figure 1 shows the schematic diagram and picture of the tensile specimen. The tests were conducted on a 500 kN MTS material testing machine with a stoke of ±75 mm. Tensile loading was applied to the specimen at a rate of 0.02–0.05 mm/s with displacement control. The stress-strain curves obtained from three tensile specimens are shown in Figure 2. There is no significant difference in the stress-strain curves between different specimens before the yield stress, and small variations can be observed beyond the yield stress. The tested material, SM570, had a short-yield platform in the strain range of 1.2 ε y 2.2 ε y , where ε y is the yield strain. The mechanical properties of the base material were obtained as the average values of three tested specimens and are summarized in Table 1. The yield stress and tensile strength specified by the standard are also given in the table. It is apparent that the tested material meets the requirements of the specification for yield stress and tensile strength.
With reference to the shear test for aluminum alloy (2024-T351) conducted by Bao and Wierzbicki et al. [8], the shear specimens with symmetrical and unsymmetrical notches were designed in this study. Such specimens can ensure that the fracture appears in a small area and the out-of-plane bending deformation will not occur to the specimens. When tensile loading is applied to the designed specimens, with the varying notch angles, the complex stress states where tensile/compressive stress and shear stress act simultaneously can be realized. Therefore, fracture modes and fracture failures under the complex stress states can be investigated experimentally. In addition, the previous study [14] showed the effectiveness of the presented specimens by studying the fracture behavior under low-stress triaxiality.
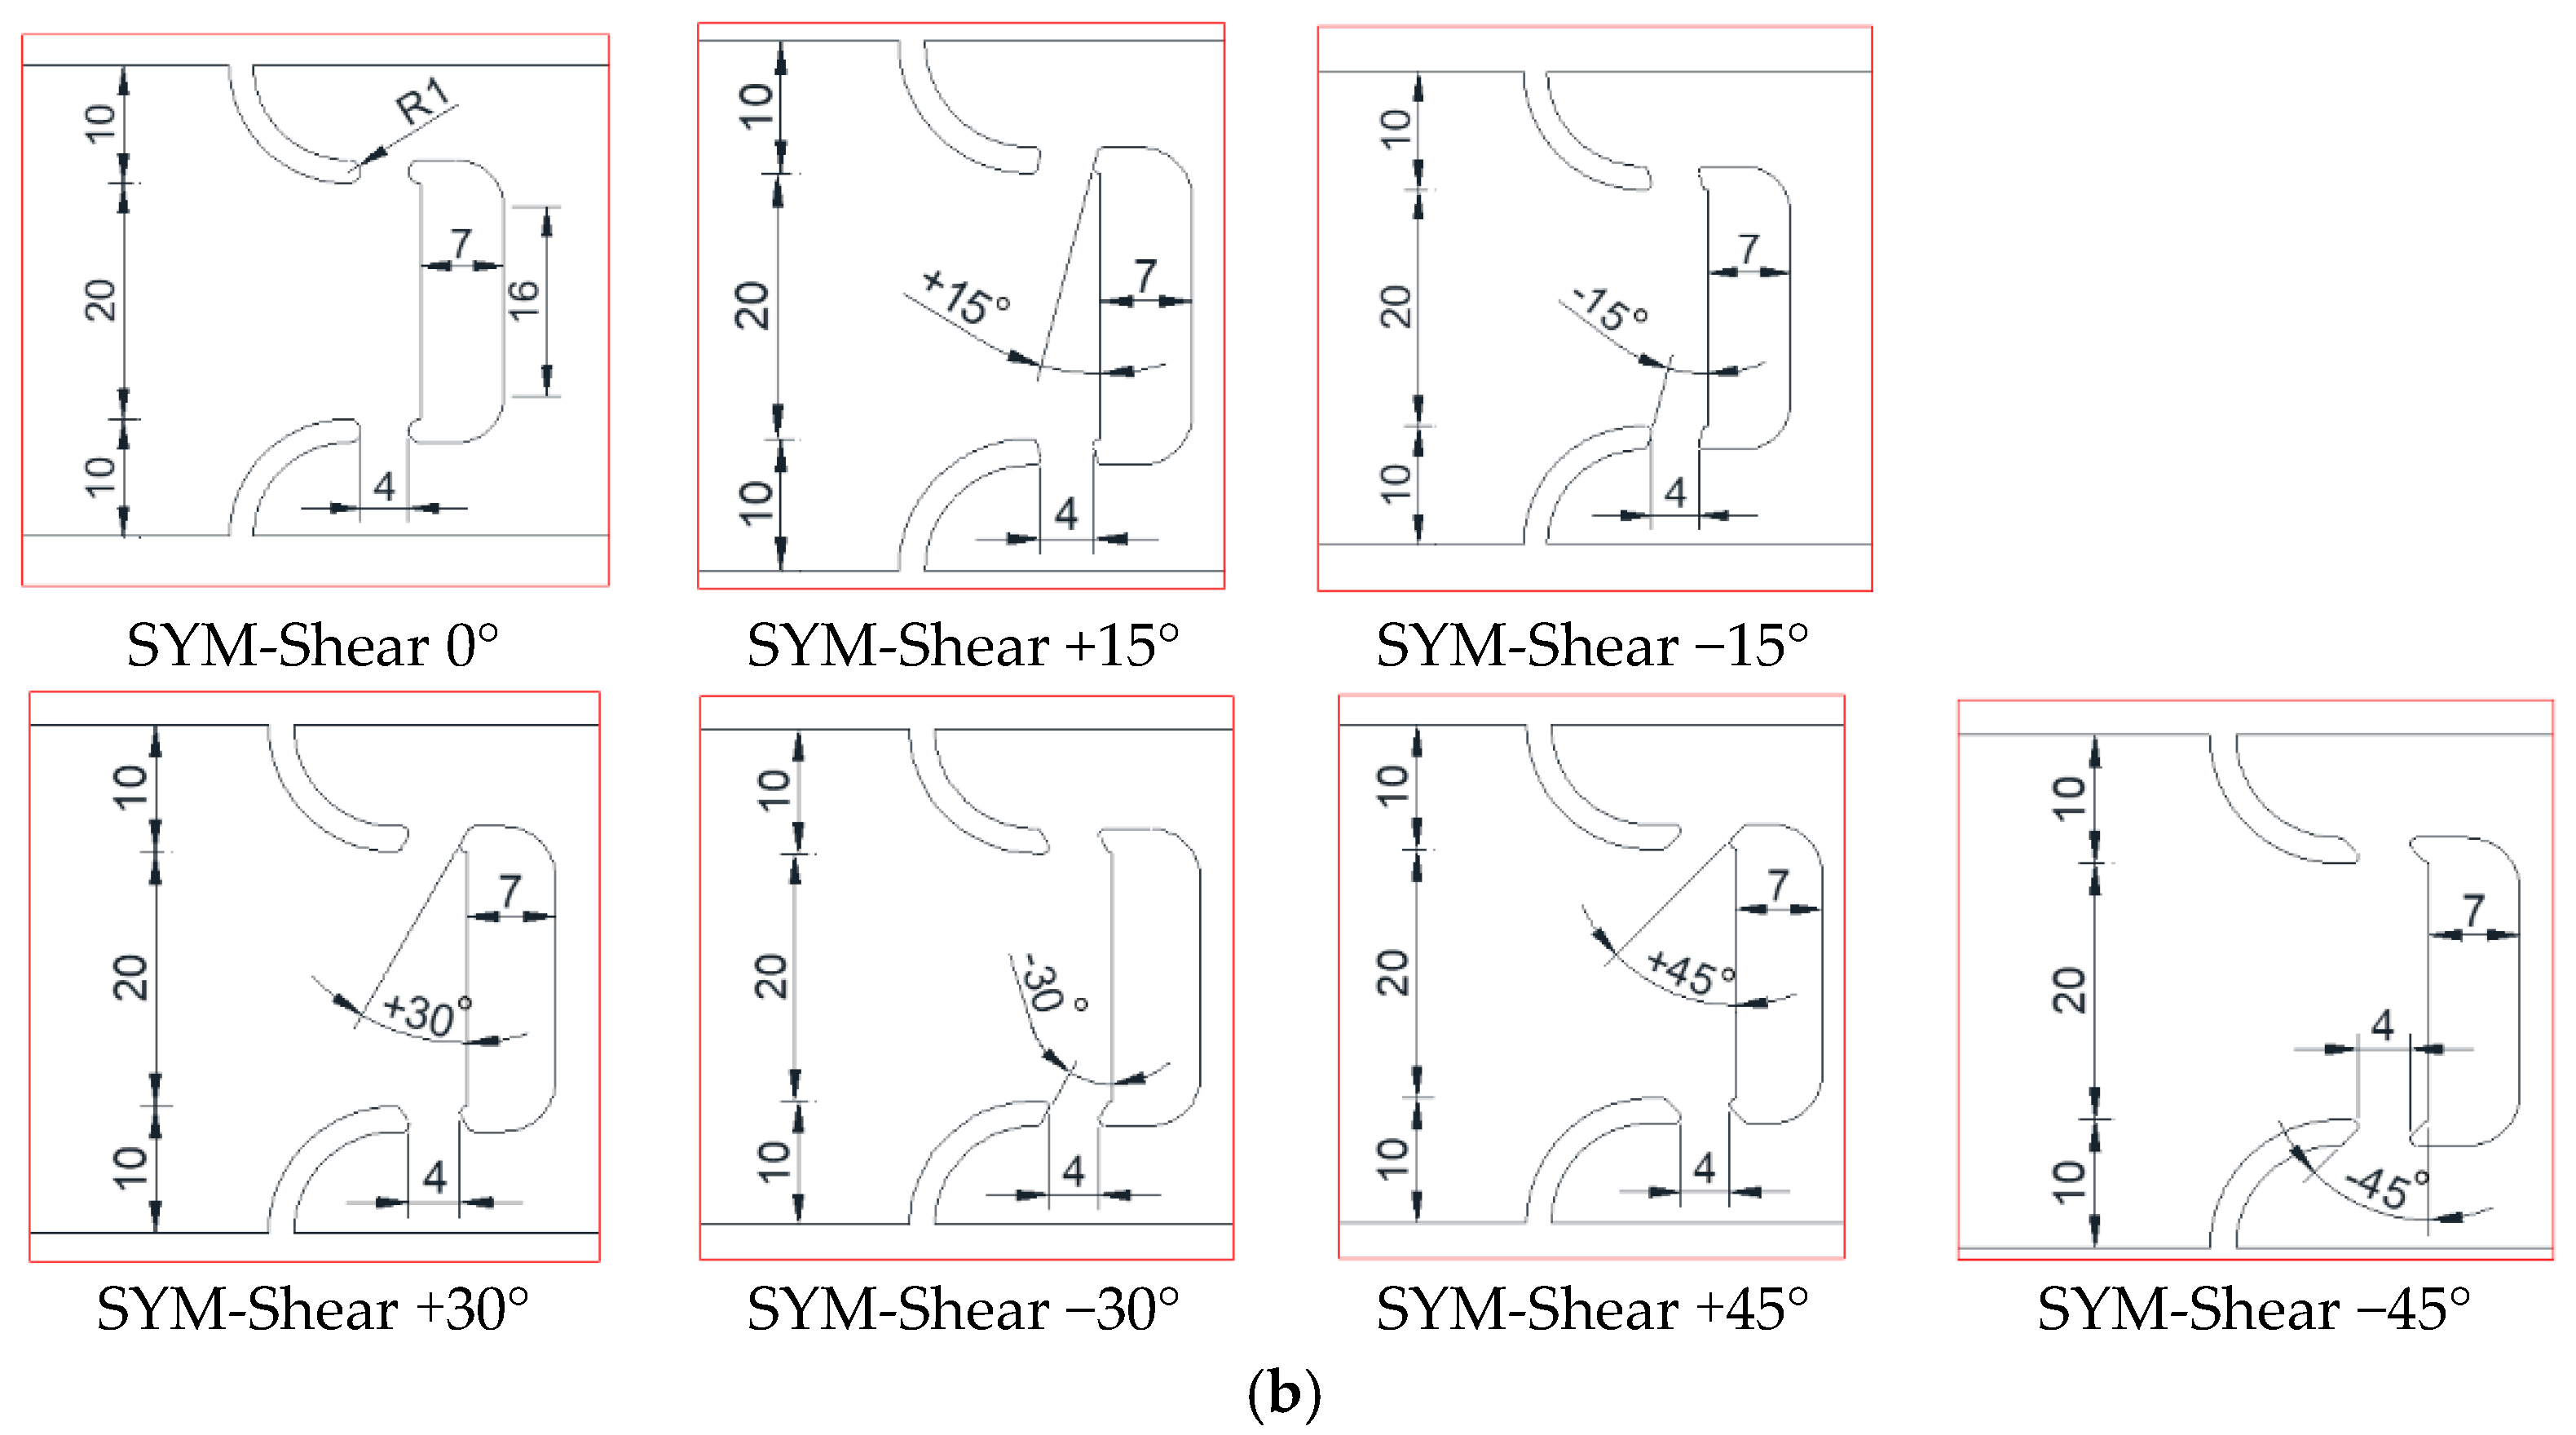
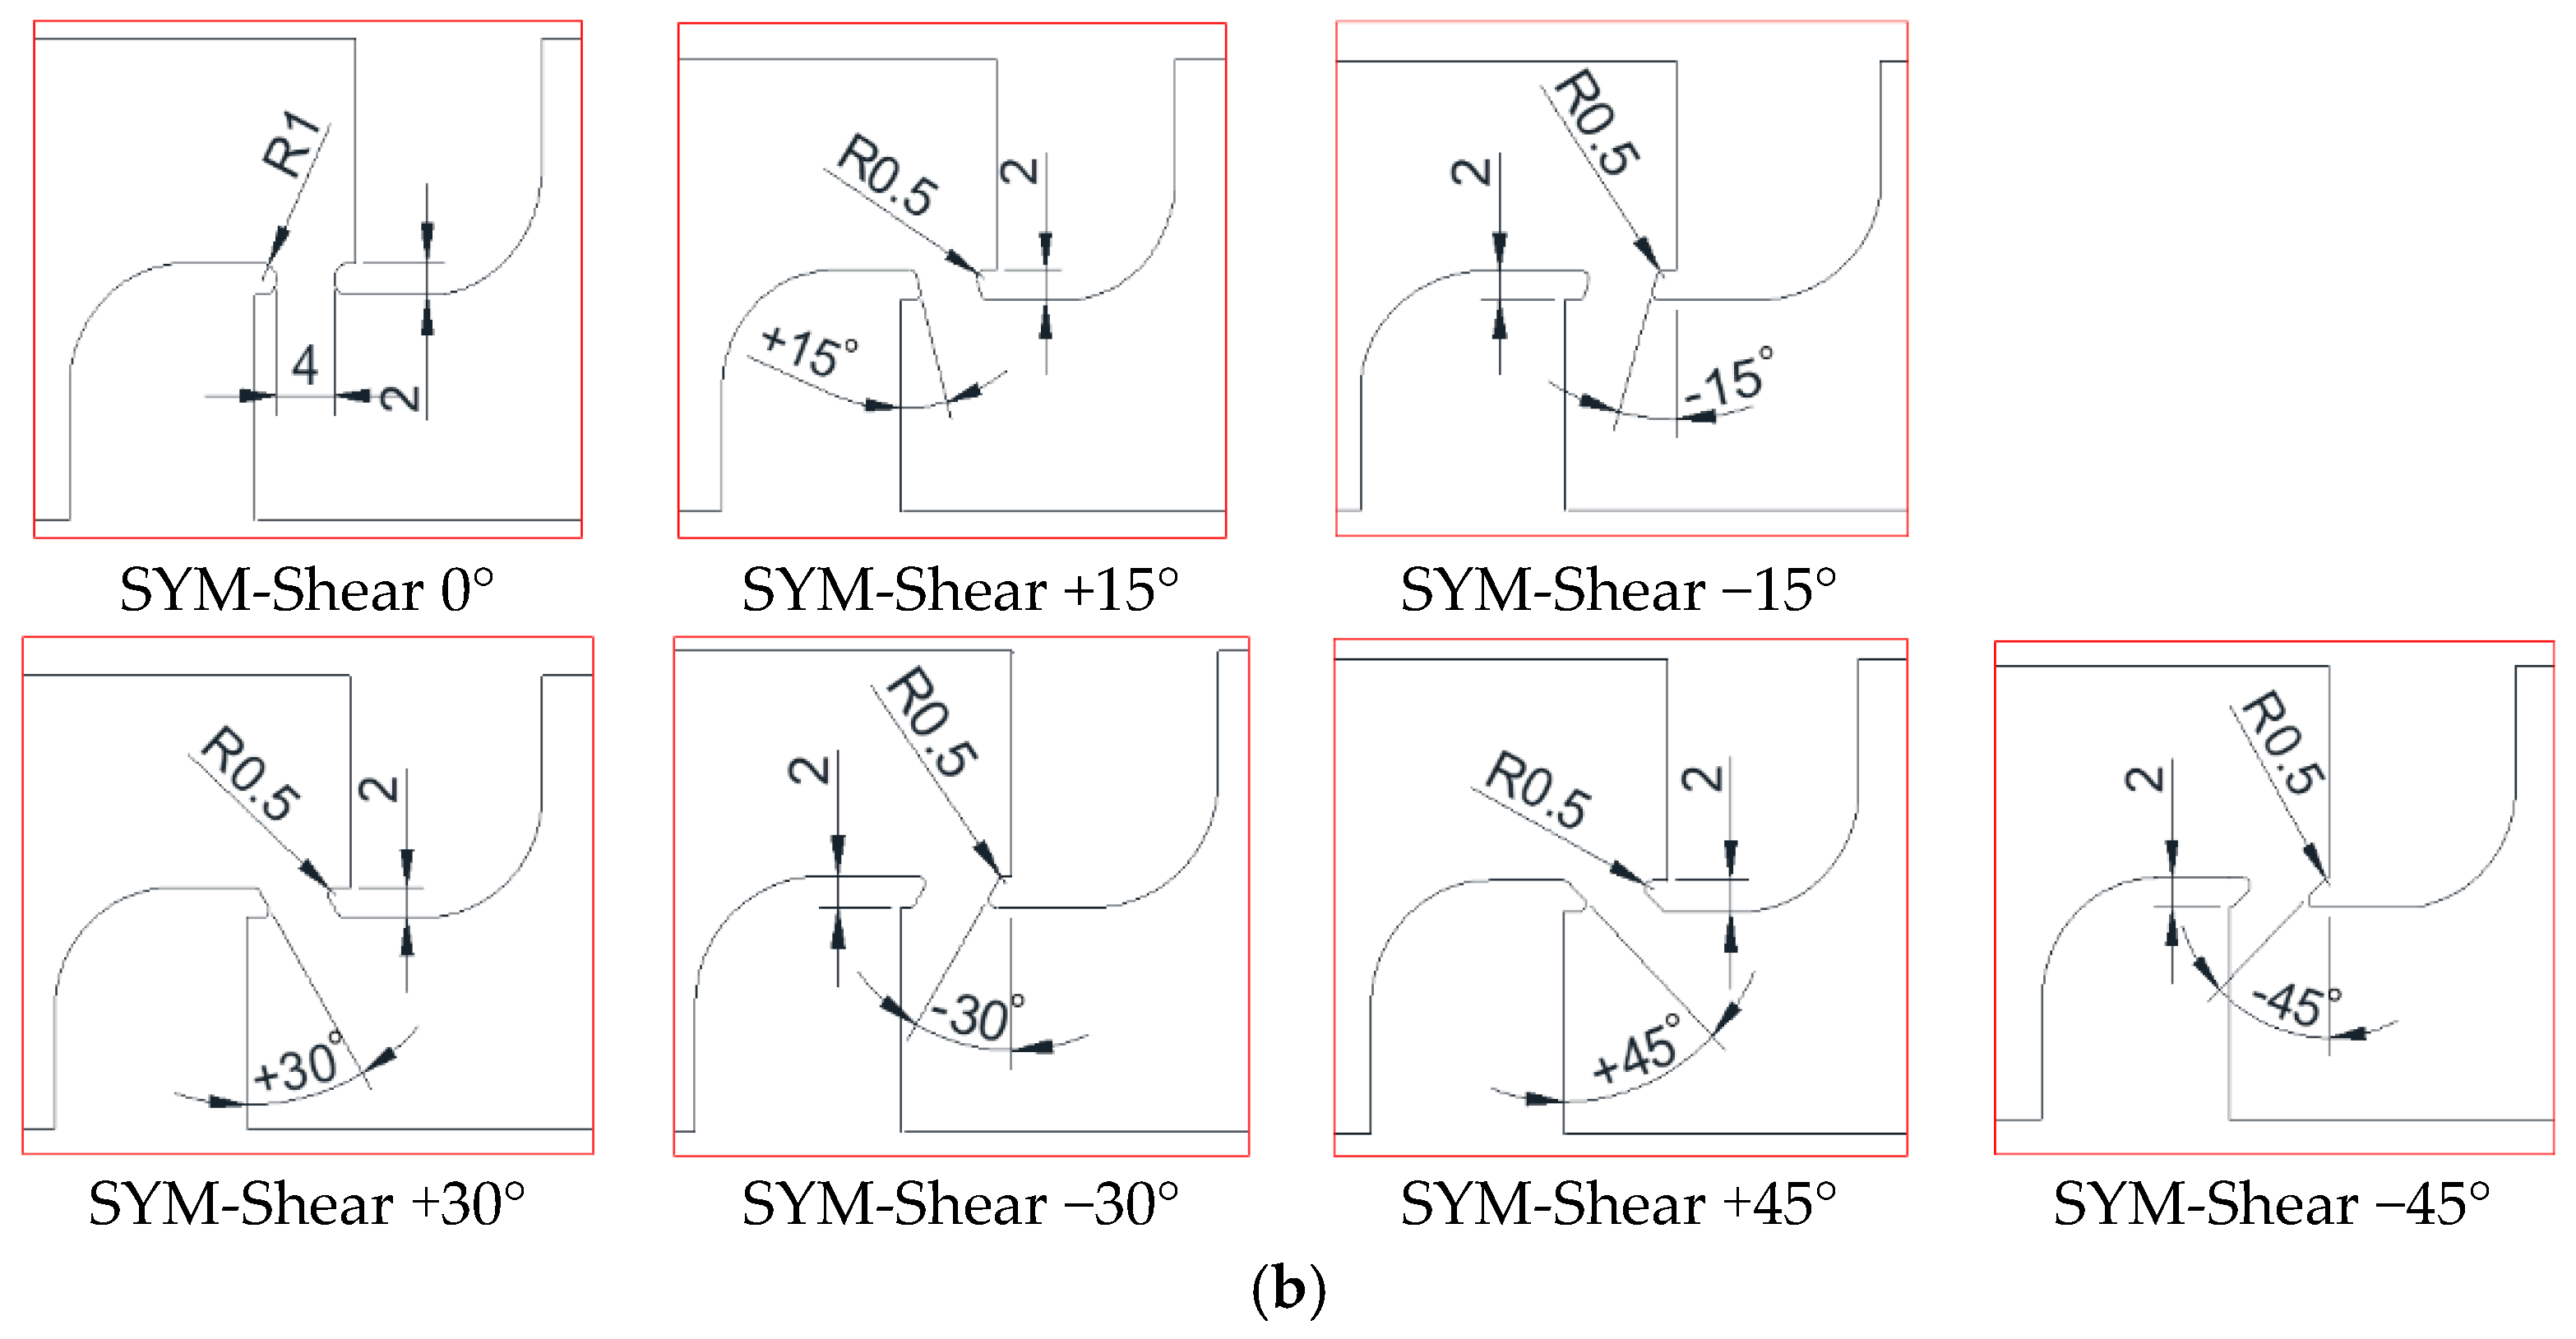
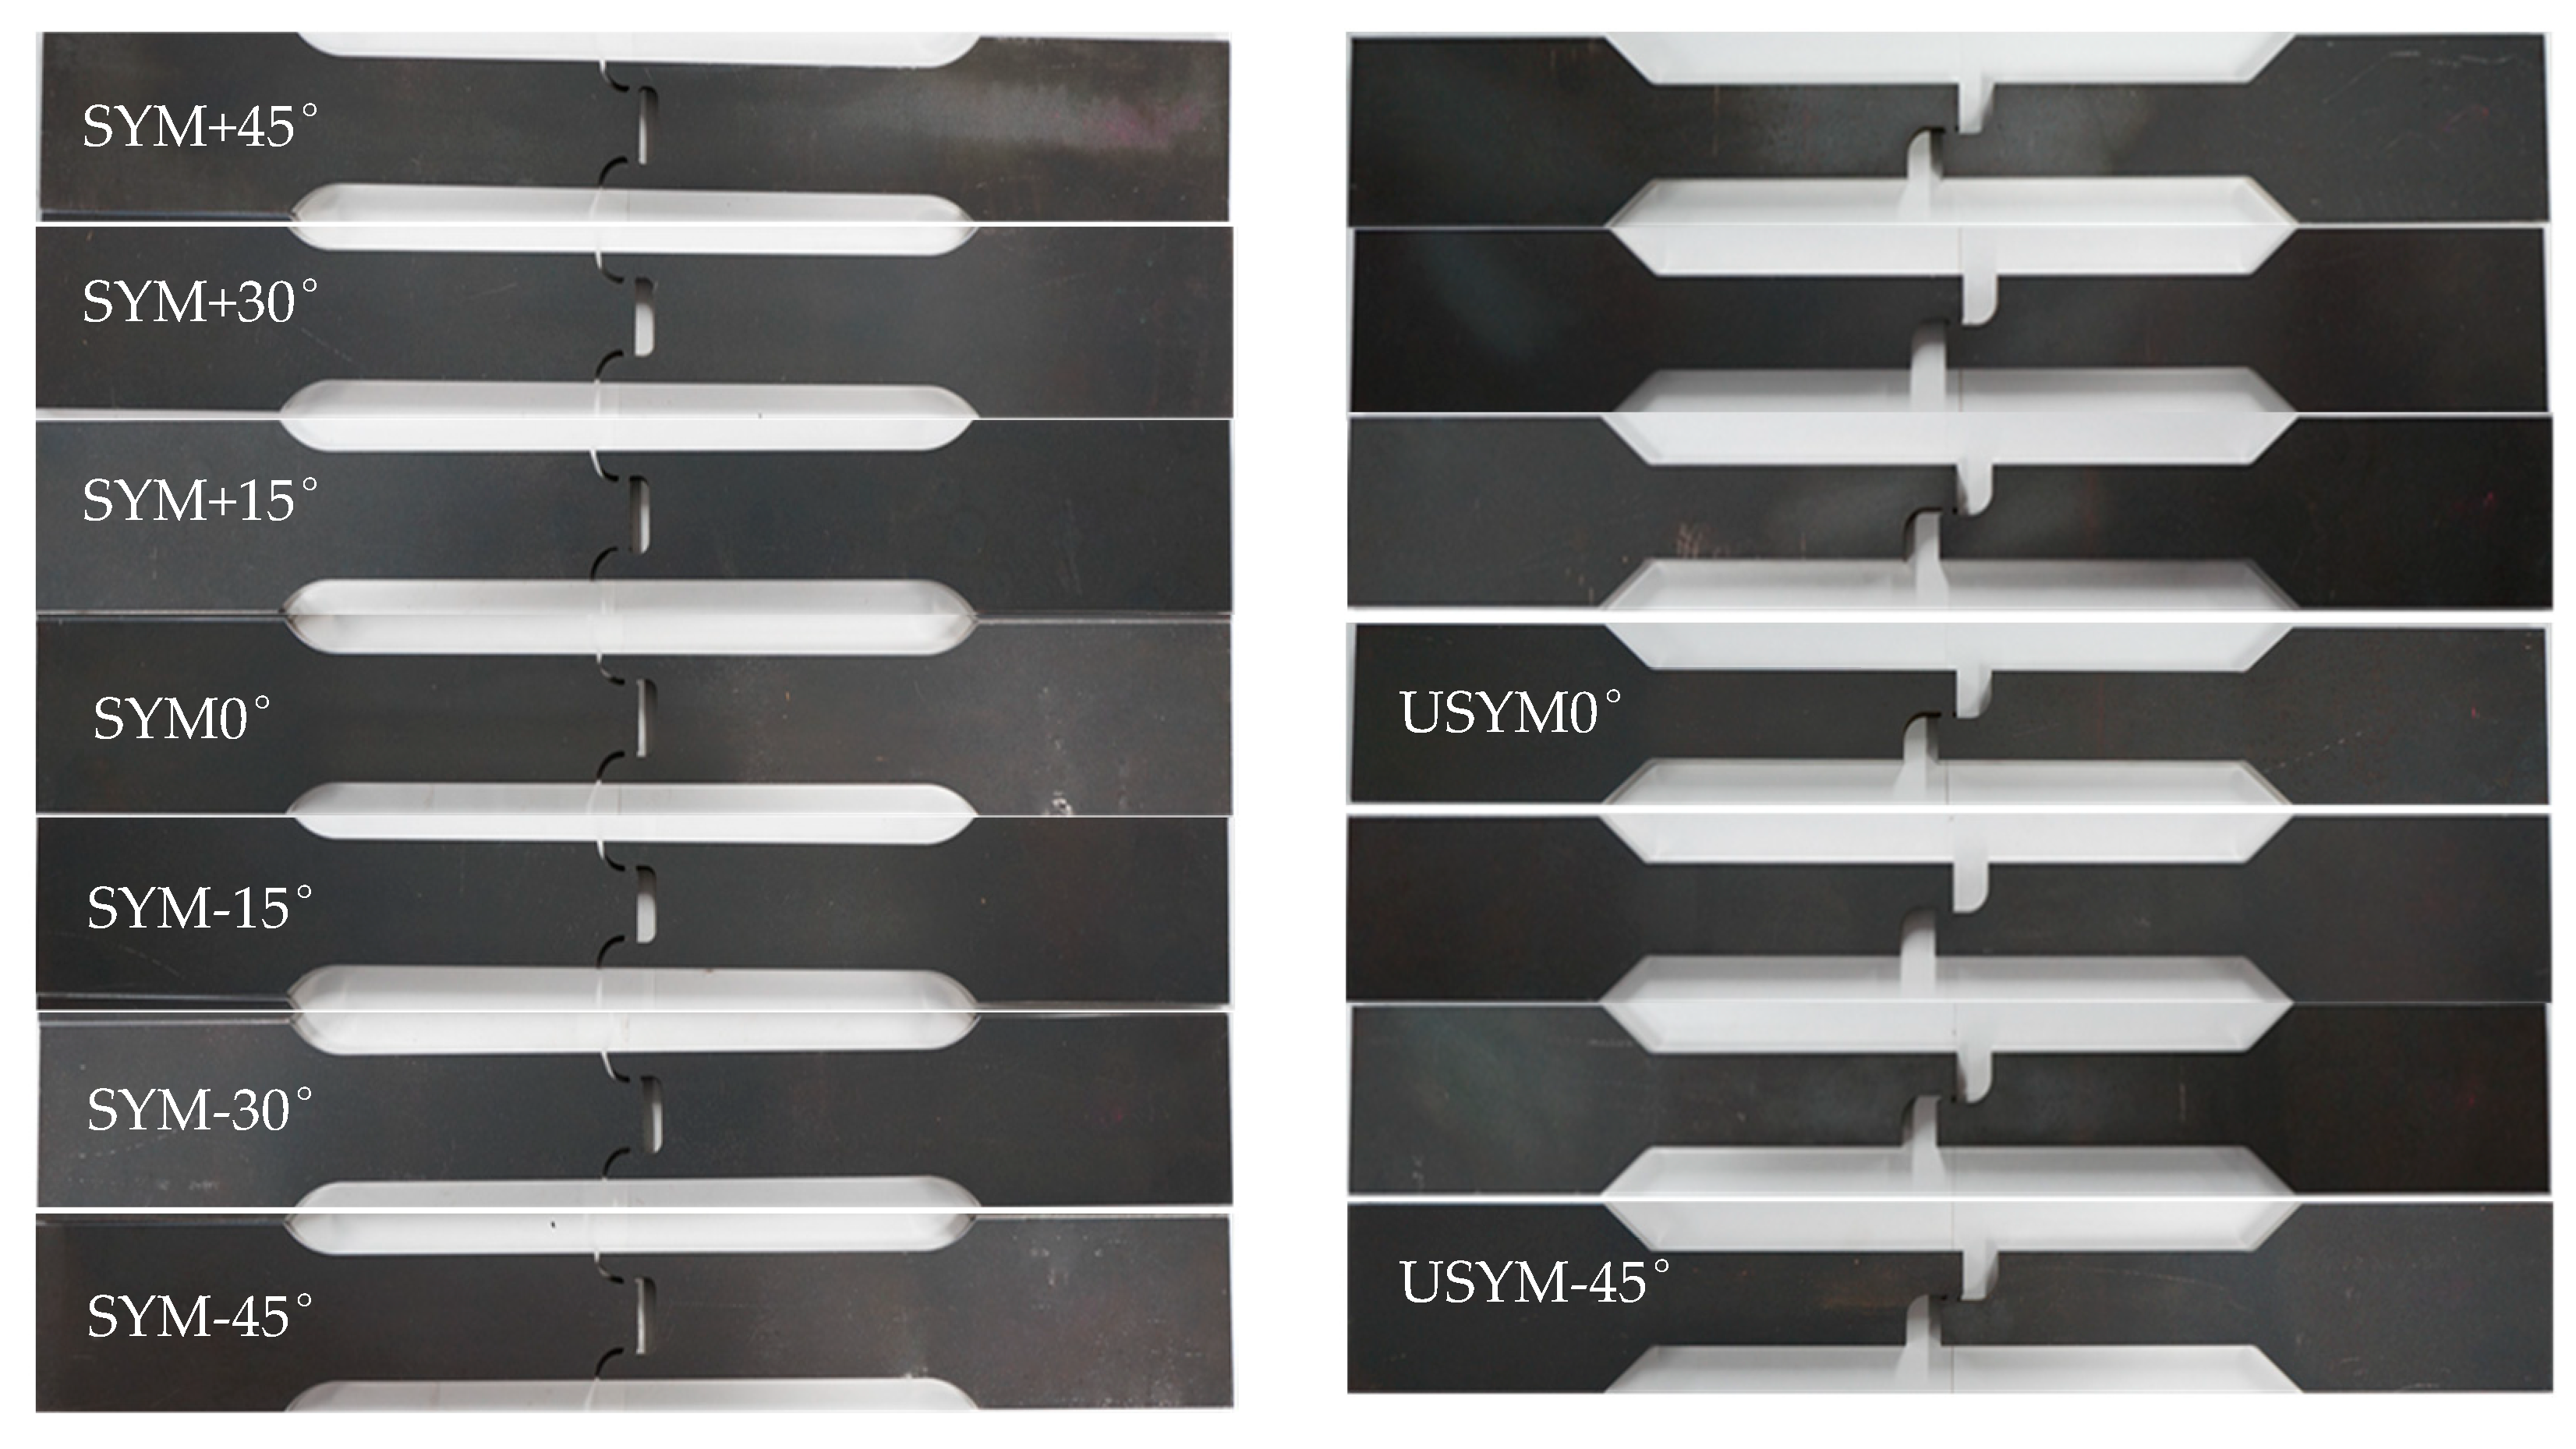
Two types of shear specimen were used in this study: one type having notches symmetrical concerning the loading direction (hereinafter referred to as SYM-Shear specimen), as shown in Figure 3, and the other one having asymmetrical notches (referred to as USYM-Shear specimen), as shown in Figure 4. The notches were processed using a CNC (Computerized Numerical Control) cutting machine, which is a widely accepted and mature processing method. The machining accuracy can meet the requirements of both practical application and research. The unique design of the specimen enables the complex stress state to be realized, in which the tensile stress and the shear stress act simultaneously. By changing the geometries and the angles of the notches, a wide stress triaxiality range can be achieved. As shown in Figure 3 and Figure 4, SYM-Shear specimens and USYM-Shear specimens with 7 different notch angles were designed. The 7 SYM-Shear specimen sets were denoted by SYM-Shear0°, SYM-Shear+15°, SYM-Shear−15°, SYM-Shear+30°, SYM-Shear−30°, SYM-Shear+45°, and SYM-Shear−45°, while the 7 USYM-Shear specimen sets were denoted by USYM-Shear0°, USYM-Shear+15°, USYM-Shear−15°, USYM-Shear+30°, USYM-Shear−30°, USYM-Shear+45°, and USYM-Shear−45°. Each set consisted of two specimens. Photos of the specimens are shown in Figure 5.
The specimen was mounted on a 500 kN MTS material testing machine with a stoke of ±75 mm. The monotonic tensile loading was applied to the specimen by displacement control at a rate of 0.02–0.05 mm/s (corresponding strain rate 1 × 10⁻⁴/s to 2.5 × 10⁻⁴/s). During the test, the load and displacement were recorded using a data logger (TDS-530 TML, Tokyo, Japan). As shown in Figure 6, the displacement was measured using a contact Ω extensometer (TML, Tokyo, Japan) with a gauge length of 200 mm.

3. Experimental Results and Discussion

3.1. Load-Displacement Curves

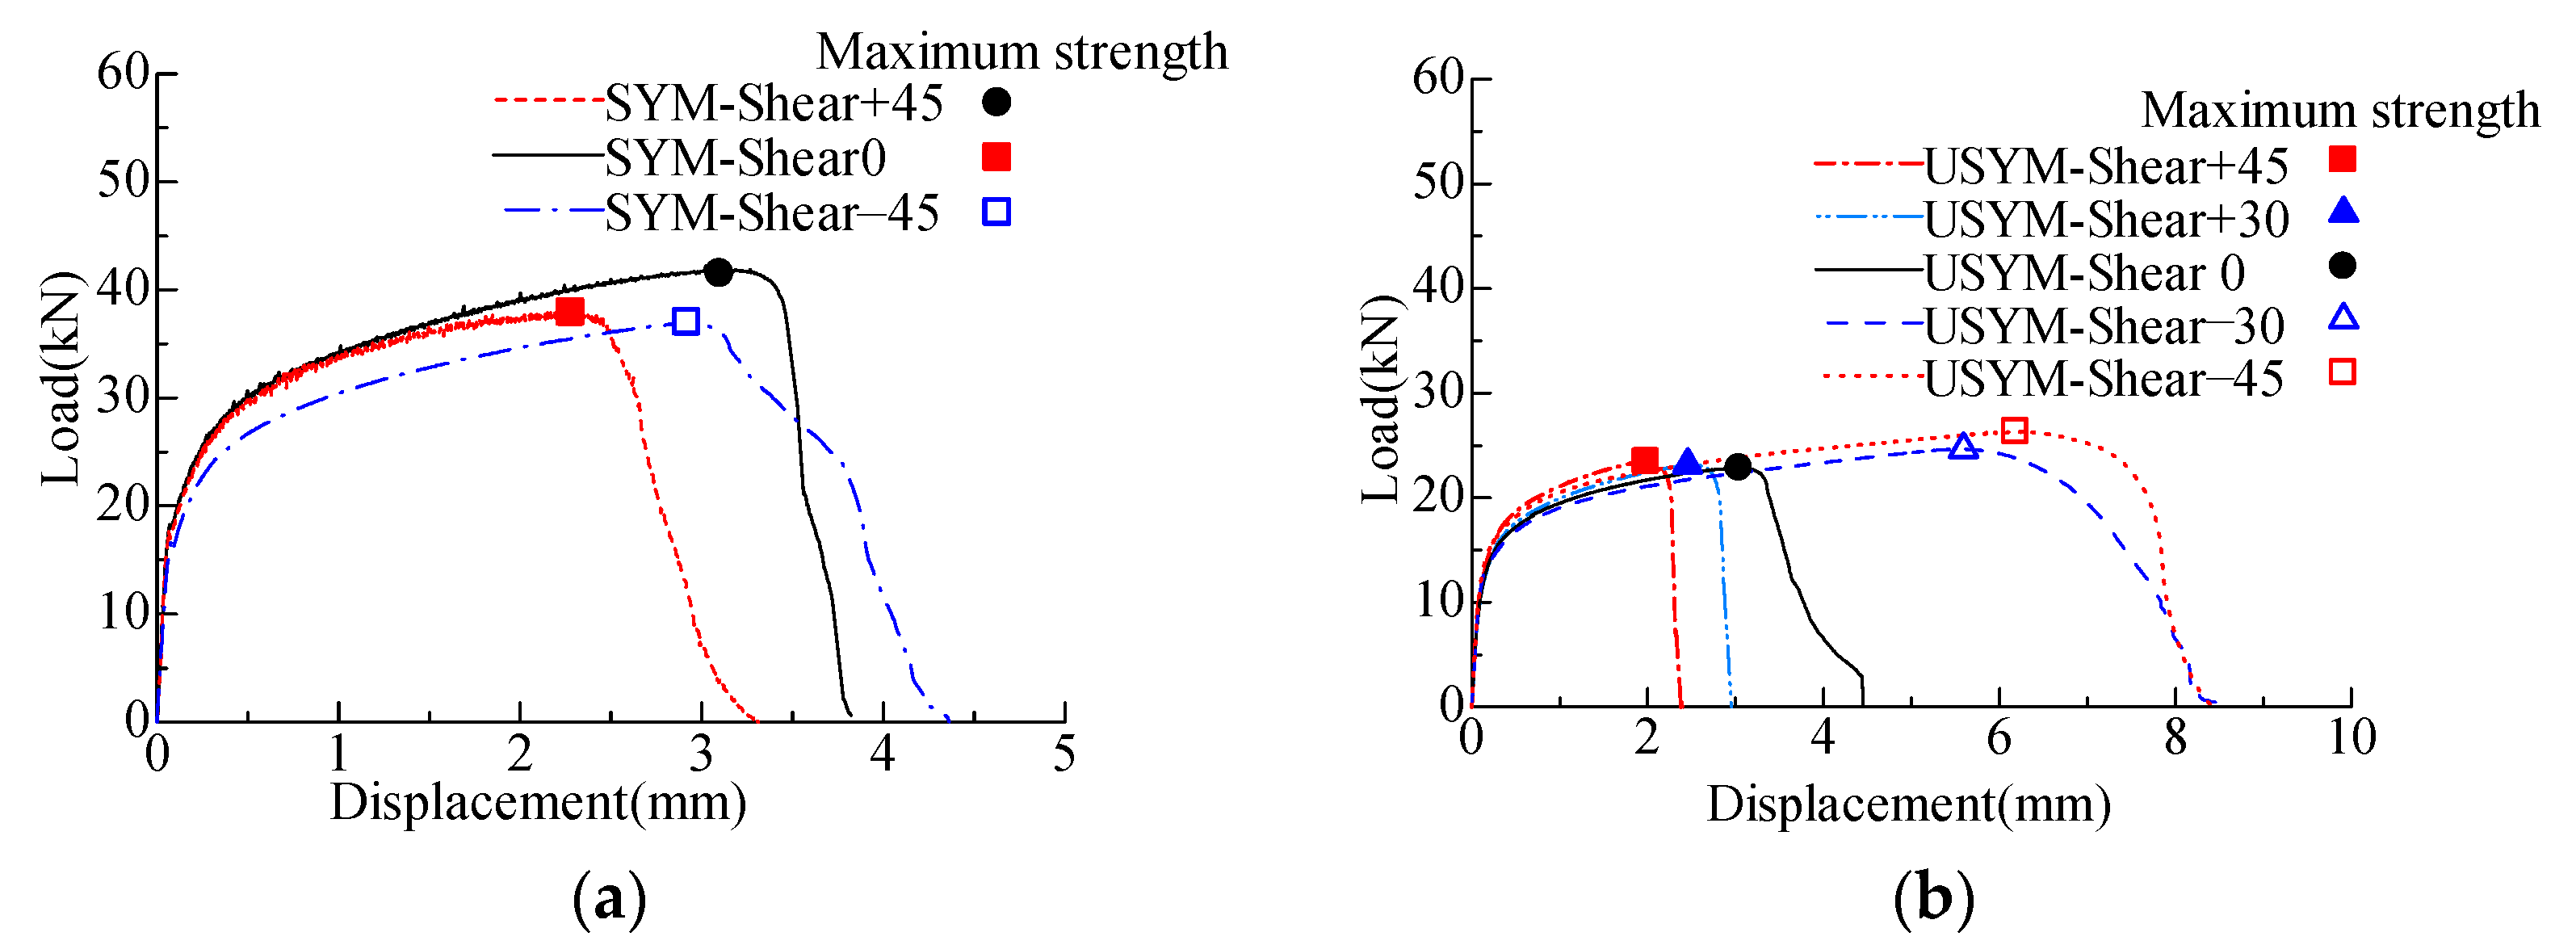
The load-displacement curves obtained from SYM-Shear specimens and USYM-Shear specimens composed of SM570 steel are shown in Figure 7a and Figure 7b, respectively. The mean values of the maximum load, the displacement corresponding to the maximum load δmax, and the displacement at failure δf are summarized in Table 2. Based on the SYM-Shear and USYM-Shear test results, δmax and δf increase gradually as the notch angle varies from 45° to −30°. In the specimens with positive notch angles (+15°, +30°, +45°), as the degree improves, the fracture direction becomes increasingly close to the tensile loading direction, and the fracture is prone to occur earlier. In the specimens with negative notch angles (−45°, −30°, −15°), compressive stress is dominant in the hotspot region. As the notch angle changes from −15° to −45°, the compressive stress becomes increasingly remarkable, resulting in large displacement values at failure. However, δmax and δf of the specimen with a −45° notch angle are smaller than those of the specimen with a notch angle of −30°. It can be concluded that the strength of SM570 steel is remarkably reduced due to the transition of the shear band from the combined shear-compression stress state to the combined shear-tension stress state, resulting in the earlier occurrence of fracture.
A comparison of the results between SYM-Shear and USYM-Shear specimens reveals that the average value of the maximum load of SYM-Shear specimens is 47 kN, twice the average value for USYM-Shear specimens, i.e., 22 kN. Similarly, δf of SYM-Shear specimens is approximately 1.5 times that of USYM-Shear specimens with the same notch angle. Moreover, it is found that the USYM-Shear specimen is broken immediately after reaching the maximum load. The SYM-Shear specimen can be fractured at two locations (near the notches), while the USYM-Shear specimen breaks at only one location. Therefore, SYM-Shear specimens show larger values of δf and higher load-bearing capacity than USYM-Shear specimens.
The authors have already investigated the fracture behavior of SM490 (one type of conventional normal-strength structural steel) in the previous study [14]. Specimens adopted for investigating the fracture behavior of SM490 steel have the same configuration as in this study. For comparison, the load-displacement curves of SM490 are given in Figure 8. The values of δmax and δf of specimens composed of SM490 increase as the notch angle changes from +45° to −45°. It is concluded that different types of structural steel show little influence on the fracture behavior of the specimens, although the yield stress, elongation, and chemical composition are different. In addition, comparing the δmax of the specimens composed of SM570 and SM490 steel with the same notch angle, it can be found that the δmax of the conventional steel SM490 specimen is approximately equal to twice the δmax of the SM570 steel specimen. For example, δmax of SYM-Shear+45° specimen composed of SM570 is 1.24 mm, while that of the specimen composed of SM490 is 2.3 mm. Similarly, the δmax of the USYM-Shear+45° specimen is 1.12 mm for the SM570 steel and 2 mm for the SM490 steel. It can be attributed to the fact that the plastic deformation capacity of high-strength steel is relatively small, leading to the strain concentration at the notch and the early occurrence of fracture. As to the displacement at failure δf, the same conclusions can be reached.

3.2. Fracture Failure and Failure Surface

Figure 9 shows a comparison of a failure photograph for specimens composed of SM570 and SM490. The deformation is limited to the central area of the specimens, i.e., the designed shear band. As demonstrated in Figure 9, all specimens were fractured under the combined tensile and shear stresses. The fractured part of the SYM-Shear specimens composed of SM490 steel was stretched along the loading direction, and the necking effect caused by the tensile stress was observed in the fractured part of the USYM-Shear specimens. Compared with SM490 specimens, the phenomena are not obvious in the shear specimens composed of SM570 steel. Therefore, it can be known that under low-stress triaxiality, the specimens with high-yield stress exhibit small elongation and are prone to fracture failure, while SM490 will undergo ductile fracture failure, accompanied by a large plastic deformation.
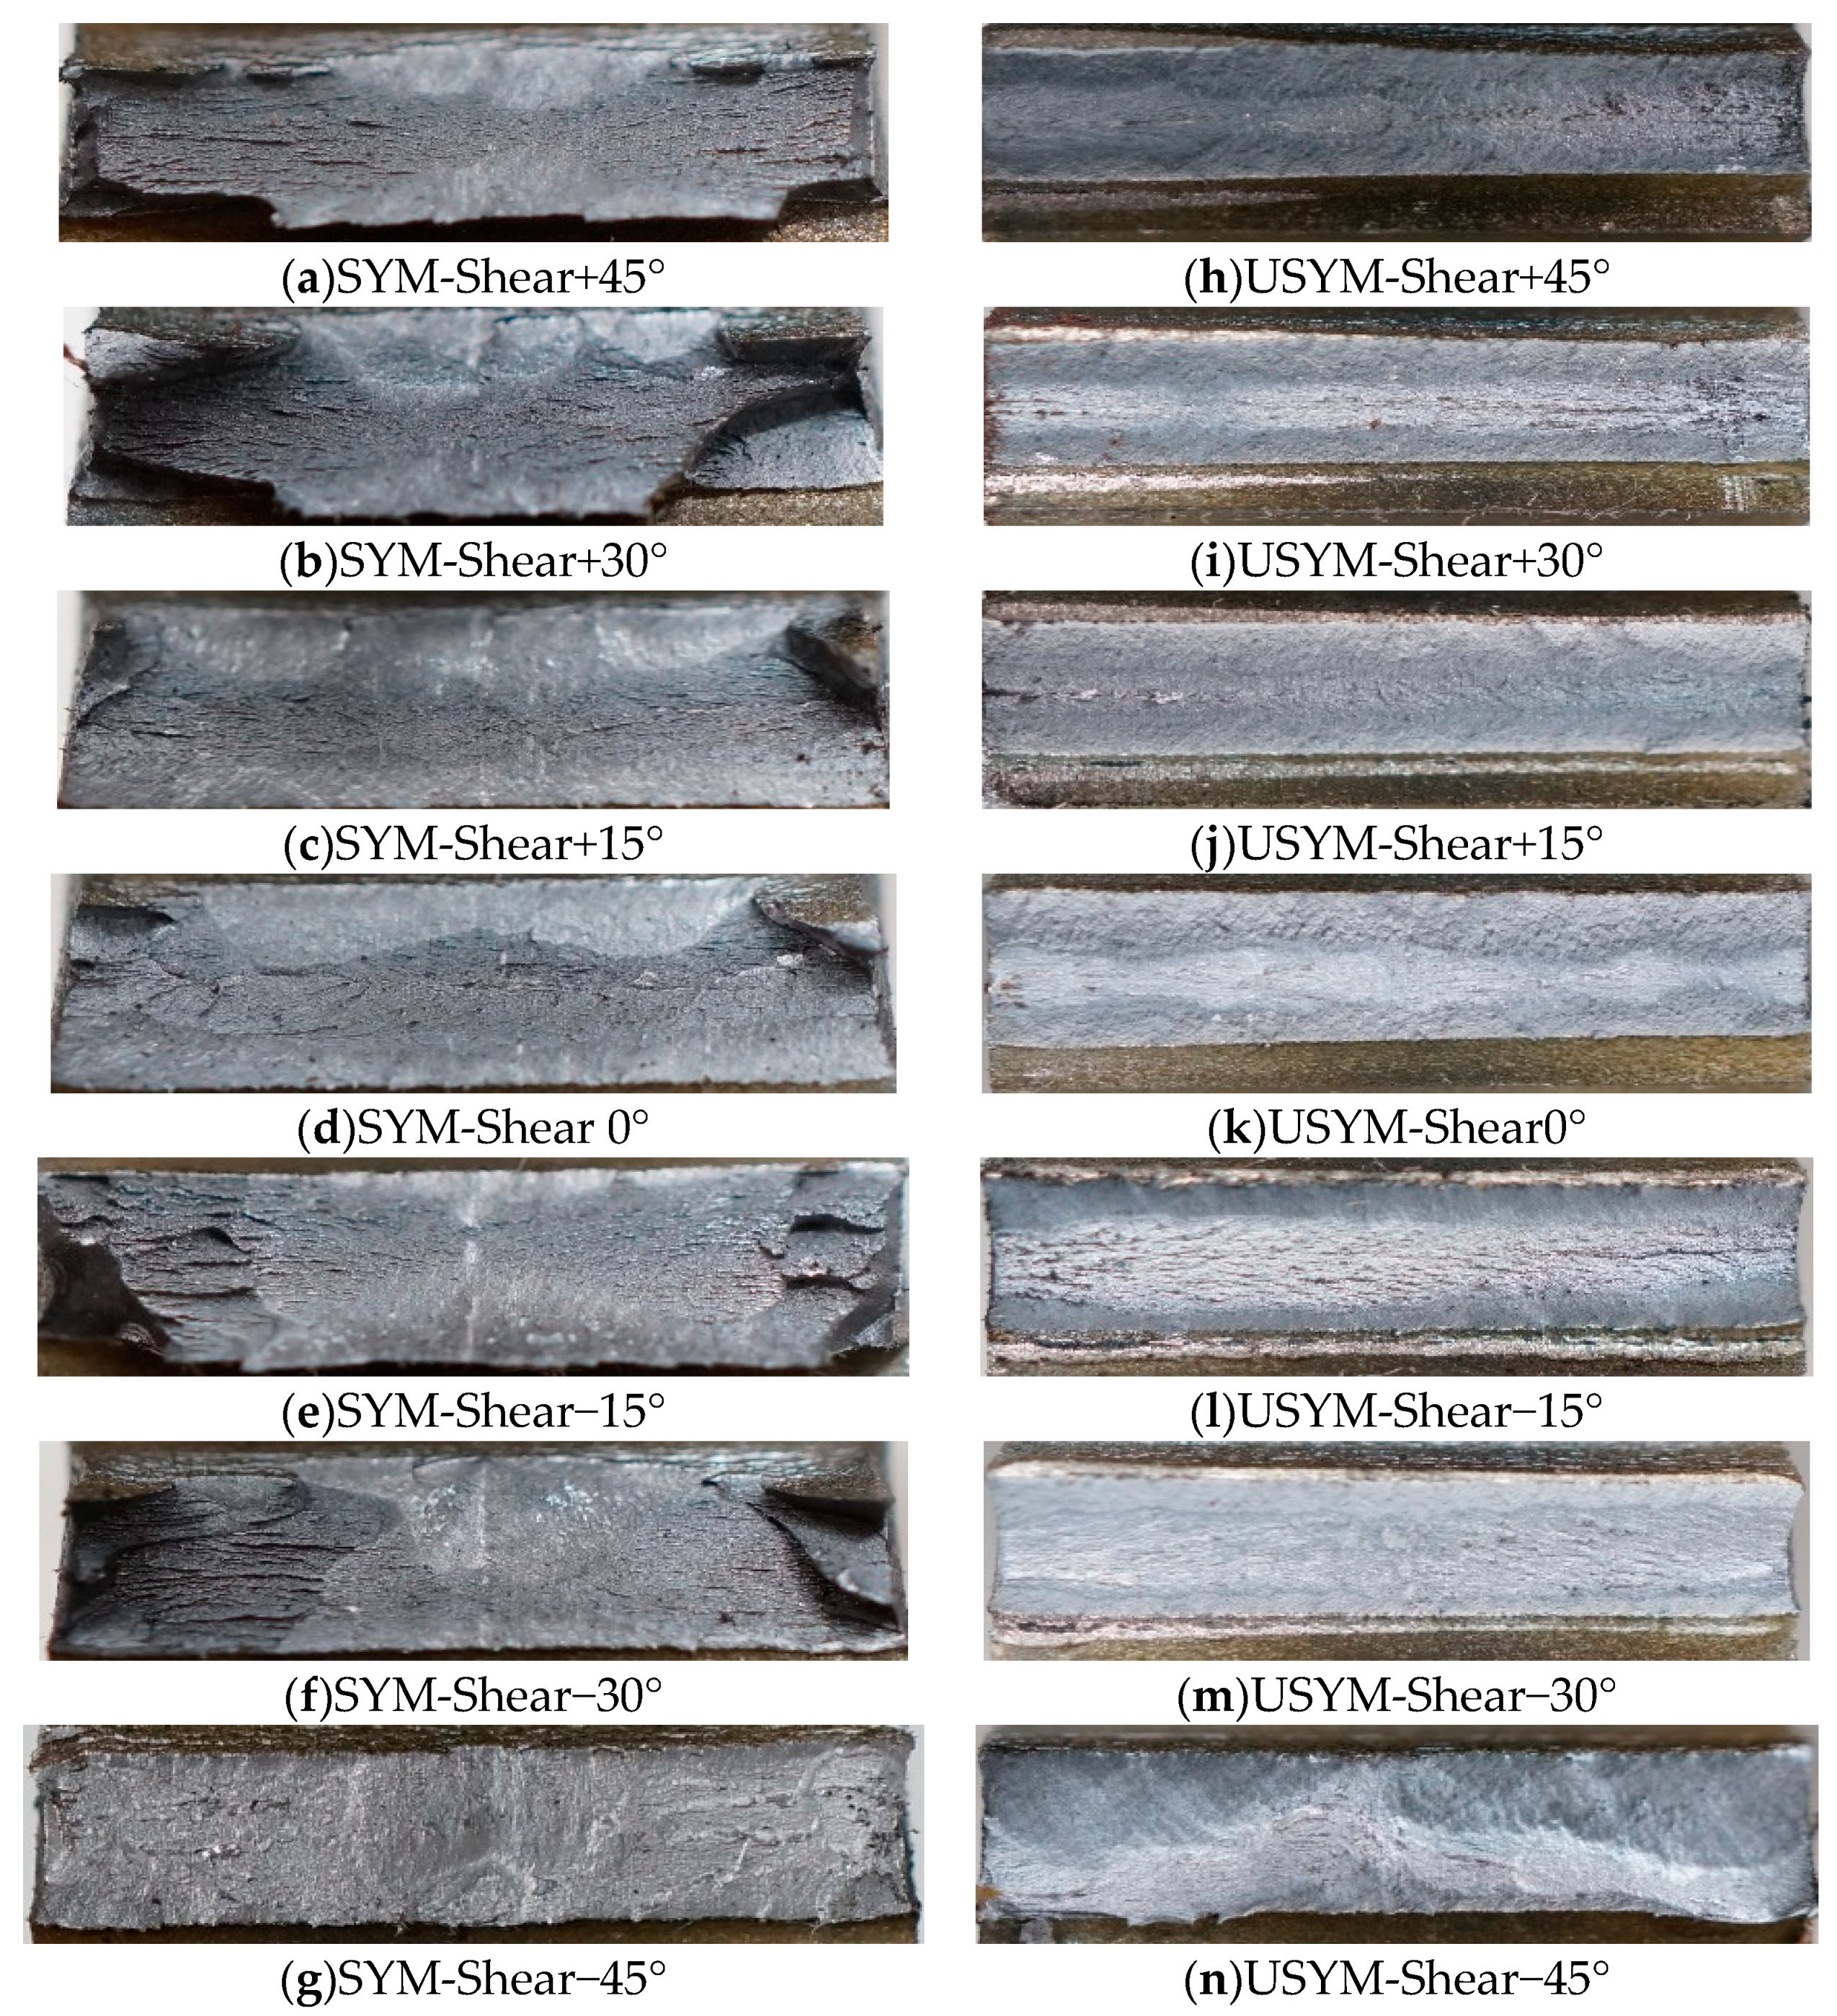
Figure 10 shows the failure surface of the SM570 specimens. Due to the small cross-sectional area at the fracture location, the fracture failure occurs soon after the crack initiates. As a result, the process of crack propagation of these specimens cannot be recorded in detail. In addition, “mountain shape” or “stripes”, representing the necking effect, do not appear on the failure surface, indicating that the fracture failure occurs immediately after the crack initiation. Uneven failure surfaces can be observed in the SYM-Shear specimens. The +45° specimen shows the evenest failure surface. In other words, the effect of shear stress during the fracture process in a +45° specimen is relatively limited, compared with that of a specimen with other notch angles. In the USYM-Shear specimens, except for the specimen with a notch angle of −45°, the failure surface is symmetrical at the moving end and the fixed end, and a fibrous shape is observed in the central part of the failure surface. It proves the fact that the tiny voids in the steel are combined due to the sliding deformation, and that the USYM-Shear specimen behaves from crack propagation to shear failure. The failure surface of the USYM-Shear−45° specimen is severely uneven due to the significant influence of shear stress. In addition, compared with SYM-Shear specimens, USYM-Shear specimens showed a less uneven failure surface with brittle fracture failure. In the previous study [19], the authors investigated the effect of chemical composition on the fracture behavior of high-strength steels. In the future, scanning electron microscopy (SEM) will be utilized to analyze the effect of chemical composition on the fracture surface.

4. Numerical Model for Fracture Behavior

4.1. FE Model

The commercial software ABAQUS was adopted to conduct the numerical simulation in this study. Since the fracture failure of SM570 occurs immediately after the crack initiation, the explicit solver can provide fine resolution solutions for this problem at a relatively low cost. Therefore, the explicit solver was chosen in this study. The FE models of the SYM-Shear specimen and USYM-Shear specimen are given in Figure 11a,b, respectively. The solid reduced integration element C3D8R was employed. According to the sensitivity analysis in the previous study [15], the FE models were meshed as shown in Figure 11. That is, a finer mesh size of 0.1 × 0.1 × 1.2 mm, respectively, corresponding to x, y, and z directions, was adopted in the hotspot region, while coarser meshes were applied to the parts under a uniaxial tensile stress state. Since the non-dependency of mesh size in the thickness direction was verified in the previous study [35], the FE model is meshed into 10 elements in the thickness direction (z direction) in this study. The boundary condition is that the right end of the specimen is fixed, and the left end is stretched with a total displacement of 20 mm. The rate of numerical analysis is assigned as 0.05 mm/s.

4.2. Material Model

The Poisson’s ratio of the material used for numerical analysis was selected according to Table 1. The true stress-true strain relationship of the material under monotonic tensile loading is necessary for the numerical simulation. Before the necking point, the true stress σ true and true strain ε true can be expressed using the experimentally obtained engineering stress σ eng and strain ε eng as the following equations [36]:
ε true = ln ( ε eng + 1 )
σ true = σ eng ( ε eng + 1 )
where the engineering strain ε eng = Δ l / l 0 , l 0 and Δ l are the initial length and the length increment, respectively; the engineering stress σ eng = N / A 0 , N is the applied force and A 0 is the initial cross-sectional area. After necking initiates, the necking zone is governed by a non-uniform and triaxial stress state, and the above formulas are no longer applicable for the determination of true stress and strain in the post-necking region. Although some empirical methods, such as the weighted average method [36] and the modified weighted average method [37], have shown their effectiveness for the true stress-true strain relationship of specific steel types, these methods will overestimate the loading capacity of the SM570 steel after necking [38].
To more accurately predict the load-displacement curve of the SM570 steel after necking, the power law tangent (PLT) method was employed to describe the true stress-equivalent plastic strain relationship in the post-necking region [38]. The PLT method is derived based on the assumption that the hardening modulus decreases exponentially. That is:
d σ d ε = σ neck [ 1 ( ε ε neck ) n ]
where σ neck and ε neck are the stress and strain at the necking point, respectively; the material parameter n represents the decrease rate of hardening modulus, and is identified by the material tension test. Then, the true stress before and after the necking point can be defined as follows [36,38]:
σ = { σ neck ( ε ε neck ) ε neck σ neck ( 1 + ε ε neck ) σ neck 1 + n ( ε ε neck ) n + 1 ( ε ε neck ) ( ε > ε neck )
For the SM570 steel used in this study, the stress σ neck and strain ε n e c k at the necking point were 753 MPa and 0.115, respectively. As mentioned above, the material parameter n represents the decrease rate of hardening modulus beyond necking. According to the tensile test data, the material parameter n of SM570 is identified and equals 0.40.
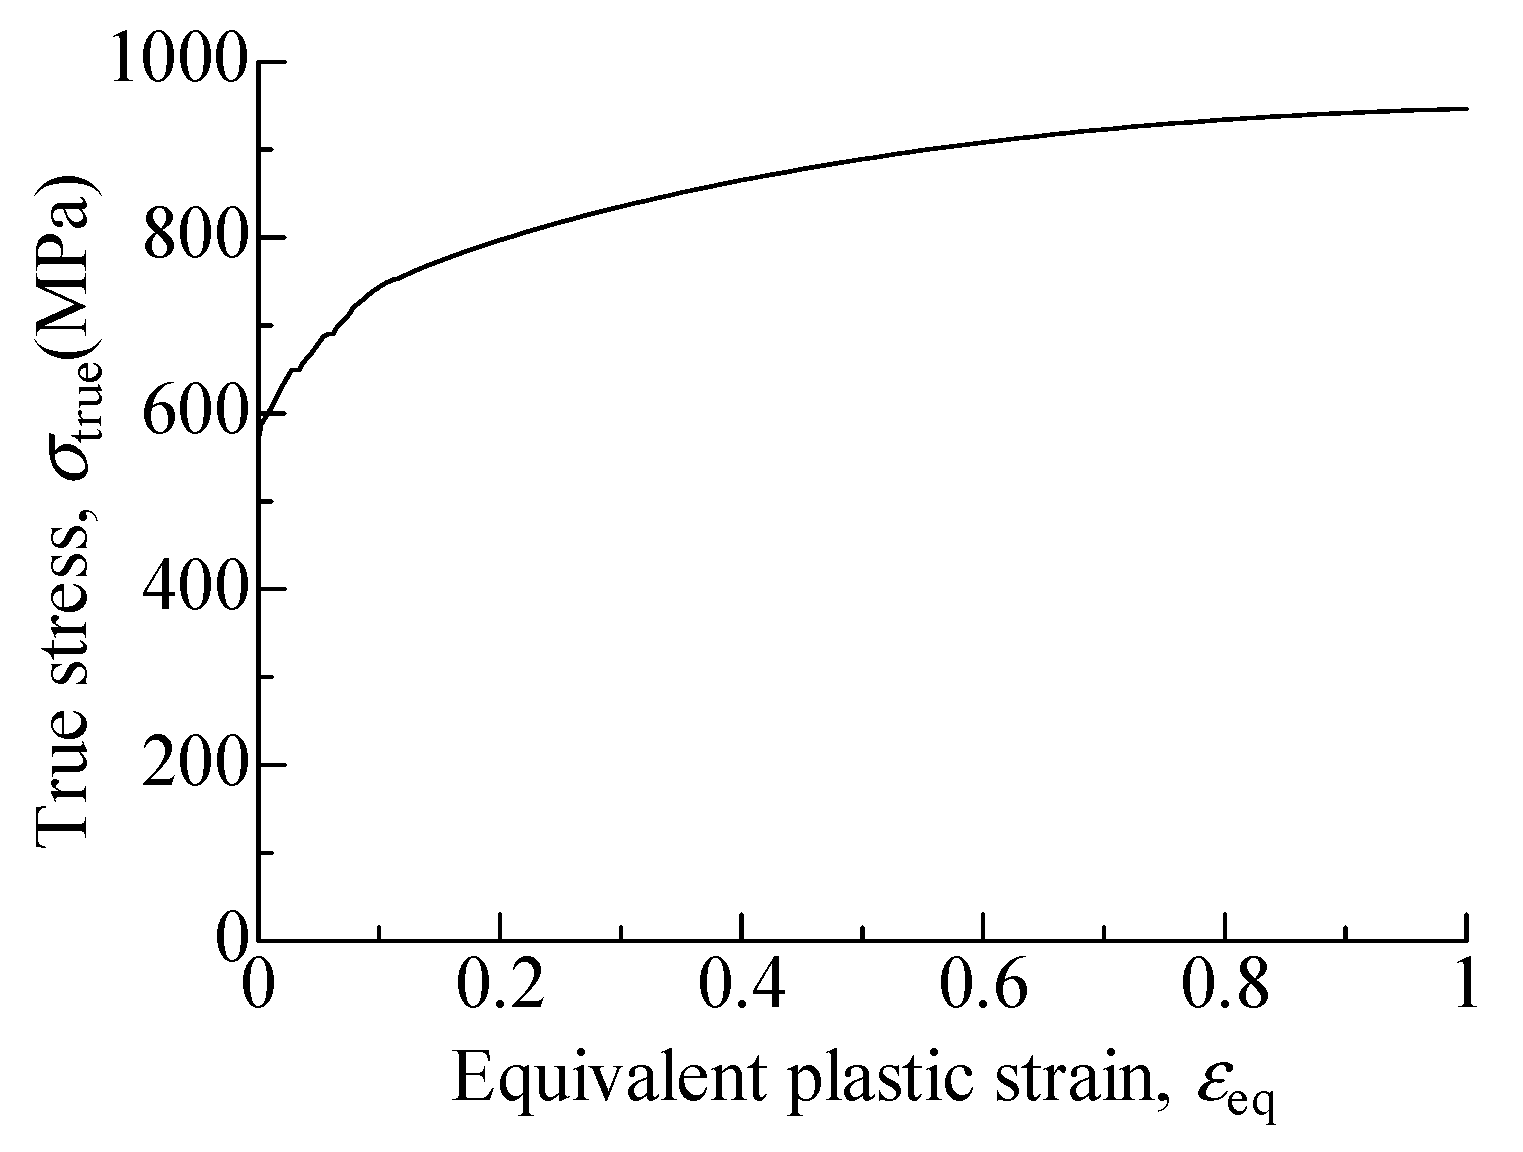
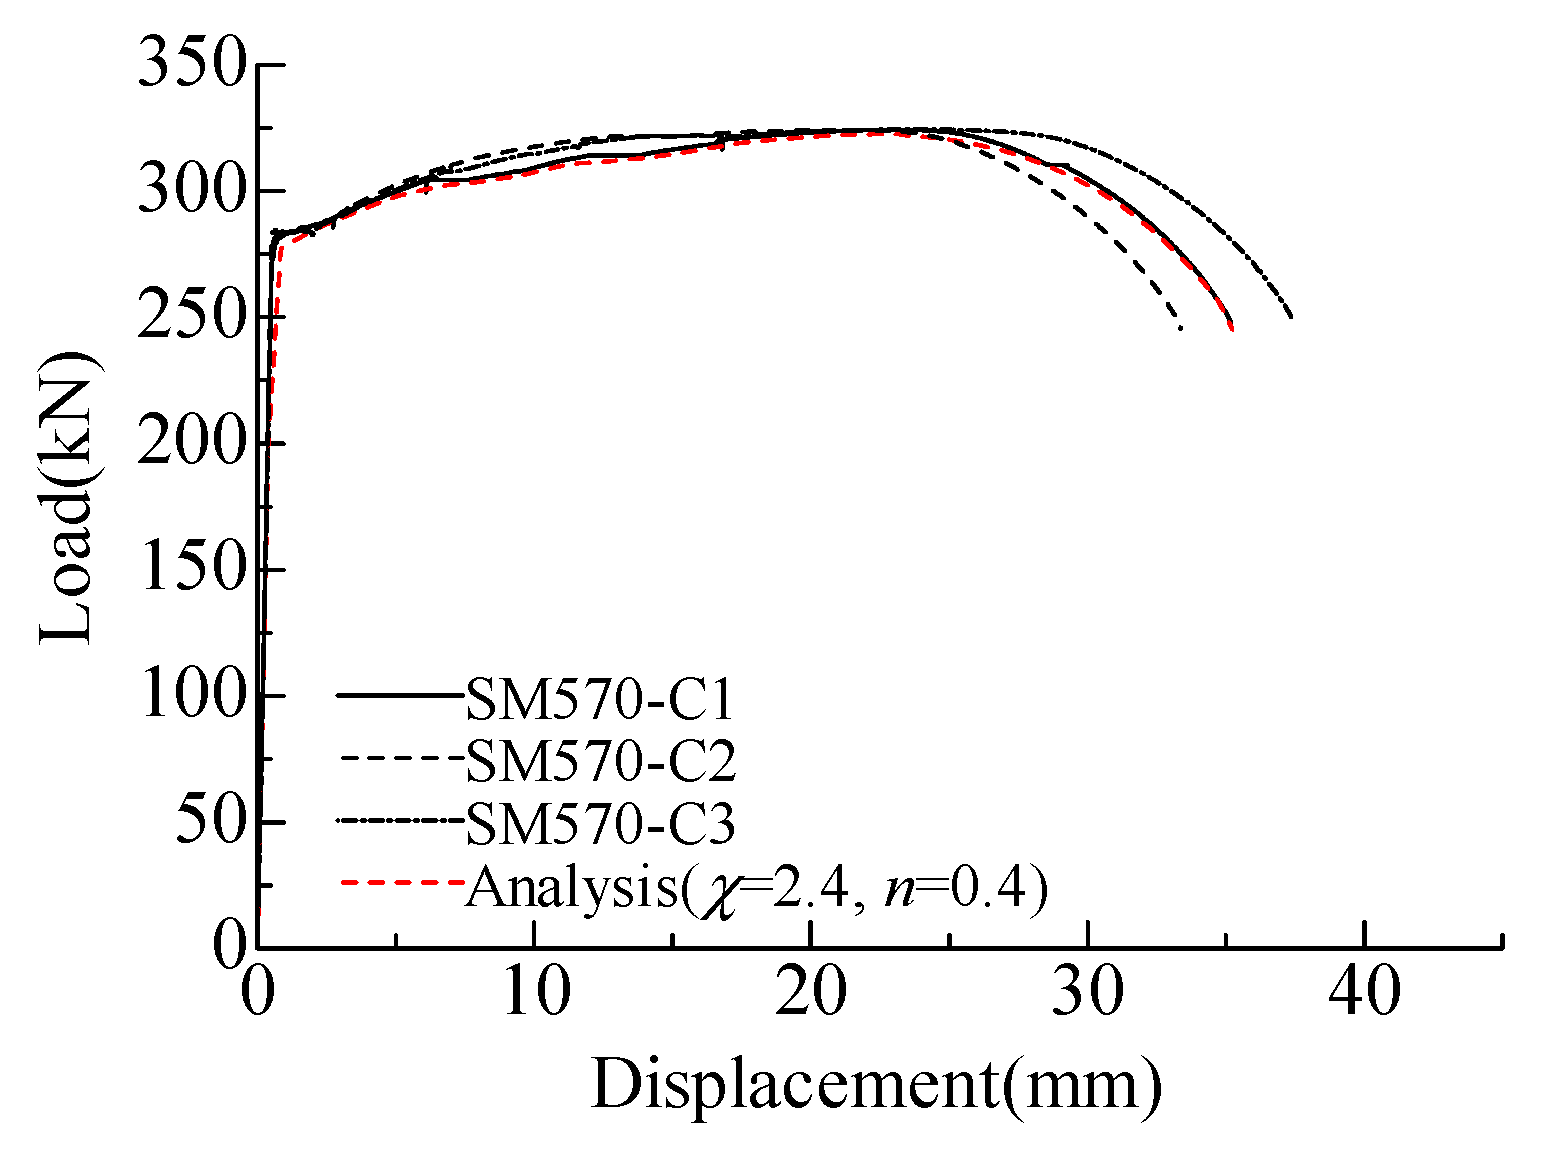
The true stress-equivalent plastic strain curve obtained by the PLT method is shown in Figure 12. The load-displacement curve of the numerical simulation using the true stress-equivalent plastic strain data is compared with that of the test in Figure 13. The numerical result is in good agreement with the test results, and the loads are well predicted even in the necking region. Therefore, it is rational to use the PLT method to predict the behavior of the SM570 steel before fracture failure. It should be noted that the parameter χ was taken as 2.4 in this analysis, and it will be described later.

5. Ductile Fracture Model and Simulation Results

5.1. Applicability of the Existing Fracture Models

Up to present, some ductile fracture models have been proposed for specific materials [8,9,10,11,13,14,20,21,22,23,24,25,26,27,28,29,30,31,32,33]. Rice and Tracey [10] have developed a ductile fracture model applicable either to hardening or non-hardening materials by relating the growth of spherical voids with the stress triaxiality and employing a Rayleigh–Ritz procedure for solutions. Based on the observation and results of tension tests using plates and round bars, Hancock and Machenzie [39] and Johnson and Cook [40] have proposed an empirical model-VG model (abbreviation of the void growth model). In addition, the authors developed an improved ductile fracture model (New-VG model, hereinafter abbreviated as N-VG model) to evaluate the fracture behavior of the ordinary steel SM490 considering the effect of high-stress triaxiality [14]. The development of the N-VG model is based on experimental and analytical studies of a specific specimen under tensile loading, which is designed to fail under a combination of tensile and shear stresses. To simulate the fracture locus more accurately, parameters, such as stress triaxiality, Lode angle, and equivalent plastic strain, need to be considered in the fracture model. In a previous study [15], the authors further proposed an asymmetric 3D model which considers the effect of Lode angle in addition to stress triaxiality. The applicability of the asymmetric 3D fracture model is verified by comparing the experimental results with the numerical results.
The present study also aims to validate the applicability of the previously proposed models, the N-VG model and the asymmetric 3D model for high-strength steel. As an example, Figure 14 presents the experimental and numerical results of USYM-Shear0 specimens and SYM-Shear+15° specimens. Compared with the test results, the N-VG model overestimates the maximum load and the corresponding displacements. Therefore, it is considered that the N-VG model cannot be applied to the high-strength steel SM570. On the other hand, the asymmetric 3D model can provide better simulation results, however, it is difficult to be widely used in practice because more tests are required for the identification of the four parameters of this model [15].

5.2. Modified N-VG Model and Simulation Results

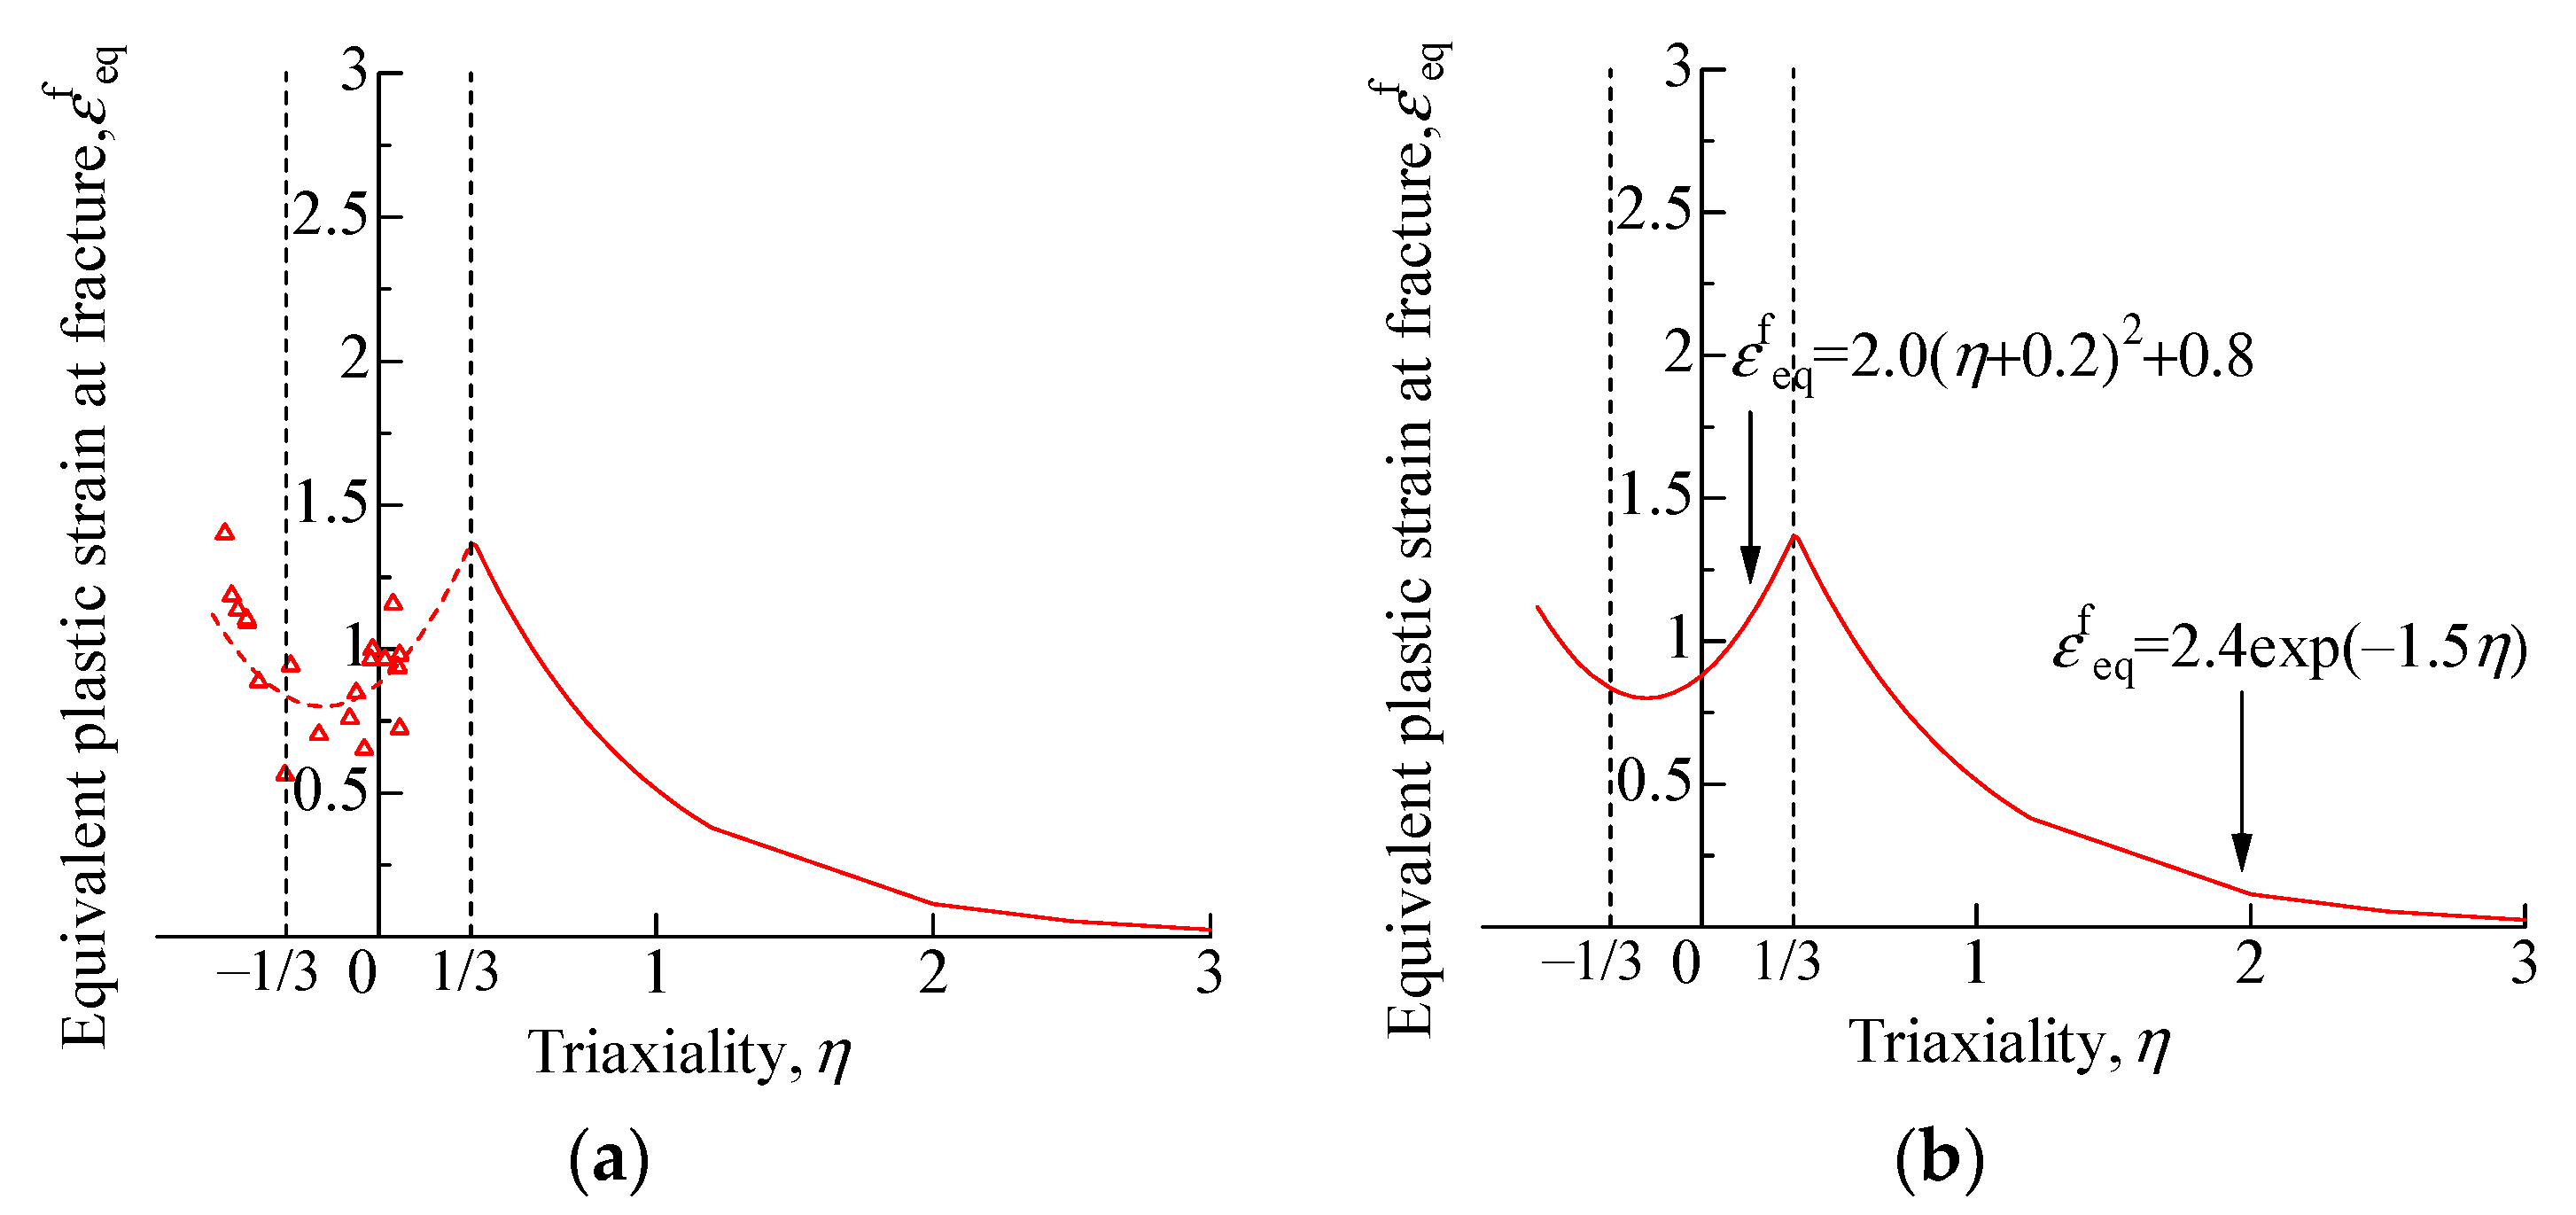
Since the N-VG model can be performed more efficiently than the asymmetric 3D model, a modified N-VG model is proposed in this paper to simulate the fracture behavior of high-strength steels. Firstly, non-fracture analysis (namely common elasto-plastic analysis without considering the fracture phenomenon) was performed on the FE models shown in Figure 11. The stress triaxiality and equivalent plastic strain at the maximum load obtained from the non-fracture analysis are summarized in Table 3. The specimens are all under negative or low-stress triaxialities. It is well known that the ductile fracture criterion of VG model proposed by Rice and Tracey is only valid in the range of the stress triaxiality greater than 1/3. For the fracture criterion in the negative and low-stress triaxiality range from −0.6 to 1/3, a quadratic polynomial regression equation is developed as shown in Figure 15. Then, the fracture criterion of the modified N-VG model is expressed as follows:
ε eq f ( η ) = { a ( η + 0.2 ) 2 + b ( 0.6 η 1 / 3 ) χ exp ( 1.5 η ) ( η > 1 / 3 )
where a = 2.0 and b = 0.8 are determined by non-fracture analysis; χ is identified as 2.4 by the material test.
As mentioned above, strain is concentrated in the shear band of the specimens composed of SM570, and fracture failure occurs instantly after the crack. Therefore, as in the previous study [14,15], the softening stage is not considered. Then, the analysis with the equivalent plastic strain at material failure ε e q f equal 0 is performed. That is, when the equivalent plastic displacement of an element reaches the value of u e q f = L e × ε e q f , the equivalent plastic displacement at element failure, the element is fully damaged and then deleted. L e is the length of each element of the FE model.
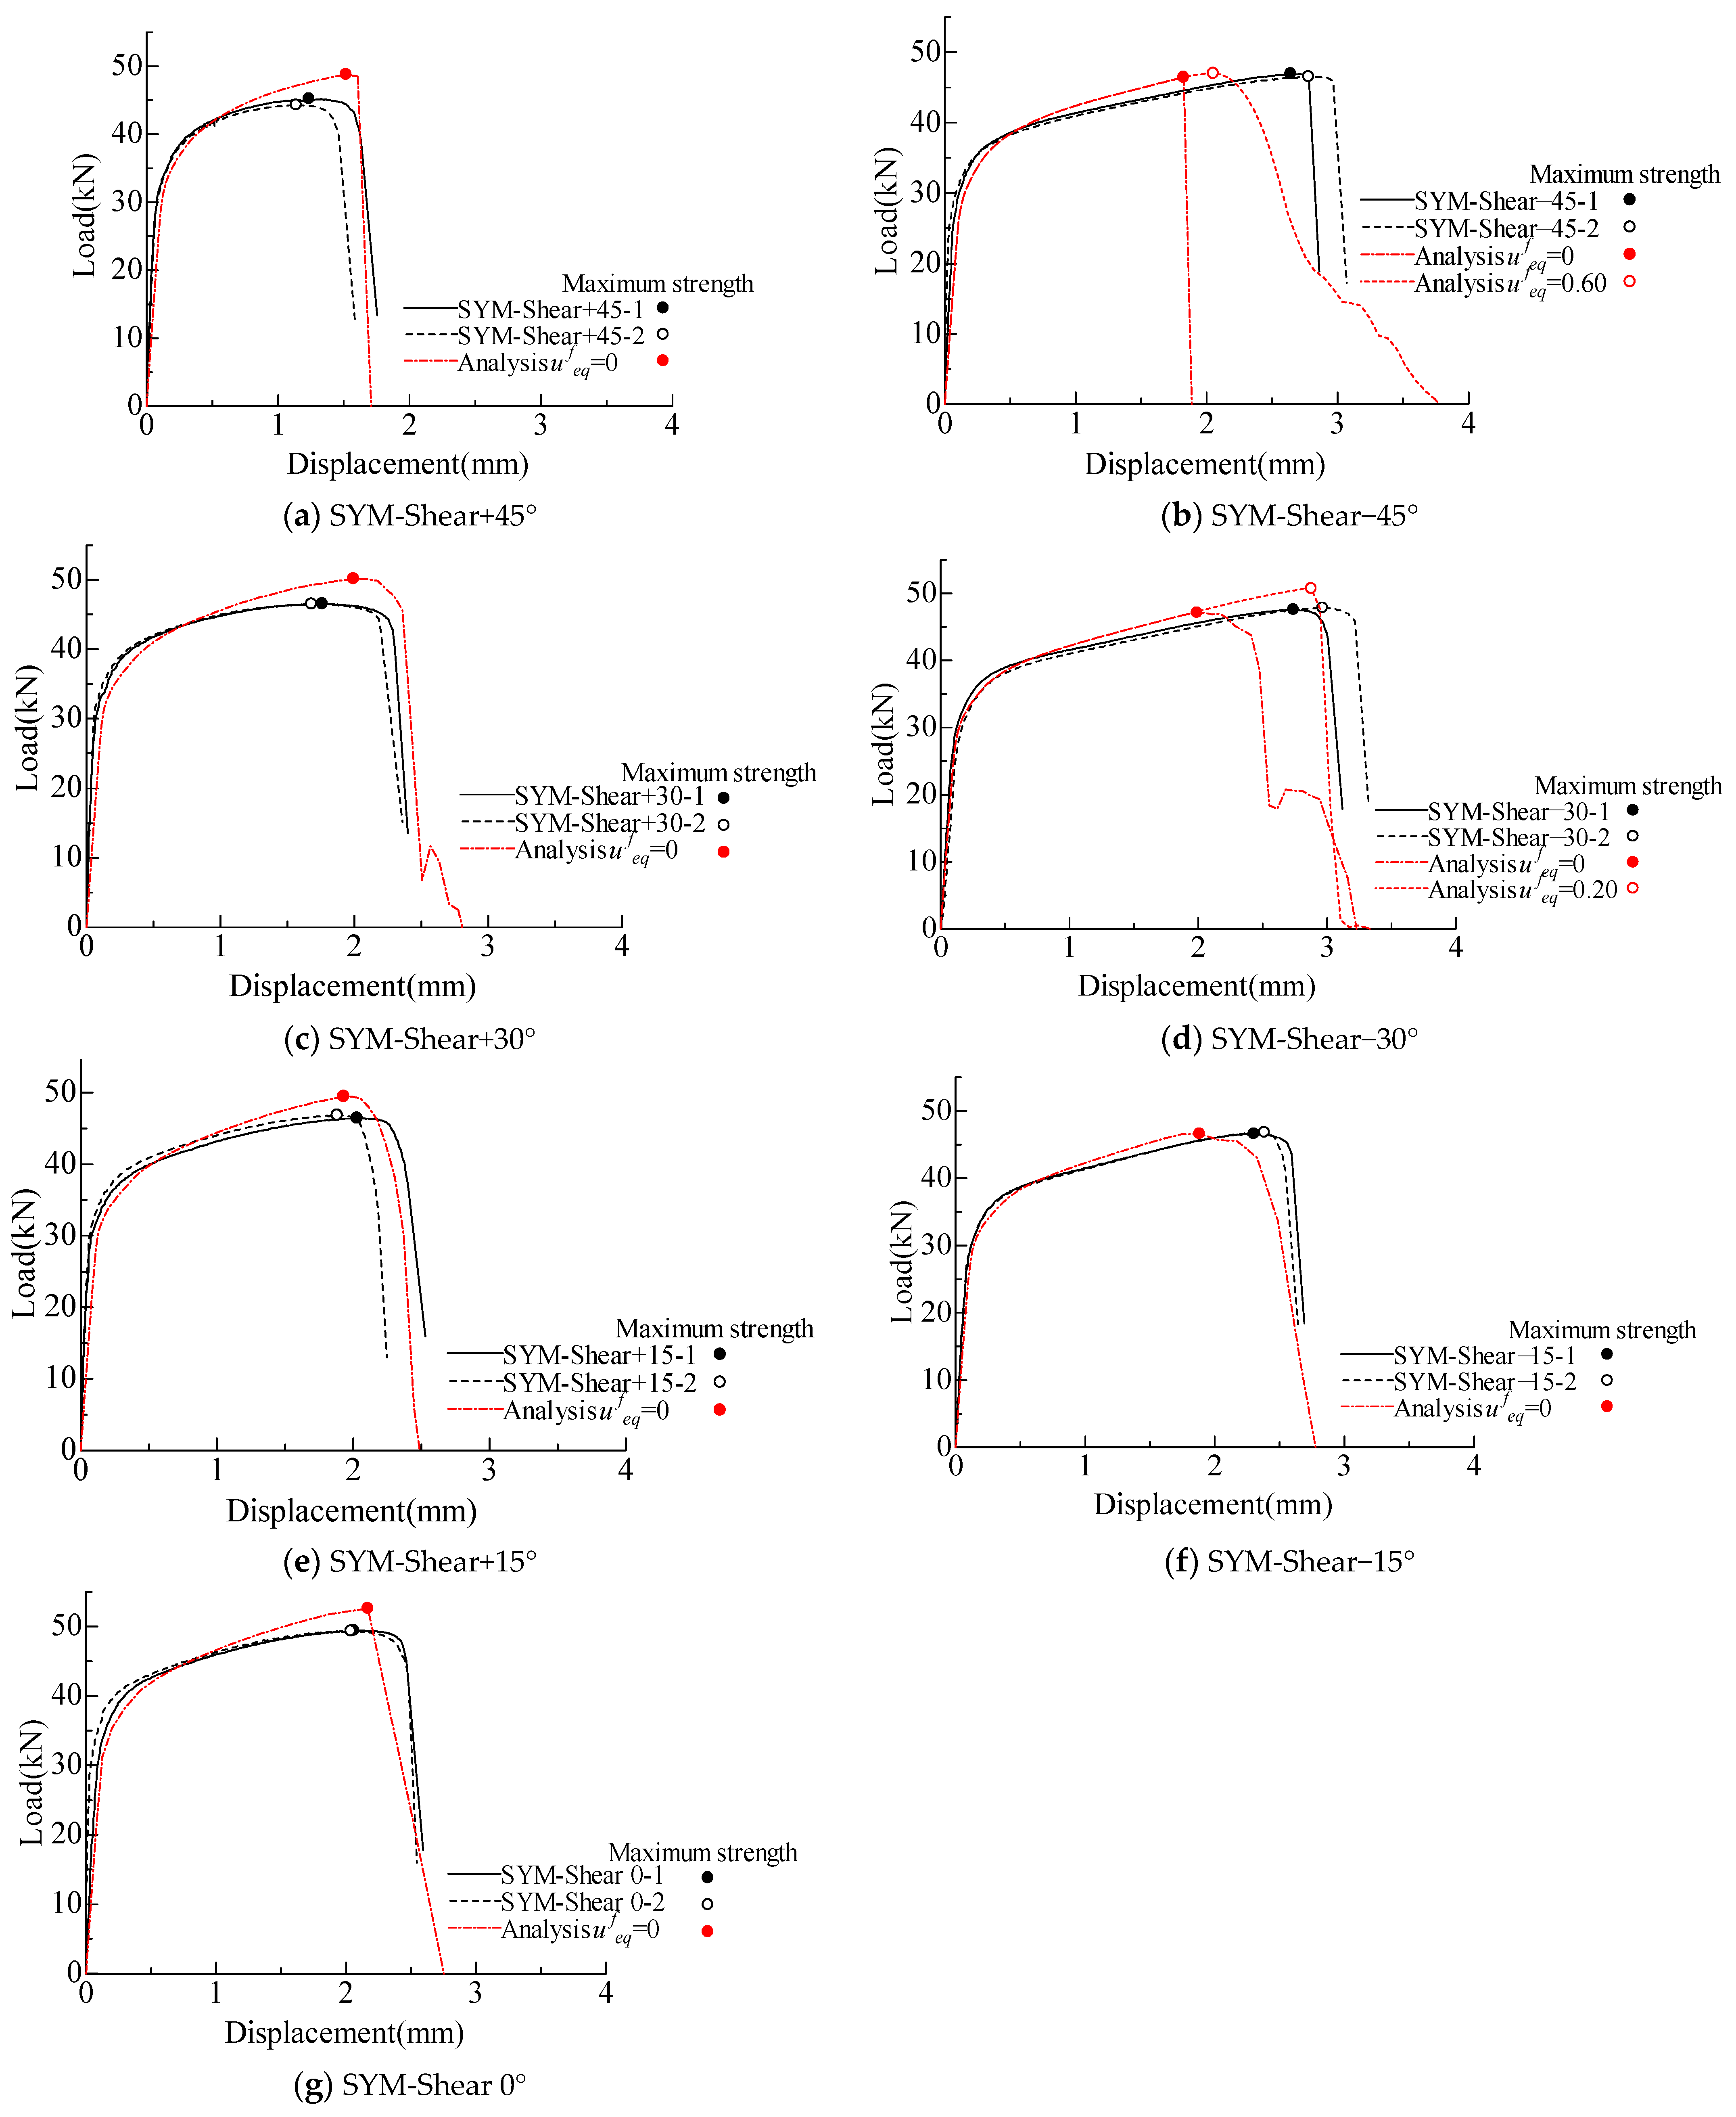
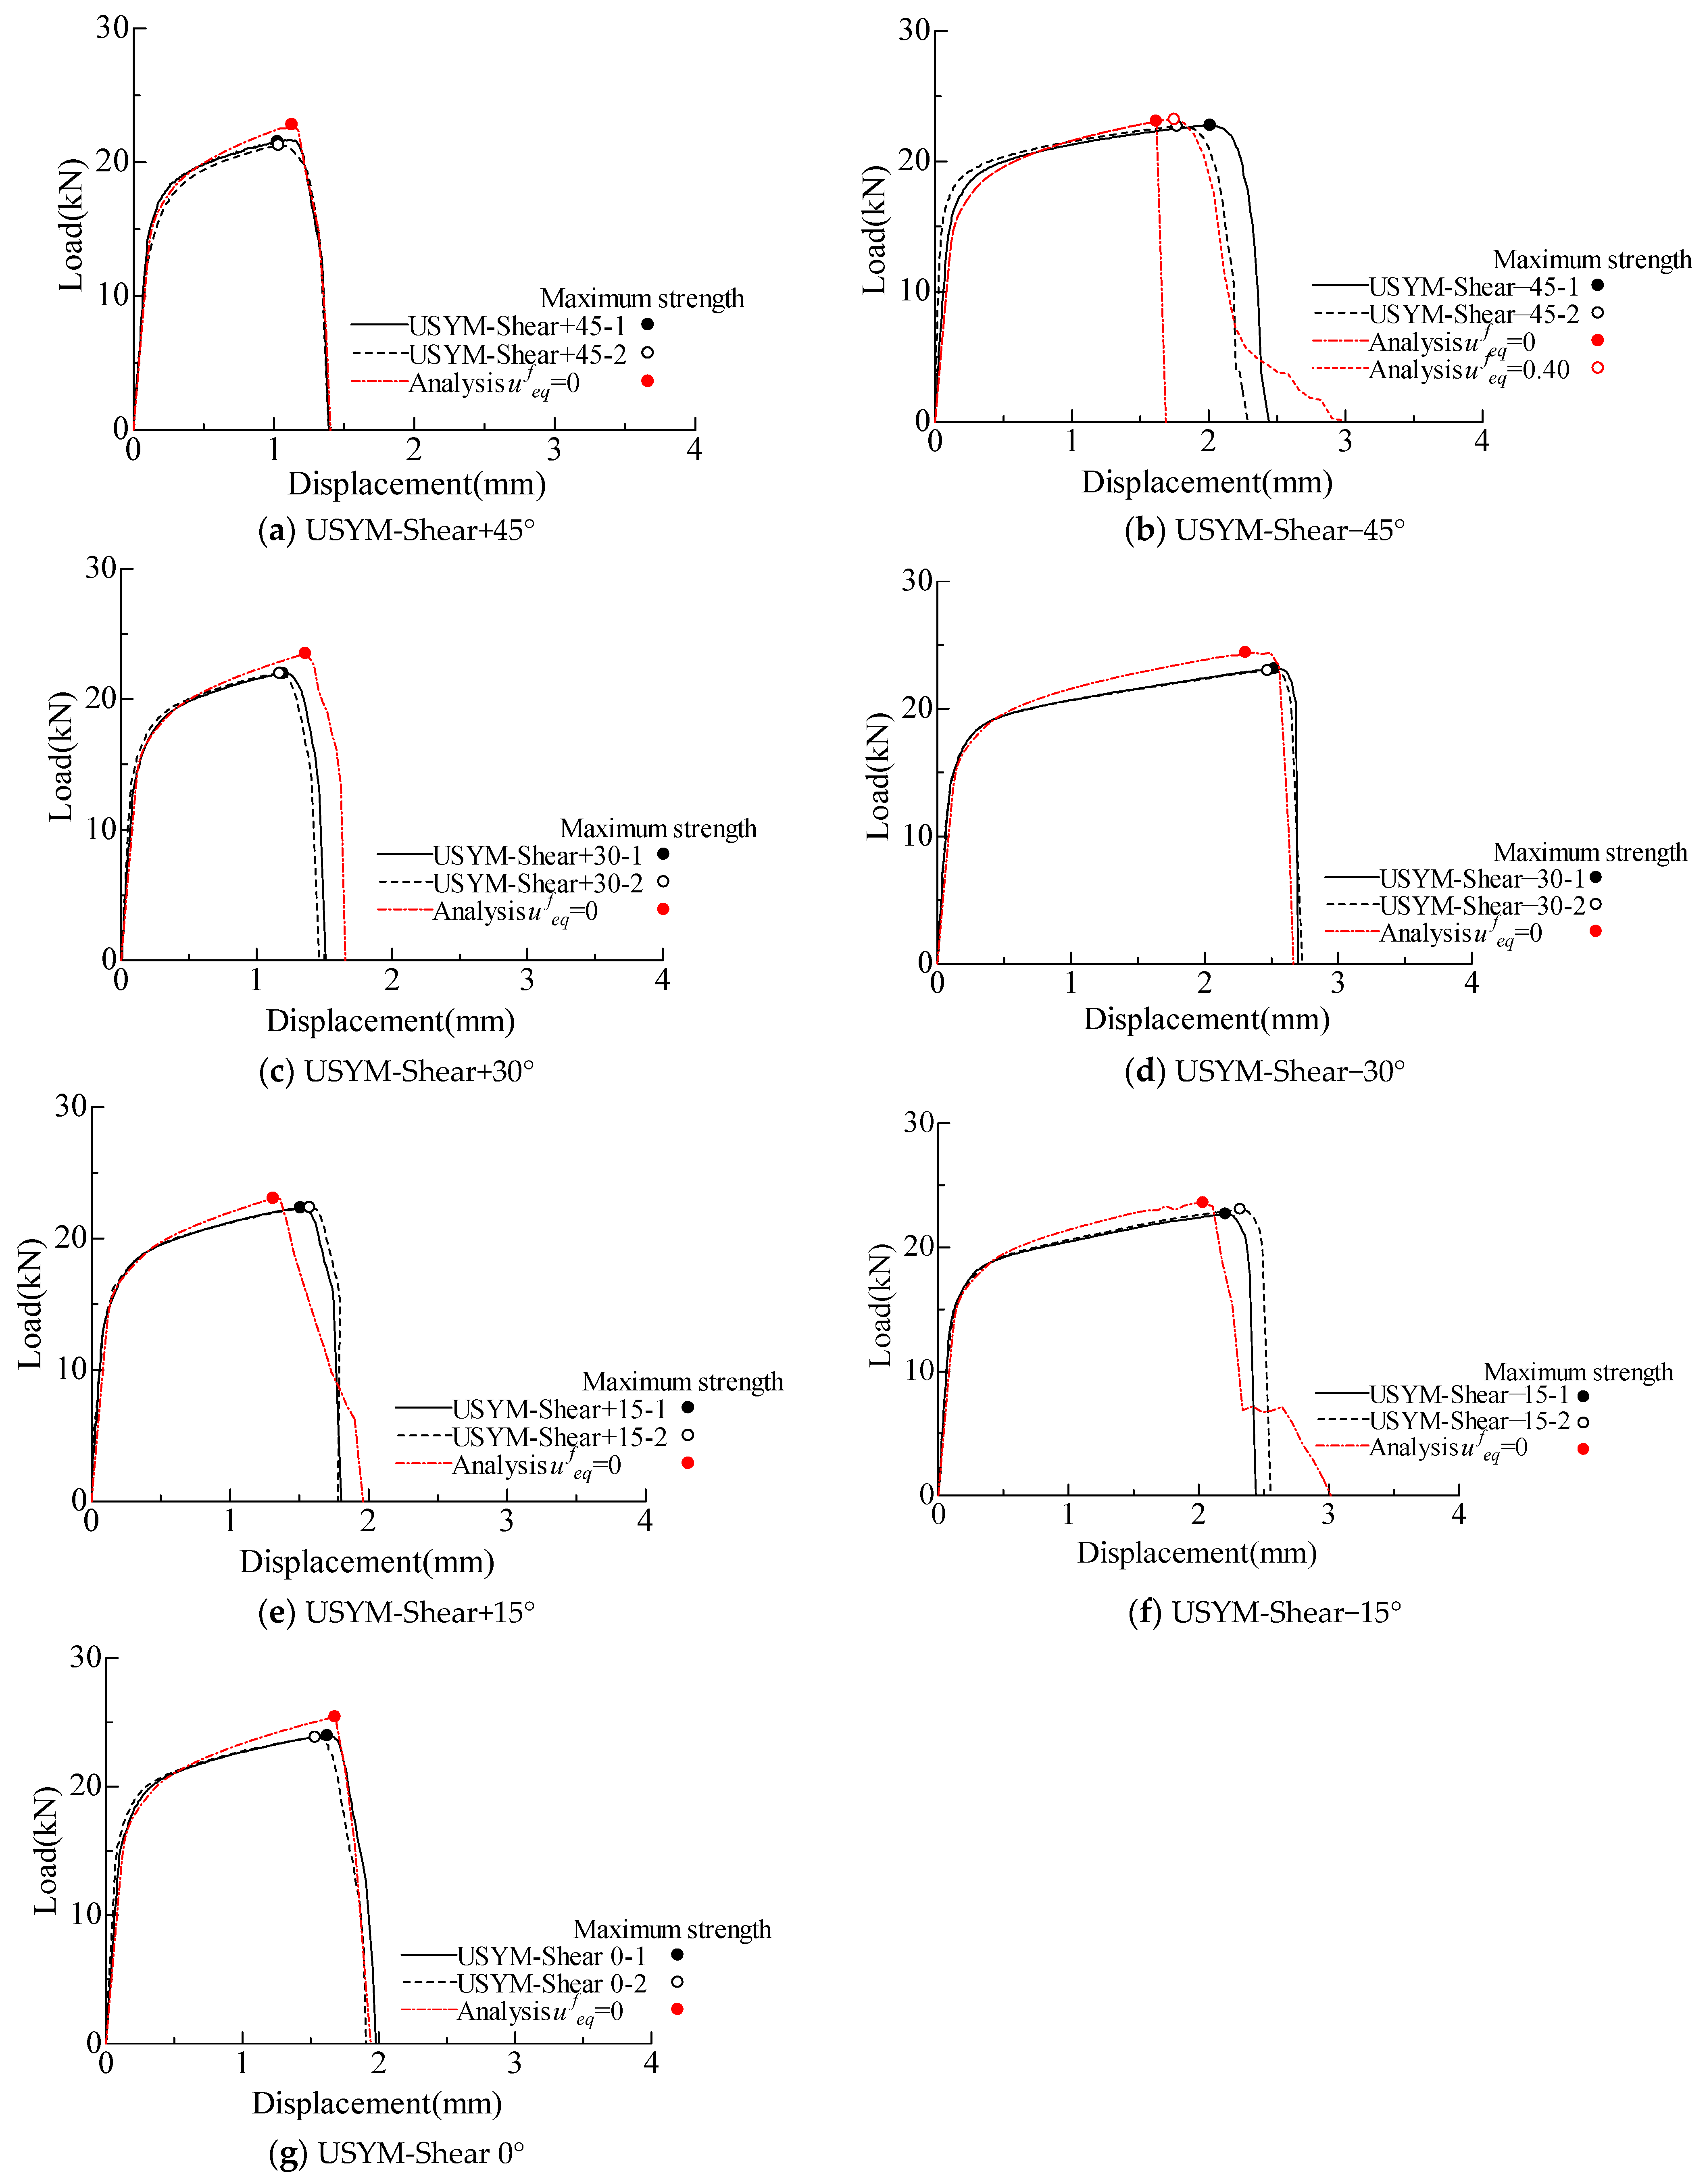
The load-displacement curves of SYM-Shear specimens and USYM-Shear specimens obtained from test and analysis are presented in Figure 16 and Figure 17, respectively. In addition, the maximum load, Pmax, and the displacement corresponding to the maximum load, δmax, are summarized in Table 4. Errors of Pmax and δmax, which are compared with the test results in Table 2 are also given in Table 4.
It can be found that errors of Pmax are within 10%, and the maximum error of Pmax is 7.85%, which occurs in the SYM-Shear+45° specimen. The maximum error of δmax is −31.06%, which occurs in the SYM-Shear−45° specimen. Meanwhile, there are also SYM-Shear−30 and USYM-Shear−45 specimens with the errors of δmax more than or close to 20% from the test results.
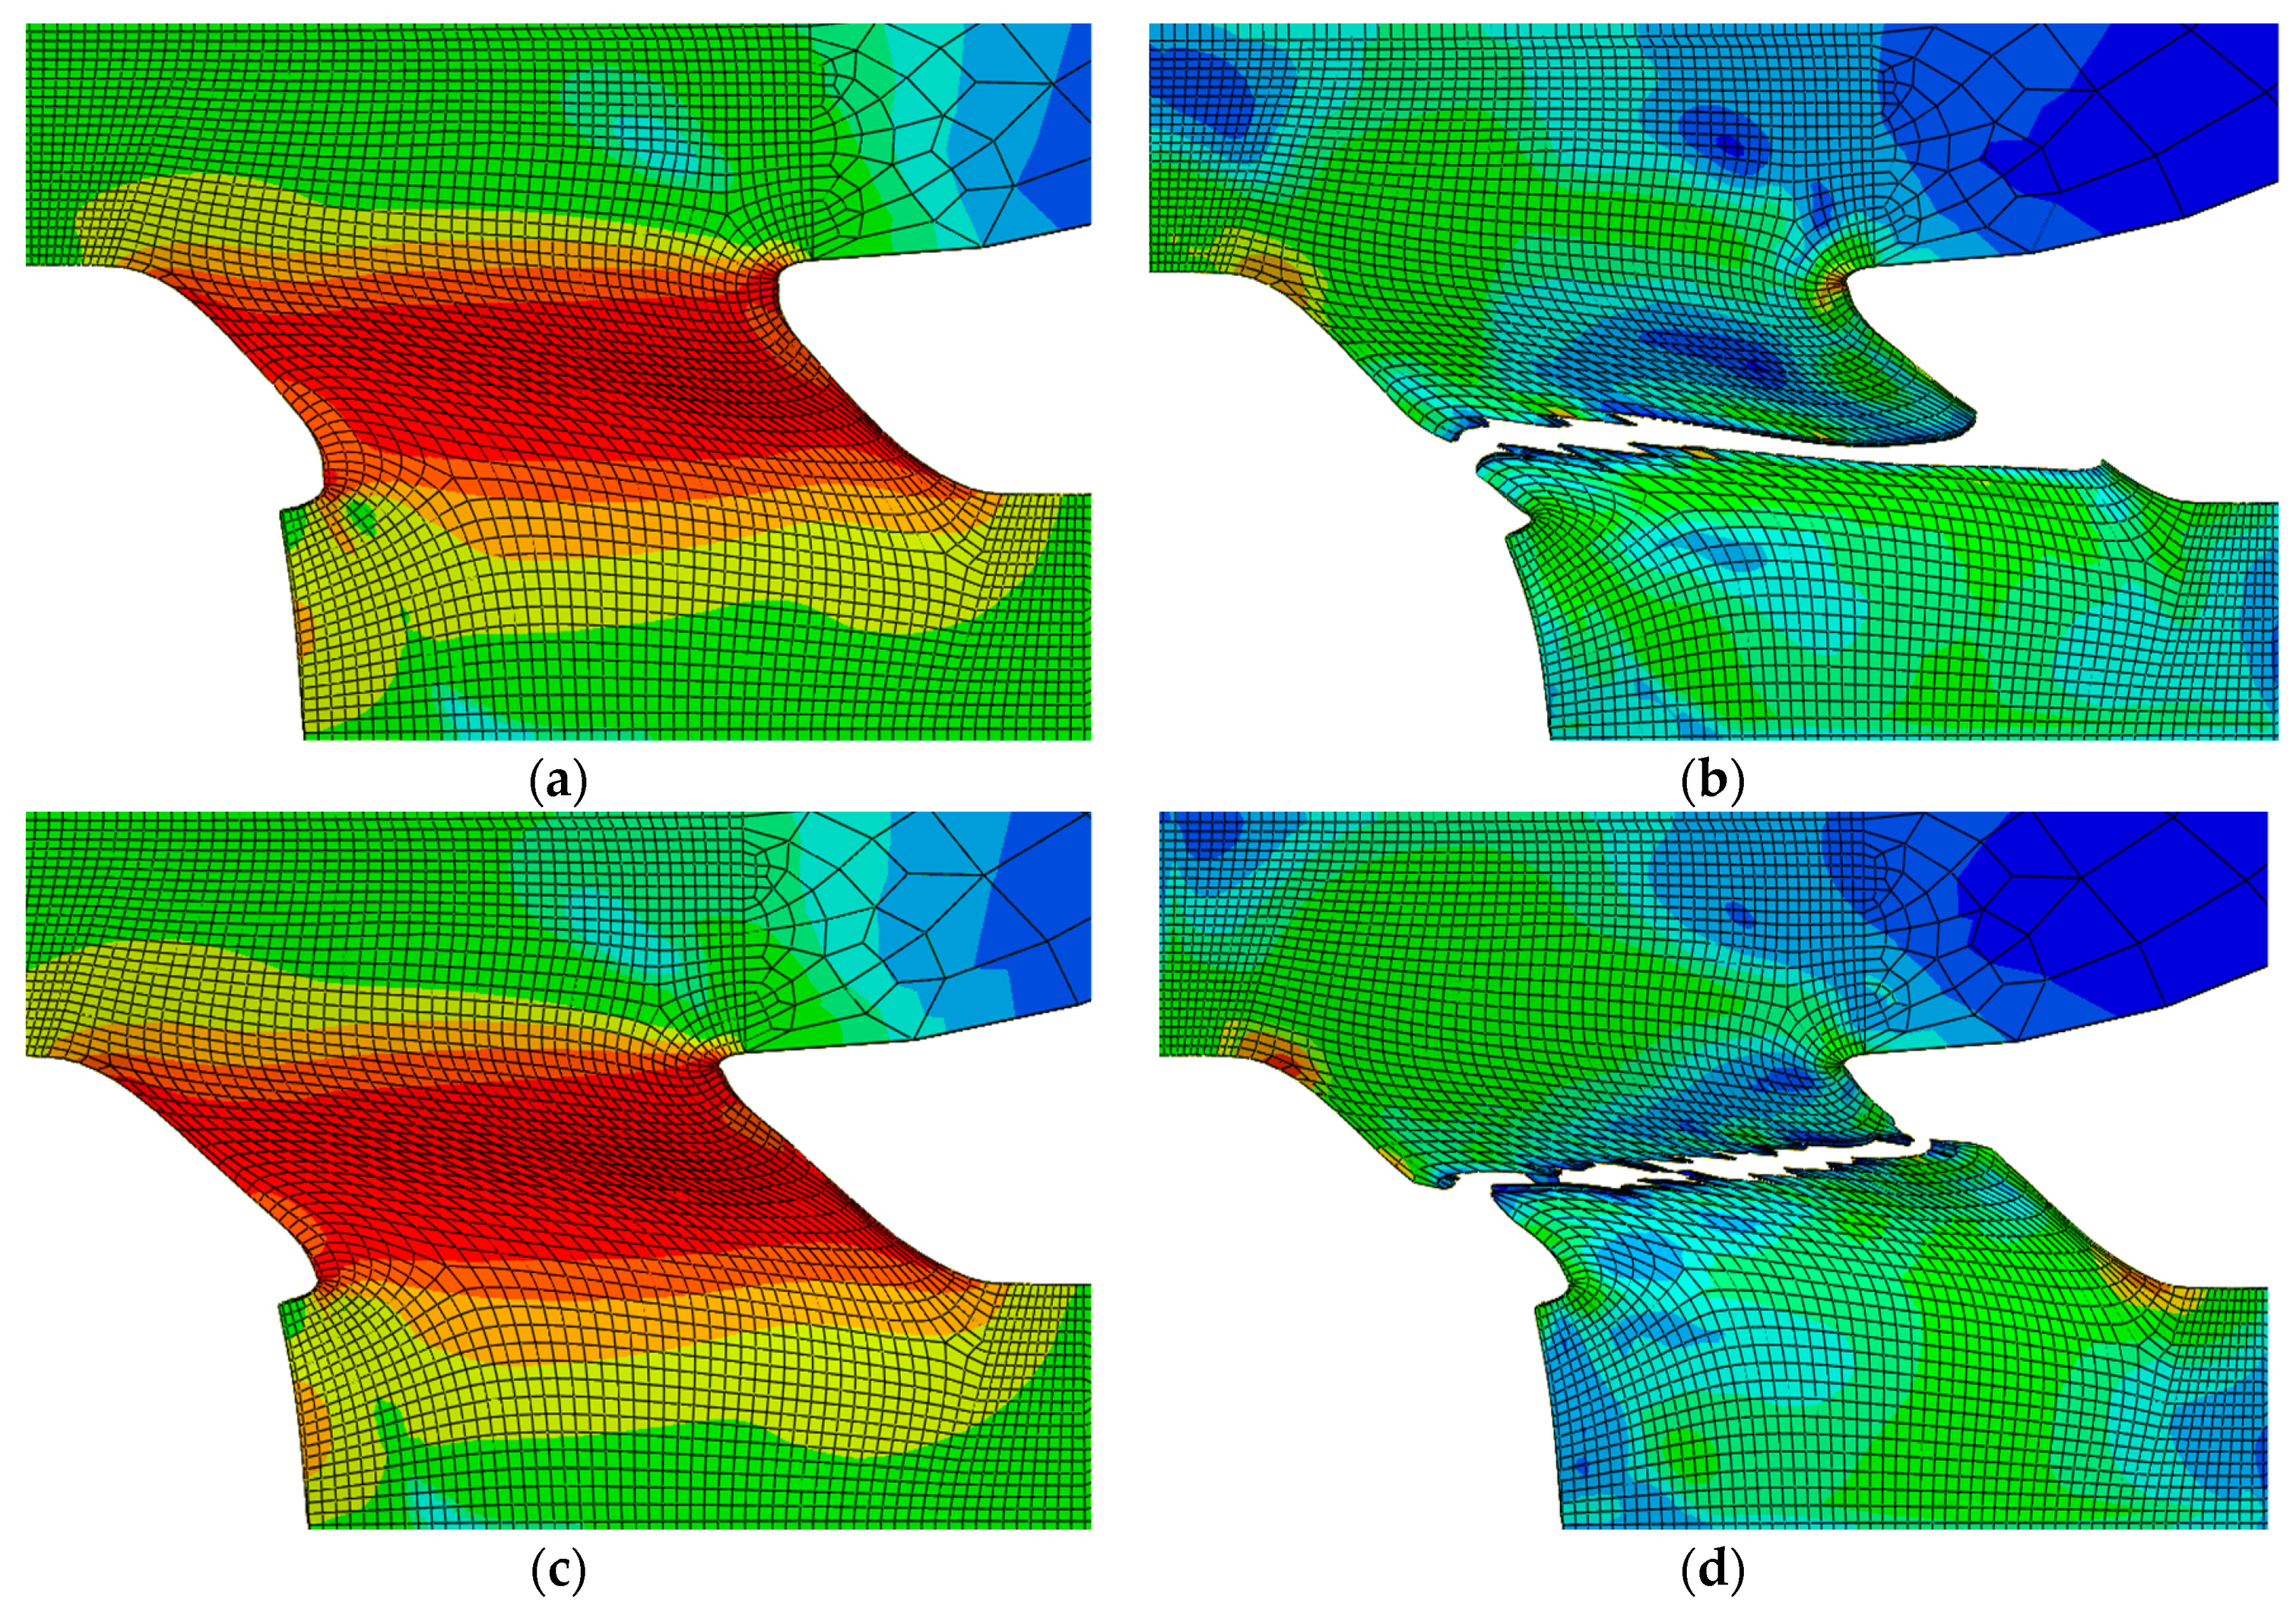
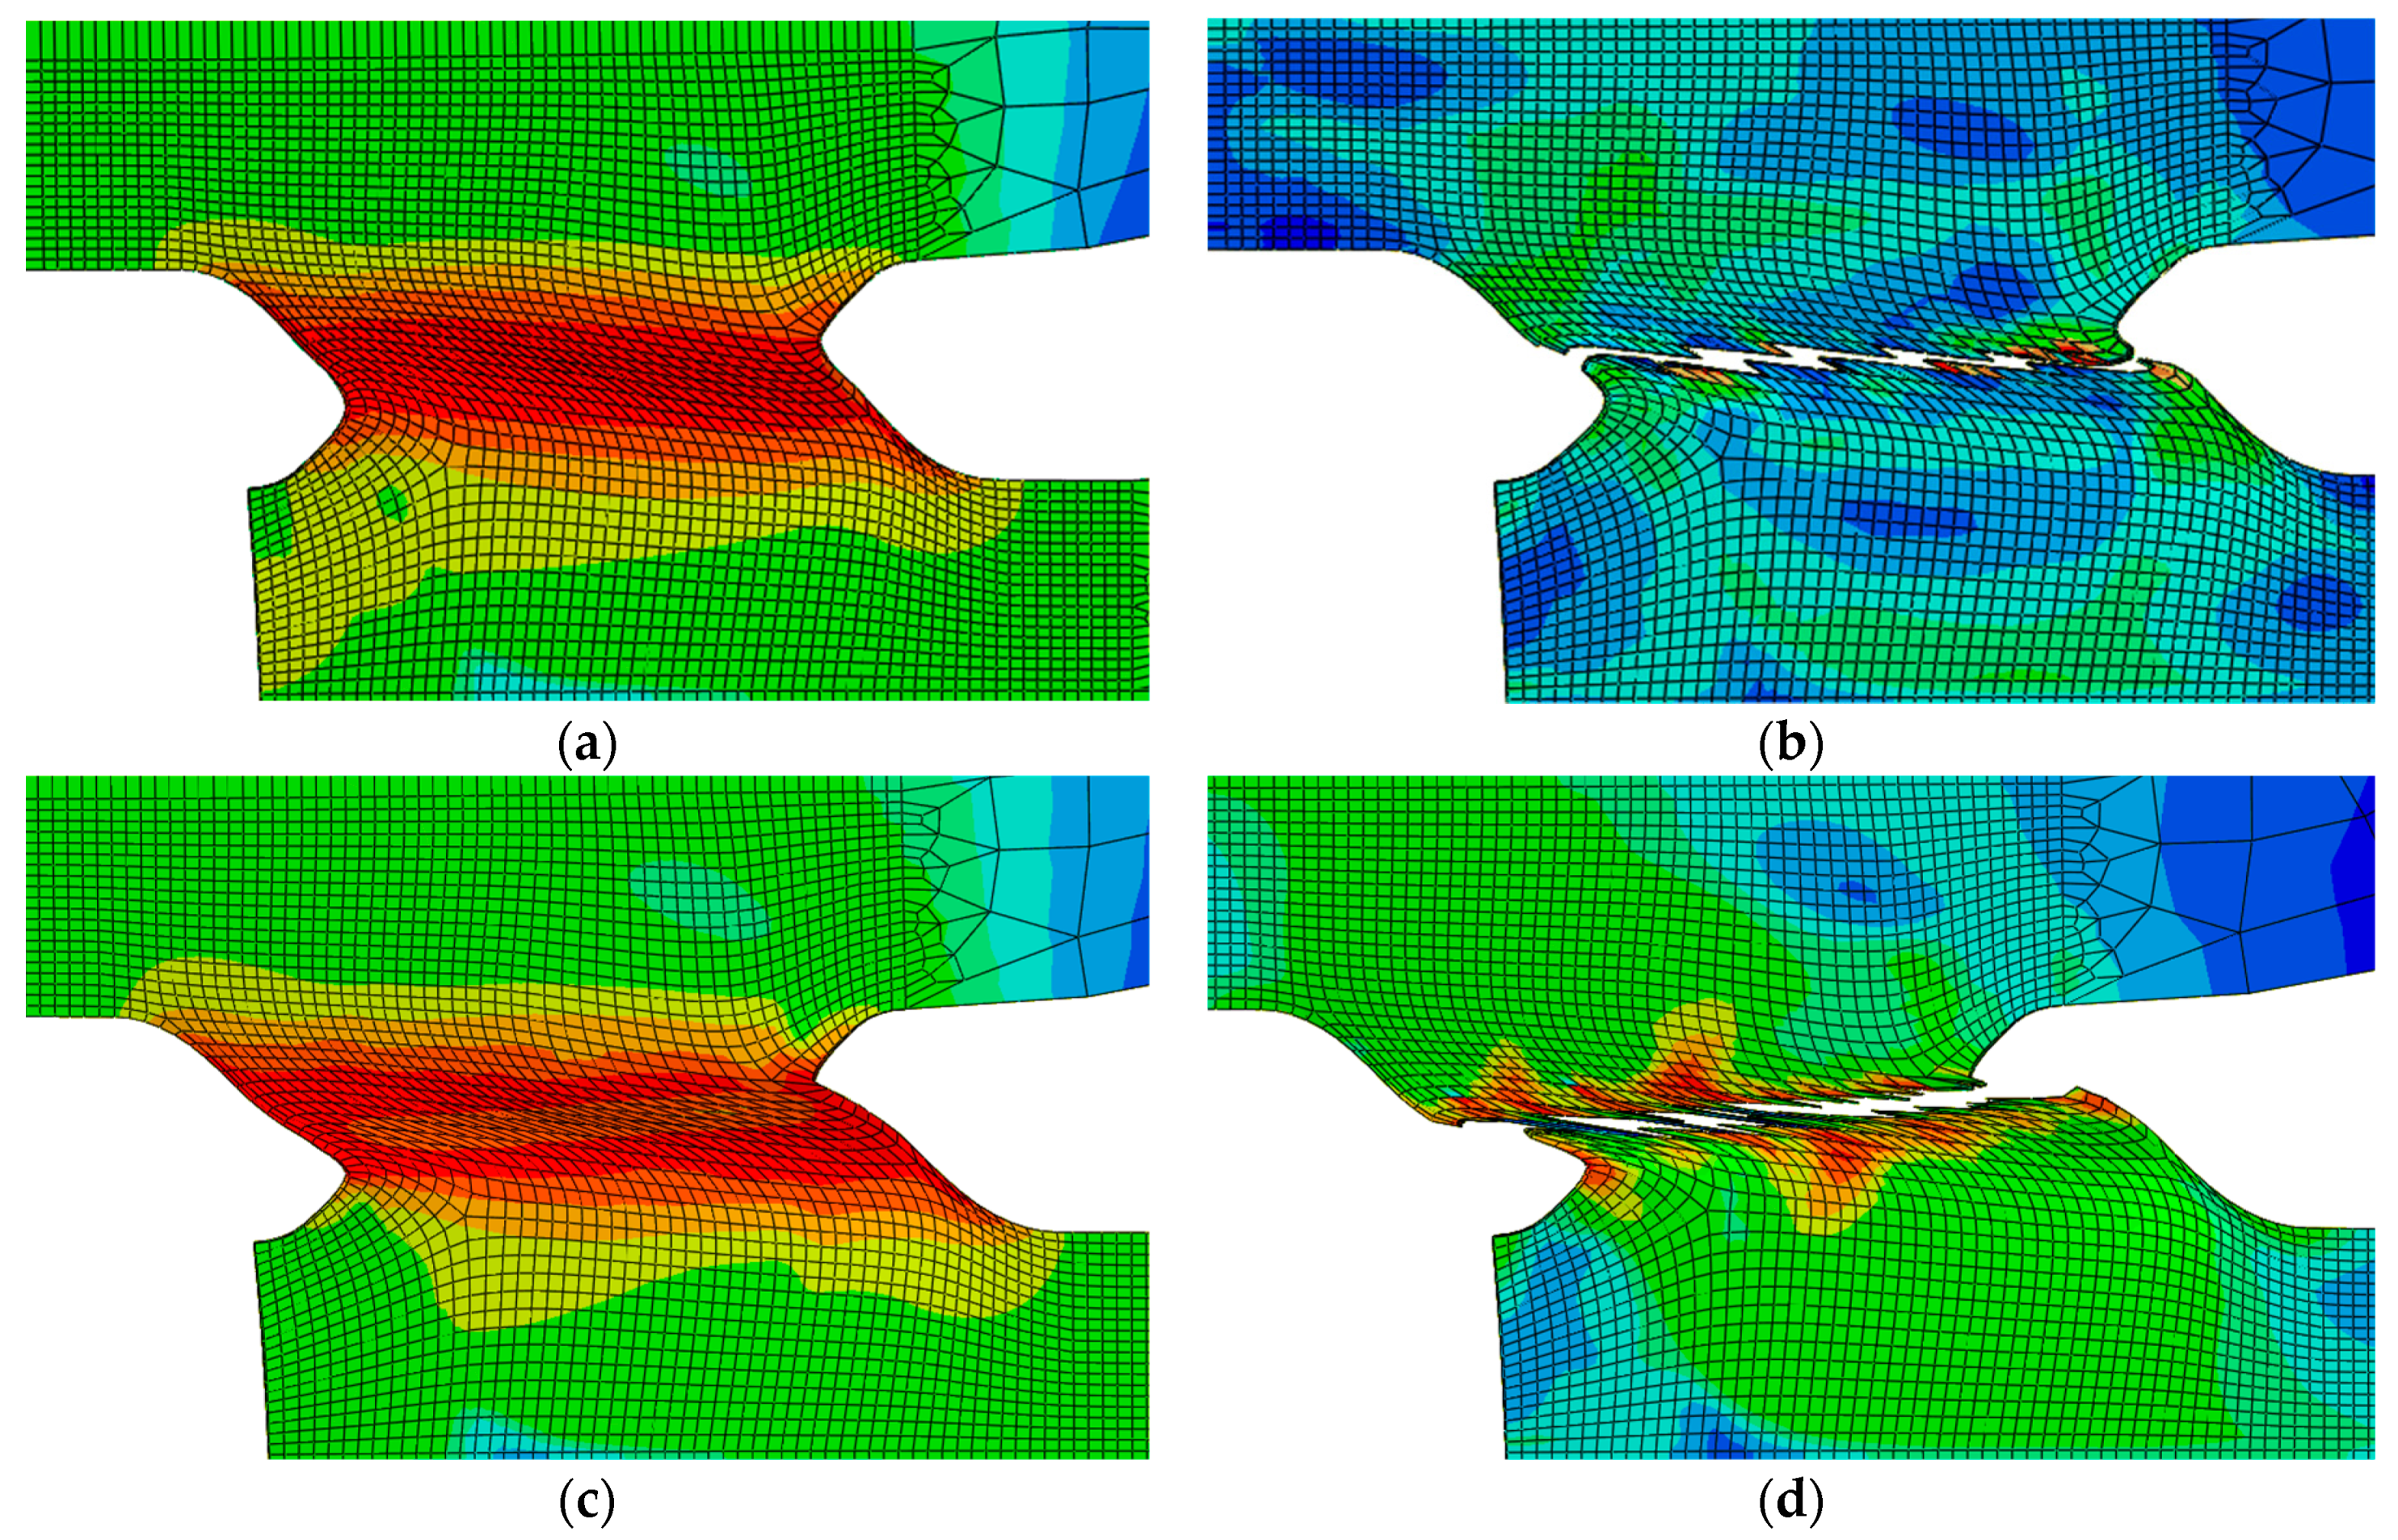
As discussed in Section 3.2, the hotspot region of the specimens with negative angles gradually transits from the combined shear-compression stress state to the combined shear-tension stress state with the increase in the applied tensile loading. The hotspot region of the specimen is softened during the test, as shown in Figure 9b. Therefore, for better results, u e q f = 0.6 , u e q f = 0.2 , and u e q f = 0.4 considering the softening state, the specimen experiences were adopted by trial and error of the numerical analysis of SYM-Shear−45°, SYM-Shear−30°, and USYM-Shear−45° specimens, respectively. Figure 18 and Figure 19 show the results obtained using the modified N-VG model of the SYM-Shear−30° specimen and the SYM-Shear−45° specimen, respectively. Compared with Figure 18a and Figure 19a, i.e., the results of u e q f = 0 , it is obvious that the results of u e q f = 0.2 and u e q f = 0.6 shown in Figure 18c and Figure 19c can better simulate the softening and stretching phenomenon in the hotspot region. Moreover, the results of u e q f = 0.2 and u e q f = 0.6 can reproduce the fracture path observed in the tests, as shown in Figure 18d and Figure 19d. Consequently, the error in maximum load displacement is reduced from −31.06% to −22.35%, −26.64 to 4.74%, and −19.40% to −9.45%.
It can be seen from the data in Table 4 that the error of the maximum load Pmax between numerical results using the modified N-V model and the test results is within 10%, and the error of the displacement at the maximum load δmax is almost within 20%. It is concluded that the modified N-VG model can well simulate the fracture behavior of high-strength steels at low-stress triaxiality.

6. Conclusions

In this study, a series of experiments and numerical simulations were carried out to clarify the ductile fracture mechanism of high-strength SM570 steels under negative and low-stress triaxiality. Symmetric shear (SYM-Shear) specimens and asymmetric shear (USYM-Shear) specimens were designed with seven different notch angles and were subjected to monotonic tensile loading. The results were investigated in terms of load-displacement curves, failure mode, and fracture surface. A modified N-VG model was developed for the simulation of ductile fracture behavior of high-strength steels and proved to be effective. The main conclusions can be summarized as follows:
(1)
As the notch angle varies from 45° to −30, δmax and δf of SYM-Shear and USYM-Shear specimens increase gradually. As the shear band transits from the combined shear-compression stress state to the combined shear-tension stress state, the strength of the SM570 steel is remarkably reduced, resulting in early fracture. In addition, SYM-Shear specimens showed larger values of δf and higher load-bearing capacity than USYM-Shear specimens.
(2)
Comparison between the SM570 and the ordinary steel SM490 demonstrates that fracture failure occurs earlier in the SM570 specimens. δmax of the conventional steel SM490 specimen is approximately equal to twice the δmax of the steel SM570 specimen. It is attributed to the low plastic deformation capacity of the SM570, which leads to the strain concentration at the notch and the earlier crack initiation, while the SM490 specimens encounter ductile fracture failure, accompanied by large plastic deformation.
(3)
A modified N-VG model with a quadratic polynomial fracture criterion in the stress triaxiality range from −0.6 to 1/3 was proposed. Numerical analyses using the modified model were performed with ABAQUS to simulate the fracture behavior of the SYM-Shear and the USYM-Shear specimens. The maximum load error between the numerical results and the test results is within 10%, while the corresponding displacement error is almost within 20%.

Author Contributions

Y.L. (Yan Liu) performed the experiment; S.I. performed the data analyses; Y.L. (Yanyan Liu) performed investigation of research background and wrote the manuscript; H.G. proposed the idea and provided the funding. All authors have read and agreed to the published version of the manuscript.

Funding

This research received no external funding.

Institutional Review Board Statement

Not applicable.

Informed Consent Statement

Not applicable.

Data Availability Statement

The data used to support the findings of this study are available from the corresponding author upon request.

Acknowledgments

The research is supported in part by grants from the Advanced Research Center for Natural Disaster Risk Reduction, Meijo University.

Conflicts of Interest

The authors declare no conflict of interest.

References

  1. Sugimoto, H.; Takahashi, Y. Investigation of beam-column-connection surface fractures that occurred during the 1995 Hanshin-Awaji earthquake and repair welding heat effect on adjacent steel: Inspection of crack growth and analysis of material degeneration. Steel Constr. Eng. 1995, 3, 21–34. (In Japanese) [Google Scholar]
  2. Watanabe, E.; Maekawa, Y.; Sugiura, K.; Kitane, Y. Damage and seismic performance of steel bridges. Civ. Eng. JSCE 1995, 80, 54–62. (In Japanese) [Google Scholar]
  3. Okashita, K.; Ohminami, R.; Michiba, K.; Yamamoto, A.; Tomimatsu, M.; Tanji, Y.; Miki, C. Investigation of the brittle fracture at the corner of P75 rigid-frame pier in Kobe harbor highway during the Hyogoken-Nanbu earthquake. J. Struct. Mech. Earthq. Eng. 1998, 591, 243–261. (In Japanese) [Google Scholar] [CrossRef]
  4. Hiramatsu, H.; Michiba, K.; Toyoda, M. Ductile crack initiation behavior of structural materials under low stress triaxiality. J. Soc. Nav. Archit. Jpn. 2002, 192, 563–571. (In Japanese) [Google Scholar] [CrossRef]
  5. Ge, H.; Kawahito, M.; Ohashi, M. Fundamental study on ductile crack initiation condition in structural steels considering micro-void growth. Proc. JSCE Earthq. Eng. Symp. 2005, 28, 190. (In Japanese) [Google Scholar]
  6. Tamaru, H.; Sasaki, E.; Yamada, H.; Katsuchi, H. Analytical study focusing on stress triaxiality on factor of brittle fracture during earthquake in steel bridge bents. J. Jpn. Soc. Civ. Eng. A 2010, 66, 420–434. (In Japanese) [Google Scholar]
  7. Xiang, P.; Jia, L.; Ke, K.; Chen, Y.; Ge, H. Ductile cracking simulation of uncracked high strength steel using an energy approach. J. Constr. Steel Res. 2017, 138, 117–130. [Google Scholar] [CrossRef]
  8. Bao, Y.; Wierzbicki, T. On fracture locus in the equivalent strain and stress triaxiality space. Int. J. Mech. Sci. 2004, 46, 81–98. [Google Scholar] [CrossRef]
  9. Bai, Y.; Wierzbicki, T. A new model of metal plasticity and fracture with pressure and load dependence. Int. J. Plast. 2008, 24, 1071–1096. [Google Scholar] [CrossRef]
  10. Rice, J.R.; Tracey, D.M. On the ductile enlargement of voids in triaxial stress field. J. Mech. Phys. Solid 1969, 17, 201–217. [Google Scholar] [CrossRef] [Green Version]
  11. Barsoum, I.; Faleskog, J. Rupture mechanisms in combined tension and shear—Experiments. Intern. J. Solids Struct. 2007, 44, 1768–1786. [Google Scholar] [CrossRef] [Green Version]
  12. IS G 3106:2015; Rolled Steels for Welded Structure. Japan Industrial Committee: Tokyo, Japan, 2015.
  13. Liu, Y.; Ge, H.; Kang, L. A study on the improvement of the simulation accuracy of ductile fracture model for structural steels under high stress triaxiality. J. Jpn. Soc. Civ. Eng. Ser. A1 2018, 74, 546–557. (In Japanese) [Google Scholar] [CrossRef]
  14. Liu, Y.; Ge, H.; Kang, L. A study on developing a ductile fracture model for structural steels under low stress triaxiality. J. Jpn. Soc. Civ. Eng. Ser. A1 2019, 75, 333–344. (In Japanese) [Google Scholar] [CrossRef]
  15. Liu, Y.; Kang, L.; Ge, H. Experimental and numerical study on ductile fracture of structural steels under different stress states. J. Constr. Steel Res. 2019, 158, 381–404. [Google Scholar] [CrossRef]
  16. Miki, C.; Ichikawa, A.; Kusunoki, T.; Kawabata, F. Proposal of new high performance steels for bridges (BHS500, BHS700). J. Jpn. Soc. Civ. Eng. 2003, 738, 1–10. (In Japanese) [Google Scholar] [CrossRef] [Green Version]
  17. Ono, Y.; Kinoshita, K. Bridge weight reduction effect of the hybrid girder using SBHS700. Proc. Constr. Steel 2016, 24, 536–541. (In Japanese) [Google Scholar]
  18. Hirohata, M.; Teraguchi, D.; Kitane, Y. Mechanical properties of steels for bridge high performance structures subjected to heating and cooling process simulating fire. Steel Constr. Eng. 2019, 26, 79–86. (In Japanese) [Google Scholar]
  19. Liu, Y.; Ikeda, S.; Liu, Y.; Kang, L.; Ge, H. Experimenal investigation of fracture performances of SBHS500, SM570 and SM490 steel specimens. Metals 2022, 12, 672. [Google Scholar] [CrossRef]
  20. Gao, X.; Zhang, G.; Roe, C. A study on the effect of the stress state on ductile fracture. Int. J. Damage Mech. 2010, 19, 75–94. [Google Scholar]
  21. Lu, J.; Liu, H.; Chen, Z.; Liao, X. Experimental investigation into the post-fire mechanical properties of hot-rolled and cold-formed steels. J. Constr. Steel Res. 2016, 121, 291–310. [Google Scholar] [CrossRef]
  22. Cao, T.S.; Gachet, J.M.; Montmitonnet, P.; Bouchard, P.-O. A lode-dependent enhanced Lemaitre model for ductile fracture prediction at low stress triaxiality. Eng. Fract. Mech. 2014, 124–125, 80–96. [Google Scholar] [CrossRef]
  23. Li, W.; Liao, F.; Zhou, T.; Askes, H. Ductile fracture of Q460 steel: Effects of stress triaxiality and load angle. J. Constr. Steel Res. 2016, 123, 1–17. [Google Scholar] [CrossRef]
  24. Kubík, P.; Šebek, F.; Hůlka, J.; Petruška, J. Calibration of ductile fracture criteria at negative stress triaxiality. Int. J. Mech. Sci. 2016, 108–109, 90–103. [Google Scholar] [CrossRef]
  25. Dunand, M.; Mohr, D. Effect of load parameter on plastic flow localization after proportional loading at low stress triaxialities. J. Mech. Phys. Solids 2014, 66, 133–153. [Google Scholar] [CrossRef]
  26. Kweon, S. Damage at negative triaxiality. Eur. J. Mech.-A/Solids 2012, 31, 203–212. [Google Scholar] [CrossRef]
  27. Kiran, R.; Khandelwal, K. A triaxiality and load parameter dependent ductile fracture criterion. Eng. Fract. Mech. 2014, 128, 121–138. [Google Scholar] [CrossRef]
  28. Wen, H.; Mahmoud, H. Simulation of block shear fracture in bolted connections. J. Constr. Steel Res. 2017, 134, 1–16. [Google Scholar] [CrossRef]
  29. Wen, H.; Mahmoud, H. New model for ductile fracture of metal alloys. I: Monotonic loading. J. Eng. Mech. 2016, 142, 4015088. [Google Scholar] [CrossRef]
  30. Lou, Y.; Yoon, J.W.; Huh, H. Modeling of shear ductile fracture considering a changeable cut-off value for stress triaxiality. Int. J. Plast. 2014, 54, 56–80. [Google Scholar] [CrossRef]
  31. Bacha, A.; Daniel, D.; Klocker, H. Metal ductility at low stress triaxiality application to sheet trimming. J. Mater. Processing Technol. 2008, 203, 480–497. [Google Scholar] [CrossRef]
  32. Bao, Y.; Wierzbicki, T. On the cut-off value of negative triaxiality for fracture. Eng. Fract. Mech. 2005, 72, 1049–1069. [Google Scholar] [CrossRef]
  33. Li, H.; Fu, M.; Lu, J.; Yang, H. Ductile fracture: Experiments and computations. Int. J. Plast. 2011, 27, 147–180. [Google Scholar] [CrossRef]
  34. JIS G 3140:2011; Higher Yield Strength Steel Plates for Bridges. Japan Industrial Committee: Tokyo, Japan, 2011.
  35. Kang, L.; Ge, H.; Kato, T. Experimental and ductile fracture model study of single-groove welded joints under monotonic loadings. Eng. Struct. 2015, 85, 36–51. [Google Scholar] [CrossRef]
  36. Yun, L. Uniaxial true stress-strain after necking. AMP J. Technol. 1996, 5, 37–48. [Google Scholar]
  37. Jia, L.; Kuwamura, H. Ductile fracture simulation of structural steels under monotonic tension. J. Struct. Eng. 2014, 150, 4013115. [Google Scholar] [CrossRef]
  38. Shinohara, K.; Jia, L.; Kato, H.; Ge, H. A study on ductile fracture mechanism of structural steels under combined shear and tensile stresses. J. Jpn. Soc. Civ. Eng. Ser. A1 2015, 71, 337–348. (In Japanese) [Google Scholar]
  39. Hancock, J.W.; Mackenzie, A.C. On the mechanisms of ductile failure in high-strength steels subjected to multi-axial stress-states. J. Mech. Phys. Solids 1976, 24, 147–169. [Google Scholar] [CrossRef]
  40. Johnson, G.R.; Cook, W.H. Fracture characteristics of three metals subjected to various strains, strain rates, temperatures and pressures. Eng. Fract. Mech. 1985, 21, 31–48. [Google Scholar] [CrossRef]
Figure 1. Specimen for testing the material properties: (a) Schematic diagram of the specimen; (b) picture of the specimen prepared using the base material (unit: mm).
Metals 12 01394 g001
Figure 2. Engineering stress-engineering strain curves of base metal specimen.
Metals 12 01394 g002
Figure 3. Configuration and dimensions of SYM-Shear specimens: (a) Dimensions of the specimen; (b) detailed dimensions of the notch (unit: mm).
Metals 12 01394 g003aMetals 12 01394 g003b
Figure 4. Configuration and dimensions of USYM-Shear specimens: (a) Dimensions of the specimen; (b) Detailed dimensions of the notch. (unit: mm).
Metals 12 01394 g004aMetals 12 01394 g004b
Figure 5. Photos of specimens composed of SM570 steel.
Metals 12 01394 g005
Figure 6. Photo of Ω extensometer.
Metals 12 01394 g006
Figure 7. Load-displacement curves of SM570 steel: (a) SYM-Shear specimen; (b) USYM-Shear specimen.
Metals 12 01394 g007
Figure 8. Load-displacement curves of SM490 steel: (a) SYM-Shear specimens; (b) USYM-Shear specimens.
Metals 12 01394 g008
Figure 9. Photographs of fracture failure: (a) SYM-Shear+45° specimens; (b) SYM-Shear−45° specimens; (c) USYM-Shear+45° specimens; (d) USYM-Shear−45° specimens. More details for the test results of SM490 can be found in the literature [14].
Metals 12 01394 g009
Figure 10. Photographs of failure surface of the SM570 specimens.
Metals 12 01394 g010
Figure 11. FE models of SYM-Shear specimen and USYM-Shear specimen.
Metals 12 01394 g011
Figure 12. The true stress-equivalent plastic strain curve obtained by PLT method.
Metals 12 01394 g012
Figure 13. Comparison of load-displacement curves between test and numerical analysis.
Metals 12 01394 g013
Figure 14. Comparison between test coupons and numerical result using N-VG model and 3D model: (a) USYM-Shear0 specimens; (b) SYM-Shear+15° specimens.
Metals 12 01394 g014
Figure 15. (a) Stress triaxiality vs. equivalent plastic strain obtained from the non-fracture analysis; (b) the modified N-VG model for fracture criteria of high-strength steel.
Metals 12 01394 g015
Figure 16. Comparison of experimental results and analysis results using the modified N-VG model (SYM-Shear specimens).
Metals 12 01394 g016
Figure 17. Comparison of experimental results and analysis results using the modified N-VG model (USYM-Shear specimens).
Metals 12 01394 g017
Figure 18. Results of the SYM-Shear−30° specimen obtained using the modified N-VG model: (a) Stress contour and deformation of the hotspot region ( u e q f = 0 ); (b) fracture path ( u e q f = 0 ); (c) stress contour and deformation of the hotspot region ( u e q f = 0.2 ); (d) fracture path ( u e q f = 0.2 ).
Metals 12 01394 g018
Figure 19. Results of the SYM-Shear−45° specimen obtained using the modified N-VG model: (a) Stress contour and deformation of the hotspot region ( u e q f = 0 ); (b) fracture path ( u e q f = 0 ); (c) stress contour and deformation of the hotspot region ( u e q f = 0.6 ); (d) fracture path ( u e q f = 0.6 ).
Metals 12 01394 g019
Table 1. Mechanical properties of SM570.
E (GPa) 1ν2σy (MPa) 3εy4σt (MPa) 5δ (%) 6
SM570Test200 ± 5.1150.28 ± 0.020586 ± 7.3300.0027 ± 0.001673 ± 2.23117.66 ± 1.03
Standard--Over 460-570~720-
1E = Young’s modulus, 2 ν = Poisson’s ratio, 3 σy = yield stress, 4 εy = yield strain, 5 σt = tensile strength, and 6 δ = elongation at break.
Table 2. Mean values of the test results obtained for SM570.
Pmax (kN) 1δmax (mm) 2δf (mm) 3
SYM-Shear+4545.211.242.25
SYM-Shear+3046.551.762.59
SYM-Shear+1546.422.032.86
SYM-Shear 049.422.062.78
SYM-Shear−1546.602.303.28
SYM-Shear−3047.582.743.73
SYM-Shear−4546.952.643.14
USYM-Shear+4521.691.121.41
USYM-Shear+3021.961.201.51
USYM-Shear+1522.331.511.80
USYM-Shear 023.961.621.98
USYM-Shear−1522.682.212.44
USYM-Shear−3023.132.522.70
USYM-Shear−4522.772.012.44
1Pmax = maximum load, 2 δmax = displacement at maximum load, and 3 δf = displacement at failure.
Table 3. Stress triaxiality and equivalent plastic strain obtained from the non-fracture analysis.
η ε eq f   2
Left 3Right 4Left Right
SYM-Shear+45°−0.052−0.1050.6520.760
SYM-Shear+30°−0.317−0.2170.9430.703
SYM-Shear+15°−0.476−0.5301.1041.186
SYM-Shear 0°−0.023−0.0811.0000.848
SYM-Shear−15°−0.508−0.5551.1371.402
SYM-Shear−30°0.0690.0220.9360.964
SYM-Shear−45°0.052−0.0291.1570.964
USYM-Shear+45°−0.3380.563
USYM-Shear+30°−0.4330.887
USYM-Shear+15°−0.4731.093
USYM-Shear 0°0.0760.979
USYM-Shear−15°0.0760.724
USYM-Shear−30°0.0650.938
USYM-Shear−45°0.0511.156
1 η = stress triaxiality, 2 ε eq f = equivalent plastic strain at fracture, 3 Left = left fracture part, 4 Right = right fracture part.
Table 4. Analysis results using the modified N-VG model.
Pmax (kN) 1δmax (mm) 2Error (Pmax) 3Error (δmax) 4
SYM-Shear+45°48.761.517.85%21.77%
SYM-Shear+30°50.161.997.76%13.07%
SYM-Shear+15°49.471.936.57%−4.93%
SYM-Shear 0°52.602.166.43%4.85%
SYM-Shear−15°46.611.880.02%−18.26%
SYM-Shear−30°47.252.01−0.69%−26.64%
SYM-Shear−45°46.451.82−1.06%−31.06%
USYM-Shear+45°22.811.125.16%0.00%
USYM-Shear+30°23.321.306.19%8.33%
USYM-Shear+15°23.051.313.22%−13.25%
USYM-Shear 0°25.421.686.09%3.70%
USYM-Shear−15°23.602.034.06%−8.14%
USYM-Shear−30°24.402.315.49%−8.33%
USYM-Shear−45°23.071.621.32%−19.40%
SYM - Shear 30 °   ( u eq f = 0.6)50.712.876.58%4.74%
SYM - Shear 45 °   ( u eq f = 0.2)46.992.050.09%−22.35%
USYM - Shear 45 °   ( u eq f = 0.4)22.941.820.75%−9.45%
1Pmax = maximum load, 2 δmax = displacement at maximum load, 3 Error (Pmax) = the error of maximum load compared with the test result, 4 Error (δmax) = the error of displacement at maximum load compared with the test result.
Publisher’s Note: MDPI stays neutral with regard to jurisdictional claims in published maps and institutional affiliations.