Abstract
Maintaining the component service life beyond its historical limits requires the ability to accurately quantify component reliability and address the uncertainties in material responses. A probabilistic method for predicting the total fatigue life was developed and applied to determine the probability of failure of a Ti-6Al-4V turbine disk component. The total fatigue life incorporates a dual mechanism approach including the crack initiation life and propagation life while simultaneously determining the associated initial flaw sizes. A microstructure-based model was employed to address the uncertainties in material response and relate the crack initiation life with crack size. The propagation life was characterized using both small and large crack growth models to ensure accurate fatigue life prediction. Fatigue life predictions were found to correlate with experimental data at high stress levels. The risk assessment can be used to estimate the expected initial crack sizes from variability in material properties, which can further be used to establish an enhanced inspection planning.
Keywords:
Ti-6Al-4V; initiation; propagation; life prediction; fatigue; crack; probability of failure 1. Introduction
Traditionally, turbine disks are designed for a finite life using low-cycle fatigue (LCF) criterion under the safe-life design approach. The safe-life approach considers components to be automatically exhausted after 0.1% of the components have initiated a crack of 0.79 mm (1/32 in) in length [1]. However, some premature material damage may occur due to handling, machining damage, fretting, or inherent defects, causing cracks to propagate and become critical during the predicted “safe-life” [2]. Titanium alloy, Ti-6Al-4V, used as disks, failed in service due to the presence of anomalies, in Sioux City, IA in 1989. This accident not only mandated new inspection methods but also the addition of a damage tolerance approach in the life management process [3]. The damage tolerance approach assumes that all components contain inherent flaws, and inspection intervals are conservatively established based on fracture mechanics to ensure that flaws do not reach a critical size between inspection intervals. Literature describing research interest in this topic is presented in [1,2,3,4,5,6,7,8,9,10,11,12,13,14,15,16,17,18,19,20,21,22,23,24,25,26,27,28,29,30,31,32,33,34,35,36,37] and most recently [38,39,40,41,42,43,44].
Both safe-life and damage tolerance methods conservatively predetermine the operating life of components, retiring them regardless of a cause [4]. Therefore, a Retirement-for-Cause (RFC) method is being investigated by the U.S. Air Force to safely extend the operating life of components beyond their traditional life limits. Under RFC, components are removed from service only when a crack-like defect is detected during a Non-Destructive Inspection (NDI) [4]. RFC allows components to remain in service for longer and reduces the life-cycle cost. RFC utilizes damage tolerance concepts to establish inspection intervals to ensure that defects do not reach a critical size during service. However, the risk of failure will increase as components remain in-service beyond the traditional LCF limits [5]. Therefore, the increase in risk must be accurately quantified before RFC can be safely implemented.
In response to the Sioux City incident, the Federal Aviation Administration (FAA) advised Original Equipment Manufacturers (OEM) to investigate the possibility of incorporating a damage tolerance life method to account for inherent flaws for certification of new rotor designs [6,7,8]. A damage tolerance probabilistic design code, called DARWIN 7.1 (Southwest Research Institute, San Antonio, TX, USA)® Design Assessment of Reliability with Inspection, remains in development. DARWIN® is a probabilistic fracture mechanics program which utilizes damage tolerance concepts to determine the Probability-of-Failure (POF) of components containing inherent defects with and without inspection. It is an approved tool for new rotor design certification. However, the current lifing methods that are outlined by the FAA and employed in DARWIN® account for defects prior to service and do not address component damage induced during service. Therefore, life management methods must be developed in order to minimize conservative approaches and address in-service damage before the RFC method can be safely implemented.
A method for including low-cycle-fatigue damage in the probabilistic risk assessment was developed to quantify the increase in risk as components remain in service beyond their traditional limits. Total fatigue life is assumed to be the summation of the crack initiation life and the crack propagation life. A microstructure-based crack initiation model is utilized to develop a fatigue-induced anomaly distribution using variations in material properties. Crack propagation from an initial crack was determined using both short and long crack growth concepts. DARWIN® is used as the primary probabilistic module to determine the probability of failure with and without inspection. The risk assessment code was applied to an α + β alloy to assess the fatigue life prediction model and the method was compared with experimental data. Lastly, the risk of failure was determined for a representative turbine disk geometry using the purposed proposed method.
2. Fatigue Life Models
The total fatigue life () of representative turbine rotors was assumed to be comprised of two parts: (1) number of cycles to initiate a crack of a specific characteristic length, and (2) number of cycles to propagate a crack to a critical length. The total fatigue life is represented as:
where initiation life () and propagation life () both depend on the stress range, temperature, microstructure, and environment [9].
2.1. Fatigue Initiation Model
The fatigue life variation in turbine engine materials has been investigated in several studies [9,10,11]. These studies indicate the importance of microstructure properties in the fatigue life. Tanaka and Mura [12] developed a crack initiation model that explicitly addresses microstructure properties. The model was developed by considering the dislocation-dipole mechanism along a slip band operating in a surface or subsurface grain, which ultimately leads to crack nucleation. Tanaka and Mura’s model was recently extended by Chan et al. [13] to include crack initiation depth () and other relevant microstructure parameters such as M and tested with other Al, Ti, and Ni-based alloys. We used this value for our analyses:
where is the stress range, is the endurance limit, is the shear modulus, is a universal constant (0.005), h is the slipband width, D is the grain size, and is not a constant but depends on the degree of slip irreversibility and the stacking-fault energy, where , and M is the Taylor factor, defined in Table 1.

Table 1.
Ti-6Al-4V material Properties for fatigue models.
2.2. Fatigue Crack Growth Model
An accurate calculation of fatigue crack propagation life is a critical step in predicting the risk of failure of engine components. Short crack growth has been shown to exhibit an increase in scatter, accelerated growth rates relative to large crack growth, and growth at nominal values below the large-crack threshold [14]. For these reasons, the growth of both short and large cracks is included in the analysis of the crack propagation phase. A wide variety of different analysis methods have been proposed to predict an enhanced crack tip driving force for short cracks to predict their accelerated growth rates. These methods apply fracture mechanics to short cracks by either adjusting the LEFM to account for plasticity or by explicitly considering residual crack tip plasticity and crack closure [15]. In this study, two models are investigated to quantify the short crack growth effects: (1) El Haddad’s method and (2) a bilinear Paris equation.
El Haddad et al. [16] proposed a short crack model based on the Kitagawa diagram, shown in Figure 1. Kitagawa and Takahashi [17] related the large crack fracture mechanic threshold, , to the smooth specimen endurance limit,. The intersection of the two parameters on the diagram defines the small crack parameter:
where is the crack boundary correction factor. Figure 1 shows that short cracks must be able to grow at nominal stress intensity factor ranges less than the large crack threshold, since smooth specimens fail by the initiation and growth of micro cracks. El Haddad postulated that short cracks grow below the large crack threshold because they have a larger effective driving force than predicted by LEFM. He proposed an effective driving force by replacing the actual crack size, , with the sum in the stress intensity calculation.
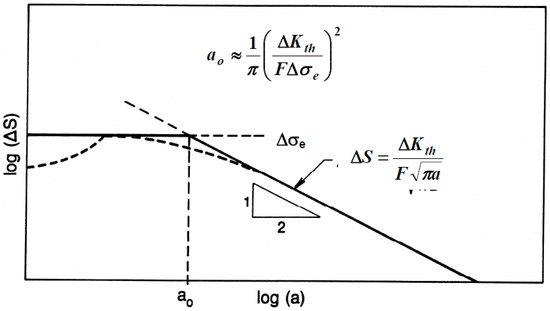
Figure 1.
Kitagawa diagram relating fatigue endurance limit and crack threshold [17].
The small crack parameter,, has a large contribution in the stress intensity solution when the actual crack size is small. As the actual crack size increases, the parameter has a negligible effect. The effective stress intensity factor,, is used in the Paris equation (Equation (6)) to determine crack growth from the initial crack size until it reaches the fracture toughness.
The second propagation model used in this study is a bilinear Paris equation to characterize short and long crack growth rates, as illustrated in Figure 2. The bilinear relationship is written as follows:
where is the “knee” in the bilinear curve where the two equations intersect, and it is assumed to be equal to the large stress intensity factor,. Equations (5) and (6) describe the short and long crack growth rate, respectively. are constants derived from short crack data, and the short crack stress-intensity factor threshold, , is assumed to be zero for a “worse case” scenario. It should also be noted that the bilinear relationship of short and long crack growth rates may not exist for certain materials. However, Goswami et al. [18] have shown a bilinear relationship for Regime I to Regime II in Ti-6Al-4V alloy forging, which will be the material of focus in this study.
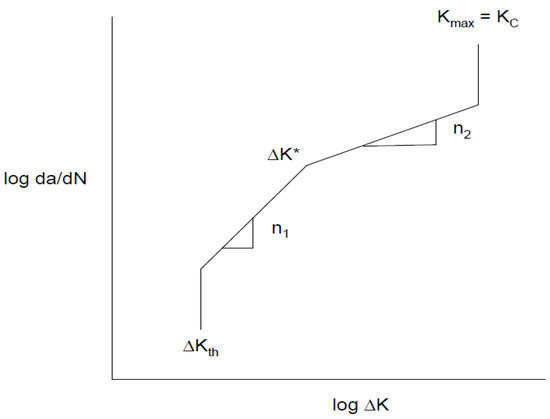
Figure 2.
Bilinear FCG behavior [19].
3. Probabilistic Fatigue Framework
Both turbine disks and weldments contain crack-like defects. If undetected, they may grow with continued operation, resulting in premature failure of the engine and unscheduled component replacement. A disk failure may be catastrophic if uncontained and may result in accident or loss of lives. Both applications require an assessment of risks probabilistically to implement inspection [38] and subsequently return to service of the aircraft. In both of these scenarios the fatigue crack growth is modeled via probabilistic methods using fracture mechanics. In the case of weldment, a model was developed [38] for welds in a plate and considered the uncertainty in material properties, defect inspection capabilities, weld geometry, and loads. These are the same input parameters for disk components. A specific stress intensity factor and an improved first-order reliability method was developed for weldment. The proposed routine alleviated the computational cost of stochastic crack propagation analysis. It is useful to achieve an effective design for manufacturing, to develop structural health monitoring applications, and eha adapt inspection schedules to the airplane fleet experience [39].
A probabilistic framework has been developed utilizing the fatigue crack growth models and DARWIN® to determine the probability of failure due to low cycle fatigue damage as shown in the schematic (Figure 3). DARWIN determines the fatigue crack growth lifetimes under cyclic loading histories. DARWIN can compute the fracture risk values using random variables such as distributions of material inclusions that form cracks. It is used to estimate the total component risk with random anomalies anywhere in the volume. DARWIN combines sets of deterministic lives into probabilistic risk values using probabilistic methods, including Monte Carlo, life approximation methods, importance sampling, and Gaussian Process response surfaces. DARWIN has additional features that enable users to set random inspection schedules using non-destructive evaluation techniques. Arrows in Figure 3 provide the follow of data processing in DARWIN.
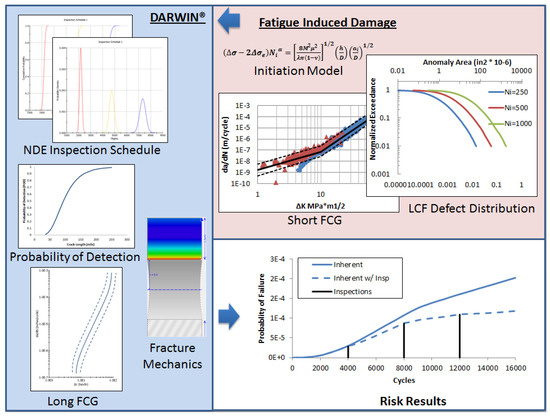
Figure 3.
Input data sources in DARWIN to develop probabilistic framework.
A probabilistic code was developed in Matlab, 2011a, to characterize fatigue damage in the form of an anomaly distribution using the initiation equation (Equation (2)). The fatigue anomaly distribution is input into DARWIN® to determine the probability of failure with and without inspection. Random variables were assumed to be statistically uncorrelated, thus only certain variables were chosen to have a distribution. The first step of the process was to determine the crack size at which a crack is considered to have been “initiated” and treated as a long crack in the FCG models. The initiated crack size has a significant impact on the total computed life [20].
Fatigue Anomaly Distribution
Since fatigue life is sensitive to the initiated crack size, a conservative approach was assumed in the analysis by minimizing the total fatigue life. Either the crack initiation or the propagation phase will dominate at some time during the life of the component. A variable initiation length model provides a method for determining the minimum fatigue life while simultaneously determining the initial crack size(s). This approach is based on the summation of initial life and propagation life curves as a function of the initial crack size as presented in Equation (7):
where is the initial crack size. The initiation life curve is created by calculating the initiation life required to initiate a crack of size . The propagation life curve is created by calculating the cycles to grow the initial crack size, , to a critical length, . The worst-case scenario or shortest fatigue life was the minimum on the total fatigue curve as illustrated in Figure 4. A polynomial interpolation optimization method was utilized to find the minimum life and the corresponding crack size [21].
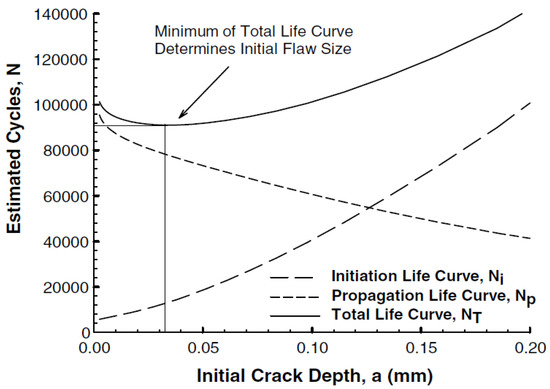
Figure 4.
Variable initiation crack length (mm) versus number of cycles [20].
Once the initial crack size was determined, a Monte Carlo simulation was used to determine the initiated crack size distribution using Equation (2). In this study, lognormal distributions were used for unknown variables since the fatigue life has been shown to be lognormal [22]. The mean and standard deviation of the random material properties were obtained from experimental data from the literature. Since the variables were lognormal random variables, the logarithmic of the variables were Gaussian random variables. The mean and standard deviation of the logarithmic distributions are represented by Equations (8) and (9), respectively:
where and are the mean and standard deviation of the random variable, respectively. Once the initiated crack distribution was determined, it was submitted to DARWIN® in the form of an anomaly distribution. Since the crack size was a random variable in Equation (2), the cycles to initiation (Ni) assumed constant determined from the minimum life curve (Figure 4). The crack size that minimizes the total fatigue life was used to determine the corresponding initiation life. The risk assessment code in DARWIN® was used to determine the probability of failure of the initiated crack distribution using both short and long crack growth equations. The two short crack growth equations were implemented into the probabilistic framework to account for short crack growth scatter.
4. Application of an α + β Alloy
The slip-band formed in a grain on the material surface is a preferential site for crack initiation during low strain fatigue of polycrystalline metals. The model was developed by considering the dislocation-dipole mechanism along a slip band operating in a surface or subsurface grain, which ultimately leads to crack nucleation. The monotonic buildup of dislocation dipoles piled up at the grain boundary was derived from the theory of continuously distributed dislocations. The number of stress cycles to the initiation of the crack was assumed to occur when the stored strain energy of accumulated dislocations reached a critical value. Chan [13] tested the applicability of the model with various steel, aluminum alloys, titanium alloys, including Ti-6Al-4V, and Ni-alloys. The necessary parameters are defined else-where [12,13].
Titanium alloys have been widely used in the aircraft industry due to their favorable strength-to-weight ratio. The probabilistic fatigue damage method has been applied to an α + β forged Ti-6Al-4V alloy to predict the probability of failure due to material variability. Together, the initiation and propagation fatigue models estimate the number of cycles required to initiate and grow a surface crack to a critical depth in a round fatigue bar specimen. Loading was assumed to be a single fatigue cycle with a stress ratio of R = 0.1. The predicted probability of failure was compared with experimental S-N data.
Grain size has been shown to be the dominating microstructure property in crack initiation life [24], thus the initiation life model uses grain size as a random variable. Figure 5 shows the typical microstructure of Ti-6Al-4V, which is comprised of 60% primary grains and 40% Widmanstatten α + β colonies. Both α grain size and α + β colony size were treated as equivalent sizes and assigned a single probability density function. The mean and standard deviation of grain size were derived from several sources [25,26,27,28] to be 13.7 μm and 4.4 μm, respectively. The impact of grain size according to the crack initiation model (Equation (2)) was illustrated in Figure 6 which shows the number of cycles needed to initiate a crack depth two times the average grain diameter at various grain sizes. The figure shows that a larger grain size will reduce the number of fatigue cycles for initiating a crack of a specific depth. This phenomenon is consistent with the literature since larger grain sizes favor crack initiation [29]. A fine-grained microstructure tends to slow the propagation rates of small cracks due to the high density of grain boundaries or α plates acting as obstacles [30].
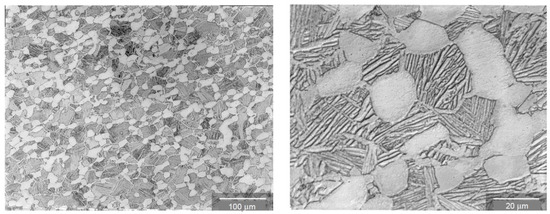
Figure 5.
Microstructure of Ti-6Al-4V with 60% primary α grain (light phase) and 40% of α + β Widmanstatten colonies (dark phase) [31].
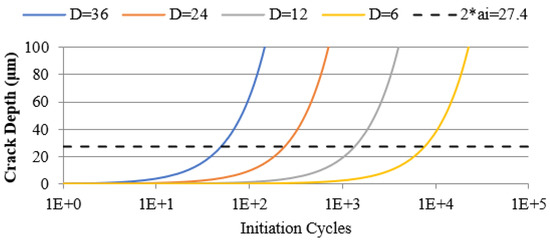
Figure 6.
Crack length vs. initiation cycles for different values of the grain size.
The fatigue crack propagation life was determined as the number of cycles needed for an initiated crack to grow to a critical crack size . The Paris equation is used to estimate the long crack growth fatigue life.
The stress intensity factor solution for a semielliptical surface crack was used to determine the stress intensity factor range in the Paris equation according to Murakami [32],
where is the stress range. is the boundary correction factor which is a polynomial function of the crack depth (c), the radius of the specimen ®, and the crack surface length (2a). Since the boundary correction factor depends on the crack size, Paris equation needs to be numerically integrated. A crack aspect ratio of c/a is assumed to be 1. The critical crack size, , was defined by [33] the following:
where is the fracture toughness, and is the maximum stress. Table 1 shows the material properties used in the initiation and propagation models. Five of the material properties are modeled as lognormal random variables whereas other parameters were assumed to be constant. The mean and standard deviation of the normal distribution for the random variables are given in Table 1. The Paris equation constants are derived from Ti-6Al-4V small [34,35,36] and large [9,33] crack growth rate data at room temperature with R = 0.1 as shown in Figure 7. Golden et al. [34] have shown that the small crack data regression line deviates from the long crack data below values of 10 MPa , thus a bilinear Paris relationship with is used in this study. In addition, the short crack threshold, , is assumed to be zero so that all initiated cracks will to grow until failure.
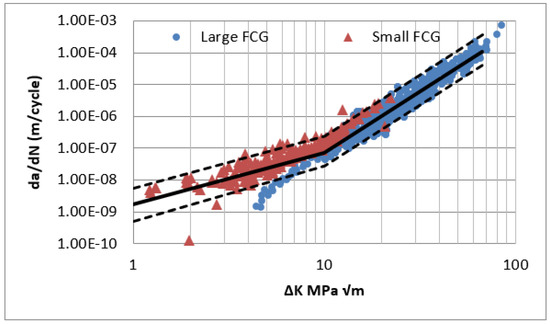
Figure 7.
Ti-6Al-4V bilinear Paris equation for small [34,35,36] and large [9,33] crack growth rates.
The initial crack size was determined by finding the crack size that corresponds to the minimum on the total fatigue life curve as shown in Figure 8. An initial crack size of approximately 30 μm was found using the bilinear Paris FCG model at a stress range of 800 MPa. It has been shown that cracks naturally initiate in order of grain size in titanium alloys [9,24]. Since the initiated crack sizes are small, there is a need for short crack growth models in the fatigue life prediction.
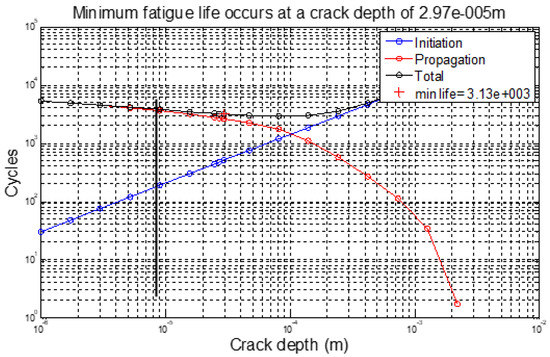
Figure 8.
Total fatigue life shows a minimum at a crack depth of at a stress range of 800 MPa.
The probabilistic method formulated in the previous sections was performed using an initial crack size of with 10,000 samples in the Monte Carlo simulation. Each of the two FCG models contain two random variables resulting in the fatigue life scatter calculations. The El Haddad model uses the fatigue limit and the long fatigue threshold, as well as the bilinear Paris equation with C1 and C2 as random variables. Since the probability distributions are assumed to be uncorrelated, only the C values in the bilinear Paris equation are modeled as random variables. The parameter estimates for n and C are jointly distributed. If they are modeled as separate distributions (as assumed in this study) an unrealistic error would result in the fatigue life [22].
Figure 9 compares the predicted mean life behavior of the two different FCG models compared to experimental S-N data [25,26,27,28] at different stress range values. As seen from the figure, the two FCG models predict a similar mean fatigue life. The probability of failure was determined at a stress range of 750 and 800 MPa and compared with experimental data as shown in Figure 10.
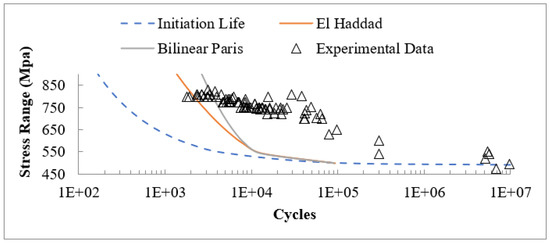
Figure 9.
Mean predicted fatigue life of the two FCG models ().
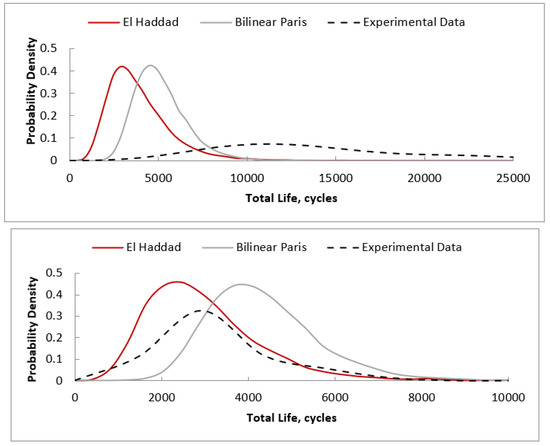
Figure 10.
Predicted probability of failure: 750 MPa (top) and 800 MPa (bottom) compared to experimental data.
5. Applicability in Turbine Rotor Analysis
A representative Ti-6Al-4V turbine disk was chosen as a test case to demonstrate the methodologies developed in the previous sections to determine the probability of failure subject to fatigue induced damage. The analysis was conducted for the U.S. Air Force in order to estimate the increase in risk when the disk remains in service beyond the safe-life limit. The component life is assumed to be extended to a “double life” of 16,000 cycles. The “double” life represents the extension of the LCF life from 8000 total accumulative cycles (TACS) to 16,000 TACS. The increased risk of component failure during its service life is maintained and delayed through the use of scheduled component inspections. Inspections are performed at 4000, 8000, and 12,000 cycles using both eddy current and ultrasonic non-destructive inspection techniques.
5.1. Finite Element Model
The finite element analysis (FEA) code ABAQUS 6.9-1 was utilized to determine the stress contour of the representative fan disk geometry. The turbine disk geometry, loading, and boundary conditions are comparative to a realistic turbine disk. Table 2 summarizes the Ti-6Al-4V material properties used in the FEA. A three-dimensional model consisting of a 1/14th section of the disk was meshed using 4-node linear tetrahedral elements. Since the bolt hole location had the highest stress, the mesh was refined around the bolt hole to ensure accurate results. Symmetry boundary conditions were applied to the cut surfaces of the disk. Another boundary condition was applied at the aft side of the disk to restrain the displacement in the direction perpendicular to the loading.
Table 2.
Ti-6Al-4V material properties [31].
The disk was run using a maximum speed of 7110 RPM, and a blade pressure load was simulated by applying a body force on the pins located in the bolt holes as shown in Figure 11. A blade load of 185 kN was applied in the radial direction on the pins, and a normal contact interaction was used with a 0.05 frictional factor for FE convergence. No thermal stresses were included since the disk analysis was assumed to be at isothermal temperature conditions. The maximum hoop stress converged at approximately 965 MPa located at the top of the bolt hole on the aft side of the disk bolt hole shown in Figure 11. A 2-dimensional section oriented on the maximum principal plane was taken for the probabilistic risk assessment as shown in Figure 11.
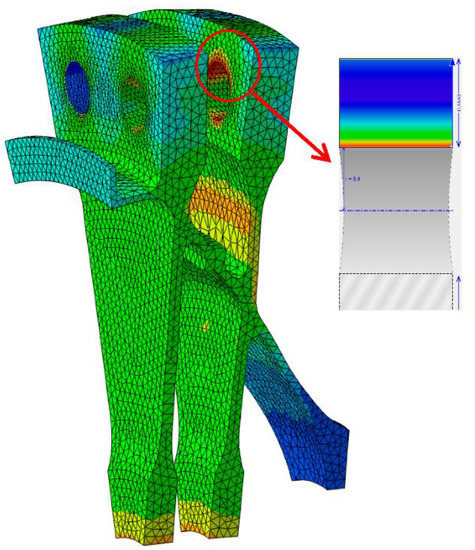
Figure 11.
Representative geometry has maximum principal stress of 965 MPa located on the bolt hole.
5.2. Risk Assessment
The fatigue damage program assumed that a single crack located in the highest stress region will dominate component failure since multiple micro cracks will either coalesce into a single crack or one crack will dominate over the others. A corner crack located at the bolt hole was assumed to be the dominating crack which corresponds to the location of the highest stress of 965 MPa. The probability of failure was determined using various inputs as shown in Figure 12. The loading spectrum was assumed to have a zero-maximum-zero loading, simulating a flight, with the disk material properties of a Ti-6Al-4V forging outlined in Table 2.
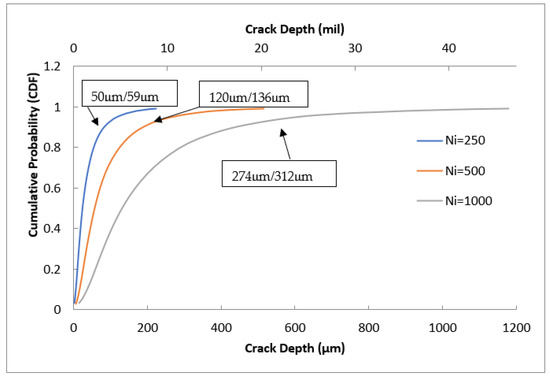
Figure 12.
Cumulative distribution function for three initiation lives (Ni) the mean and standard deviation (m/stdev).
The fatigue damage program created and analyzed the fatigue anomaly distribution for three different initiation lives: 250, 500, and 1000 cycles. A Monte Carlo simulation of 10,000 samples was used to determine the initiated crack size distributions, modeling grain size and fatigue limit as lognormal random variables. The initiated fatigue crack size distribution for the three initiation lives is given in Figure 12. The fatigue induced anomaly distributions show that the initiated cracks increase exponentially. The mean initial crack size is proportional to which is consistent with Equation (2).
The POF analysis was performed using the three crack size distributions with mean FCG values in the bilinear Paris equation. Figure 13 shows that three anomaly distributions have a large impact on POF calculations. Additionally, the figure also shows the total life The maximum crack sizes are shown in the created anomaly distributions. As seen from the figure, the POF starts increasing rapidly as the defect size increases. This phenomenon takes into account that a crack is “initiated”, which has a major impact on the total life affecting the POF of the components. The anomaly distribution corresponding to the initiation life of 250 cycles best represents the experimental data [24], which have a mean and standard deviation of 50 μm and 59 μm, respectively. Therefore, the fatigue anomaly distribution using an initiation life of 250 cycles is used in the remainder of the POF analysis. Next, the short crack growth rates were investigated for the POF calculations.
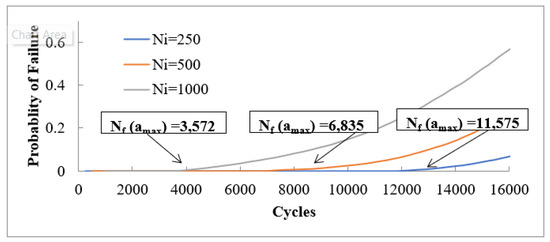
Figure 13.
Probability of failure increases as the crack initiation life increases.
The fatigue damage program was run using the bilinear Paris equation and the El Haddad model to account for accelerated short crack growth rates in the POF calculations. Figure 14 compares the results of two short crack growth models and the long crack growth model (Paris equation). The figure also shows the total life of the maximum crack size for the three FCG models. The Bilinear Paris and El Haddad short FCG models accelerate the fatigue life 20% to 30% faster than the long crack growth model, respectively. The El Haddad results are more conservative since the anomaly distribution has been shifted by the mean short crack parameter, , which further demonstrates that the POF is sensitive to crack size.
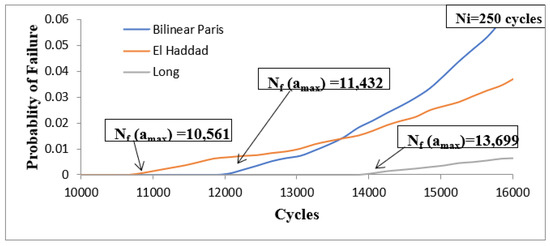
Figure 14.
Probability of Failure of two short FCG models.
6. Discussion
Fatigue models were developed to assess crack initiation and propagation life of a model gas turbine fan disk. A micromechanical initiation model relates crack initiation life to crack depth by using grain-size material parameters. The fatigue propagation life was characterized by both long and short crack growth models. Short fatigue crack growth models accounted for the anomalous behavior of small-initiated cracks, while a Paris equation described the long crack growth.
A probabilistic framework was developed using the fatigue models to determine the probability of failure for a Ti-6Al-4V forging. Grain size was assumed as one of the dominating parameters in the crack initiation phase. It was modeled as a lognormal random variable. Once the initiated crack size distribution was known, DARWIN® was used as the main probabilistic engine for the probability of failure determination The fatigue damage framework takes into account short crack growth and scatter using the El Haddad correction method and the bilinear Paris FCG equation. The El Haddad equation uses long crack growth threshold and endurance/fatigue limit as random variables, whereas the Paris equation uses the constants to determine the scatter in FCG.
The predicted probability of failure results was compared with the experimental round bar specimen data. The predicted life model has a good correlation with the experimental data at higher stress levels (above 750 MPa) but starts to diverge as stress levels decrease as shown in Figure 9 and Figure 10. Jha et al. [37] has shown that there is a bimodal effect on fatigue since either initiation or propagation starts to dominate the failure mode. He represented fatigue lifetime variability as a separation/overlap of a crack growth-controlled life-limiting mechanism and a mean-lifetime dominating behavior. The micro-structure and external variables produce different responses in the mean and life-limiting behaviors. Figure 15 illustrates the separation in the two mechanisms for the fatigue lifetime as a function of stress in an α + β titanium alloy. They implemented a bimodal probability density, which represented the superposition of the crack growth and mean-life dominating densities, as demonstrated in Figure 16.
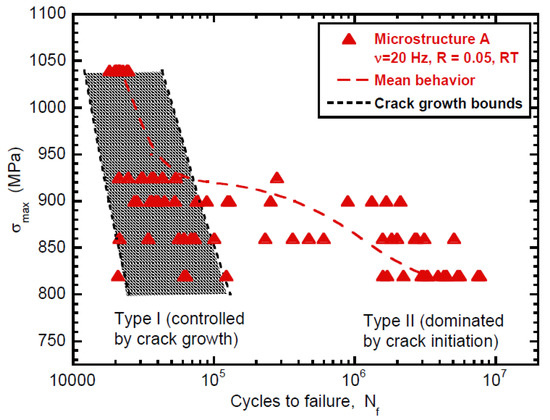
Figure 15.
Stress vs. lifetime behavior demonstrating the separation of crack initiation dominated behavior (Type II) from the crack growth-controlled mechanism (Type I) with decreasing stress level [37].
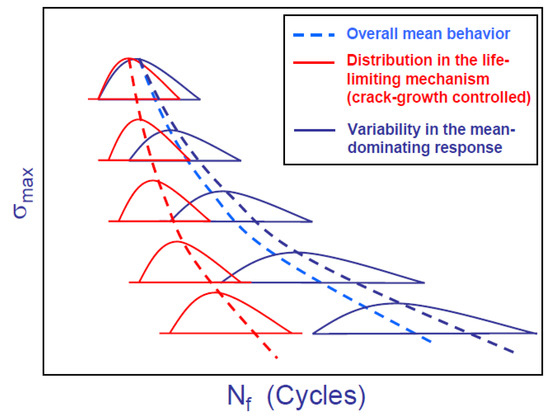
Figure 16.
Illustration of the proposed description of fatigue variability behavior with respect to stress level [37].
Figure 15 and Figure 16 indicate that the mean-lifetime and the life-limiting responses overlap with the crack growth range at higher stress levels. As stress decreases, the mean behavior separates from crack growth-controlled to crack initiation. The predicted fatigue life variability shown in Figure 10 shows a lognormal probability of failure and does not reflect a bimodal distribution. In the current study, the strain level is close to yield (0.002); therefore, the bimodal distribution does not apply and both the life-limiting response and the mean-lifetime dominating behavior are assumed to coincide.
7. Conclusions
The following main conclusions can be drawn from this study:
- Superposition of crack growth and initiation life was able to predict fatigue lifetime at high stress. Fatigue life at lower stresses is controlled by the combination of crack growth and mean-dominating behavior governed by crack initiation.
- The probability of failure is sensitive to material properties (e.g., grain size) and the crack size at initiation.
- Short fatigue crack growth models are necessary to reduce non-conservative life predictions.
- The purposed probabilistic method can prove to be very useful for predicting initial crack distribution for lifetime predictions, which can further be used to establish an enhanced inspection planning.
Author Contributions
Conceptualization, T.G.; methodology, T.G.; software, J.A.C.; validation, T.G. and J.A.C.; formal analysis, J.A.C.; investigation, J.A.C.; resources, T.G.; data curation, T.G.; writing—original draft preparation, J.A.C.; writing—review and editing, T.G.; visualization, T.G.; supervision, T.G.; project administration, T.G.; funding acquisition, T.G. All authors have read and agreed to the published version of the manuscript.
Funding
This research was funded by Universal Technology Corporation, as a subcontract from the United States Air Force, grant number (668831) which ended 12/31/2012.
Institutional Review Board Statement
Not applicable.
Informed Consent Statement
Not applicable.
Data Availability Statement
Not applicable.
Conflicts of Interest
The authors declare no conflict of interest.
References
- Kearsey, R.M.; Koul, A.K.; Beddoes, J.V.; Cooper, C. Development and Characterization of a Damage Tolerant Microstructure for a Nickel Base Turbine Disc Alloy. Superalloys 2000 2000. [Google Scholar] [CrossRef]
- Suresh, S. Fatigue of Materials; Cambridge University Press: Cambridge, UK, 1998. [Google Scholar]
- Kappas, J. Review of Risk and Reliability Methods for Aircraft Gas Turbine Engines; DSTO-TR-1306; Aeronautical and Maritime Research Laboratory: Fisherman’s Bend, VIC, Australia, 2002. [Google Scholar]
- Immarigeon, J.-P.; Koul, A.K.; Beres, W.; Au, P.; Fahr, A.; Wallace, W.; Patnaik, P.C.; THamburaj, R. Life Cycle Management Strategies for Aging Engines, NATO-RTO-MP-079(11) Lecture Series. In Proceedings of the Life Management Techniques for Ageing Air Vehicles, Manchester, UK, 8–11 October 2001. [Google Scholar]
- Vukelich, S. Engine Life Extension Through the Use of Structural Assessment, Non-Destructive Inspection, and Material Characterization, NATO-RTO-MP-079(11) Lecture Series. In Proceedings of the Life Management Techniques for Ageing Air Vehicles, Manchester, UK, 8–11 October 2001. [Google Scholar]
- Millwater, H.R.; Enright, M.P.; Fitch, S.H.K. Convergent Zone-Refinement Method for Risk Assessment of Gas Turbine Disks Subject to Low-Frequency Metallurgical Defects. J. Eng. Gas Turbines Power 2007, 129, 827–835. [Google Scholar] [CrossRef][Green Version]
- U.S. Department of Transportation, Federal Aviation Administration. Damage Tolerance for High Energy Turbine Engine Rotors; Federal Aviation Administration Advisory Circular; U.S. Department of Transportation, Federal Aviation Administration: Washington, DC, USA, 2001.
- U.S. Department of Transportation, Federal Aviation Administration. Damage Tolerance of Hole Features in High-Energy Turbine Engine Rotors; Federal Aviation Administration Advisory Circular; U.S. Department of Transportation, Federal Aviation Administration: Washington, DC, USA, 2009.
- Chan, K.S.; Enright, M.P. Probabilistic Micromechanical Modeling of Fatigue-Life Variability in an α+β Ti Alloy. Metall. Mater. Trans. A 2005, 36A, 2621–2631. [Google Scholar] [CrossRef]
- Antolovich, S.D.; Jayaraman, N. The Effect of Microstructure on the Fatigue Behavior of NI Base Superalloys. In Fatigue; Burke, J.J., Weiss, V., Eds.; Sagamore Army Materials Research Conference Proceedings; Springer: Boston, MA, USA, 1983; Volume 27. [Google Scholar] [CrossRef]
- Kobayashi, K.; Yamaguchi, K.; Hayakawa, M.; Kimura, M. Grain size effect on high-temperature fatigue properties of alloy718. Mater. Lett. 2005, 59, 383–386. [Google Scholar] [CrossRef]
- Tanaka, K.; Mura, T. A dislocation model for fatigue crack initiation. J. Appl. Mech. 1981, 48, 97–103. [Google Scholar] [CrossRef]
- Chan, K.S. A microstructure-based fatigue-crack-initiation model. Met. Mater. Trans. A 2003, 34, 43–58. [Google Scholar] [CrossRef]
- McClung, R.C.; Enright, M.P.; Liang, W. Integration of NASA-Developed Lifing Technology for PM Alloys into DARWIN®; NASA/CR; National Aeronautics and Space Administration: Cleveland, OH, USA, 2011. [Google Scholar]
- Leis, B.N.; Kanninen, M.F.; Hopper, A.T.; Ahmad, J.; Broek, D. A Critical Review of the Short Crack Problem in Fatigue. Materials Laboratory; Air Force Wright Aeronautical Laboratories: Wright-Patterson AFB, OH, USA, 1983. [Google Scholar]
- Haddad, E.L.; Topper, M.H.; Smith, K.N. Prediction of no propagating cracks. Eng. Fract. Mech. 1979, 11, 573–584. [Google Scholar] [CrossRef]
- Kitagawa, H.; Takahashi, S. Applicability of fracture mechanics to vary small cracks or cracks in early stage. In Proceedings of the 2nd International Conference on Mechanical Behavior of Materials, Boston, MA, USA, 16–20 August 1976; ASM International: Materials Park, OH, USA, 1976. [Google Scholar]
- Goswami, T. Fatigue crack growth behavior of Ti-6Al-4V alloy forging. Mater. Des. 2003, 24, 423–433. [Google Scholar] [CrossRef]
- Southwest Research Institute. DARWIN 7.0 Theory Manual; Southwest Research Institute: San Antonio, TX, USA, 2010. [Google Scholar]
- Garcia, D.B.; Grandt, A.F. Application of a total life prediction model for fretting fatigue in Ti-6Al-4V. Int. J. Fatigue 2006, 29, 1311–1318. [Google Scholar] [CrossRef]
- Arora, A.S. Introduction to Optimum Design, 2nd ed.; Elseveier Academic Press Inc.: Amsterdam, The Netherlands, 2004. [Google Scholar]
- Annis, C. Probabilistic Life Prediction Isn’t as Easy as It Looks. J. ASTM Int. 2004, 1, 11557. [Google Scholar] [CrossRef]
- Liu, Y.; Mahadevan, S. Probabilistic fatigue life prediction using an equivalent initial flaw size distribution. Int. J. Fatigue 2009, 31, 476–487. [Google Scholar] [CrossRef]
- Oberwinkler, B.; Riedler, M.; Eichlseder, W. Importance of local microstructure for damage tolerant light weight design of Ti-6Al-4V forgings. Int. J. Fatigue 2010, 32, 808–814. [Google Scholar] [CrossRef]
- Mom, A.J.A.; Reizenne, M.D.; North Atlantic Treaty Organization. Advisory Group for Aerospace Research and Development. AGARD-R-766 Engine Disc Cooperative Test Program; AGARD: Neuilly-sur-Seine, France, 1988. [Google Scholar]
- Kalluri, S.; Telesman, J. Characterization of Fatigue Crack Initiation and Propagation in Ti-6Al-4V With Electrical Potential Drop Technique. NASA Technical Memorandum 100877; NASA: Washington, DC, USA, 1988.
- Yamashita, Y.; Ueda, Y.; Kuroki, H.; Shinozaki, M. Fatigue life prediction of small notched Ti-6Al-4V specimens using critical distance. Eng. Fract. Mech. 2010, 77, 1439–1453. [Google Scholar] [CrossRef]
- Peters, J.O.; Roder, O.; Boyce, B.L.; Thompson, A.W.; Ritchie, R.O. Role of foreign-object damage on thresholds for high-cycle fatigue in Ti-6Al-4V. Metall. Mater. Trans. A 2000, 31, A1571. [Google Scholar] [CrossRef]
- Dieter, G.E. Mechanical Metallurgy, 3rd ed.; McGraw-Hill Book Co.: New York, NY, USA, 1986. [Google Scholar]
- Nalla, R.K.; Boyce, B.L.; Campbell, J.P.; Peters, J.O.; Richie, R.O. Influence of Microstructure on High-Cycle Fatigue of Ti-6Al-4V: Bimodal vs Lamellar Structures. J. Metall. Mater. Trans. A 2002, 33A, 899–918. [Google Scholar] [CrossRef]
- Southwest Research Institute; Allied Signal; General Electric; Pratt & Whitney; Rolls-Royce Allison; Scientific Forming Technologies. Turbine Rotor Material Design, Phase 1 Final Report; FAA Grant 95-G-041; Federal Aviation Administration: Washington, DC, USA, 2000.
- Murakami, Y. Stress Intensity Factors Handbook; Peramon Press: London, UK, 1981; Volume 2, pp. 654–656. [Google Scholar]
- Stephens, R.R. Metal Fatigue in Engineering. In Advanced Methods for Cascade Testing; North Atlantic Treaty Organization, Advisory Group for Aerospace Research & Development: Neuilly sur Seine, France, 1980. [Google Scholar]
- Golden, P.J.; Reji, J.; Porter, J. Variability in Room Temperature Fatigue Life of Alpha + Beta Processed Ti-6AL-4V. Int. J. Fatigue 2009, 31, 1764–1770. [Google Scholar] [CrossRef]
- Caton, M.; John, R.; Porter, W.; Burba, M. Stress ratio effects on small fatigue crack growth in Ti–6Al–4V. Int. J. Fatigue 2012, 38, 36–45. [Google Scholar] [CrossRef]
- Lenets, Y.; Bellows, R.S.; Merrick, H.F. Propagation Behavior of Naturally Initiated Fatigue Cracks in Round Bars of Ti-6Al-4V. In Proceedings of the 5th National Turbine Engine High Cycle Fatigue Conference, Chandler, AZ, USA, 7–9 March 2000. [Google Scholar]
- Jha, S.K.; Larsen, J.M.; Rosenberger, A.H. Towards a physics-based description of fatigue variability behavior in probabilistic life-prediction. Eng. Fract. Mech. 2009, 76, 681–694. [Google Scholar] [CrossRef]
- Coro, A.; Abasolo, M.; Aguirrebeitia, J.; López de Lacalle, L.N. Inspection scheduling based on reliability updating of gas turbine welded structures. Adv. Mech. Eng. 2019, 11, 1–20. [Google Scholar] [CrossRef]
- Coro, A.; Macareno, L.M.; Aguirrebeitia, J.; de Lacalle, L.N.L. A Methodology to Evaluate the Reliability Impact of the Replacement of Welded Components by Additive Manufacturing Spare Parts. Metals 2019, 9, 932. [Google Scholar] [CrossRef]
- Whitney-Rawls, A.; Copp, P.; Carter, J.; Goswami, T. Comparison of aero engine component lifing methods. Mater. Eng. Res. 2022, 4, 201–222. [Google Scholar] [CrossRef]
- Copp, P.; Whitney-Rawls, A.; Carter, J.; Goswami, T. Application of probabilistic methods to turbine engine disk life prediction and risk assessment. Res. Intell. Manuf. Assem. 2022, 1, 3–19. [Google Scholar] [CrossRef]
- Thomas, M.; Carter, J.; Matson, L.; Goswam, T. Feature-Based Discretization of a Turbine Disk for Probabilistic Risk Assessment. Mech. Mater. Sci. Eng. J. 2018, 14. [Google Scholar] [CrossRef]
- Carter, J.A.; Thomas, M.A.; Goswami, T.; Fecke, T. Probabilistic risk assessment of a turbine disk. In Proceedings of the International Symposium on Fatigue of Materials II: Advances and Emergences in Understanding, Pittsburgh, PA, USA, 7–11 October 2012; Imam, A., Srivatsan, T.S., Srinivasan, R., Eds.; The Minerals, Metals and Materials Society; Springer: Cham, Switzerland, 2012; pp. 71–86. [Google Scholar]
- Goswami, T. Dwell fatigue design criteria. In Proceedings of the International Symposium on Fatigue of Materials II: Advances and Emergences in Understanding, Pittsburgh, PA, USA, 7–11 October 2012; Imam, A., Srivatsan, T.S., Srinivasan, R., Eds.; The Minerals, Metals and Materials Society; Springer: Cham, Switzerland, 2012; pp. 49–69. [Google Scholar]
Publisher’s Note: MDPI stays neutral with regard to jurisdictional claims in published maps and institutional affiliations. |
© 2022 by the authors. Licensee MDPI, Basel, Switzerland. This article is an open access article distributed under the terms and conditions of the Creative Commons Attribution (CC BY) license (https://creativecommons.org/licenses/by/4.0/).