Abstract
Laser Powder Bed Fusion (LPBF) technologies such as Selective Laser Melting (SLM) are being increasingly considered as viable production routes. This paradigm change demands an in-depth understanding of the fabrication process and variables, as previous studies have shown that energy density calculation alone is insufficient, because parts fabricated using similar energy density, but using different combinations of parameters, can display significantly different properties and dimensions. Thin-walled parts are particularly influenced by processing parameters; in this sense, this study explores the influence of laser power and scan speed on the dimensions of Ti6Al4V thin-walled tubes. Predictive models for manufacturing Ti6Al4V thin-walled tubes were developed using Response Surface Methodology (RSM), and the most influential (single and combined) factors were determined using Analysis of Variance (ANOVA). Three models were obtained: for the wall melt zone thickness, the total wall thickness, and the hole width.
1. Introduction
Ti alloys—particularly Ti6Al4V—are currently the main choice of manufacturers of endosseous implants, mainly due to their high corrosion resistance and biocompatibility [1,2]. A current trend in this field is to add novel functions to these implants—either biological or chemical (e.g., drug delivery sites [3])—and also to tailor some of their properties, such as roughness, stiffness, etc. [4,5,6]. The design and fabrication of multifunctional implants with active roles inside the patient, instead of merely being integrated into the host, can represent an outstanding improvement compared to currently available solutions. This work is focused on the fabrication of Ti6Al4V thin-walled hollow parts that can be fabricated in the outer region of an endosseous implant, for serving the specific function of acting as containers for a drug or biological agent. These agents could elicit an enhanced biological response, by acting against pathogens, or by stimulating cellular response.
Metallic thin-walled parts can be effectively manufactured by Additive Manufacturing (AM) Laser Powder Bed Fusion (LPBF) technologies such as Selective Laser Melting (SLM). This layer-by-layer process replicates Computer-Aided Design (CAD) data. Under an inert atmosphere, a build platform is heated, above which a thin layer of powder is spread. The parts’ production proceeds using a laser to selectively melt the powder bed, according to a slicing procedure previously performed. Then, the platform descends (Z-axis) to a predefined height to provide a specific layer thickness via the recoating system. This process continues iteratively until achieving the final part [7,8,9].
This technology’s flexibility can be used to fabricate lattice structures [10,11] to obtain tailored mechanical properties, high strength-to-weight ratios, and other thin-walled parts, such as thin-walled tubes or channels [3,7,12,13]. Additionally, while for some applications a near-net-shaped part is obtained, for others some post-processing—such as machining—is needed to guarantee the dimensional and surface quality [13,14]. In fact, AM has already been used as a manufacturing process for fabricating commercially available Ti6Al4V plates, screws, and staples for foot and ankle surgeries [15], as well as acetabular parts for hip surgery [16,17]. Regarding thin-walled hollow parts for biomedical applications, AM can present several advantages, by either eliminating or significantly reducing the need for massive machining to obtain a desired thickness or surface roughness. This aspect has a significant impact on the cost per part, as well as waste reduction (e.g., metal scrap and cutting fluid, the latter correlated to pathogen contamination on implants’ surfaces) [18].
Parameters such as laser power (W), scan speed (mm/s), hatch spacing (µm), and layer thickness (µm) are considered to be the key parameters, and are commonly selected and their effects analyzed through the calculation of the delivered volumetric energy density (J/mm3) [14,19,20]. In addition, planar (J/mm2) and linear (J/mm) energy density can also be determined, as they are useful for the analysis of single tracks and thin features [21]. SLM Ti6Al4V thin-walled parts are critically reliant on processing and material parameters, as their reduced thickness obliges an extremely efficient densification and bond between the successively scanned layers. Regarding the feedstock materials for SLM, finer powders are usually selected for obtaining higher resolution, combined with reduced layer thickness, which is also important to address the powder size distribution to prevent particle segregation [19].
Several studies report that SLM parameters (e.g., power, scan spacing, scan speed) influence Ti6Al4V parts’ density and mechanical properties [22,23,24,25]; however, for thin-walled parts, such information is seldom found [7,12]. Furthermore, most of the studies assess the influence of individual SLM processing parameters, but their interactions are not thoroughly explored. As a matter of fact, the same laser power can have extremely different effects (on the density and thickness of a thin-walled part) when combined with drastically different scan speeds.
In this work, Ti6Al4V thin-walled tubes’ dimensional aspects (i.e., wall thickness and hole length) were analyzed and correlated with the SLM parameters (i.e., laser power and scanning speed) used for their fabrication. Response Surface Methodology (RSM) was applied to model the effects of SLM parameters on Ti6Al4V thin-walled tubes’ dimensions. These models are powerful tools that can avoid the extensive experimental testing required for obtaining an optimized part via SLM.
2. Experimental Procedure
2.1. SLM Fabrication Details
For the Ti6Al4V thin-walled tubes’ fabrication, powdered alloy (D90 of 40 µm) from SLM Solutions GmbH, Lübeck, Germany was used. These parts were made under an argon flow on an equipment from SLM Solutions GmbH, Lübeck, Germany apparatus (model 125 HL [8]) equipped with an 87 μm spot Yb-Fiber laser.
Thin-walled tubes were designed with a rectangular section (0.4 mm × 5 mm) and 5 mm height, excluding the supports, which had 4 mm height. Figure 1 shows the laser path used for the fabrication that was performed, exclusively defining the volume border of the part.
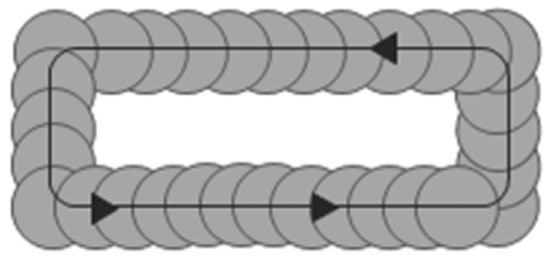
Figure 1.
Schematic representation of the laser path during the fabrication of the thin-walled tubes.
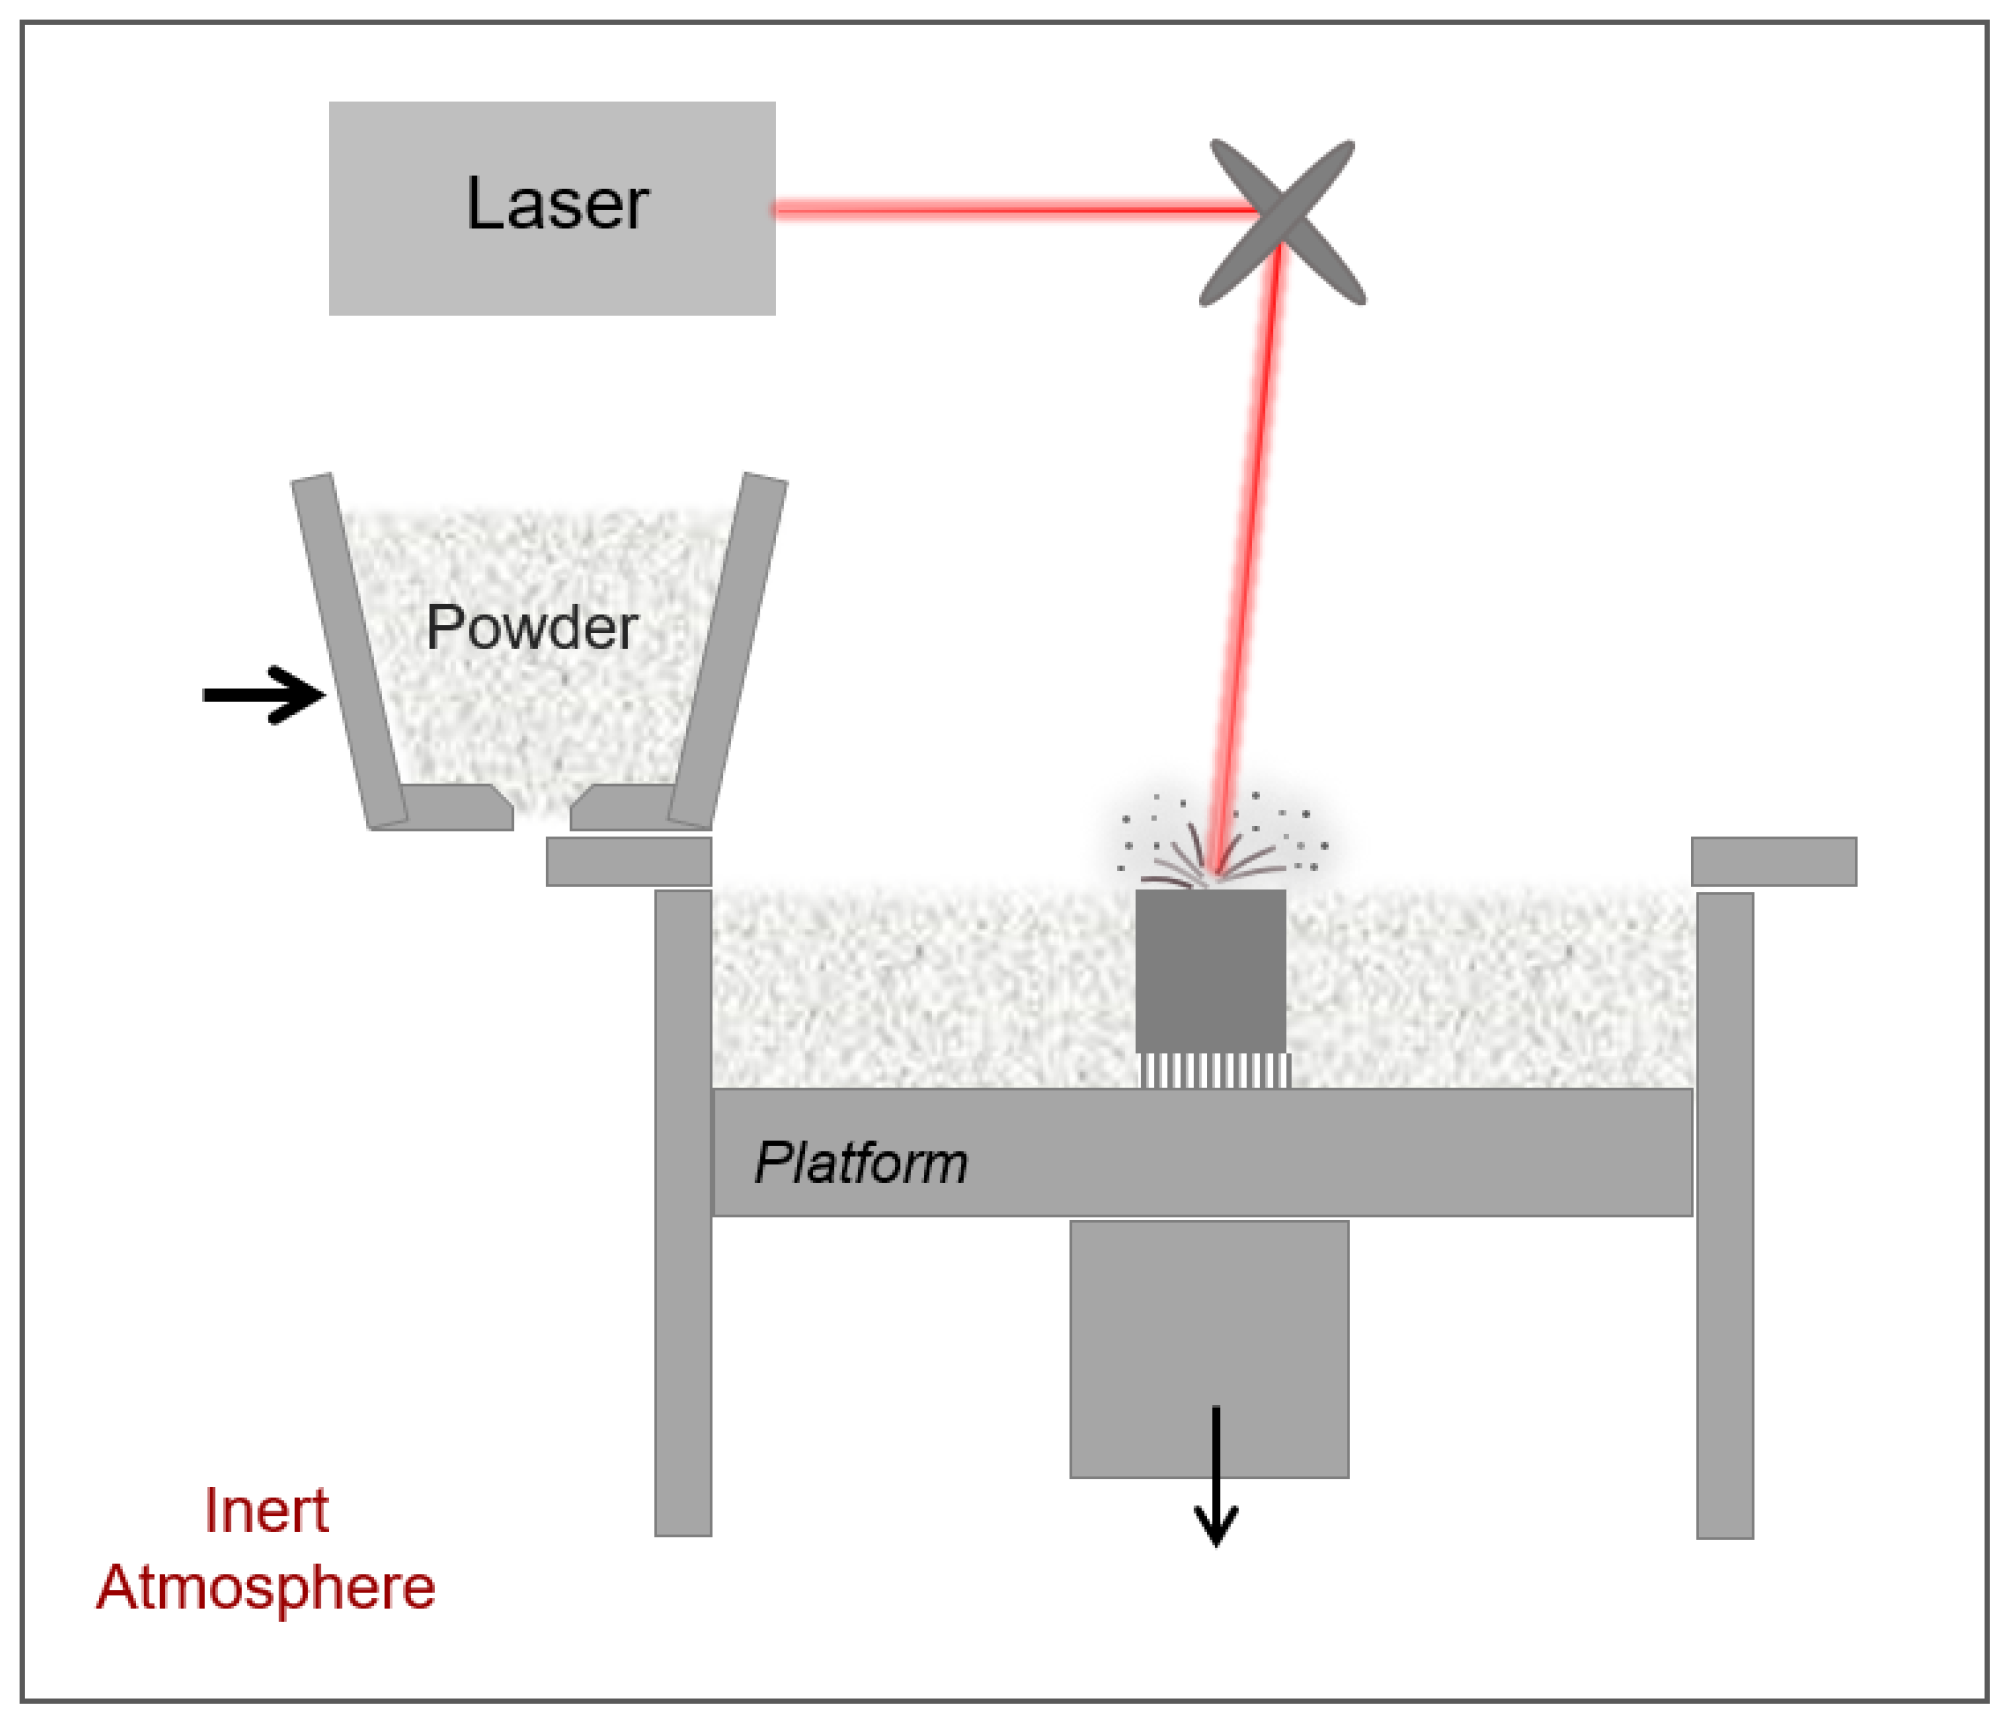
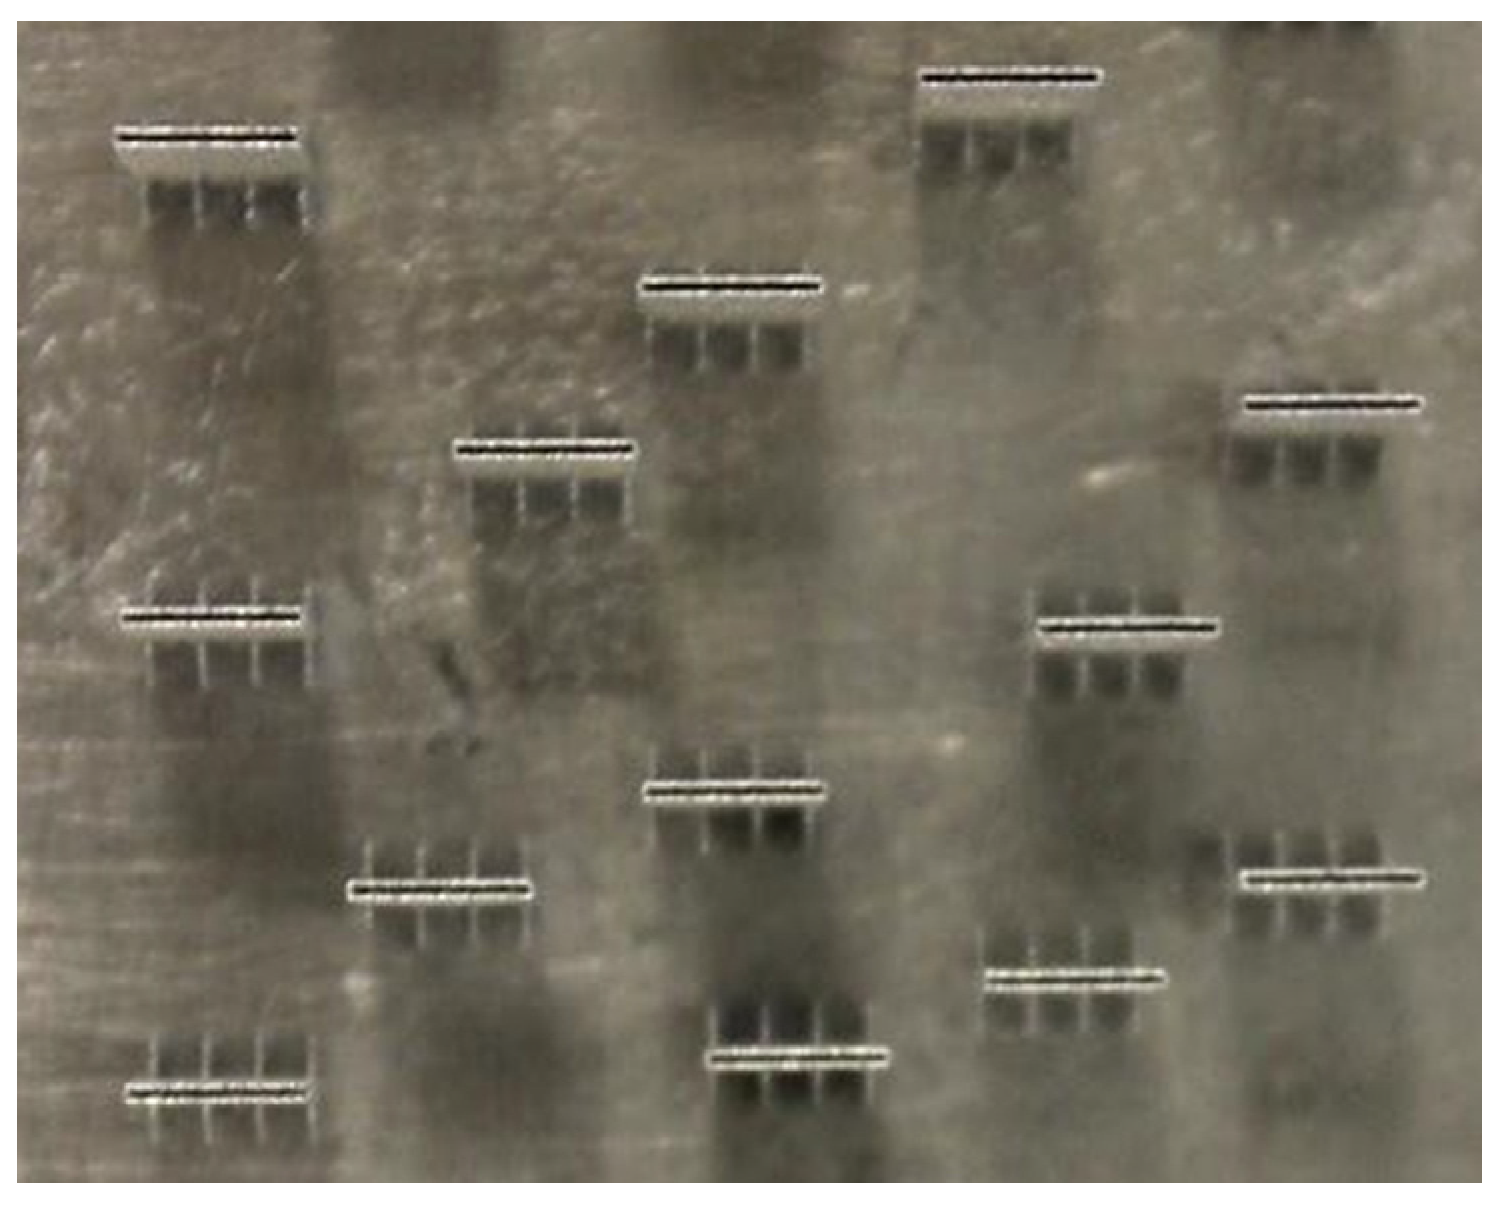
Figure 2 presents a schematic representation of the SLM process, while Figure 3 shows some examples of these rectangular thin-walled tubes after fabrication, still in the production platform, which was set at a constant temperature of 200 °C during fabrication.
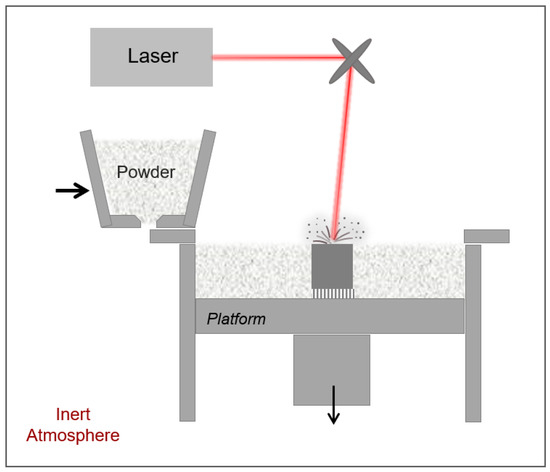
Figure 2.
Schematic representation of the Selective Laser Melting (SLM) process.
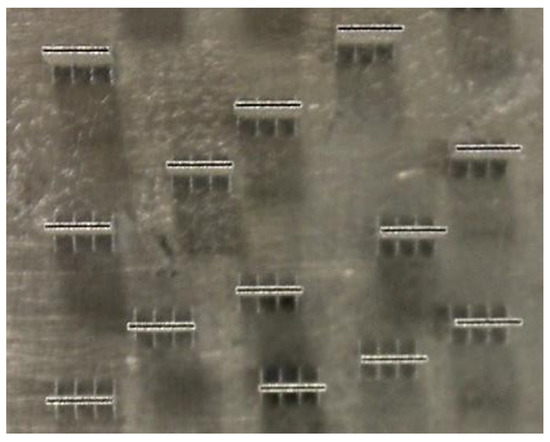
Figure 3.
Ti6Al4V thin-walled tubes after SLM fabrication.
In order to assess the ability of the Selective Laser Melting (SLM) technology to manufacture Ti6Al4V thin-walled tubes, with walls ranging from 100 to 300 μm in thickness, several experiments were planned. An experimental field was defined for fabrication, defining a laser power range between 50 and 100 W, and a scan speed range from 300 to 1250 mm/s, covering a liner energy density within the range 0.072–0.333 J/mm. Table 1 presents the plan of experiments for the fabrication of the thin-walled tubes, where different processing parameters were combined in different experiments to assess their influence on the fabricated parts’ dimensional aspects. A constant layer thickness of 30 μm was used.

Table 1.
Plan of experiments for the fabrication of Ti6Al4V thin-walled tubes.
2.2. Dimensional Analysis
The manufactured Ti6Al4V thin-walled tubes’ dimensions (i.e., wall thickness and hole length) were determined by analyzing Scanning Electron Microscopy (SEM) top-view images, acquired on a NanoSEM FEI Nova 200, from FEI, Hillsboro, OR, USA. For each experiment, each result is presented as an average of four measurements. This analysis was performed to determine the optimal combination of parameters for obtaining tubes of the desired thickness (between 100 and 300 µm), and also to determine the minimum thickness obtainable using commercial equipment with an 87 μm spot laser beam.
Response Surface Methodology (RSM) was used to model the effects of two independent variables (called factors) and their interactions on the thickness (response variable) of these thin-walled tubes. The two independent variables were chosen for the statistical experiment design as follows: laser power (X1) and scan speed (X2).
The most common model used to describe the relationship between independent variables and response variables is the quadratic regression model, which can be expressed as follows:
where Y is the response variable, and are dimensionless coded independent variables, k is the number of independent variables, is the constant coefficient, is the random error, and , , and are coefficients for the linear, quadratic, and interaction effects, respectively.
Statistical analysis was performed using the statistical software R (R statistical software, version 4.1.2., R Foundation for Statistical Computing, Vienna, Austria). Analysis of Variance (ANOVA) was performed to evaluate the statistical significance of the model. The proportion of variance explained by the models obtained was given by the multiple coefficient of determination, R2, and the adjusted coefficient of determination (adjusted R2), whereas the adequacy of the model was determined by a lack of fit test. Residual analysis was conducted to validate the assumptions used in the Analysis of Variance (ANOVA). The p-values for the different model terms were analyzed to determine the probability that the manufacturing parameter (single or combined) affects the measured feature.
Three different measurements were made: wall melt zone thickness (white dotted arrow in Figure 4), total wall thickness (yellow dotted arrow in Figure 4), and hole dimensions (white arrow in Figure 3). These results are presented as means and standard deviations, obtained from eight measurements for each feature.
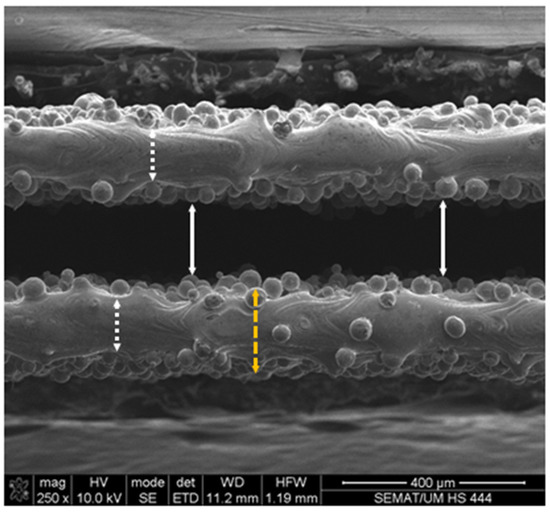
Figure 4.
Measurements performed on the Ti6Al4V thin-walled tubes.
3. Results and Discussion
3.1. Dimensional Analysis
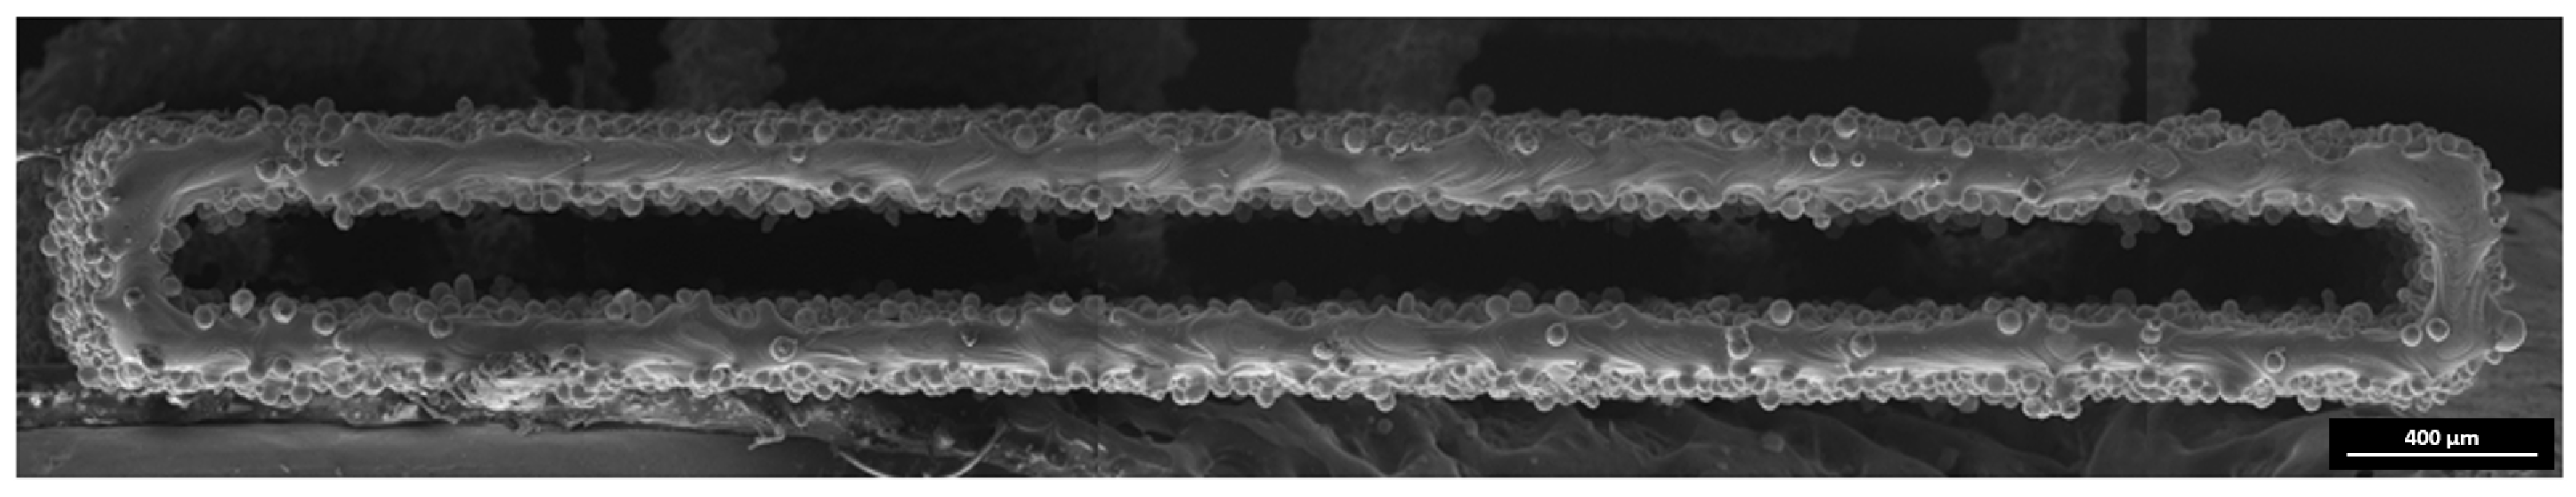
Figure 5 shows an example of a thin-walled tube that demonstrates that SLM technology is suited for the fabrication of these thin-walled features, since no building defects such as incomplete melting or porosity were found. These images from the top (final) face of the thin-walled tube show a typical melt track (with little adhered powder), allowing the laser spot path to be perceived.
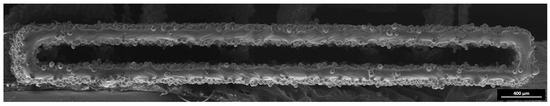
Figure 5.
Thin-walled tube of a rectangular section built in experiment number 9 (80 W/300 mm/s).
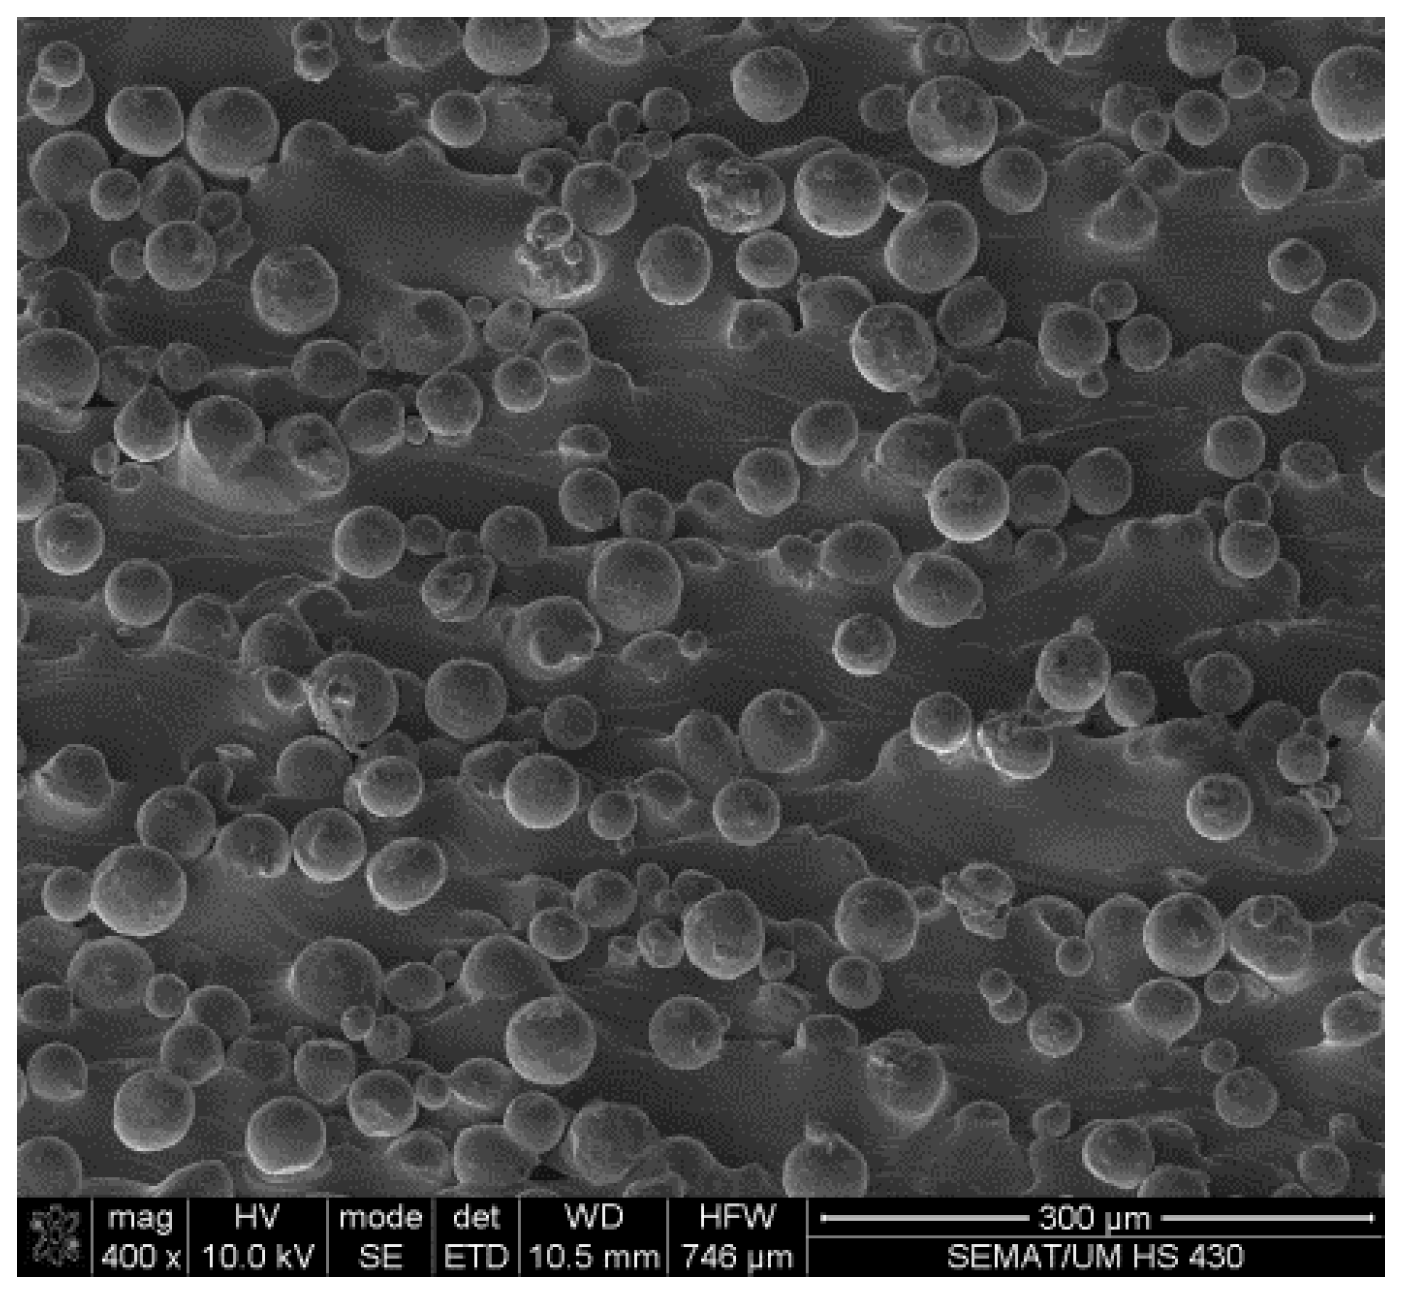
The SLM parts present a typical rough outer surface—a consequence of the partial melting of adjacent particles from the powder bed—in the vicinity of the melted volume (Figure 6 shows an example of the lateral surfaces of a thin-walled tube). This aspect explains the differences found between the melt thickness and the total thickness of the walls of the fabricated thin-walled tubes, and as stated by M. Leary [26] this can compromise both the function and tolerances of these 3D-printed parts, making it necessary to know and anticipate this outcome to obtain the required surface properties and/or tolerances.

Figure 6.
Outer wall of a thin-walled tube built in experiment number 9 (80 W/300 mm/s).
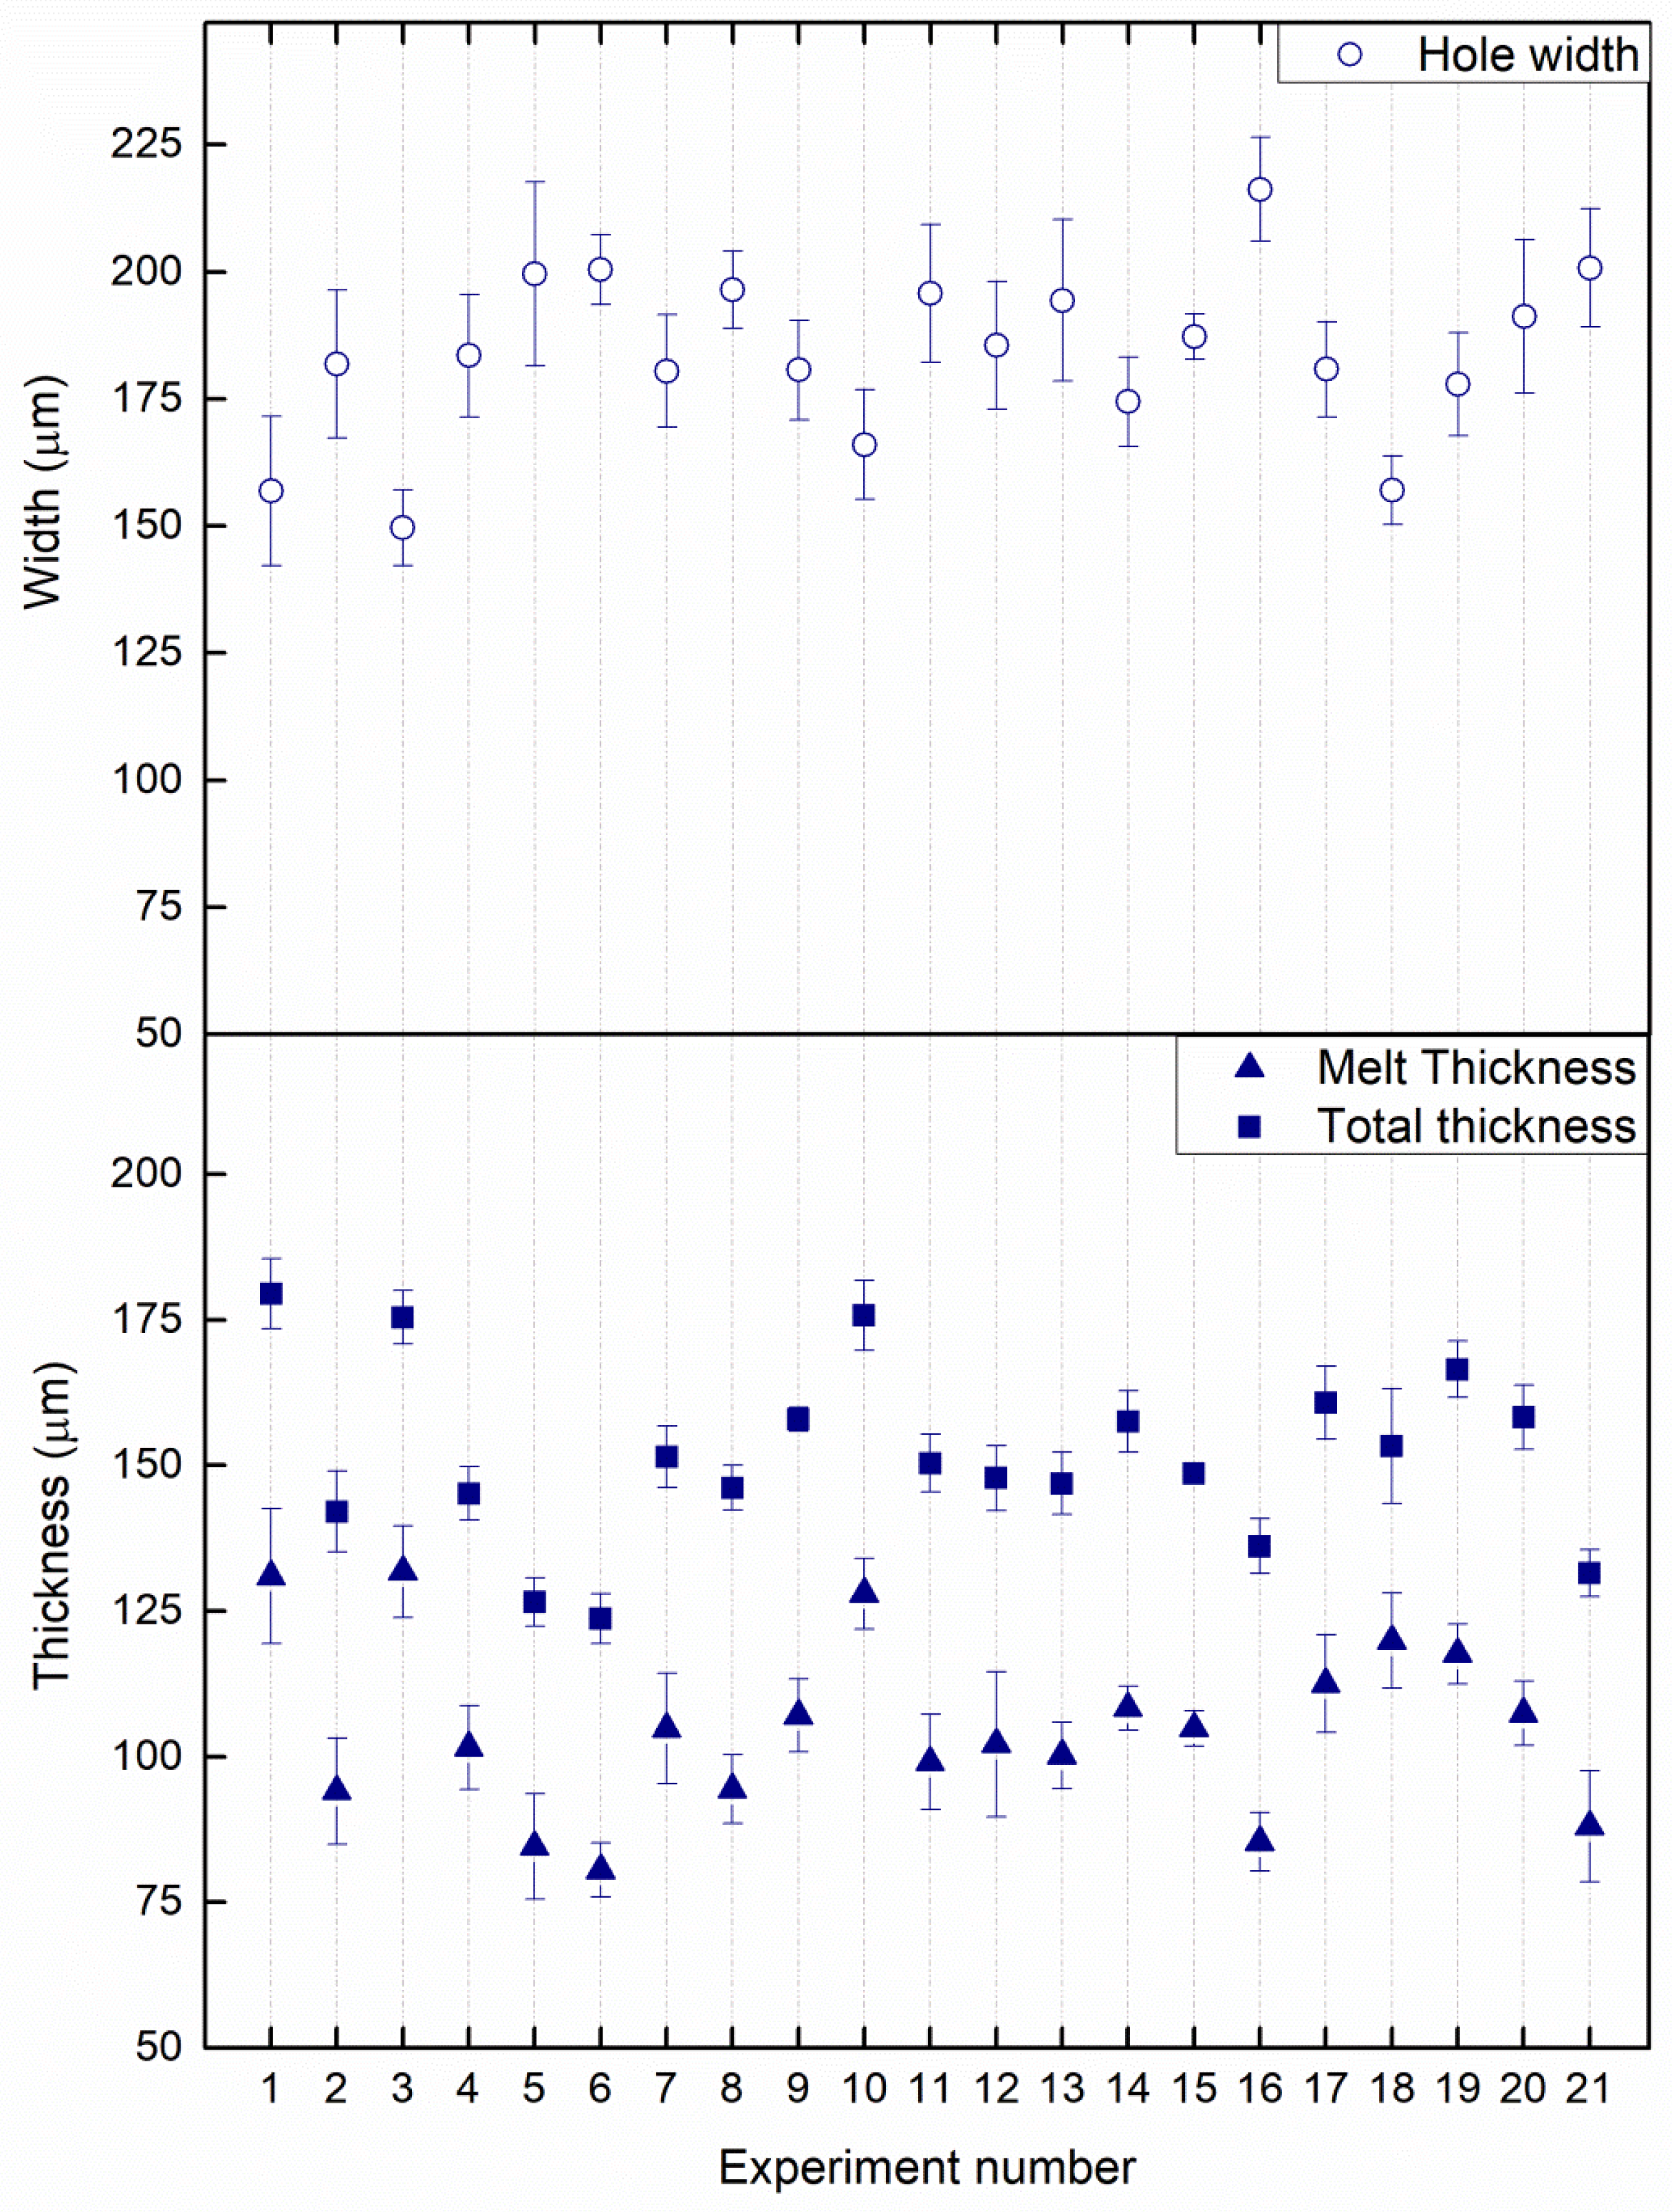
The average results of the measurements performed on the thin-walled tubes (i.e., melt thickness, total thickness, and hole width) are shown in Figure 7.
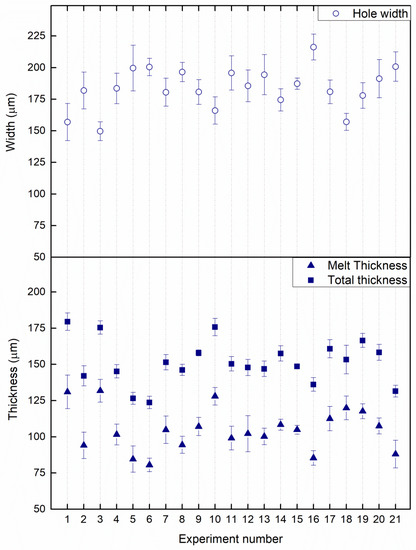
Figure 7.
Dimensional results obtained from the thin-walled tubes.
Considering all of the experiments, the average difference between the melt thickness and the total thickness was 46.60 ± 10.37 µm. This value can be correlated with the starting powder size (D90 of 40 µm) once it is known that a partial melt of these particles occurs in the inner face of the wall, as in the outer face.
Another conclusion taken from the data of Figure 7 is that, although measured independently, the hole width results are consistent with the total and melt thickness measurements, with lower thicknesses leading to larger holes, and higher thicknesses to narrower holes.
3.2. Statistical Analysis
As seen in Figure 4, measurements were performed to assess the tubes’ thickness (explicitly determining the melt thickness and the overall thickness, or total thickness). Furthermore, the tubes’ hole width was independently measured.
Regression models were developed using these results (as output data), and the processing parameters (laser power (A) and scan speed (B), as input data) are shown in Table 1.
The three models obtained for the melt zone thickness (Equation (2)), the total thickness (Equation (3)), and the hole width (Equation (4)), are presented below. Analysis of Variance (ANOVA) of the three quadratic models is shown in Table 2, Table 3, and Table 4, respectively.
Table 2.
ANOVA and regression analysis summary for the thin-walled tubes’ melt thickness.
Table 3.
ANOVA and regression analysis summary for the thin-walled tubes’ total thickness.
Table 4.
ANOVA and regression analysis summary for the thin-walled tubes’ hole width.
As can be seen from Table 2, Table 3 and Table 4, for all three models presented, all p-values were less than the significance level of 0.05, meaning that all of the terms have significant effects on the response variable. This implies that there are significant individual effects of both laser power (A) and scan speed (B), as well a significant combined effect of laser power and scan speed (AB). Moreover, the models’ F-values (17.81, 16.03, and 13.46) and the very low probability values ((Prob > F) < 0.001) indicate that the regression models are significant. In addition, among these factors, it should be noted that scanning speed is the most significant impact factor with the greatest F-value, which can be ascribed to the influences of scanning speed on melt thickness, total thickness, and hole width.
The lack-of-fit of the models was not significant, indicating the validity of the statistical models. The value of the coefficient of determination (R2) was in the range of 0.63–0.71, reflecting that at least 63% of the predicted values could be matched with the observed values. Adjusted R2 was in reasonable agreement with the predicted value (with a difference of less than 0.2).
Adequate precision values compare the range predicted point to the design point. A ratio greater than 4 is desirable. In this case, the values were between 13 and 14, allowing us to conclude that the models were able to give reasonable performance according to the prediction.
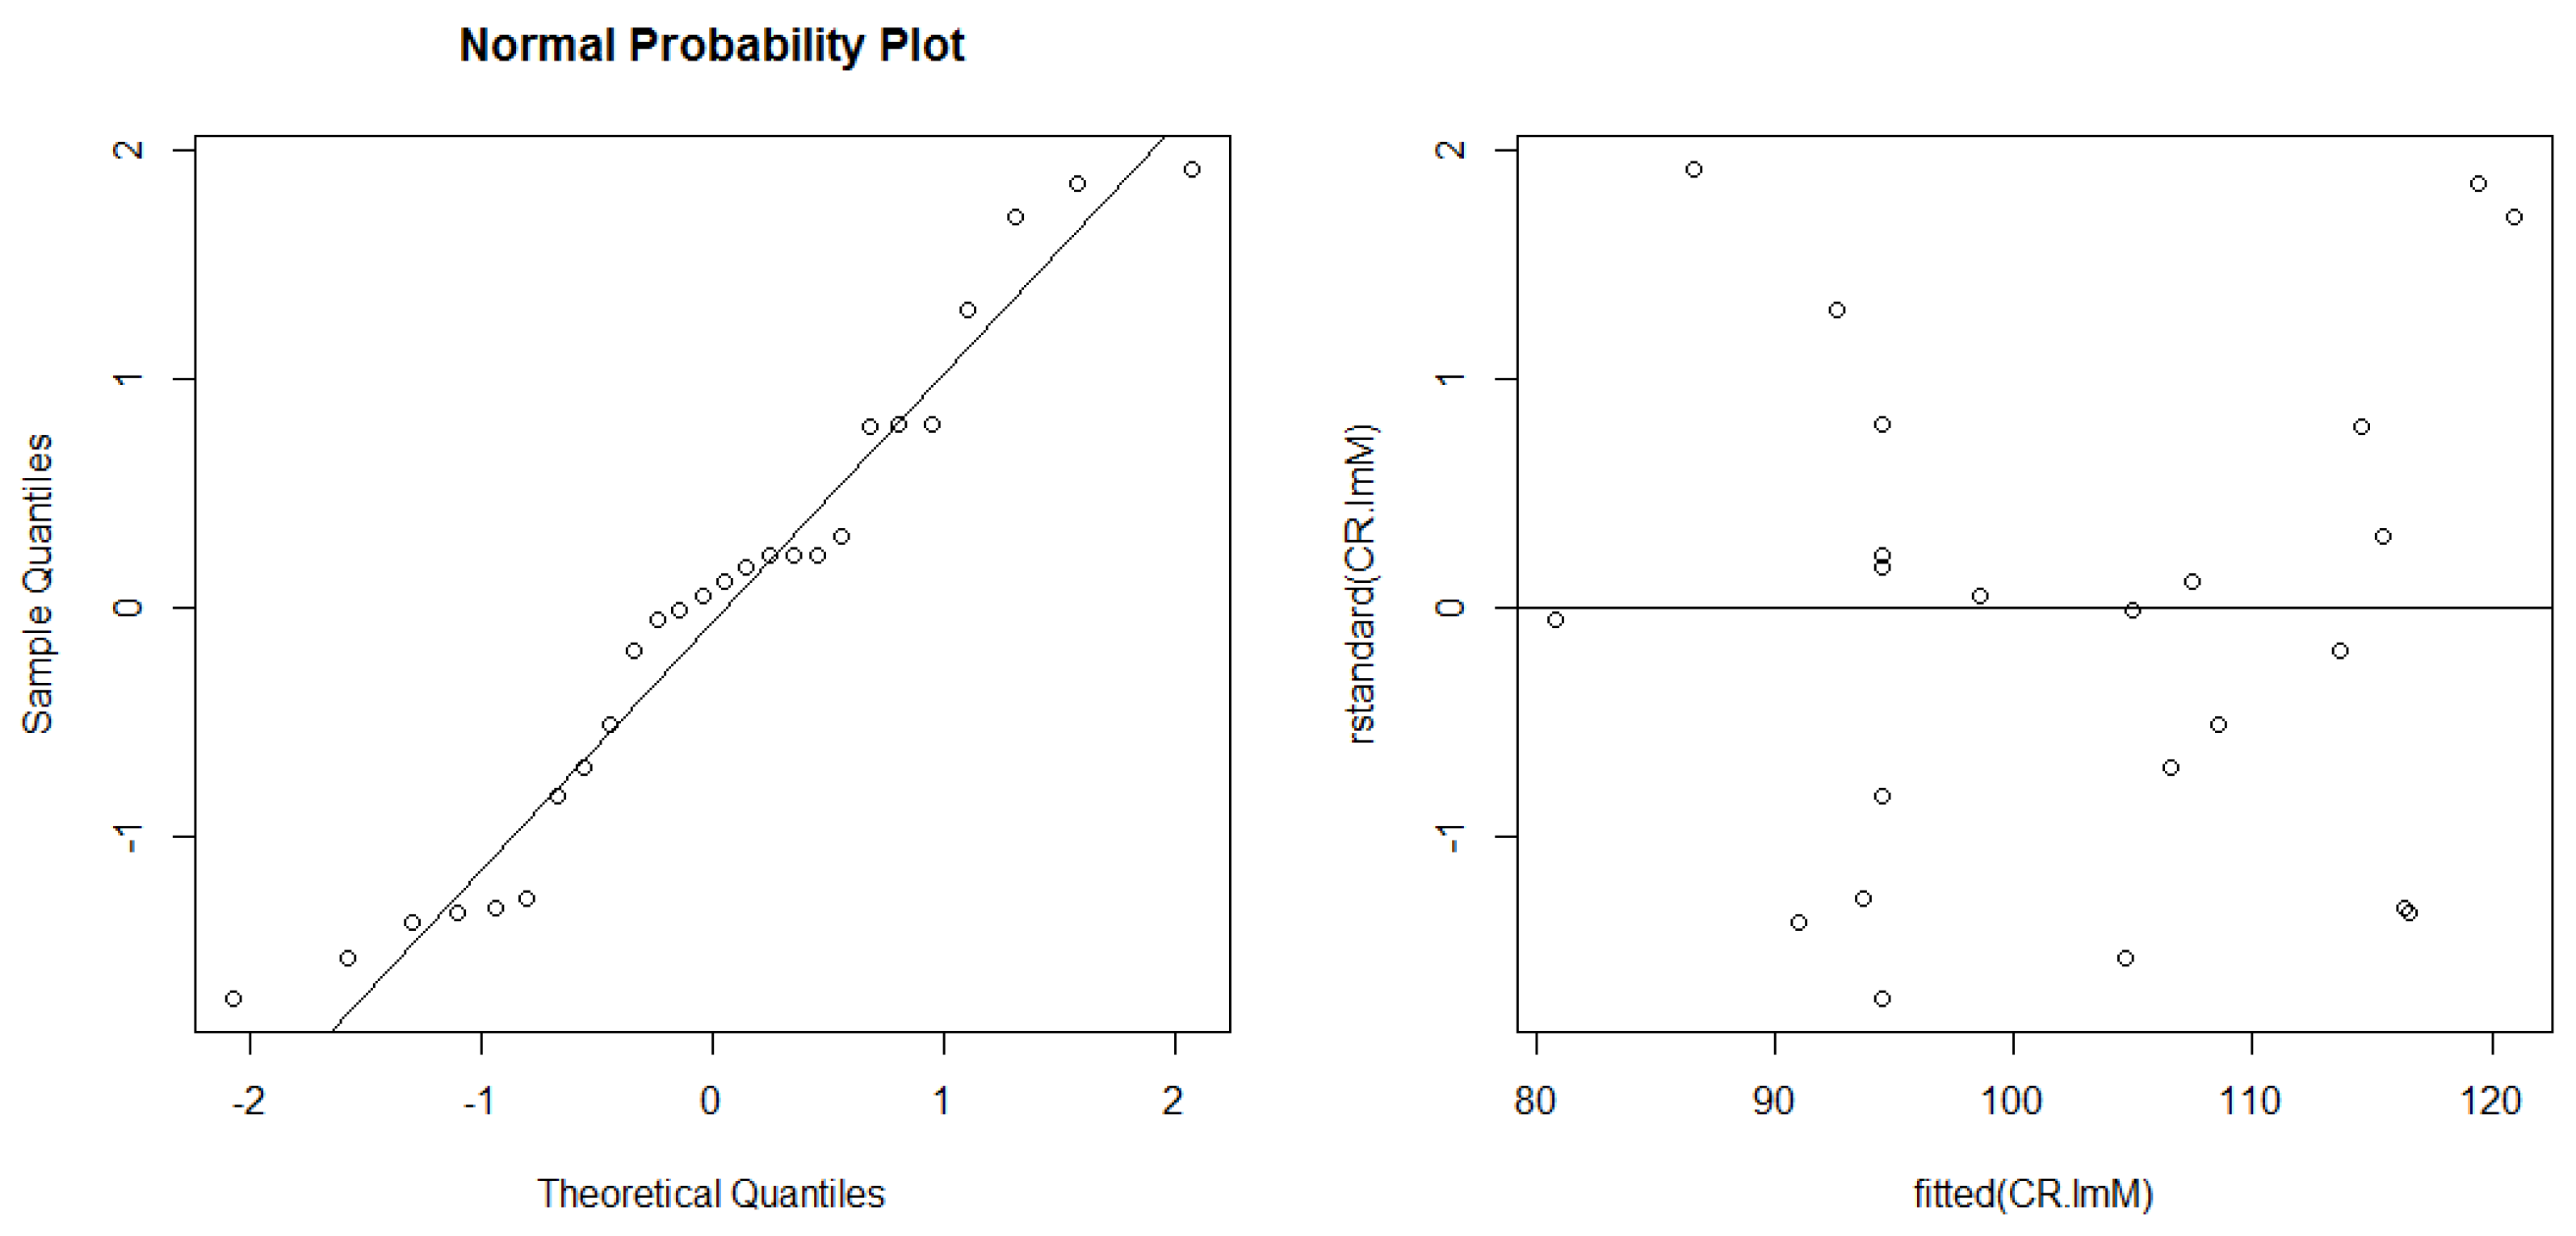
The normal probability plots of the residuals and the plots of the residuals versus the predicted response are shown in Figure 8, Figure 9 and Figure 10.
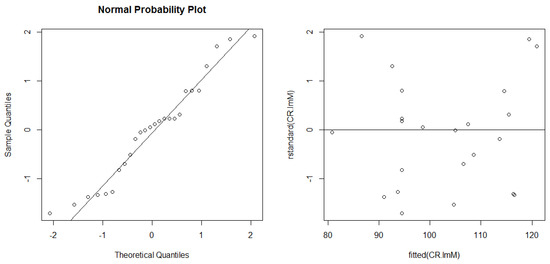
Figure 8.
Normal probability plot of residuals, and plot of residuals vs. fitted values, for melt thickness data.
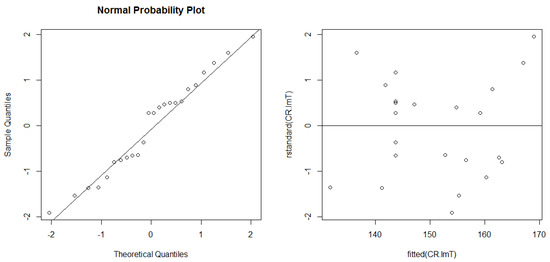
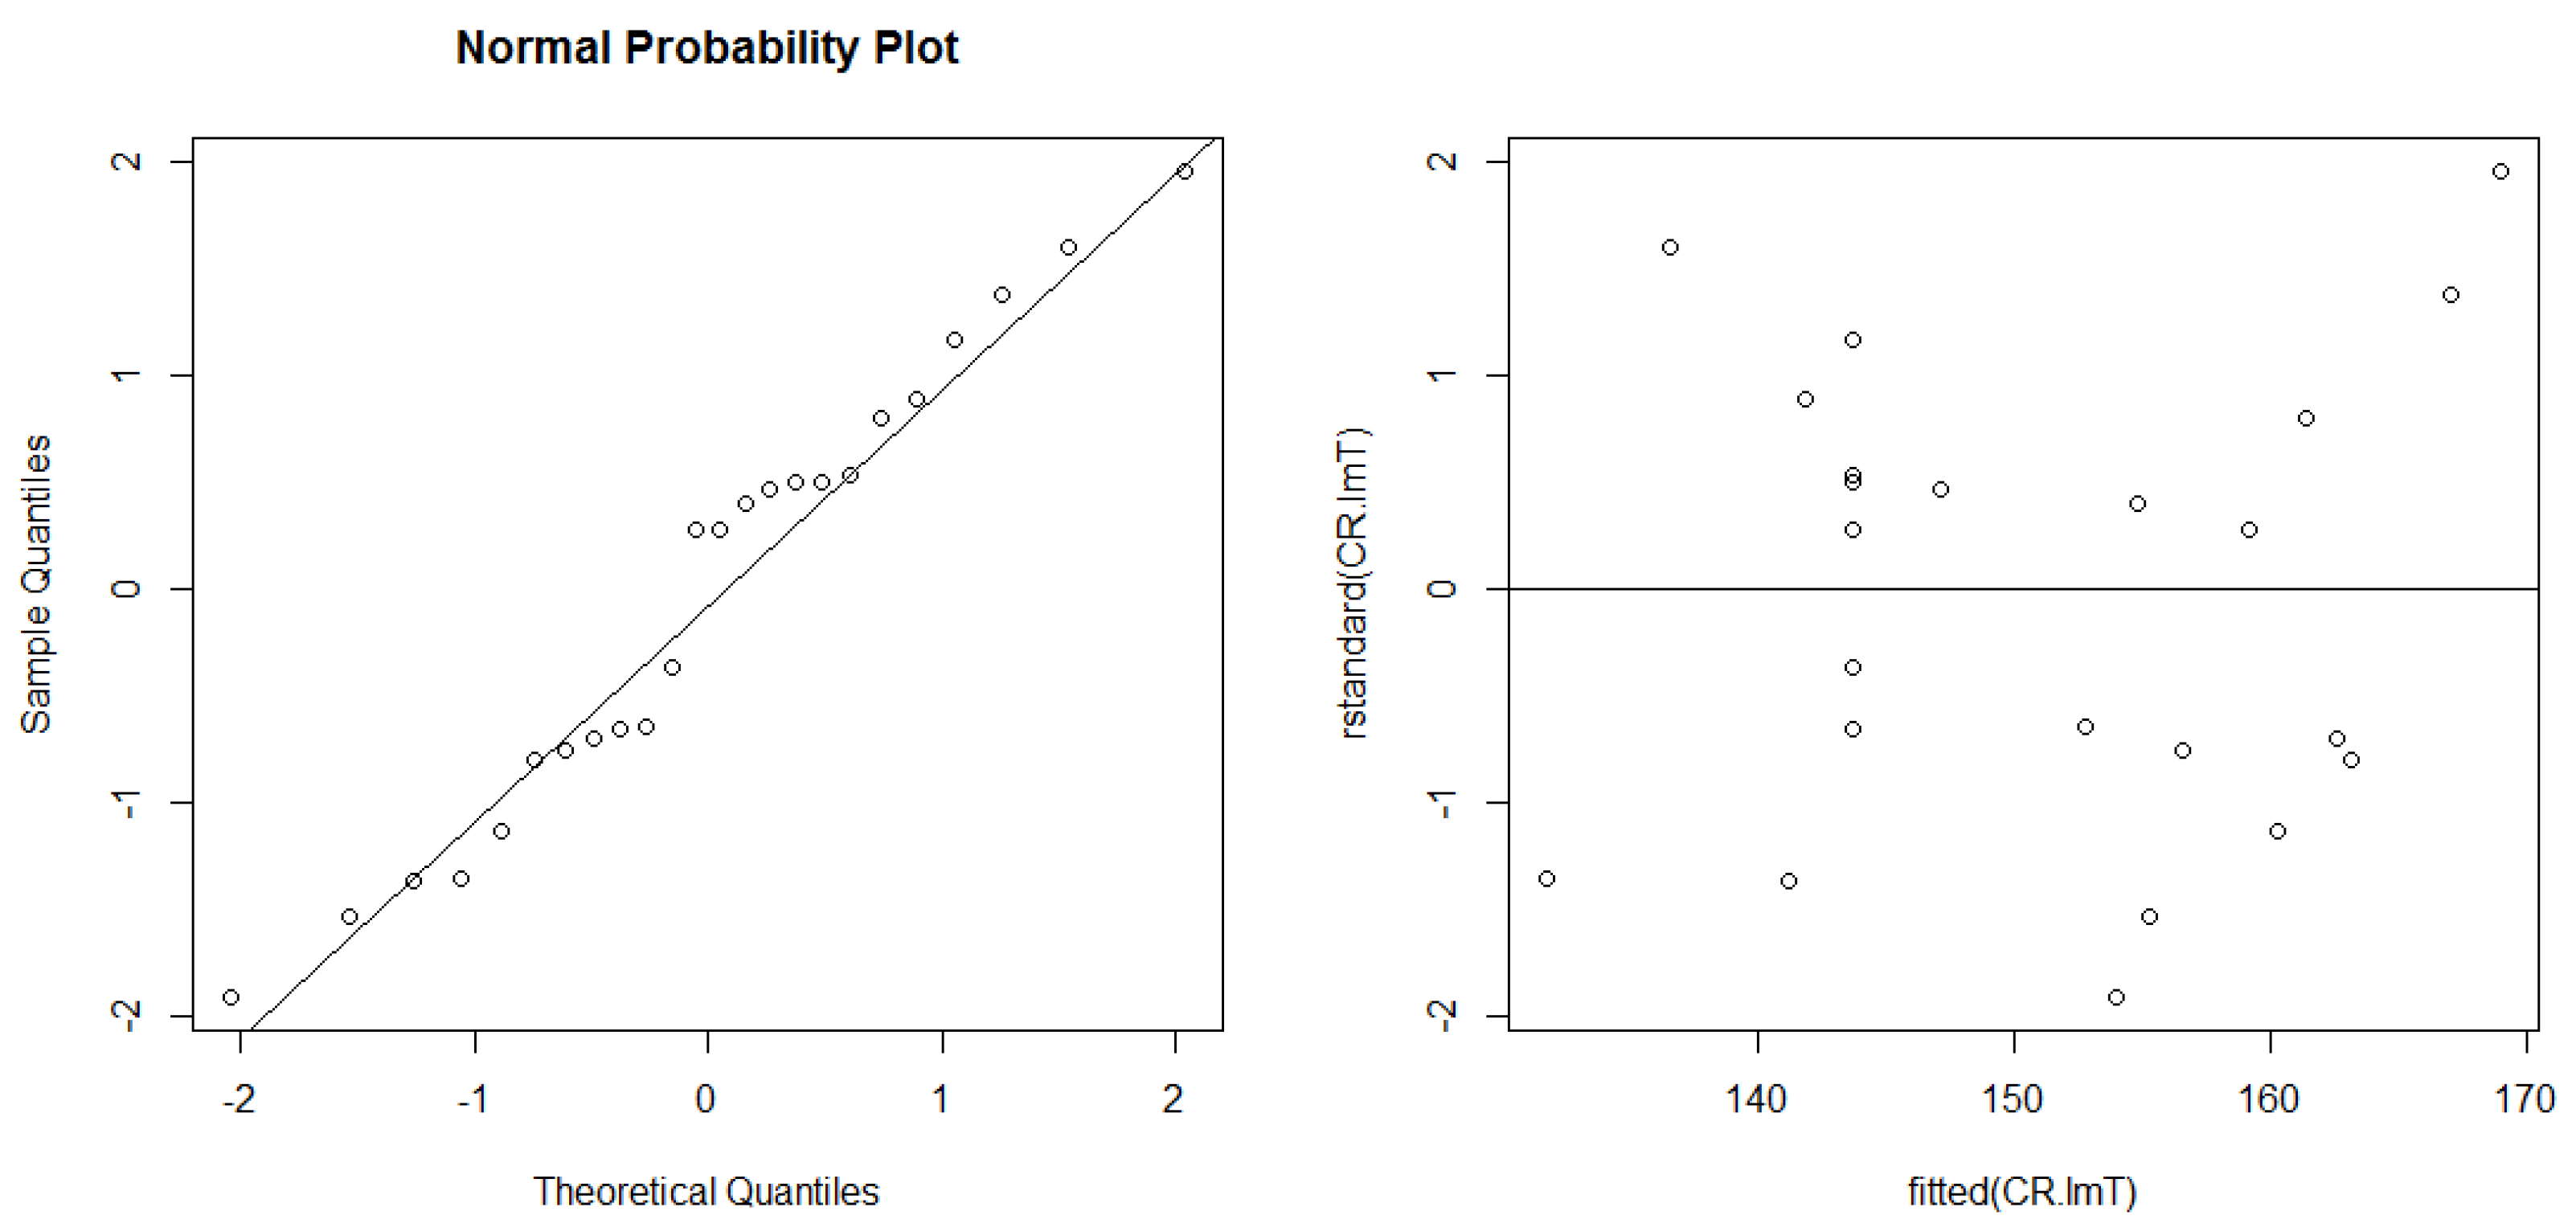
Figure 9.
Normal probability plot of residuals, and plot of residuals vs. fitted values, for total thickness data.
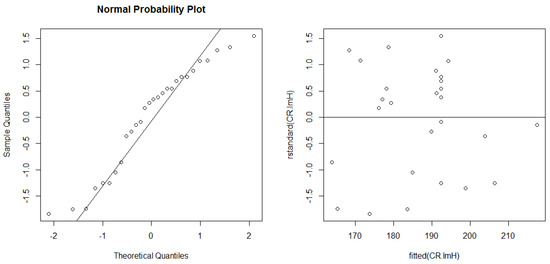
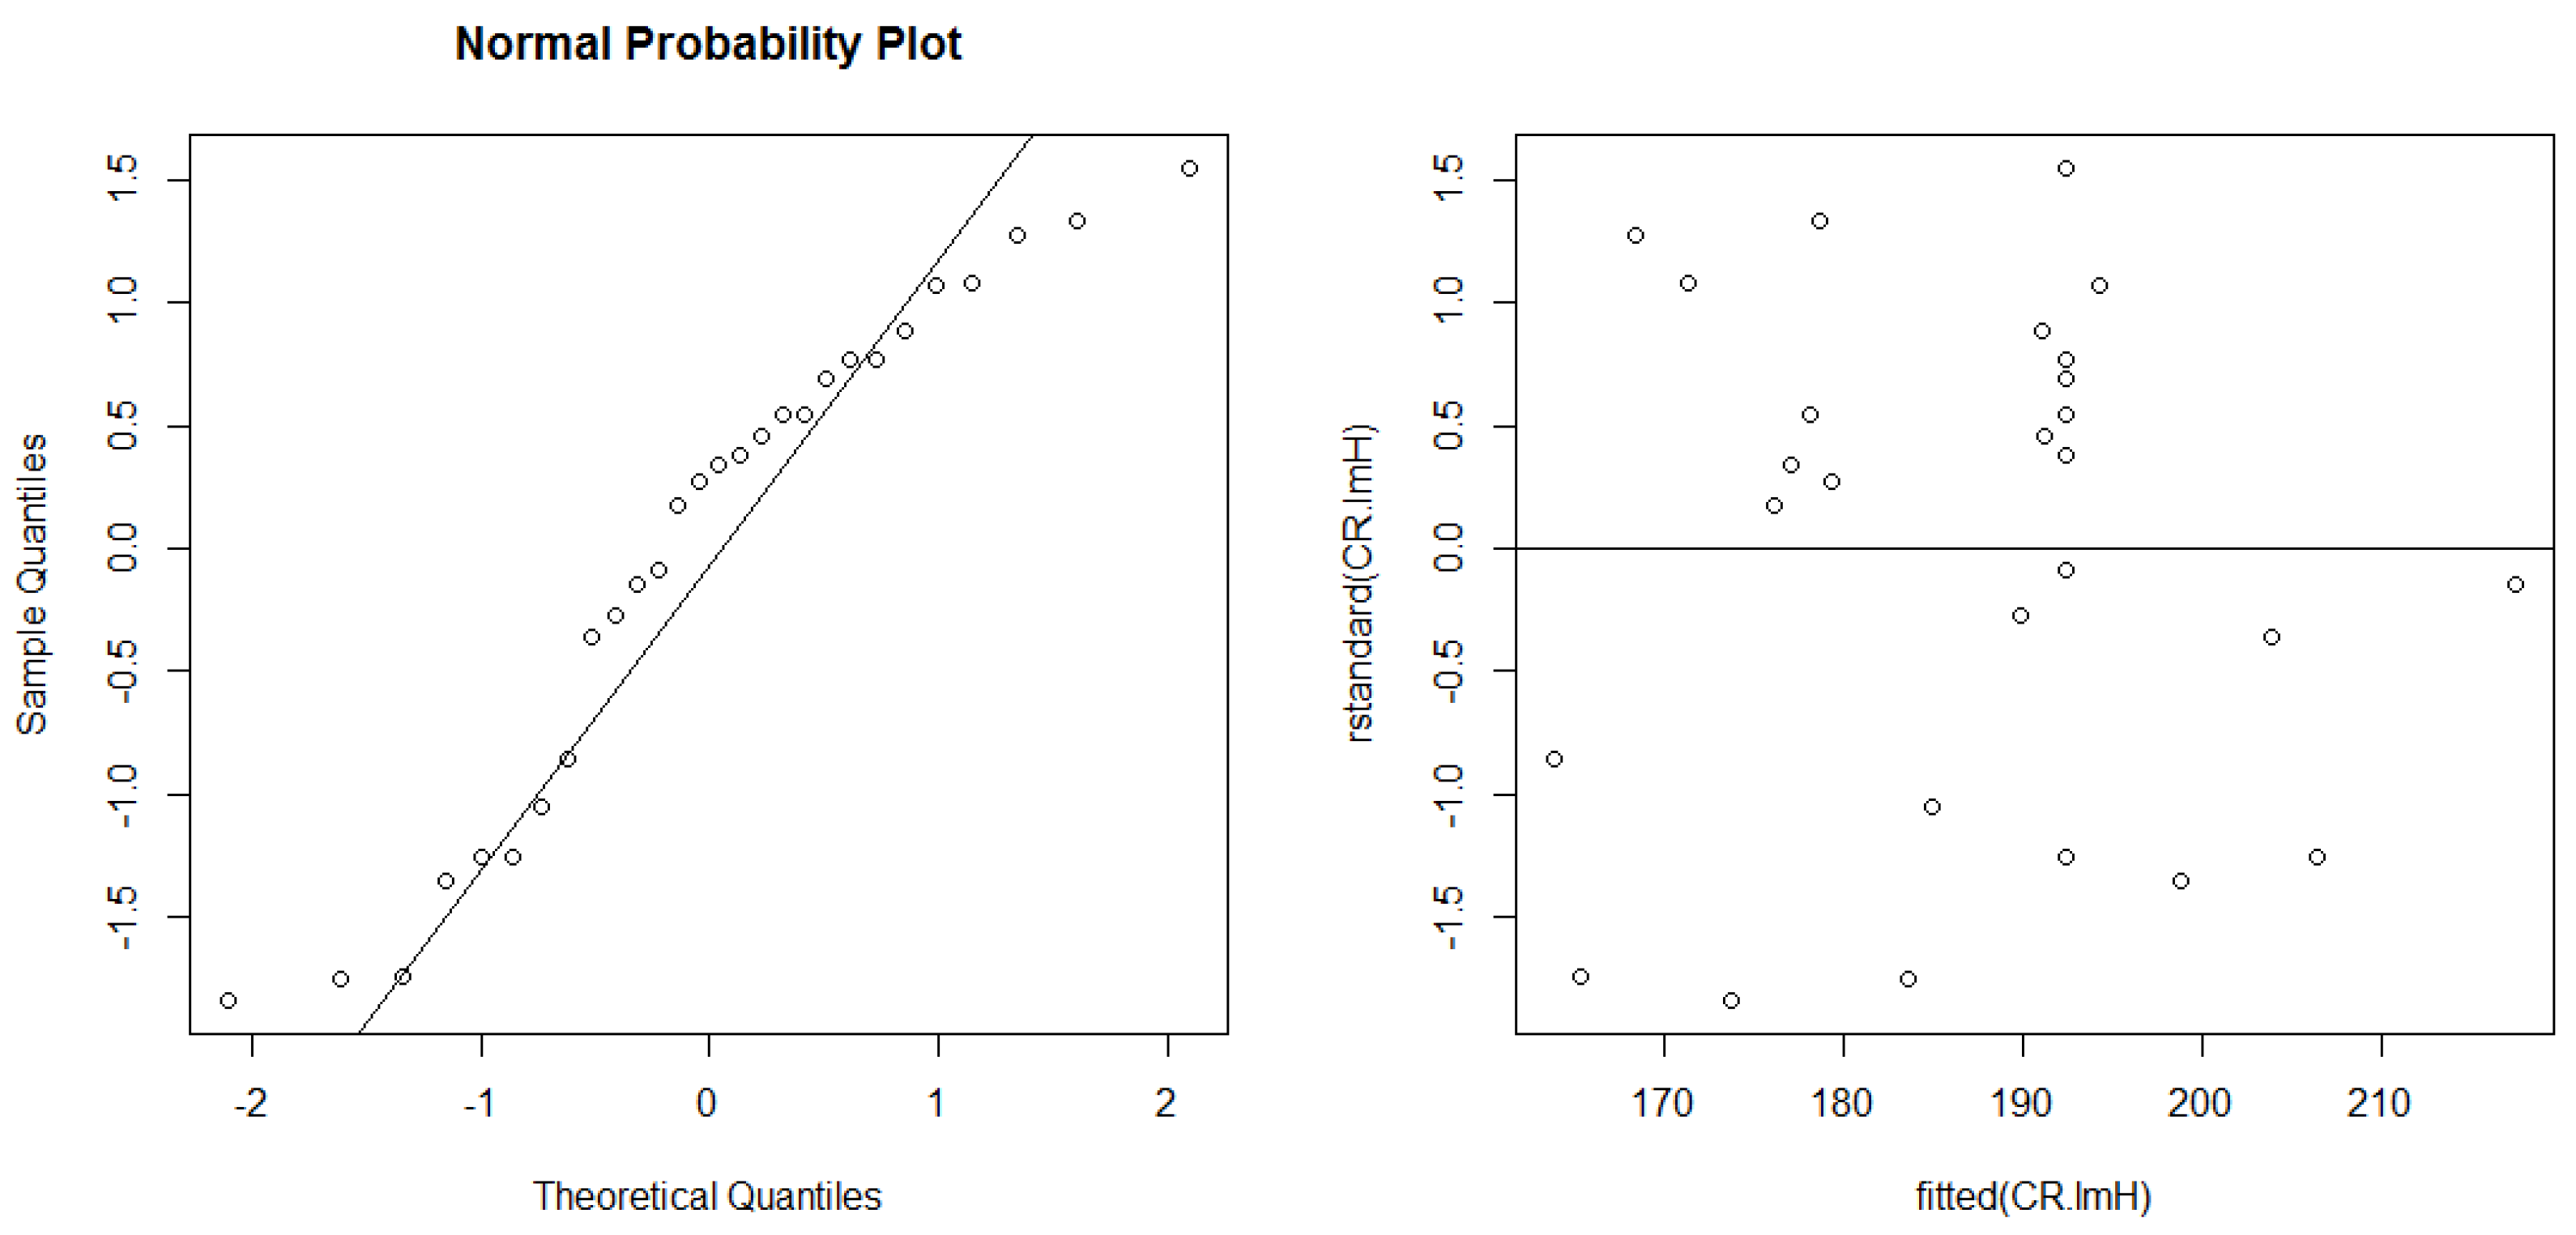
Figure 10.
Normal probability plot of residuals, and plot of residuals vs. fitted values, for hole width data.
For all of the models, the normal probability plots of the residuals show that these generally fall on a straight line, indicating that the errors are distributed. The plots of the residuals versus the predicted response reveal that they have no obvious pattern and unusual structure, indicating that the models are adequate. This implies that the models proposed are adequate, and there is no reason to suspect any violation of the independence or constant variance assumption. The residuals were scattered randomly around ±2.00. This was an indication that the experimental data were well fitted with the models.
The models obtained for the melt and total thickness demonstrate the influence of the laser power and scan speed on the thickness of these parts. The positive coefficient of laser power (A) and the negative coefficient of scan speed (B) prove the individual influence of these parameters. As for laser power, these two models show that higher power and, consequently, higher energy density lead to thicker walls (melt zone and total), due to the generation of a larger melt pool. Figure 11a,b show thin-walled tubes fabricated with different laser powers (50 and 100 W, respectively), but with the same scan speed (400 mm/s), where it is possible to observe a larger melt track when using higher power.
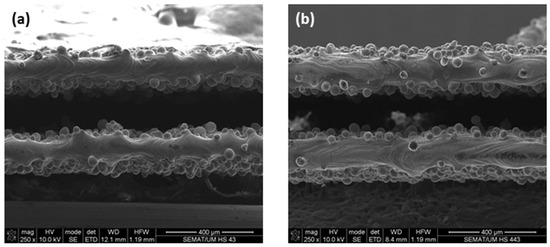
Figure 11.
Central part image of thin-walled tubes built in experiment numbers (a) 2 (50 W/400 mm/s) and (b) 18 (100 W/400 mm/s).
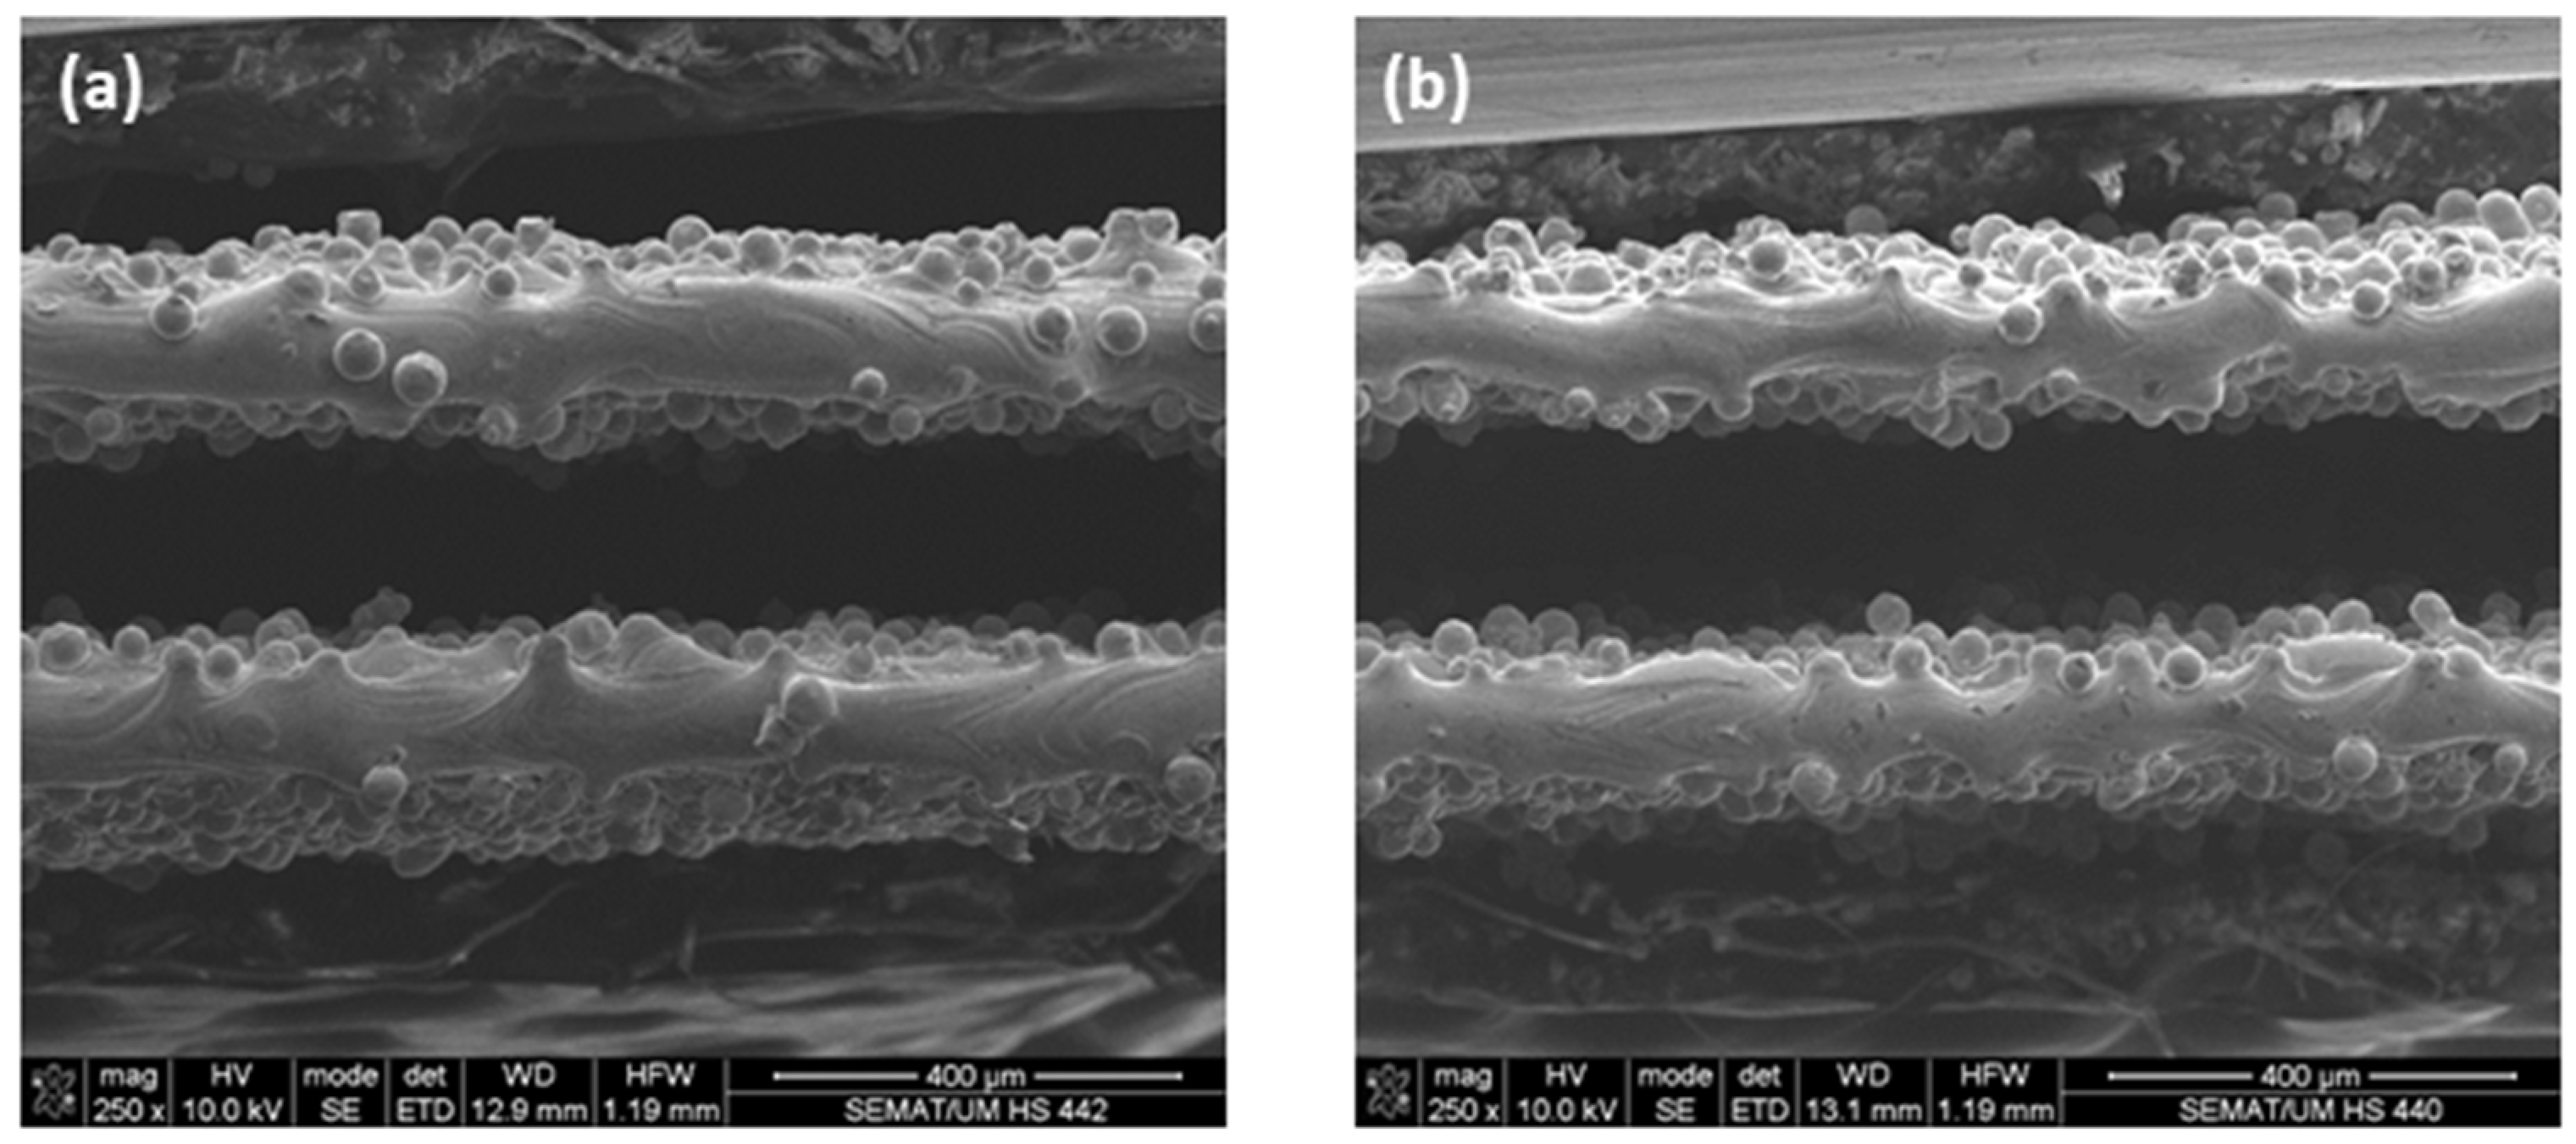
Regarding scan speed (B), the negative coefficients found for both thickness models indicate that with increasing speed, lower thicknesses (melt and total) are obtained, as expected. Figure 12a,b show specimens produced with the same laser power (100 W) but extremely different scan speeds (300 and 1250 mm/s, respectively), allowing us to perceive that the thickness of the thin-walled tubes is greatly reduced when increasing speed, due to a lower energy delivery per second when the laser moves faster.
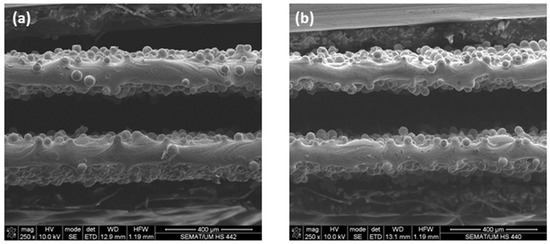
Figure 12.
Central part image of thin-walled tubes built in experiment numbers (a) 17 (100 W/300 mm/s) and (b) 21 (100 W/1250 mm/s).
Regarding the hole width model, as expected, coefficients with opposite signs to those of the thickness models were determined (for A and B), as thicker walls lead to narrow holes and thus, the effects of power and speed were opposite.
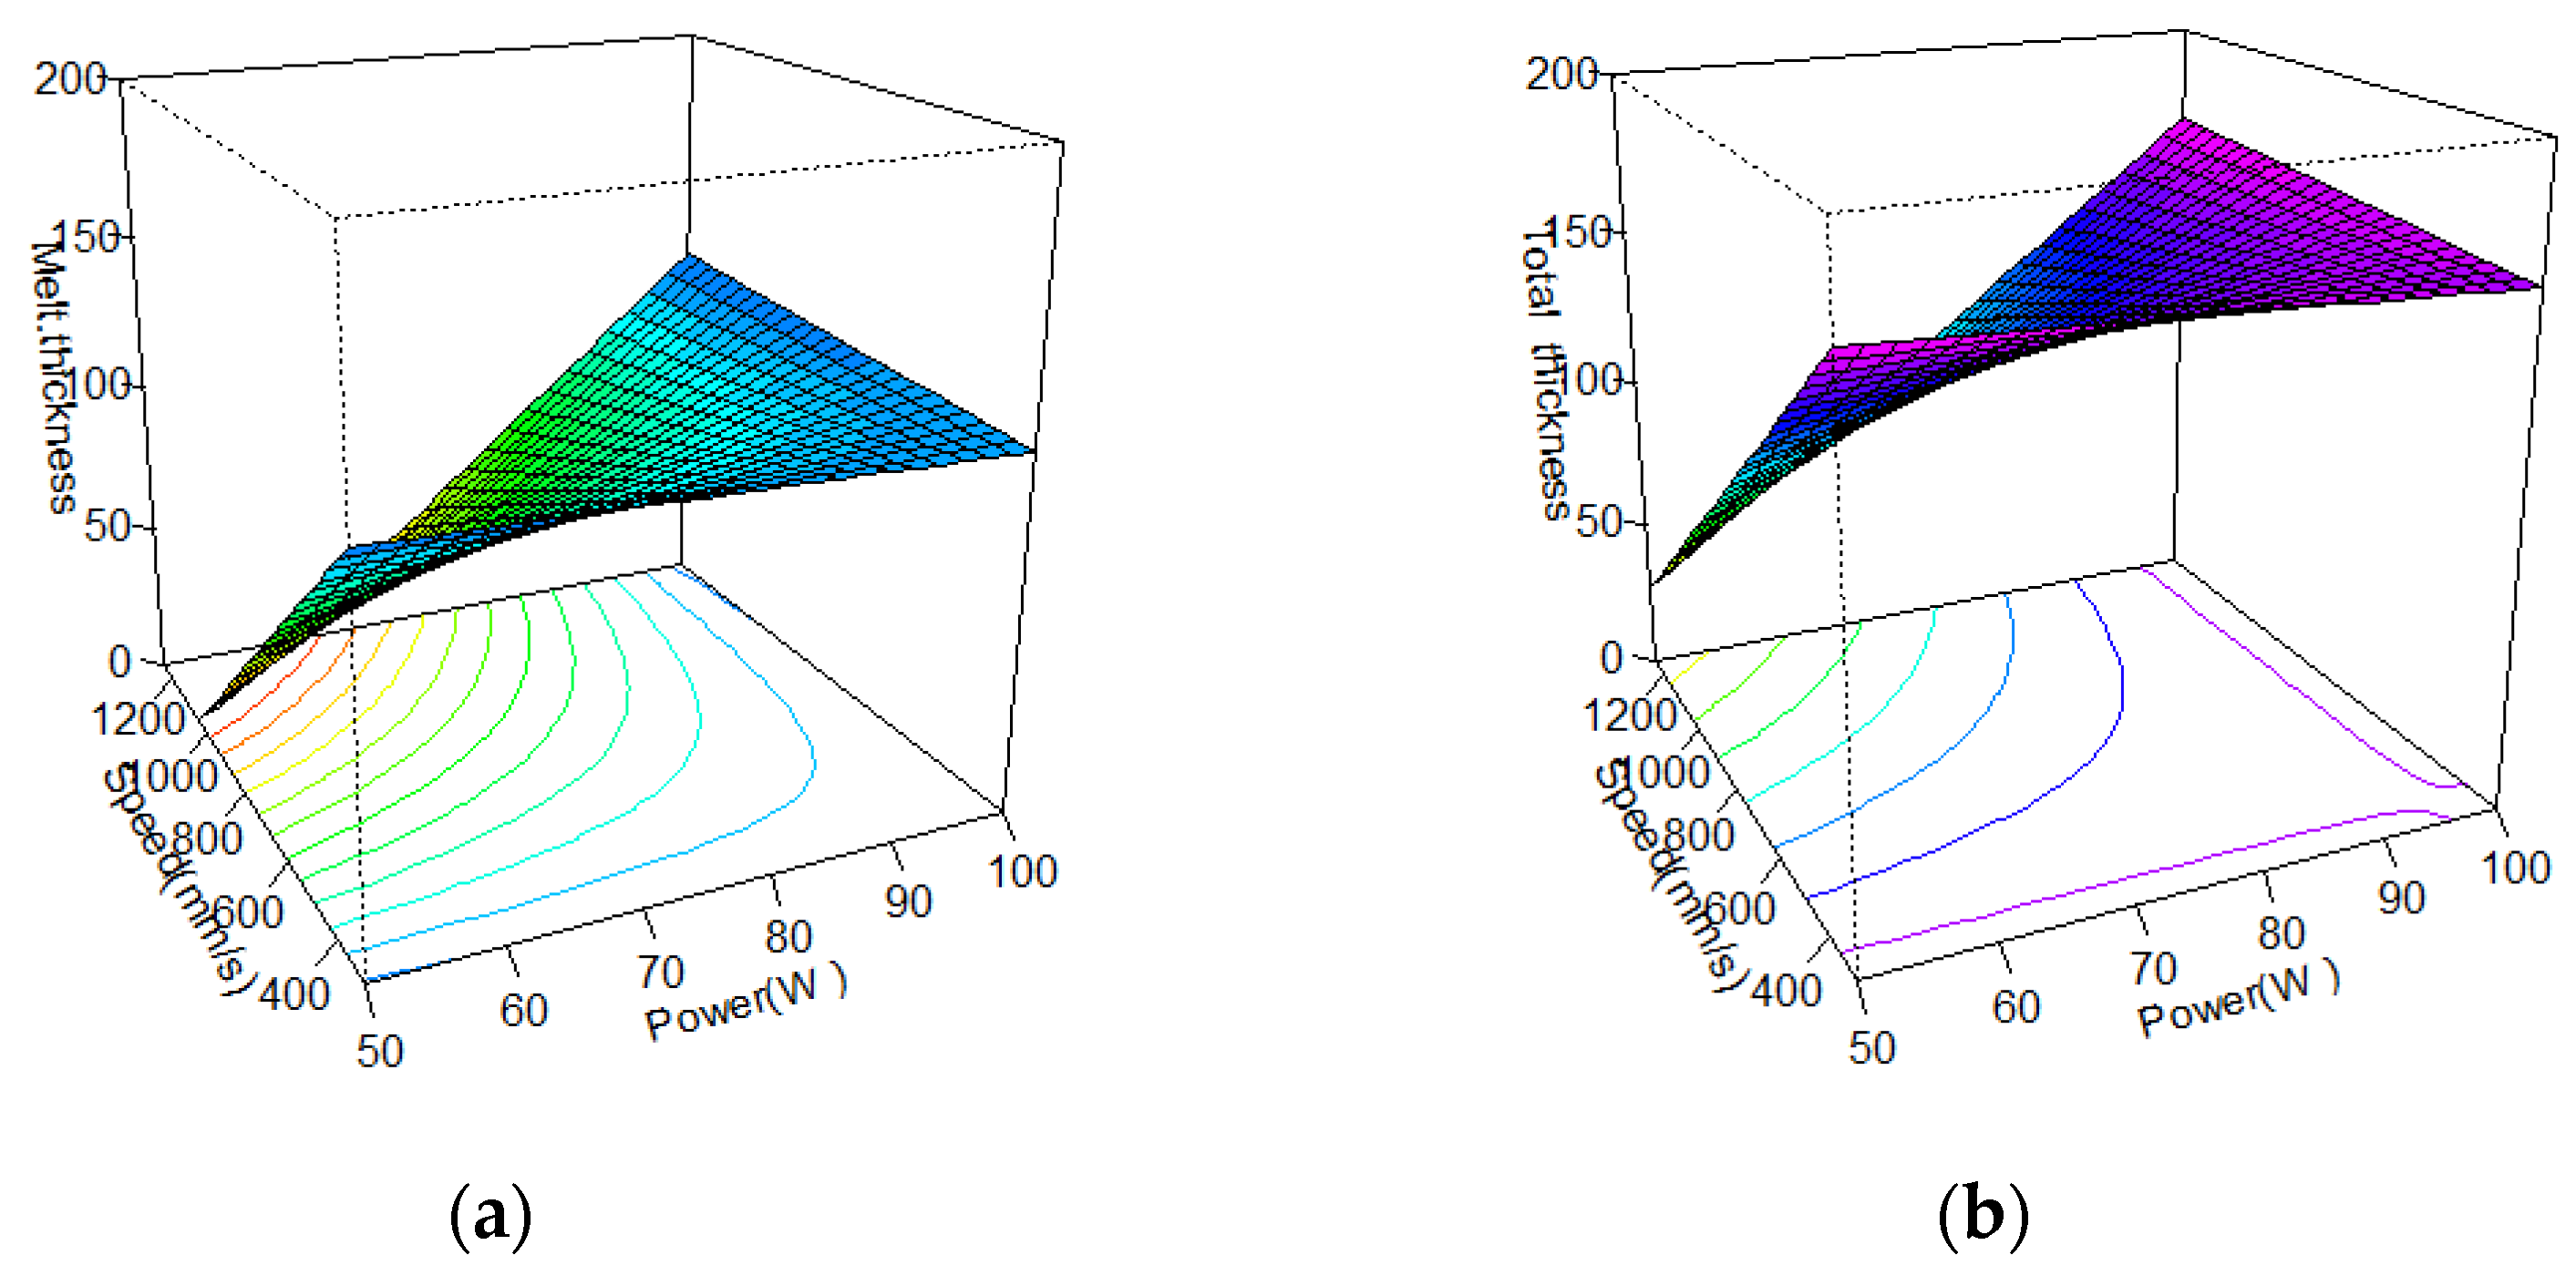
In addition to the individual influence of the laser power (A) and scan speed (B), all of the models exhibited interactions between these two independent variables. The 3D response surface plots shown in Figure 13 prove the tendency for higher thicknesses (melt and total) with increasing power, at any given speed. Conversely, there is a tendency towards lower thicknesses (melt and total) with increasing speed—especially when using lower laser power values. The large thickness range covered by these surface plots on the studied domain shows that these thin-walled parts’ final dimensions are extremely dependent on process variables, namely, on power and scan speed; thus, particular attention must be paid to the SLM parameters for their accurate fabrication.

Figure 13.
3D response surface plots for thin-walled tubes: (a) melt thickness model and (b) thickness model.
4. Conclusions
- -
- The influence of the Selective Laser Melting (SLM) parameters laser power and scan speed on Ti6Al4V thin-walled tubes’ thickness was assessed.
- -
- Predictive models for the influence of these processing parameters (independent variables) on the thickness (dependent variable) of thin-walled tubes were developed.
- -
- The developed models prove that these micro-sized parts’ final dimensions are greatly dependent on these SLM processing parameters.
- -
- These models can be used to optimize the micro-manufacturing of Ti6Al4V thin-walled parts by SLM.
Author Contributions
Conceptualization, G.M., N.A. and F.S.S.; methodology, G.M. and S.F.; investigation, E.P., F.B. and G.M.; resources, G.M., S.F., N.A. and F.S.S.; writing—original draft preparation, G.M. and S.F.; writing—review and editing, G.M.; funding acquisition, G.M. and F.S.S. All authors have read and agreed to the published version of the manuscript.
Funding
This work was supported by the FCT (Fundação para a Ciência e a Tecnologia) through the project PTDC/EME-EME/1442/2020 (Add2MechBio) and POCI-01-0247-FEDER-024533 (Add-Additive–Add additive manufacturing to Portuguese industry). Acknowledgments to the project CICECO-Aveiro Institute of Materials, UIDB/50011/2020, UIDP/50011/2020, and LA/P/0006/2020, financed by national funds through the FCT/MEC (PIDDAC). 
Informed Consent Statement
Not applicable.
Data Availability Statement
The data presented in this study are available on request from the corresponding author.
Conflicts of Interest
The authors declare no conflict of interest.
References
- Dallago, M.; Fontanari, V.; Torresani, E.; Leoni, M.; Pederzolli, C.; Potrich, C.; Benedetti, M. Fatigue and biological properties of Ti-6Al-4V ELI cellular structures with variously arranged cubic cells made by selective laser melting. J. Mech. Behav. Biomed. Mater. 2018, 78, 381–394. [Google Scholar] [CrossRef] [PubMed]
- Chen, Q.; Thouas, G.A. Metallic implant biomaterials. Mater. Sci. Eng. R Rep. 2015, 87, 1–57. [Google Scholar] [CrossRef]
- Hassanin, H.; Finet, L.; Cox, S.C.; Jamshidi, P.; Grover, L.M.; Shepherd, D.E.T.; Addison, O.; Attallah, M.M. Tailoring selective laser melting process for titanium drug-delivering implants with releasing micro-channels. Addit. Manuf. 2018, 20, 144–155. [Google Scholar] [CrossRef] [Green Version]
- van Hooreweder, B.; Apers, Y.; Lietaert, K.; Kruth, J.P. Improving the fatigue performance of porous metallic biomaterials produced by Selective Laser Melting. Acta Biomater. 2017, 47, 193–202. [Google Scholar] [CrossRef]
- Sarker, A.; Tran, N.; Rifai, A.; Brandt, M.; Tran, P.A.; Leary, M.; Fox, K.; Williams, R. Rational design of additively manufactured Ti6Al4V implants to control Staphylococcus aureus biofilm formation. Materialia 2019, 5, 100250. [Google Scholar] [CrossRef]
- Wang, X.; Xu, S.; Zhou, S.; Xu, W.; Leary, M.; Choong, P.; Qian, M.; Brandt, M.; Xie, Y.M. Topological design and additive manufacturing of porous metals for bone scaffolds and orthopaedic implants: A review. Biomaterials 2016, 83, 127–141. [Google Scholar] [CrossRef]
- Zhang, L.; Zhang, S.; Zhu, H.; Hu, Z.; Wang, G.; Zeng, X. Horizontal dimensional accuracy prediction of selective laser melting. Mater. Des. 2018, 160, 9–20. [Google Scholar] [CrossRef]
- Bartolomeu, F.; Fonseca, J.; Peixinho, N.; Alves, N.; Gasik, M.; Silva, F.S.; Miranda, G. Predicting the output dimensions, porosity and elastic modulus of additive manufactured biomaterial structures targeting orthopedic implants. J. Mech. Behav. Biomed. Mater. 2019, 99, 104–117. [Google Scholar] [CrossRef] [PubMed]
- Bartolomeu, F.; Costa, M.M.; Alves, N.; Miranda, G.; Silva, F.S. Additive manufacturing of NiTi-Ti6Al4V multi-material cellular structures targeting orthopedic implants. Opt. Lasers Eng. 2020, 134, 106208. [Google Scholar] [CrossRef]
- Maconachie, T.; Leary, M.; Lozanovski, B.; Zhang, X.; Qian, M.; Faruque, O.; Brandt, M. SLM lattice structures: Properties, performance, applications and challenges. Mater. Des. 2019, 183, 108137. [Google Scholar] [CrossRef]
- Verma, S.; Yang, C.; Lin, C.; Jeng, J.Y. Additive manufacturing of lattice structures for high strength mechanical interlocking of metal and resin during injection molding. Addit. Manuf. 2022, 49, 102463. [Google Scholar] [CrossRef]
- Li, Z.; Xu, R.; Zhang, Z.; Kucukkoc, I. The influence of scan length on fabricating thin-walled components in selective laser melting. Int. J. Mach. Tools Manuf. 2018, 126, 1–12. [Google Scholar] [CrossRef]
- Pérez-Ruiz, J.D.; Marin, F.; Martínez, S.; Lamikiz, A.; Urbikain, G.; de Lacalle, L.N.L. Stiffening near-net-shape functional parts of Inconel 718 LPBF considering material anisotropy and subsequent machining issues. Mech. Syst. Signal Process. 2022, 168, 108675. [Google Scholar] [CrossRef]
- Pérez-Ruiz, J.D.; de Lacalle, L.N.L.; Urbikain, G.; Pereira, O.; Martínez, S.; Bris, J. On the relationship between cutting forces and anisotropy features in the milling of LPBF Inconel 718 for near net shape parts. Int. J. Mach. Tools Manuf. 2021, 170, 103801. [Google Scholar] [CrossRef]
- Smith, K.E.; Dupont, K.M.; Safranski, D.L.; Blair, J.; Buratti, D.; Zeetser, V.; Callahan, R.; Lin, J.; Gall, K. Use of 3D printed bone plate in novel technique to surgically correct hallux valgus deformities. Tech. Orthop. 2016, 31, 181–189. [Google Scholar] [CrossRef] [PubMed] [Green Version]
- Fang, C.; Cai, H.; Kuong, E.; Chui, E.; Siu, Y.C.; Ji, T.; Drstvenšek, I. Surgical applications of three-dimensional printing in the pelvis and acetabulum: From models and tools to implants. Anwendungen des 3-dimensionalen Drucks an Becken und Acetabulum: Von Modellen und Instrumenten zu Implantaten. Unfallchirurg 2019, 122, 278–285. [Google Scholar] [CrossRef] [Green Version]
- Dall’Ava, L.; Hothi, H.; di Laura, A.; Henckel, J.; Hart, A. 3D printed acetabular cups for total hip arthroplasty: A review article. Metals 2019, 9, 729. [Google Scholar] [CrossRef] [Green Version]
- Gómez-Escudero, G.; Jimeno Beitia, A.; Martínez de Pissón Caruncho, G.; López de Lacalle, L.N.; González-Barrio, H.; Pereira Neto, O.; Calleja-Ochoa, A. A reliable clean process for five-axis milling of knee prostheses. Int. J. Adv. Manuf. Technol. 2021, 115, 1605–1620. [Google Scholar] [CrossRef]
- Tan, J.H.; Wong, W.L.E.; Dalgarno, K.W. An overview of powder granulometry on feedstock and part performance in the selective laser melting process. Addit. Manuf. 2017, 18, 228–255. [Google Scholar] [CrossRef] [Green Version]
- Wang, X.; Zhang, S.; Wang, Z.Y.; Zhang, C.H.; Wu, C.L.; Wang, M. 3D printing externally reinforced layers for high-speed railway brake discs: Adaptability of SLM processes for manufacturing gradient materials. Mater. Today Commun. 2022, 31, 103778. [Google Scholar] [CrossRef]
- Ferreira, D.F.S.; Miranda, G.; Oliveira, F.J.; Oliveira, J.M. Predictive models for an optimized fabrication of 18Ni300 maraging steel for moulding and tooling by selective laser melting. J. Manuf. Process. 2021, 70, 46–54. [Google Scholar] [CrossRef]
- Zhang, S.; Wei, Q.; Cheng, L.; Li, S.; Shi, Y. Effects of scan line spacing on pore characteristics and mechanical properties of porous Ti6Al4V implants fabricated by selective laser melting. Mater. Des. 2014, 63, 185–193. [Google Scholar] [CrossRef]
- Bartolomeu, F.; Faria, S.; Carvalho, O.; Pinto, E.; Alves, N.; Silva, F.S.; Miranda, G. Predictive models for physical and mechanical properties of Ti6Al4V produced by Selective Laser Melting. Mater. Sci. Eng. A 2016, 663, 181–192. [Google Scholar] [CrossRef]
- Wang, Z.; Xiao, Z.; Tse, Y.; Huang, C.; Zhang, W. Optimization of processing parameters and establishment of a relationship between microstructure and mechanical properties of SLM titanium alloy. Opt. Laser Technol. 2019, 112, 159–167. [Google Scholar] [CrossRef]
- Salem, H.; Carter, L.N.; Attallah, M.M.; Salem, H.G. Influence of processing parameters on internal porosity and types of defects formed in Ti6Al4V lattice structure fabricated by selective laser melting. Mater. Sci. Eng. A 2019, 767, 138387. [Google Scholar] [CrossRef]
- Leary, M. 4-Surface roughness optimisation for selective laser melting (SLM): Accommodating relevant and irrelevant surfaces. In Woodhead Publishing Series in Electronic and Optical Materials, Laser Additive Manufacturing; Brandt, M., Ed.; Woodhead Publishing: Cambridge, UK, 2017; pp. 99–118. ISBN 9780081004333. [Google Scholar] [CrossRef]


Publisher’s Note: MDPI stays neutral with regard to jurisdictional claims in published maps and institutional affiliations. |
© 2022 by the authors. Licensee MDPI, Basel, Switzerland. This article is an open access article distributed under the terms and conditions of the Creative Commons Attribution (CC BY) license (https://creativecommons.org/licenses/by/4.0/).