Abstract
For better clarifying the influence of processing factors on the forming quality of the direct powder rolling (DPR) process, finite element simulation based on the modified Drucker–Prager/Cap (DPC) model was established and the key physical parameters of the powder were confirmed by experimental measurements. Subsequently, the effect of the main factors in the DPR process, viz., powder gradation, rolling speed and rolling gap, on the density and morphology of a green sheet were discussed by using an orthogonal experiment design followed by experimental verification. The influence of DPR parameters on the density of the green sheet is examined by a range analysis, which can reflect the sensitivity of influencing factors to the forming quality of the green sheet. The larger the range value is, the more sensitive the influencing factor is. This suggests that the quality of the green sheet is mainly influenced by particle gradation. The results show that the density of the resulting DPR green sheet with optimal parameters is mainly 7.5~8.0 g/cm3, reaches 80% of the theoretical density, and the mechanical strength can also afford the transferring process of the green sheet for the next sintering craft. The methods for modeling, obtaining physical parameters and the numerical simulation results can be used to guide rapid formation of the metal sheet by using direct powder rolling craft.
1. Introduction
With the development of electronic products for miniaturization, a lightweight, multi-functional, large as well as super large-scaled integrated circuit (IC) is required, where the size of the pitch and the distance between pitches are increasingly smaller. As a consequence, the materials used for preparing a copper alloy lead frame, which is one of the most important components of an integrated circuit, need to have excellent performance, such as high strength, high electrical conductivity, good workability, and so on [1]. Hence, numerous works have been conducted to explore Cu-based alloys with a good combination of high strength and electrical conductivity [2,3,4,5,6,7,8,9]. However, exploring the excellent materials is not only beneficial for the preparation of a lead frame, but is also a cheap method for obtaining very thin alloy sheets, where the thickness of the lead frame is always about 0.1 mm [1,10]. The traditional manufacturing method is melting and casting in thermomechanical and heat treatments, where a series of complicated processes strongly increase the equipment investment and production cycle time [11,12]. Therefore, it is necessary to explore a low-cost, short-cycle, and high-efficiency sheet manufacturing technology to meet the application requirements of an IC lead frame, but it is regretful that there is limited similar work.
There is a cheap and short-cycle method used to prepare alloy sheets in other industry domains. For example, the direct powder rolling method (DPR) has been successfully used to prepare Pb-Sn alloy sheets for the battery separator [13], and silicon iron sheets for magnetic devices [14]. Although near-net-shaped blanks can be obtained by direct powder rolling without adding binder, the forming quality is very difficult to ensure since there are so many factors that can affect the rolling process. One class of factors is the physical properties of powder, such as the shape, size, apparent density, fluidity, hardness and compression performance. Another one is the geometric parameters of equipment, including the roller diameter, rolling speed, rolling gap, bite angle and surface roughness of the roller. In conventional manufacturing process, the selection of rolling parameters is always based on empirical methods [15,16]. In addition, inhomogeneity in density as well as cracks will occur during the DPR process and exist throughout the subsequent steps, affecting the mechanical strength. Therefore, it is necessary to study the influencing DPR process parameters and predict the density distribution of the green sheet. It is well-known that the finite element method (FEM) can provide visualization of a green sheet. For the sake of obtaining reliable simulation results, it is the primary task to find a proper constitutive model to describe the powder deformation behavior.
To reveal the powder deformation behavior in the DPR process, the combination of experimental investigations and numerical simulations may be the best choice, which can provide reliable guidance for the quality control and deformation mechanism of direct powder rolling [17]. However, it is clear that there is no unified mathematic model describing such a complex powder forming process. The finite element method with the modified Drucker–Prager/Cap (DPC) model was originally used to describe soil deformation [18], and then it was gradually applied to the pharmaceutical field [19]. Since there is similar behavior between soil and metal powder, viz., the volume is variable in the yielding step, a density-dependent mechanical model, namely, the modified Drucker–Prager/Cap (DPC) model, was used to describe the nonlinear deformation behavior of powder and some valuable results were obtained [20].
Based on analyzing the above research status, we intend to study the deformation behavior of metal powders during DPR by a finite element simulation dependent on the modified DPC model and orthogonal experiment, and finally clarify the influence of major parameters on the quality of the green sheet. In order to analyze the influence of the main DPR factors on the forming quality of the green sheet, namely, particle gradation, rolling speed as well as rolling gap, the general plan of this work is to: (1) determine the key parameters of the modified DPC through Brazilian disk and uniaxial compression experiments, (2) carry out orthogonal experiment design (L16_4_5) by a numerical simulation and discuss the influence of each parameter on the density distribution of the green sheet, (3) conduct DPR experimental investigations under four groups of typical conditions in the simulation, and compare the results of the simulation and experiment to verify the reasonability of the simulation. Considering that suitable alloy systems still need further exploration, pure Cu powder is selected as a research subject. The results of this paper are expected to offer basic knowledge of the DPR process of metal powder, thus providing guidance for the preparation of an IC lead frame with low cost and high efficiency in the future.
2. Experiment
2.1. Powder Material
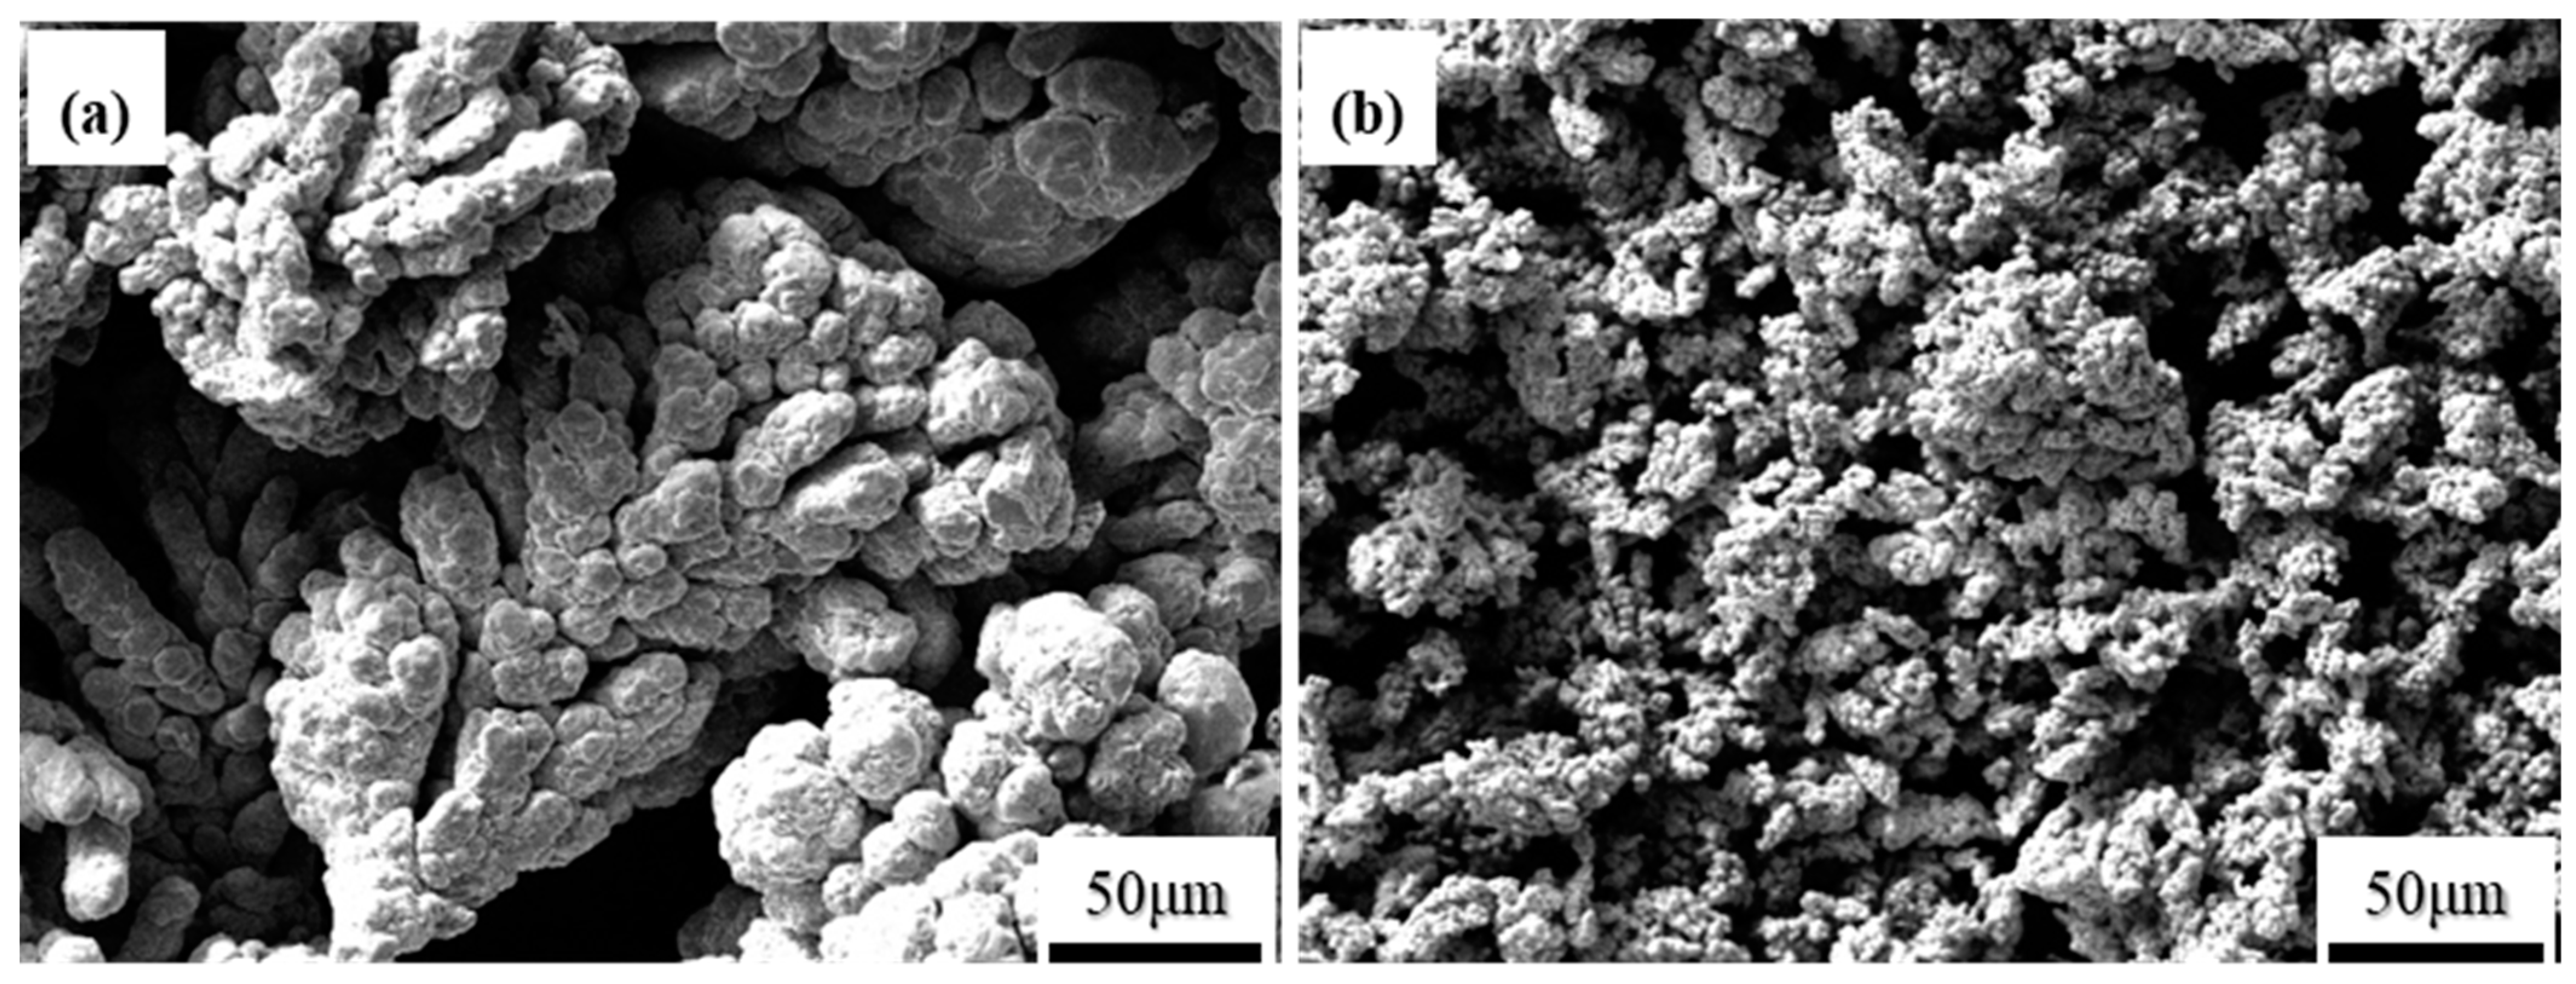
Electrolytic Cu powders of two sizes (~150 μm and ~74 μm powder size, 99.9% in purity) were used as raw materials. The morphology of electrolytic Cu is usually dendritic and stacked with each other, which indicates its good moldability, as shown in Figure 1. In addition, the weight ratios of particle sizes 150 μm to 74 μm were selected as 3:0, 2:1, 1:2, 0:3, which were marked by groups A, B, C and D, respectively. For groups B and C, the powders together with ZrO2 balls were mixed by a vibrating machine (RM-05-X, Seiwa Giken, Japan) at 40 Hz for 2 h, where the ball-to-powder mass ratio was 1:1 (the mass ratio of big (diameter 10 mm) and small (diameter 5 mm) balls is 4:1).

Figure 1.
Morphology of original powder: (a) 150 μm; (b) 74 μm.
2.2. Density Test
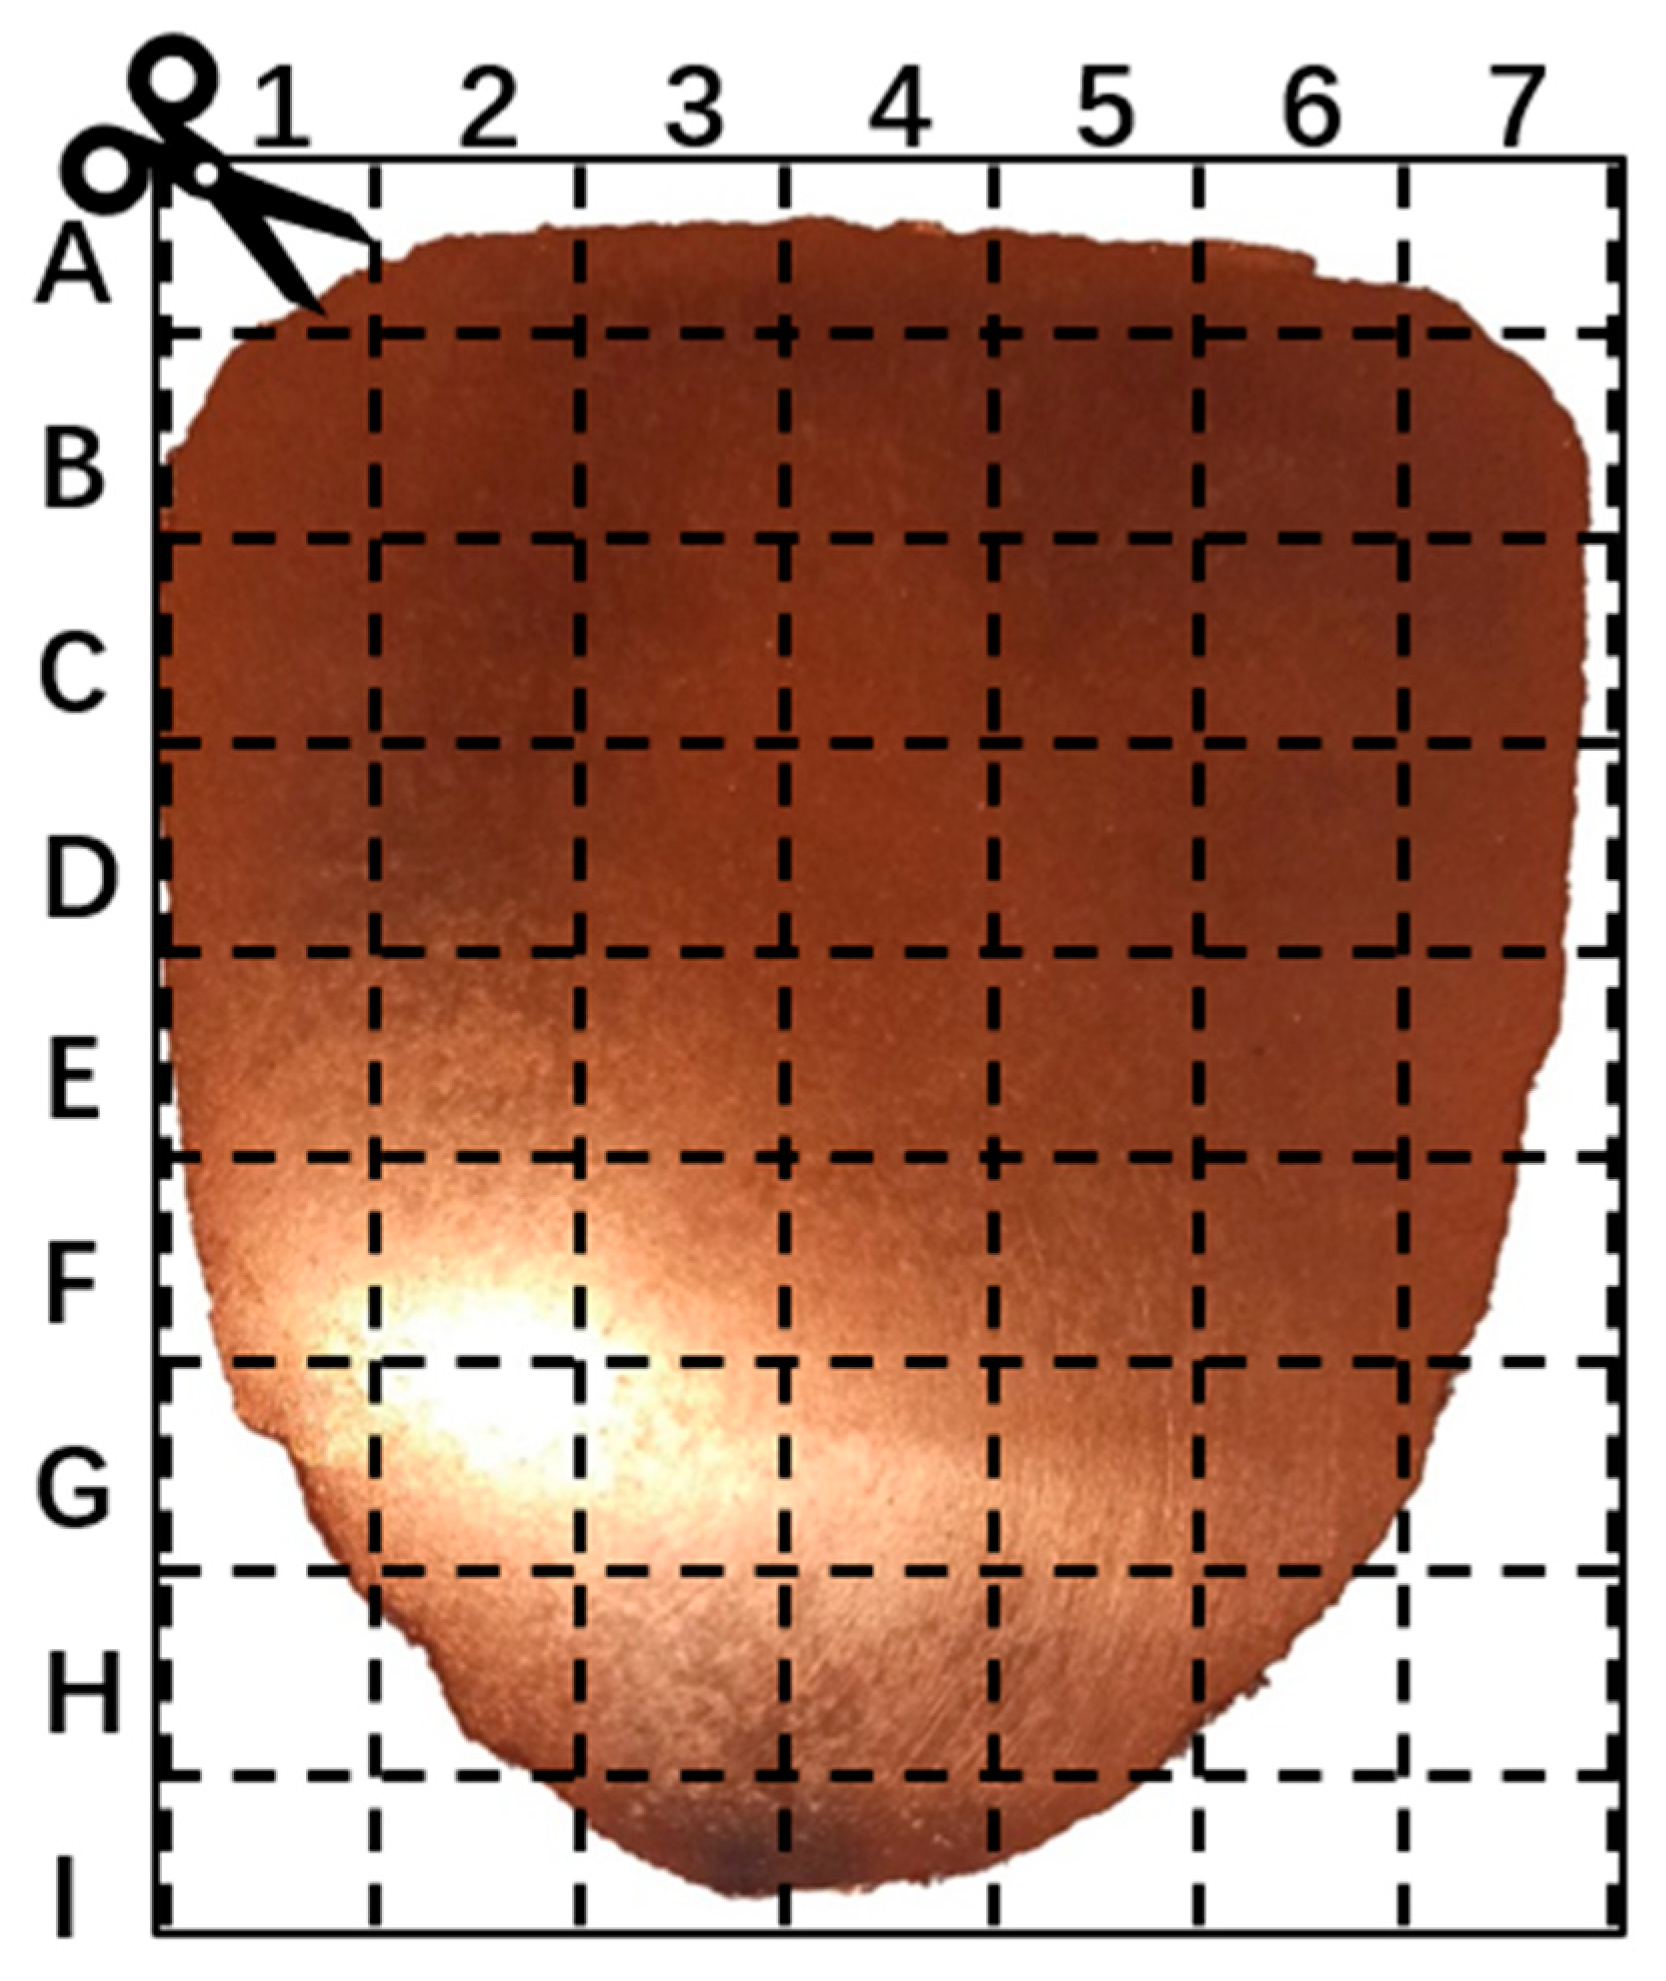
Two kinds of density, viz., apparent density and true density, were involved in this work. The apparent density of powder was measured by the Hall Flowmeter funnel as shown in Table 1, according to the standard test method (GB/T 1479.1-2011) [21], while the true density was measured according to Archimedes’ principle, where the value was an average of three tests. To compare the simulated and experimental values, the density of green sheets produced from rolling experiments were numbered and clipped in section, as depicted in Figure 2, and then the density contour diagram was obtained by measuring the true density of each piece.

Table 1.
Apparent Density.
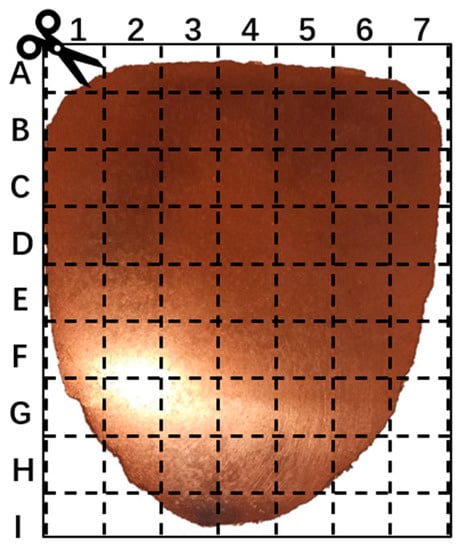
Figure 2.
Schematic diagram of number clipping.
2.3. Brazilian Disk and Uniaxial Compression Experiments
Generally, cylindric blocks were obtained by compressing copper powder on the hydraulic universal testing machine (WE-600, Ji’nan test machine Factory, Ji’nan, China), where the pressure ranged from 100 MPa to 400 MPa with an interval of 50 MPa. Then, cylindrical blocks were subjected to Brazilian disk and uniaxial compression experiments. In Brazilian disk experiment, viz., diametrical compression test, the block side was in contact with the surface of the mold, and then the experiment was performed by a universal testing machine (WDW-20, Ji’nan Time Test Instrument Co., Ltd., Ji’nan, China) at a rate of 0.25 mm/min. A special mold with the arc loading angle (20°) of upper and lower die was used to reduce stress concentration in the load zone and ensure stability as well as accuracy [22]. In uniaxial compression experiment, samples were cut by electrical spark cutting from cylindric blanks and then carried out at a rate of 0.25 mm/min in order to obtain fracture strength.
2.4. Direct Powder Rolling Test
In order to verify the reliability of the numerical simulation, DPR experiments were carried out on a powder rolling machine (ZK-GZJ-12100E, Dongguan Gaomin machinery Factory, Dongguan, China), where the diameter of the roller is 114 mm, the rolling speed can be adjusted in the range from 35 rpm to 50 rpm with an interval of 5 rpm, and the rolling gap can range from 0.1 mm to 0.25 mm with an interval of 0.05 mm. The DPR parameters, viz., particle gradation, rolling speed and rolling gap, were selected according to typical numerical simulation results.
3. Modeling
3.1. Modified DPC Model
A schematic diagram of the modified DPC model, as shown in Figure 3, was presented by a relationship between hydrostatic pressure stress (p) and deviatoric stress (t) [23]. The curve consists of three parts, viz., the shear failure surface on the left (Fs, shown by a green line), the smooth transition surface on the upper side (Ft, shown by a yellow curve) and the cap side on the right (Fc, shown by a blue elliptic curve). Fs controls the primary shearing flow stage, and the straight-line shape means that hardening will not occur, namely, ideal plasticity. Fc provides an inelastic hardening mechanism to account for plastic compaction of the powder when it starts to yield, and helps to limit volume dilatancy in shear condition. Ft acts as a smooth connection of Fc and Fs, and facilitates numerical fitting.
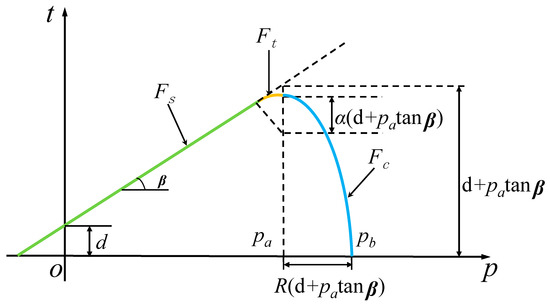
Figure 3.
Schematic of the modified DPC model [23].
The three segments of p-t curve, viz., Fs, Fc and Ft, can be written as below [24]:
where d and β are cohesion and angle of friction of the powder, respectively. R and α are cap eccentricity and radius of transition surface, which are closely related to the geometric shape of the cap and transition zone, respectively. Usually, α is regarded as 0.03 to obtain a smooth transition surface [25]. Pa is the corresponding p value when the cap surface curve intersects the smooth transition surface curve, and can be expressed by the following equation when R is set as 0.6 [24]:
where σz is stress along z-axis in the die compaction experiment. While the intersect of Fc with p axis (named as hydrostatic pressure yield stress, Pb) can be confirmed by using the following equation:
where Pb is a key parameter to describe the cap hardening or softening law and is defined as the function of volumetric plastic strain [17]. The volumetric plastic strain can be calculated by taking the natural logarithm of the ratio of current relative density (ρ) to the initial relative density (ρ0) [25,26]:
where ρ0 and ρ are the ratio of apparent density and current density (under any values of z-axis stress σz) to theoretical density, respectively. Subsequently, the hardening law can be described by the Pb- curve.
3.2. Finite Element Modeling
During the direct powder rolling process, a free-flow powder is transformed into a green sheet with sufficient strength and density at room temperature before undergoing three stages. Herein, the schematic diagram of the cross section in the DPR process is shown in Figure 4a, where the radius of the roller is r and the center of two rollers are marked as O1 and O2, respectively. The angle between the boundary line BG and neutral line O1D is defined as bite angle α1, while that between the boundary line CF and neutral line O2E is defined as compaction angle α2. The DPR process is always divided into the following three stages: slip and rearrangement of powder particles in the hopper, coordinated deformation between powder particles, and discontinuous contact between rollers and powders. The first stage occurs in the ABGHJ area, where the particles are slipped and rearranged without deformation, since they are not affected by the rollers, so the relative density is only slightly higher than the initial loose density. The second stage occurs in the BCFG area, also known as the bite zone, where powder particles undergo elastoplastic deformation. In this region, big particles are deformed and bitten with each other due to the friction force of roller surfaces, thus leading to an obvious increase in density. The third stage occurs in the CDEF area, where the powders yield to large plastic deformation and work hardening under the action of rolling force, thus giving rise to a striking increase in both strength and density.
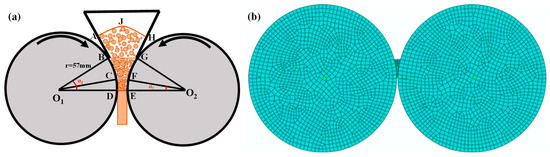
Figure 4.
Schematic diagram of (a) direct powder rolling process, and (b) FE model set-up.
It is worth mentioning that the finite element method based on continuum modeling is a common tool for simulating material behavior during the DPR process. Since there is almost no deformation in the first stage, the DPR process can be simply treated as a curve-edged trapezoidal continuum model in the numerical simulation process (Figure 4b), where only the last two stages were considered. The diameter of the roller used in the finite element simulation was the same as that in the experimental investigation, in order to predict the density of the green sheet more precisely; the deformation behavior of the powder was described by the modified DPC model and an 8-node linear brick element, namely, C3D8R, was employed for the analysis. In addition, the finite element mesh used was 3D. The finite element is controlled by global size and the size of each element is approximately 0.25. Then, software automatically meshes the part into many elements. In order to analyze the influence of the main DPR factors on the forming quality of the green sheet, namely, particle gradation, rolling speed as well as rolling gap, the orthogonal experiment design was a scientific method carried out by numerical simulation. Each of the three influencing factors was divided into four levels, as shown in Table 2, and the orthogonal array for the 16 experiments (L16_4_5) is listed in Table 3.
Table 2.
Factor and level values.
Table 3.
L16_4_5 orthogonal craft used in numerical simulation.
4. Determination of the Modified DPC Parameters
The use of the finite element method with the goal to simulate the DPR process mainly requires plastic (the modified DPC model parameters) and elastic parameters. In the above established finite element modeling, the bite angle of most metal powders is 7°~9° [27]. For the elastic parameters, Young’s Modulus (E), Poisson’s ratio (ν) and friction coefficient of Cu are 129.8 GPa, 0.343 and 0.3, respectively [28]. However, the plastic parameters, such as friction angle (β), cohesion (d) and hardening curve Pb, still remain unknown. To gain these input experimental data, cylindrical blocks required as wide a range of relative density as possible from the die compaction experiment. Hence, a series of experiments at different relative density blocks should be implemented to describe the plastic behavior of metal powder from Brazilian disk and uniaxial compression experiments.
Firstly, the friction angle β and cohesion d were calculated from the results of Brazilian disk and uniaxial compression experiments [25]; the specific process can be described as follows:
- (1)
- Conforming the relationship curves between relative density and load by die compaction experiment [26,29], as shown in Figure 5a;
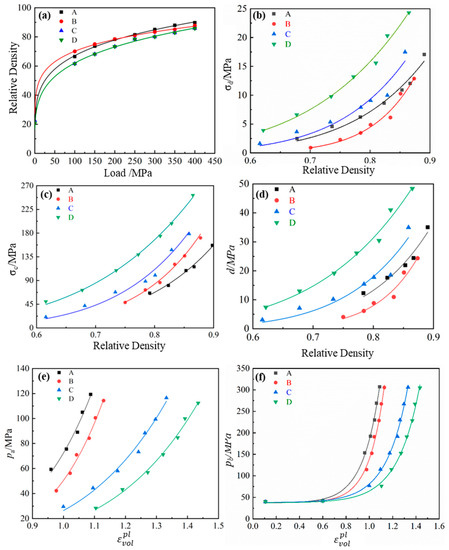 Figure 5. (a) Relative density changes with pressure, (b) the relationship between the breaking strength and relative density of Brazilian disks, (c) the relationship between uniaxial compression fracture strength and relative density, (d) the relationship between the cohesion parameter d and relative density, (e) the relationship between Pa and volumetric strain, (f) hardening curve of pure copper powder.
 - (2)
- Carrying out Brazilian disk experiments on the die compacted blocks with different densities (the crack image of the green compact is shown in Figure 6a) and calculating the fracture strength σd according to the Griffiths standard, which can be expressed as [22,30]:where the load of sample is F. D and h are the diameter and height of the sample, respectively. The relationship between fracture strength and relative density is shown in Figure 5b, as follows:
 Figure 6. Fracture morphology of (a) Brazilian disk experiment and (b) uniaxial compression experiment.
 - (3)
- Performing uniaxial compression experiments on die compacted blocks with different densities and calculating the fracture strength σc using the following equation, as shown in Figure 5c. Here, the actual fracture mode of the cylindrical specimen (shown in Figure 6b) is in accordance with the theoretically expected axial or oblique fracture, suggesting that the experimental results are reliable.
- (4)
- Calculating the friction angle β and cohesion d by substituting the values of σd and σc into Equations (9) and (10), as shown in Figure 5d.
Subsequently, substituting the values of all the parameters into Equations (4)–(6), the Pa- and Pb- curves can be obtained, as shown in Figure 5e,f, respectively. All the parameters of the modified DPC model are obtained.
5. Results and Discussion
5.1. Quasi-Static Criterion
The DPR process is considered to be a quasi-static process due to the relatively low rotating speed, thus the simulation process is also required to be carried out under low speed. However, low rolling speed causes a very long computation process and a non-even convergent [30]. Hence, the speed adopted in the simulation is much higher, but this brings out the introduction of inertial force, and thus may lead to unreliable results. In this case, the energy balance concept is involved to judge whether the numerical simulation results reflect a quasi-static solution. It is a common understanding that the simulation process can be treated as a quasi-static state and the results are reliable when the system kinetic energy, relative to the internal energy (ALLKE/ALLIE), does not exceed 1–5% [31]. Figure 7a shows the ALLKE/ALLIE values of the DPR process with different parameters in time history output. It is clear that the peak values of ALLKE/ALLIE do not exceed 1% in the range of the parameters used in this paper; hence, the following results can be accepted. In addition, it is worth noting the finite element mesh quality during its deformation in the computer simulation of the rolling process, and the popular way of checking finite element mesh quality is via calculating the ratio of artificial energy to internal energy (ALLAE/ALLIE), which should not exceed 10% in order to provide reliable results. In this model, the peak values of ALLAE/ALLIE are around 5% lower than 10%, as shown in Figure 7b.
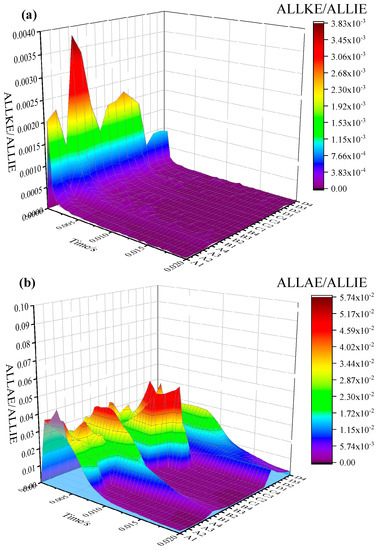
Figure 7.
(a) The ratio of kinematic energy to internal energy corresponding to the parameters used in simulation, (b) the ratio of artificial energy to internal energy corresponding to the parameters used in simulation.
5.2. Rolling Results
For the DPR craft, the density and shape of the green sheet are essential for evaluating the formation quality, and both of them are very sensitive to DPR parameters. Subsequently, it is necessary to comprehensively analyze the influence of DPR parameters on the density and shape of green sheets. Figure 8 summarizes the simulated density distribution profile of the green sheets with different parameters. It is clear that group B has higher formation quality, including uniform density and regular shape, especially under relatively high rolling speed, as shown in Figure 8b3, b4. For better clarifying the influence of particle gradation (δ), rolling speed (τ) and rolling gap (γ) on the forming quality, a range analysis was carried out and the calculation results of mean (K) and range value (R’) for the 16 numerical simulation results are shown in Table 4. A range analysis can reflect the sensitivity of the influencing factors to the formation quality of the green sheet. The R’ was calculated by the difference between the minimum and maximum values of K. The larger the range value is, the more sensitive the influencing factor is. This suggests that the descending order is δ > τ > γ, based on the order of R’, as shown in Table 4. Furthermore, the factors of δ > τ > γ correspond to the physical parameters of particle gradation > rolling speed > rolling gap. Hence, the parameter δ is the most significant factor that influences the density and shape of the green sheet. Based on the results in Table 4, it is concluded that K2 > K3 > K4 > K1 for factor δ, K4 > K3 > K2 > K1 for factor τ, and K3 > K1 > K4 > K2 for factor γ. As a result, the optimal combination of DPR parameter factors is δ2τ4γ3. In summary, the quality of a green sheet is mainly influenced by particle gradation and the most homogeneous structures are obtained at a particle gradation condition of 2:1, rolling speed of 50 rpm and rolling gap of 0.2 mm, as shown in Figure 8b4.

Figure 8.
Density distribution under different rolling conditions (particle gradation conditions of group (a–d) are 3:0, 2:1, 1:2 and 0:3 under the weight ratio of 150 μm to 74 μm, respectively).
Table 4.
Range analysis of DPR process on density in simulation.
In order to verify the reliability of the numerical simulation, DPR experimental investigations have also been carried out under typical conditions in simulation, viz., A4, B4, C4 and D2, and the results are shown in Figure 9, where the high- and low-density areas are highlighted by using red and blue dotted circles, respectively, in order to directly compare between the experimental and simulation results. It is obvious that the low-density area is scattered in the middle of the high-density area in A4, C4 and D2 samples. It was found that the true density distribution profiles and morphologies are similar to the simulation results, although the true density is slightly higher than that obtained by the numerical simulation. On the whole, the DPR green sheets are tongue-shaped and the DPR parameters have a significant influence on the morphology as well as density distribution. Comparatively speaking, the treating conditions B4 and C4 can result in relative integrated shapes by the naked eye, but the former has much higher density values as well as better homogeneity of density. The numerical simulation method established in the present work can be used to predict and optimize the DPR process of pure Cu powder. Based on the above simulation and experimental studies, the DPR parameters obtaining the most homogeneous structure for Cu powder can be confirmed as particle gradation of 150 μm to 74 μm at 2:1 weight ratio, rolling speed of 50 rpm and rolling gap of 0.2 mm. Furthermore, the density of the resulting green sheet is mainly 7.5~8.0 g/cm3, which can be easily handled and shipped to the following pressure-less sintering, since the relative density is higher than 80% [32,33].
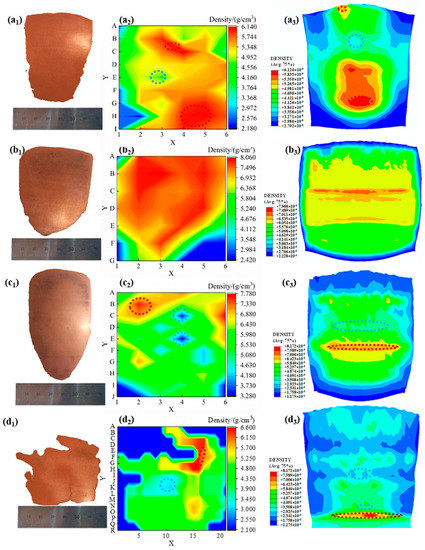
Figure 9.
Macroscopic feature morphology and density distribution in experiment as well as in simulation of (a1–a3) A4, (b1–b3) B4, (c1–c3) C4, (d1–d3) D2.
Considering that the green sheet will be transferred from the powder rolling machine to the sintering furnace [33], it is meaningful to evaluate the mechanical properties of the green sheet. Although the DPR sheet can be moved and held by hand, a quantitative method is still needed. However, it is very difficult to measure the mechanical strength by a regular tensile test machine, since the load-bearing capacity of the green sheet is too low; hence, an approximate investigation was carried out in the present work, as illustrated by Figure 10. Firstly, a DPR process of the optimal parameters was employed for Cu powder, and then a green sheet with a thickness of about 0.47 mm was obtained. Subsequently, the sheet was cut into a dog bone specimen with a rectangle section on the gauge part. Finally, the sample was fixed by a nail and a rubber band, and then the weight, with a maximum weigh of 20 g, was hanged without damage, suggesting that the green sheet prepared by the DPR process with the parameters optimized by numerical and experimental investigations is reliable. The finite element modeling and methods for obtaining the key physical parameters can be adopted to study the DPR process of metal powder.

Figure 10.
Tensile sample withstand 20 g of weight.
6. Conclusions
In this work, the modified Drucker–Prager/Cap model was applied to describe the powder deformation behavior during the direct powder rolling process, and the key physical parameters were obtained via Brazilian disk and uniaxial compression experiments. Based on this knowledge, finite element modeling was established, and the influence of three major factors (particles gradation, rolling speed as well as rolling gap) on the DPR quality were studied by orthogonal simulation followed by experimental verification. The main results can be concluded as follows:
- (1)
- The numerical simulation indicates that the descending order of influencing factors is particle gradation > rolling speed > rolling gap. The highest mechanical properties are achieved at particle gradation of 150 μm to 74 μm at 2:1, rolling speed of 50 rpm and rolling gap of 0.2 mm.
- (2)
- The simulation results are demonstrated to be accurate via direct powder rolling experiments, whereas the true density is slightly higher than that by the simulation. The density of the DPR green sheet is mainly 7.5~8.0 g/cm3, and reaches 80% of the theoretical density of Cu blocks, which is suitable for pressure-less sintering, and the mechanical strength can withstand the transferring process from the DPR machine to the sintering furnace.
- (3)
- The modified DPC model, experimental methods for obtaining the key physical parameters, and the modeling process of finite element simulation can be successfully used to guide the parameters optimization of direct powder rolling of metal powder for effectively preparing thin metal sheets.
Author Contributions
Conceptualization, C.Z. and L.J.; methodology, C.Z.; software, C.Z.; validation, C.Z., L.J. and H.X.; formal analysis, C.Z.; investigation, C.Z.; resources, L.J. and H.X.; data curation, L.J., R.N. and K.K.; writing–original draft preparation, C.Z.; writing–review and editing, L.J., H.X., Z.L. and K.K.; visualization, C.Z.; supervision, L.J., R.N., Z.L. and K.K.; project administration, L.J. and H.X.; funding acquisition, L.J. and H.X. All authors have read and agreed to the published version of the manuscript.
Funding
This research was funded by National Nature Science Foundation of China (51871173/51875453) and International Collaboration Program of Science and Technology Department of Shaanxi Province (2021KW-23). And The APC was funded by National Nature Science Foundation of China (51871173).
Acknowledgments
The authors are grateful to National Nature Science Foundation of China (51871173/51875453) and International Collaboration Program of Science and Technology Department of Shaanxi Province (2021KW-23) for financial support.
Conflicts of Interest
The authors declare no conflict of interest.
References
- Breedis, J.F.; Chia, P.Y.; Goh, Y. Electronic Packaging: Lead Frame Materials. In Reference Module in Materials Science and Materials Engineering; Elsevier: Amsterdam, The Netherlands, 2017. [Google Scholar]
- Zhang, J.; Lu, Z.; Jia, L.; Xie, H.; Wei, X.; Tao, S. Effect of Multiple Forging on the Microstructure and Properties of an As-Cast Cu-Ni-Si Alloy with High Ni and Si Contents. Mater. Res. Express 2021, 8, 126526. [Google Scholar] [CrossRef]
- Dölling, J.; Henle, R.; Prahl, U.; Zilly, A.; Nandi, G. Copper-Based Alloys with Optimized Hardness and High Conductivity: Research on Precipitation Hardening of Low-Alloyed Binary CuSc Alloys. Metals 2022, 12, 902. [Google Scholar] [CrossRef]
- Guo, X.F.; Jia, L.; Lu, Z.L.; Xing, Z.G.; Xie, H.; Kondoh, K. Preparation of Cu/CrB2 Composites with Well-Balanced Mechanical Properties and Electrical Conductivity by Ex-Situ Powder Metallurgy. J. Mater. Res. Technol. 2022, 17, 1605–1615. [Google Scholar] [CrossRef]
- Sousa, T.G.; de Brito Moura, I.A.; da Costa Garcia Filho, F.; Monteiro, S.N.; Brandão, L.P. Combining Severe Plastic Deformation and Precipitation to Enhance Mechanical Strength and Electrical Conductivity of Cu-0.65Cr-0.08Zr Alloy. J. Mater. Res. Technol. 2020, 9, 5953–5961. [Google Scholar] [CrossRef]
- Guo, X.; Song, K.; Xu, W.; Li, G.; Zhang, Z. Effect of TiB2 Particle Size on the Material Transfer Behaviour of Cu–TiB2 Composites. Mater. Sci. Technol. 2020, 36, 1685–1694. [Google Scholar] [CrossRef]
- Stavroulakis, P.; Toulfatzis, A.; Vazdirvanidis, A.; Pantazopoulos, G.; Papaefthymiou, S. Mechanical Behaviour and Microstructure of Heat-Treated Cu–Ni–Si Alloy. Mater. Sci. Technol. 2020, 36, 939–948. [Google Scholar] [CrossRef]
- Geng, G.; Wang, D.; Zhang, W.; Liu, L.; Laptev, A.M. Fabrication of Cu–Ni–Si Alloy by Melt Spinning and Its Mechanical and Electrical Properties. Mater. Sci. Eng. A 2020, 776, 138979. [Google Scholar] [CrossRef]
- Li, J.; Huang, G.; Mi, X.; Peng, L.; Xie, H.; Kang, Y. Relationship between the Microstructure and Properties of a Peak Aged Cu–Ni–Co–Si Alloy. Mater. Sci. Technol. 2019, 35, 606–614. [Google Scholar] [CrossRef]
- Cantin, G.M.D.; Kean, P.L.; Stone, N.A.; Wilson, R.; Gibson, M.A.; Yousuff, M.; Ritchie, D.; Rajakumar, R. Innovative Consolidation of Titanium and Titanium Alloy Powders by Direct Rolling. Powder Metall. 2011, 54, 188–192. [Google Scholar] [CrossRef]
- Wang, H.S.; Chen, H.G.; Gu, J.W.; Hsu, C.E.; Wu, C.Y. Improvement in Strength and Thermal Conductivity of Powder Metallurgy Produced Cu-Ni-Si-Cr Alloy by Adjusting Ni/Si Weight Ratio and Hot Forging. J. Alloys Compd. 2015, 633, 59–64. [Google Scholar] [CrossRef]
- Jiang, Y.B.; Zhang, T.T.; Lei, Y.; Liu, X.H.; Cap, Y.; Xie, J.X.; Zhao, B.; Li, Y.H.; Jiao, C.R. Microstructure Evolution and Mechanical Properties of Cu-0.36Be-0.46Co Alloy Fabricated by Heating-Cooling Combined Mold Horizontal Continuous Casting during Cold Rolling. Trans. Nonferrous Met. Soc. China 2020, 30, 958–971. [Google Scholar] [CrossRef]
- Sakai, M.; Kondo, Y.; Minoura, S.; Sakamoto, T.; Hirasawa, T. A New Lead Alloy Current-Collector Manufactured by a Powder Rolling Process and Its Corrosion Behavior under Lead-Acid Battery Conditions. J. Power Sources 2008, 185, 559–565. [Google Scholar] [CrossRef]
- Li, R.; Shen, Q.; Zhang, L.; Zhang, T. Magnetic Properties of High Silicon Iron Sheet Fabricated by Direct Powder Rolling. J. Magn. Magn. Mater. 2004, 281, 135–139. [Google Scholar] [CrossRef]
- Chikosha, S.; Shabalala, T.C.; Chikwanda, H.K. Effect of Particle Morphology and Size on Roll Compaction of Ti-Based Powders. Powder Technol. 2014, 264, 310–319. [Google Scholar] [CrossRef]
- Alizadeh, M.; Hassanpour, A.; Pasha, M.; Ghadiri, M.; Bayly, A. The Effect of Particle Shape on Predicted Segregation in Binary Powder Mixtures. Powder Technol. 2017, 319, 313–322. [Google Scholar] [CrossRef]
- Diarra, H.; Mazel, V.; Busignies, V.; Tchoreloff, P. Sensitivity of Elastic Parameters during the Numerical Simulation of Pharmaceutical Die Compaction Process with Drucker-Prager/Cap Model. Powder Technol. 2018, 332, 150–157. [Google Scholar] [CrossRef]
- Drucker, D.; Gibson, R.; Henkel, D. Soil Mechanics and Work-Hardening Theories of Plasticity. Trans. ASCE 1957, 122, 338–346. [Google Scholar] [CrossRef]
- Baroutaji, A.; Lenihan, S.; Bryan, K. Compaction Analysis and Optimisation of Convex-Faced Pharmaceutical Tablets Using Numerical Techniques. Particuology 2019, 47, 10–21. [Google Scholar] [CrossRef]
- Zhou, M.; Huang, S.; Lei, Y.; Liu, W.; Yan, S. Investigation on Compaction Densification Behaviors of Multicomponent Mixed Metal Powders to Manufacture Silver-Based Filler Metal Sheets. Arab. J. Sci. Eng. 2019, 44, 1321–1335. [Google Scholar] [CrossRef]
- Guo, Z.; Zhu, D.; Pan, J.; Yang, C.; Li, S.; Dong, T.; Tian, H.; Yan, X. Efficient and Green Treatment of Ultrapure Magnetite to Prepare Powder Metallurgy Iron Powders. Powder Technol. 2021, 378, 19–28. [Google Scholar] [CrossRef]
- Gutiérrez-Moizant, R.; Ramírez-Berasategui, M.; Sánchez-Sanz, S.; Santos-Cuadros, S. Experimental Verification of the Boundary Conditions in the Success of the Brazilian Test with Loading Arcs. An Uncertainty Approach Using Concrete Disks. Int. J. Rock Mech. Min. Sci. 2020, 132, 104380. [Google Scholar] [CrossRef]
- SIMULIA Inc. Abaqus 6.9.1 Theory Manual. Providence, USA: Software Corporation, 2009, 115–120. Available online: http://130.149.89.49:2080/v6.9/index.html (accessed on 30 May 2022).
- Sinha, T.; Curtis, J.S.; Hancock, B.C.; Wassgren, C. A Study on the Sensitivity of Drucker-Prager Cap Model Parameters during the Decompression Phase of Powder Compaction Simulations. Powder Technol. 2010, 198, 315–324. [Google Scholar] [CrossRef]
- Zhou, R.; Zhang, L.H.; He, B.Y.; Liu, Y.H. Numerical Simulation of Residual Stress Field in Green Power Metallurgy Compacts by Modified Drucker-Prager Cap Model. Trans. Nonferrous Met. Soc. China 2013, 23, 2374–2382. [Google Scholar] [CrossRef]
- Zhou, M.; Huang, S.; Hu, J.; Lei, Y.; Xiao, Y.; Li, B.; Yan, S.; Zou, F. A Density-Dependent Modified Drucker-Prager Cap Model for Die Compaction of Ag57.6-Cu22.4-Sn10-In10 Mixed Metal Powders. Powder Technol. 2017, 305, 183–196. [Google Scholar] [CrossRef]
- Patel, B.A.; Adams, M.J.; Turnbull, N.; Bentham, A.C.; Wu, C.Y. Predicting the Pressure Distribution during Roll Compaction from Uniaxial Compaction Measurements. Chem. Eng. J. 2010, 164, 410–417. [Google Scholar] [CrossRef]
- Meyers, M.A.; Chawla, K.K. Mechanical Behavior of Materials; Cambridge University Press: New York, NY, USA, 2009; p. 114. [Google Scholar]
- Coube, O.; Riedel, H. Numerical Simulation of Metal Powder Die Compaction with Special Consideration of Cracking. Powder Metall. 2000, 43, 123–131. [Google Scholar] [CrossRef]
- Procopio, A.T.; Zavaliangos, A.; Cunningham, J.C. Analysis of the Diametrical Compression Test and the Applicability to Plastically Deforming Materials. J. Mater. Sci. 2003, 38, 3629–3639. [Google Scholar] [CrossRef]
- Demirci, H.E.; Bhattacharya, S.; Karamitros, D.; Alexander, N.; Singh, R.M. Finite element model of buried pipelines crossing strike-slip faults by ABAQUS/EXPLICIT. In Recent Advances on Earthquake Engineering in Europe: 16th; Springer: Cham, Switzerland, 2018; p. 46. [Google Scholar]
- Tao, J.; Zhu, X.; Tian, W.; Yang, P.; Yang, H. Properties and Microstructure of Cu / Diamond Composites Prepared by Spark Plasma Sintering Method. Trans. Nonferrous Met. Soc. China 2014, 24, 3210–3214. [Google Scholar] [CrossRef]
- Park, N.K.; Lee, C.H.; Kim, J.H.; Hong, J.K. Characteristics of Powder-Rolled and Sintered Sheets Made from HDH Ti Powders. Key Eng. Mater. 2012, 520, 281–288. [Google Scholar] [CrossRef]


Publisher’s Note: MDPI stays neutral with regard to jurisdictional claims in published maps and institutional affiliations. |
© 2022 by the authors. Licensee MDPI, Basel, Switzerland. This article is an open access article distributed under the terms and conditions of the Creative Commons Attribution (CC BY) license (https://creativecommons.org/licenses/by/4.0/).