
Critical Conditions for Dynamic Recrystallization of S280 Ultra-High-Strength Stainless Steel Based on Work Hardening Rate

Abstract
:1. Introduction
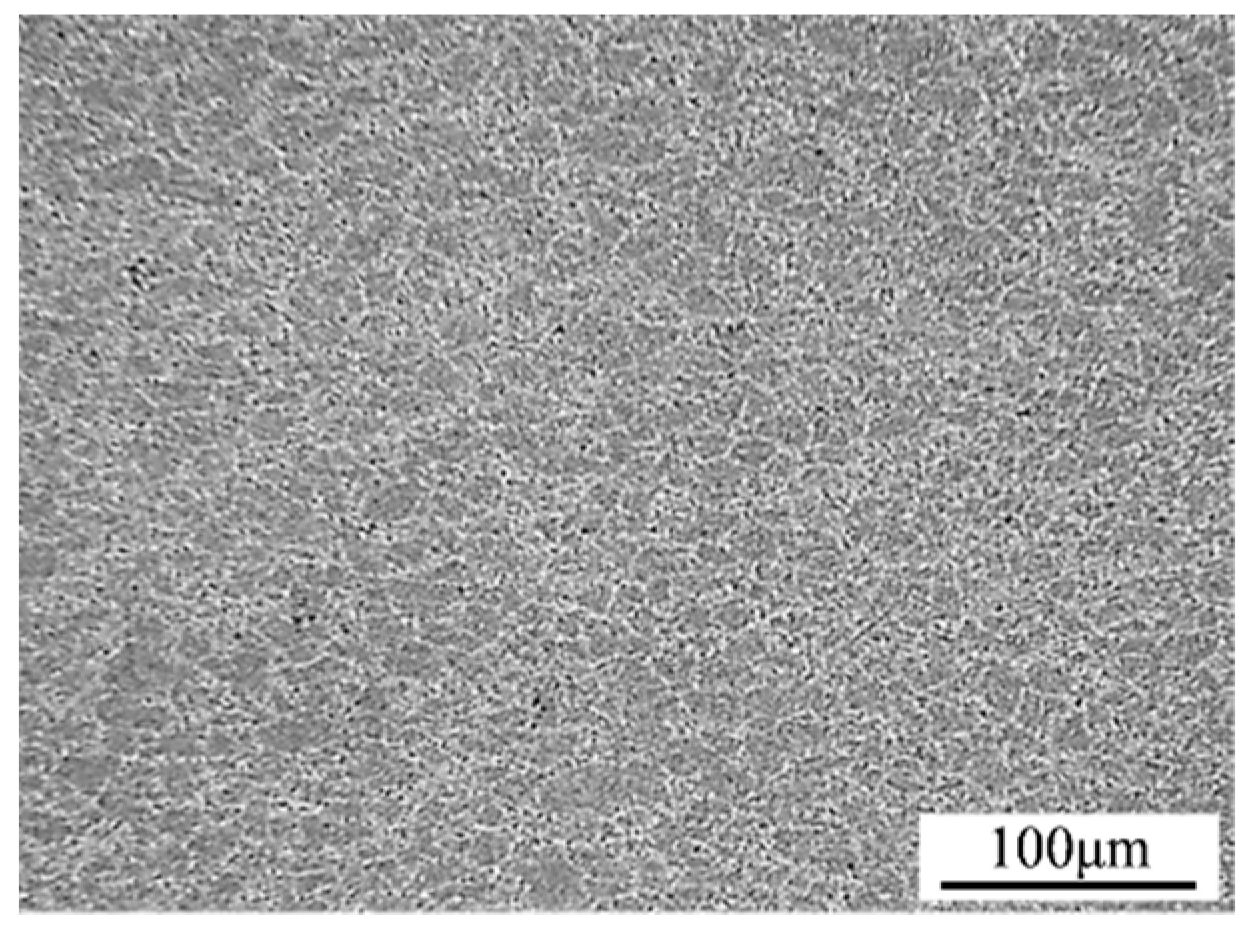
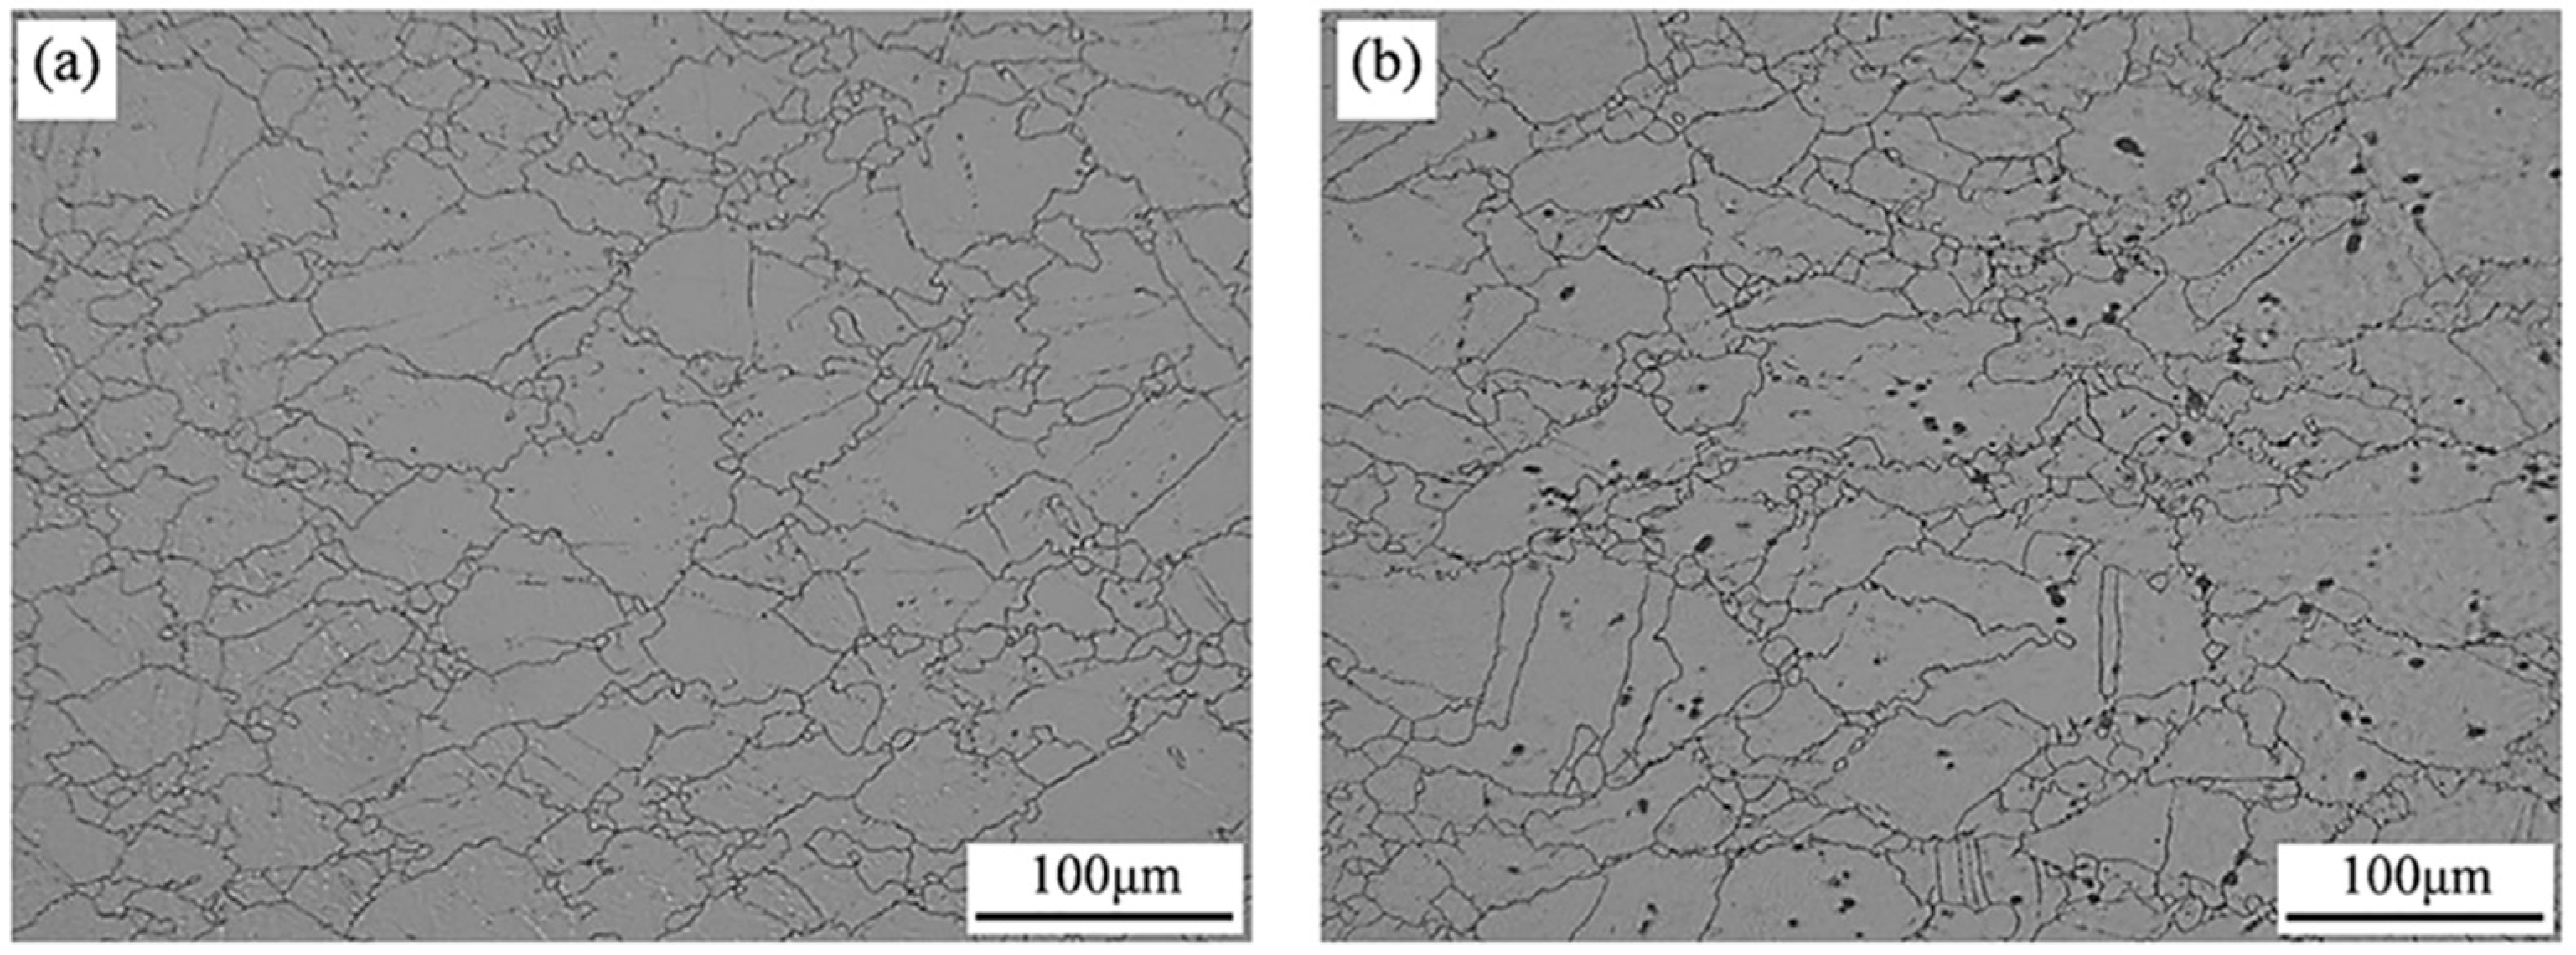
2. Materials and Methods
3. Results
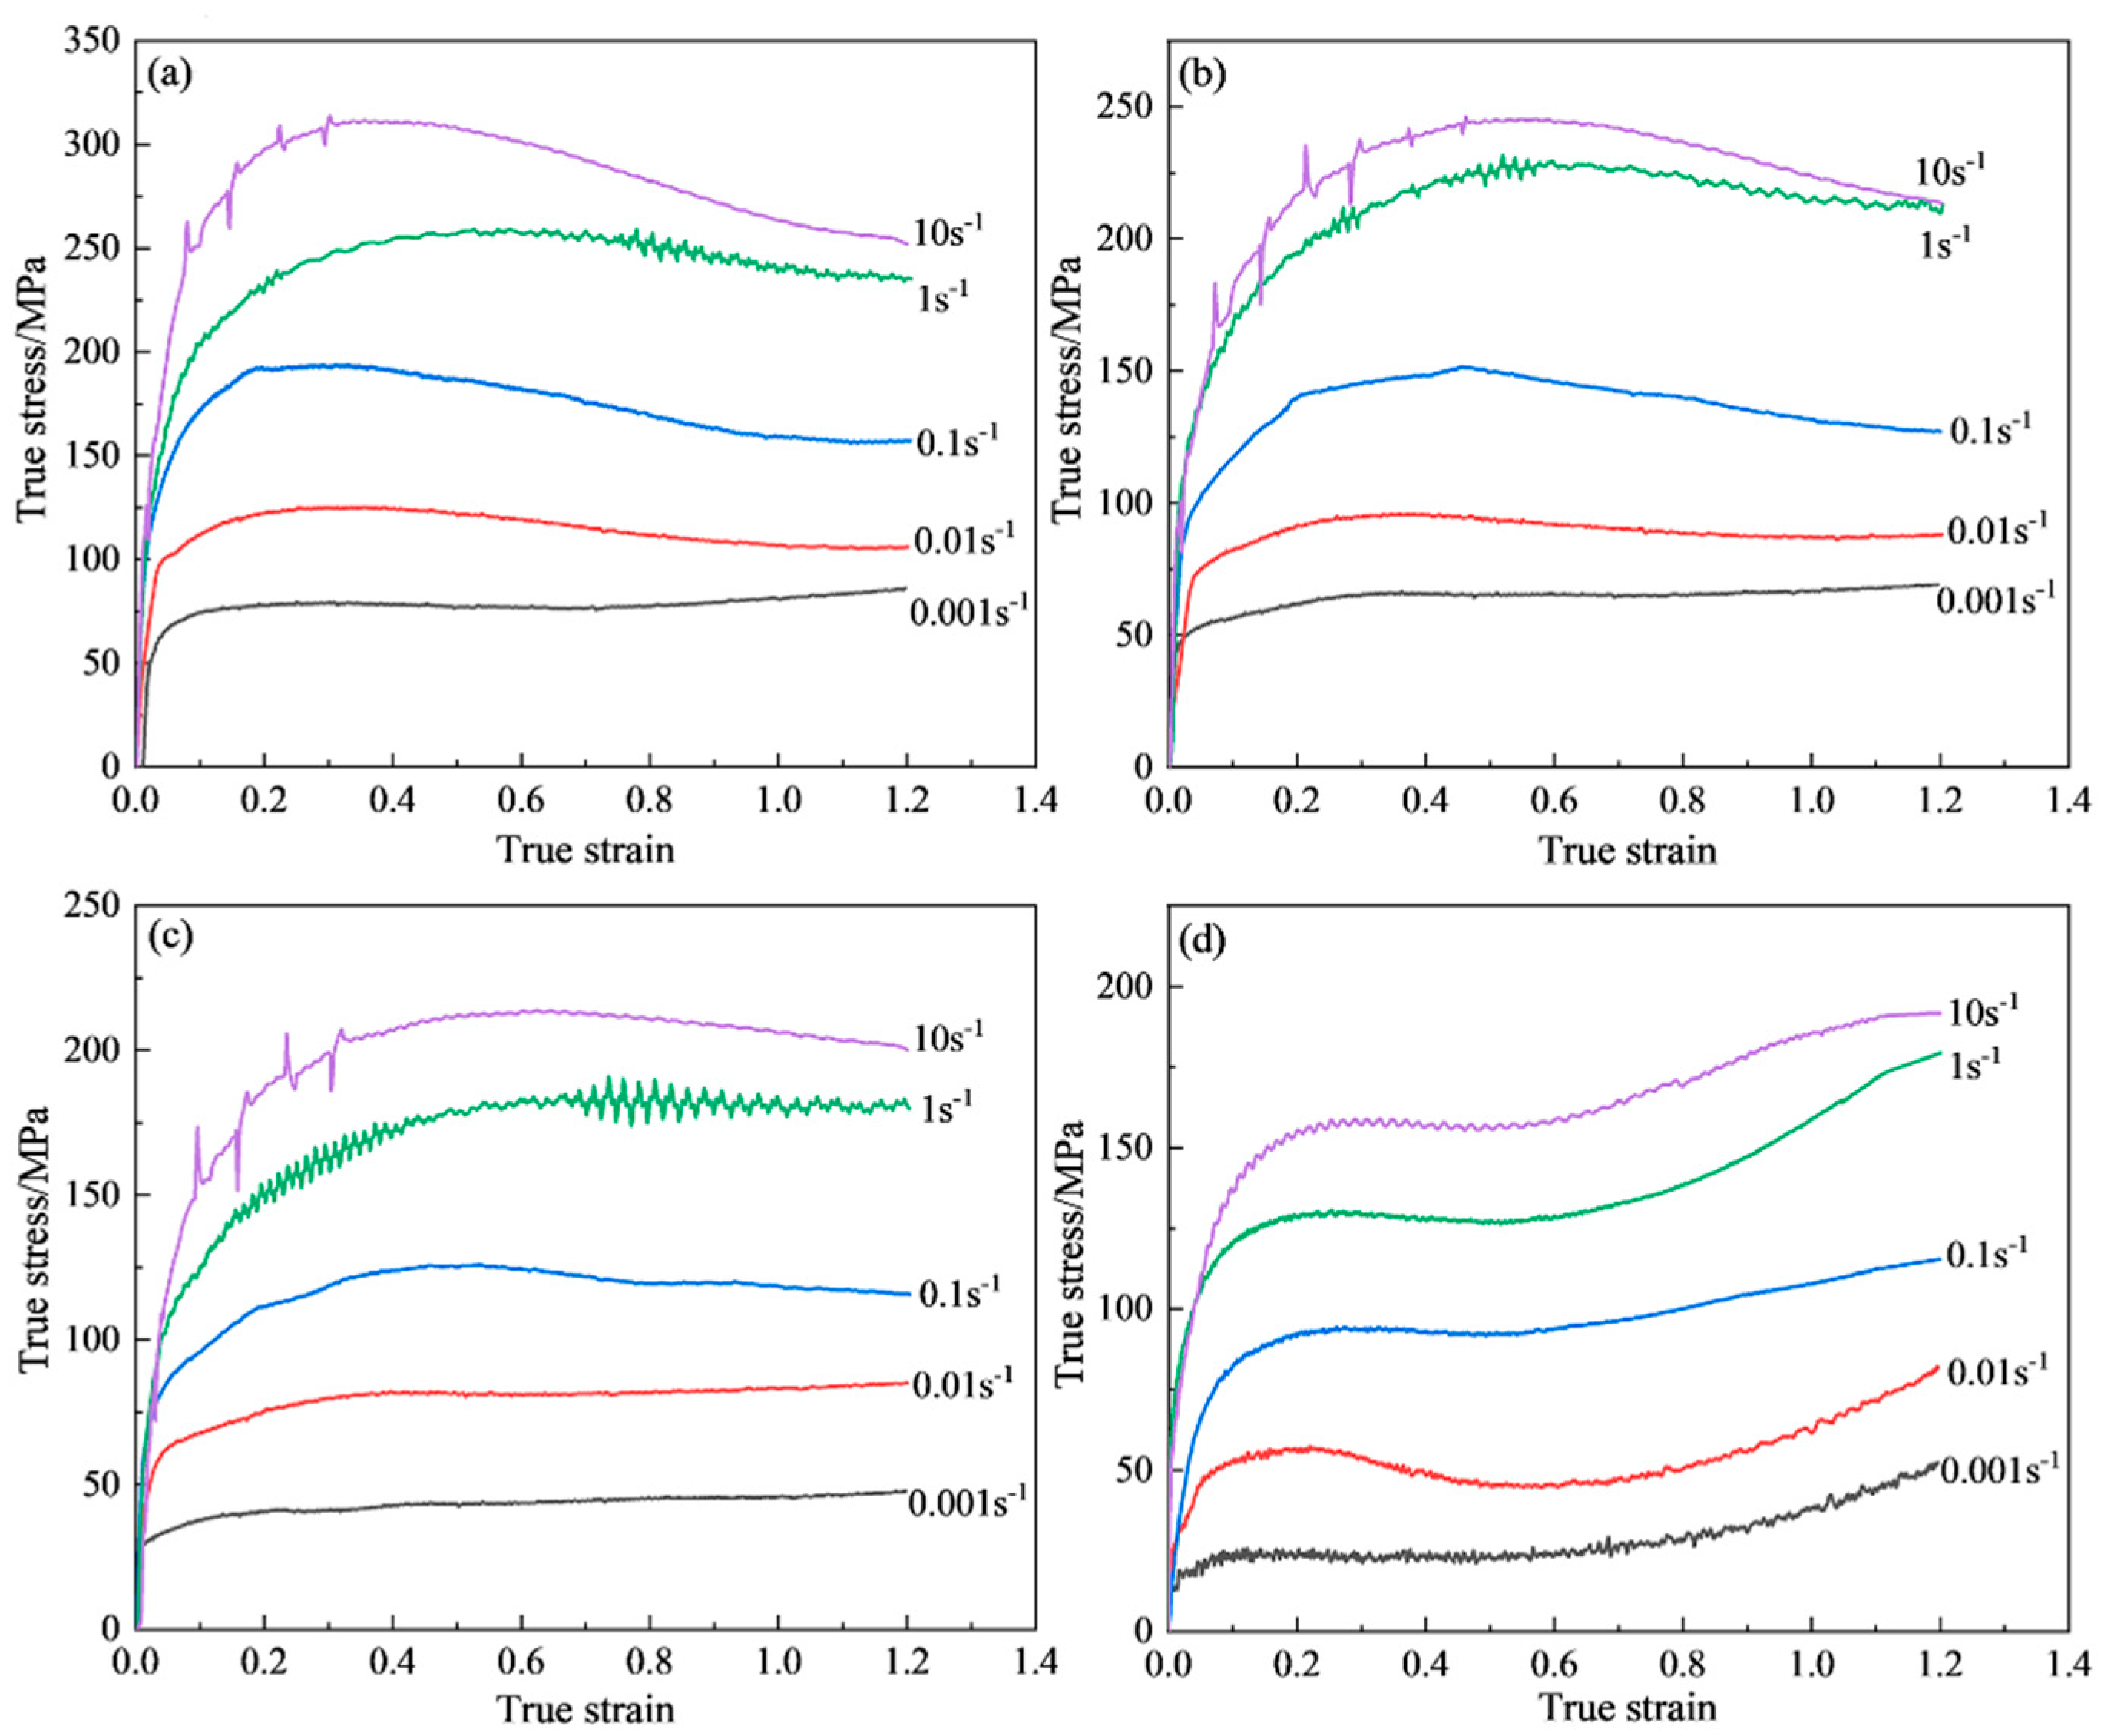
3.1. Analysis of Flow-Stress Curves
3.2. Calculation of Thermal-Deformation Activation Energy
3.3. Identification of Critical Conditions for DRX
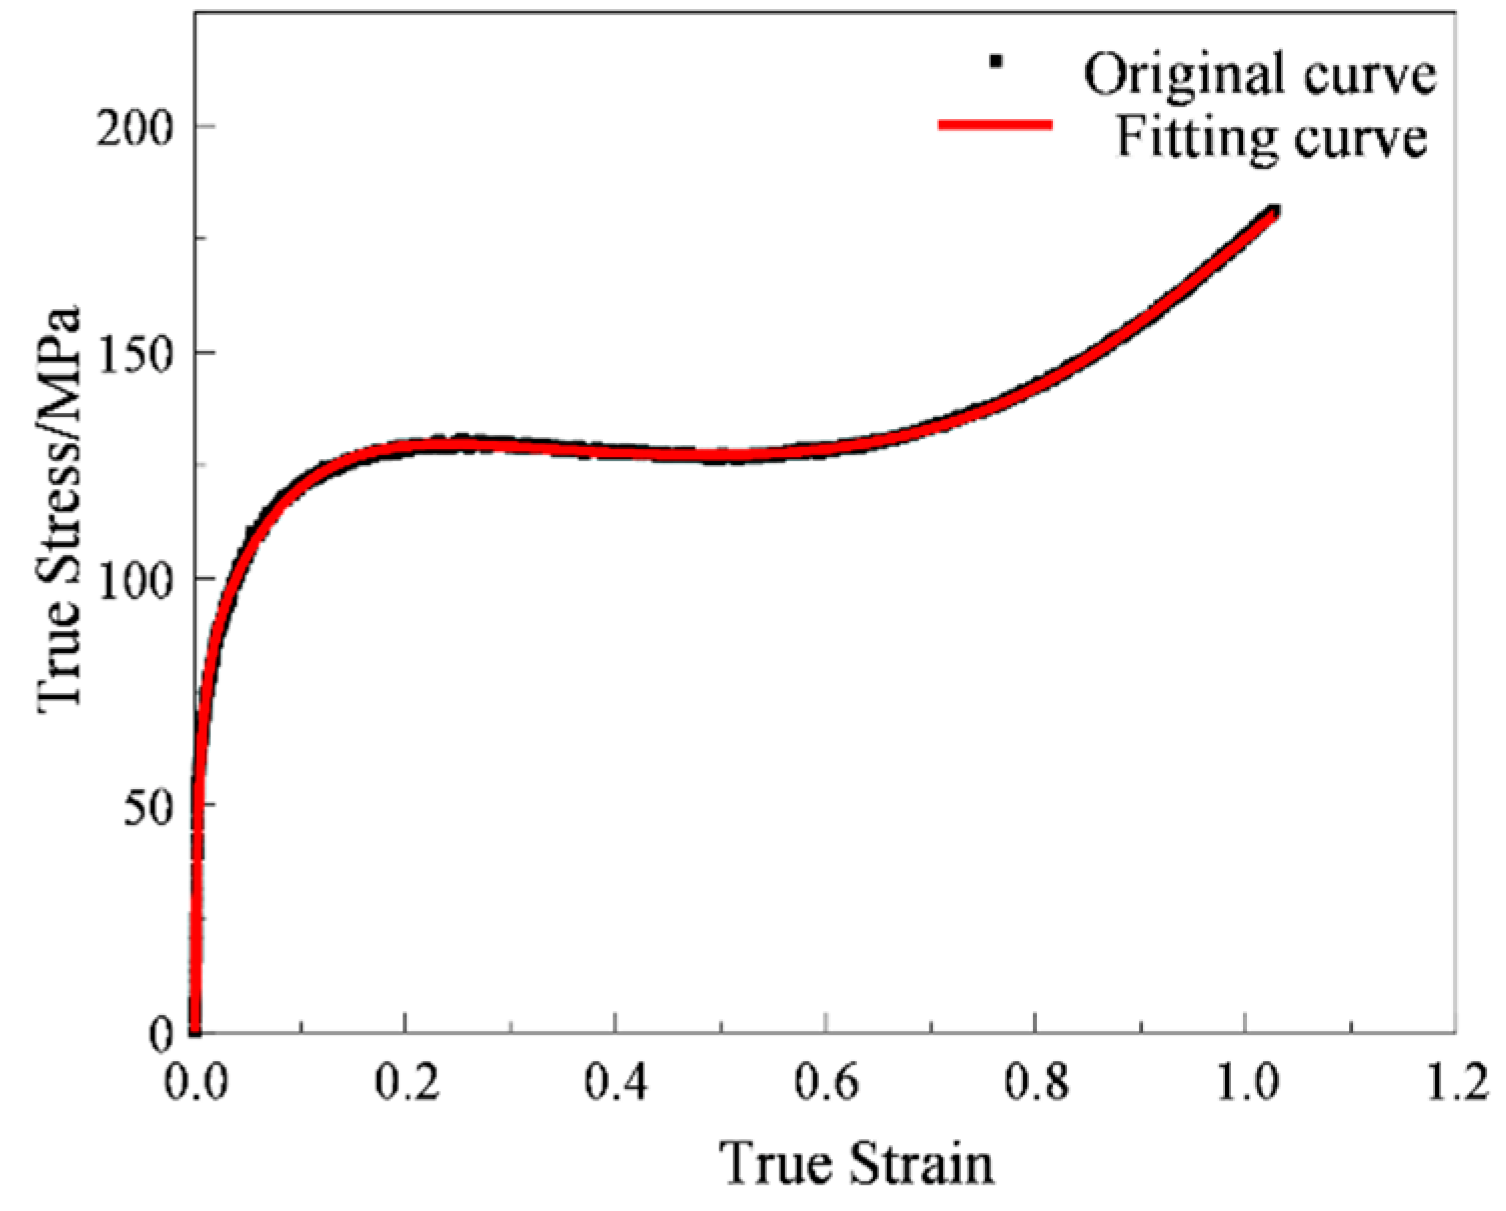
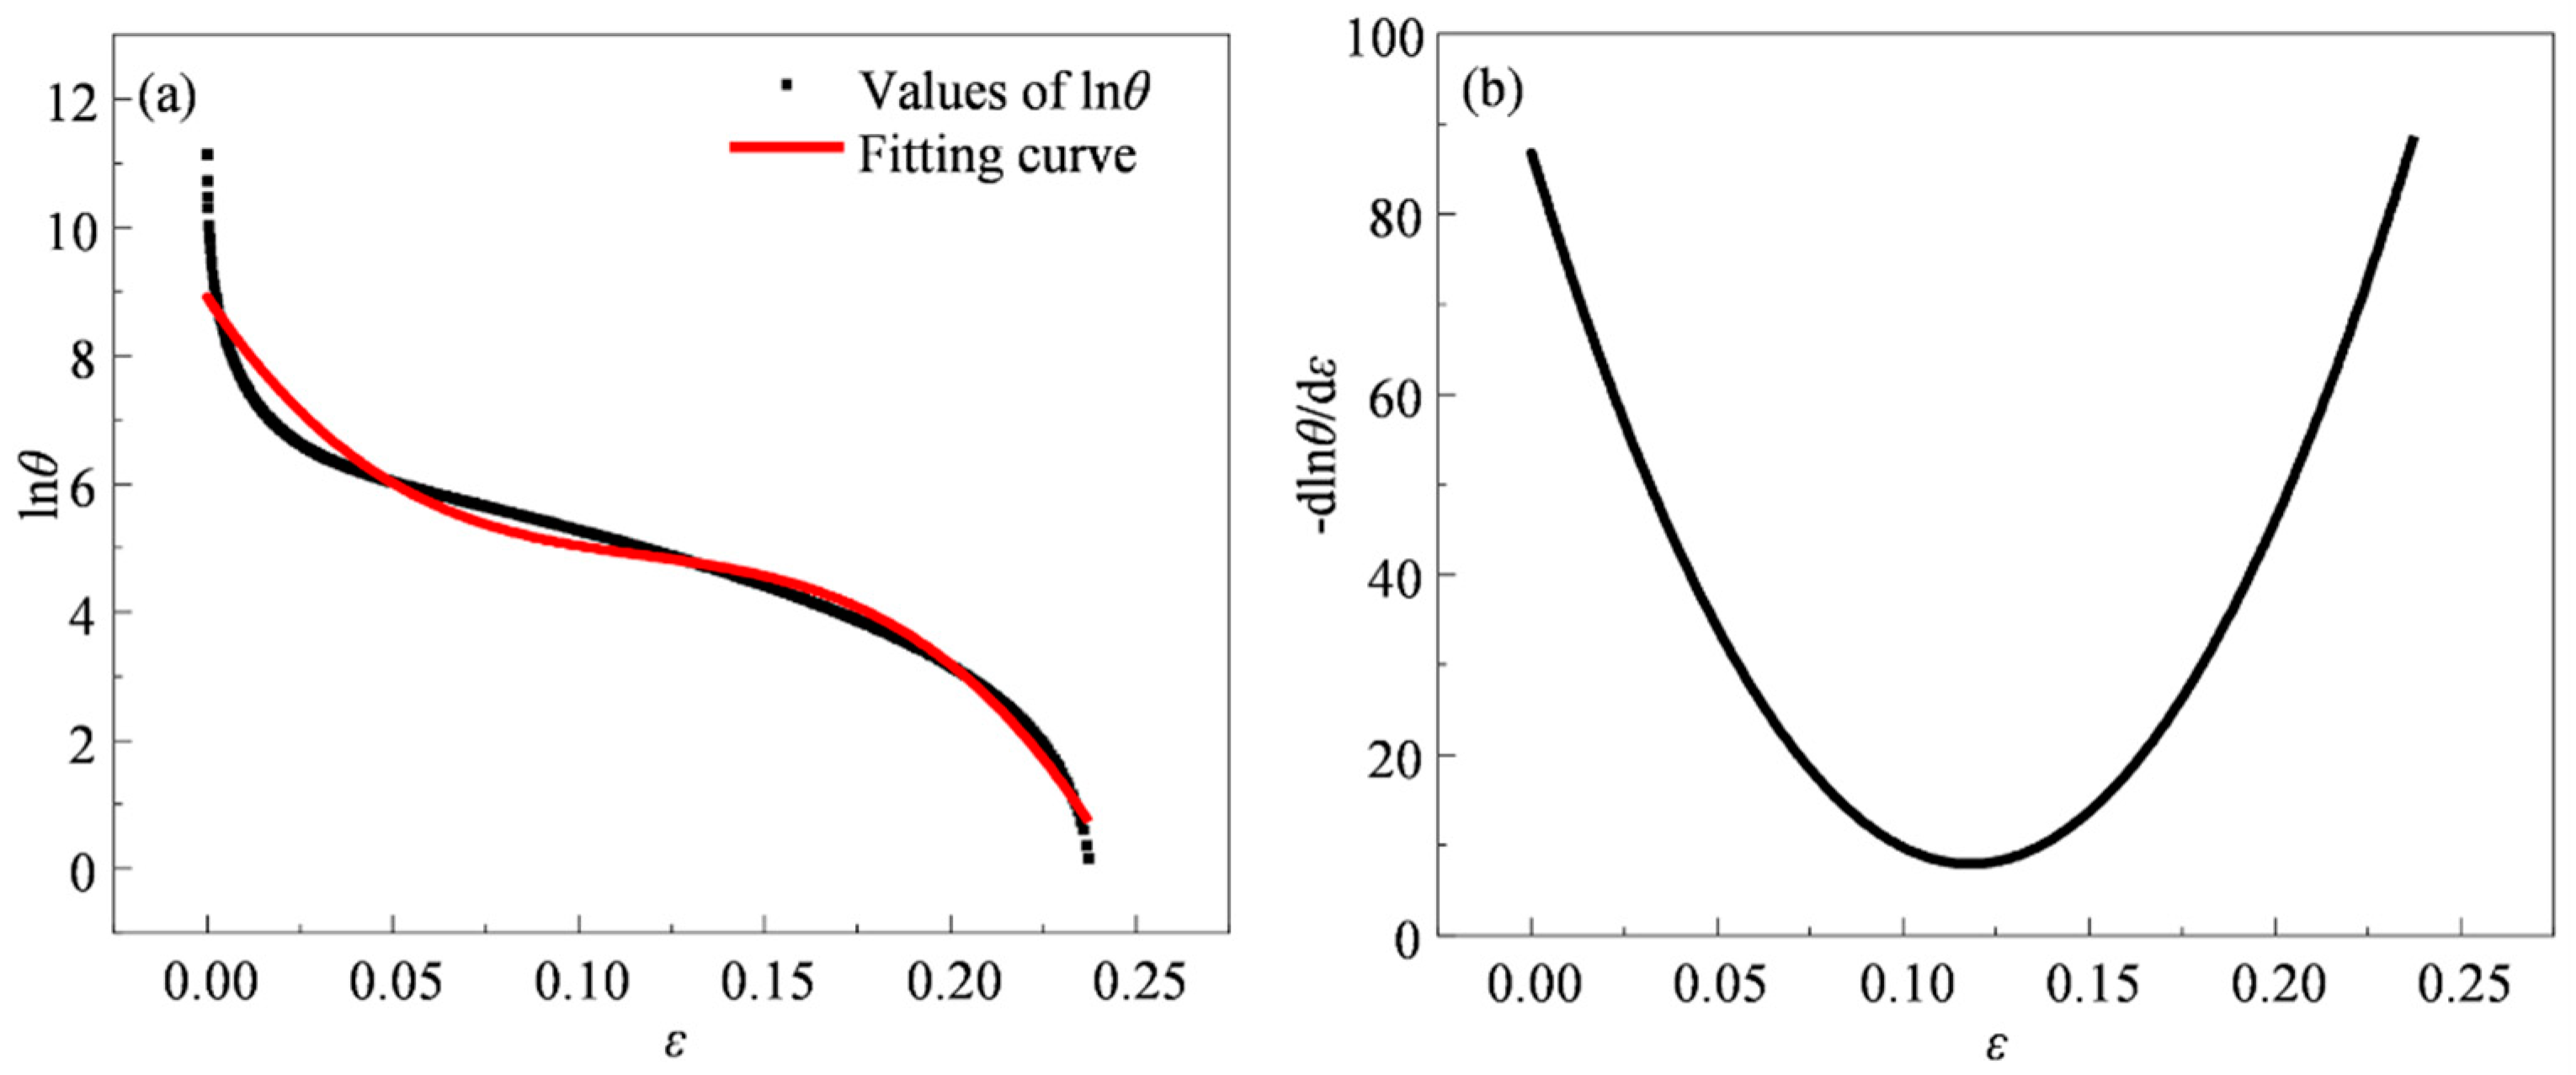
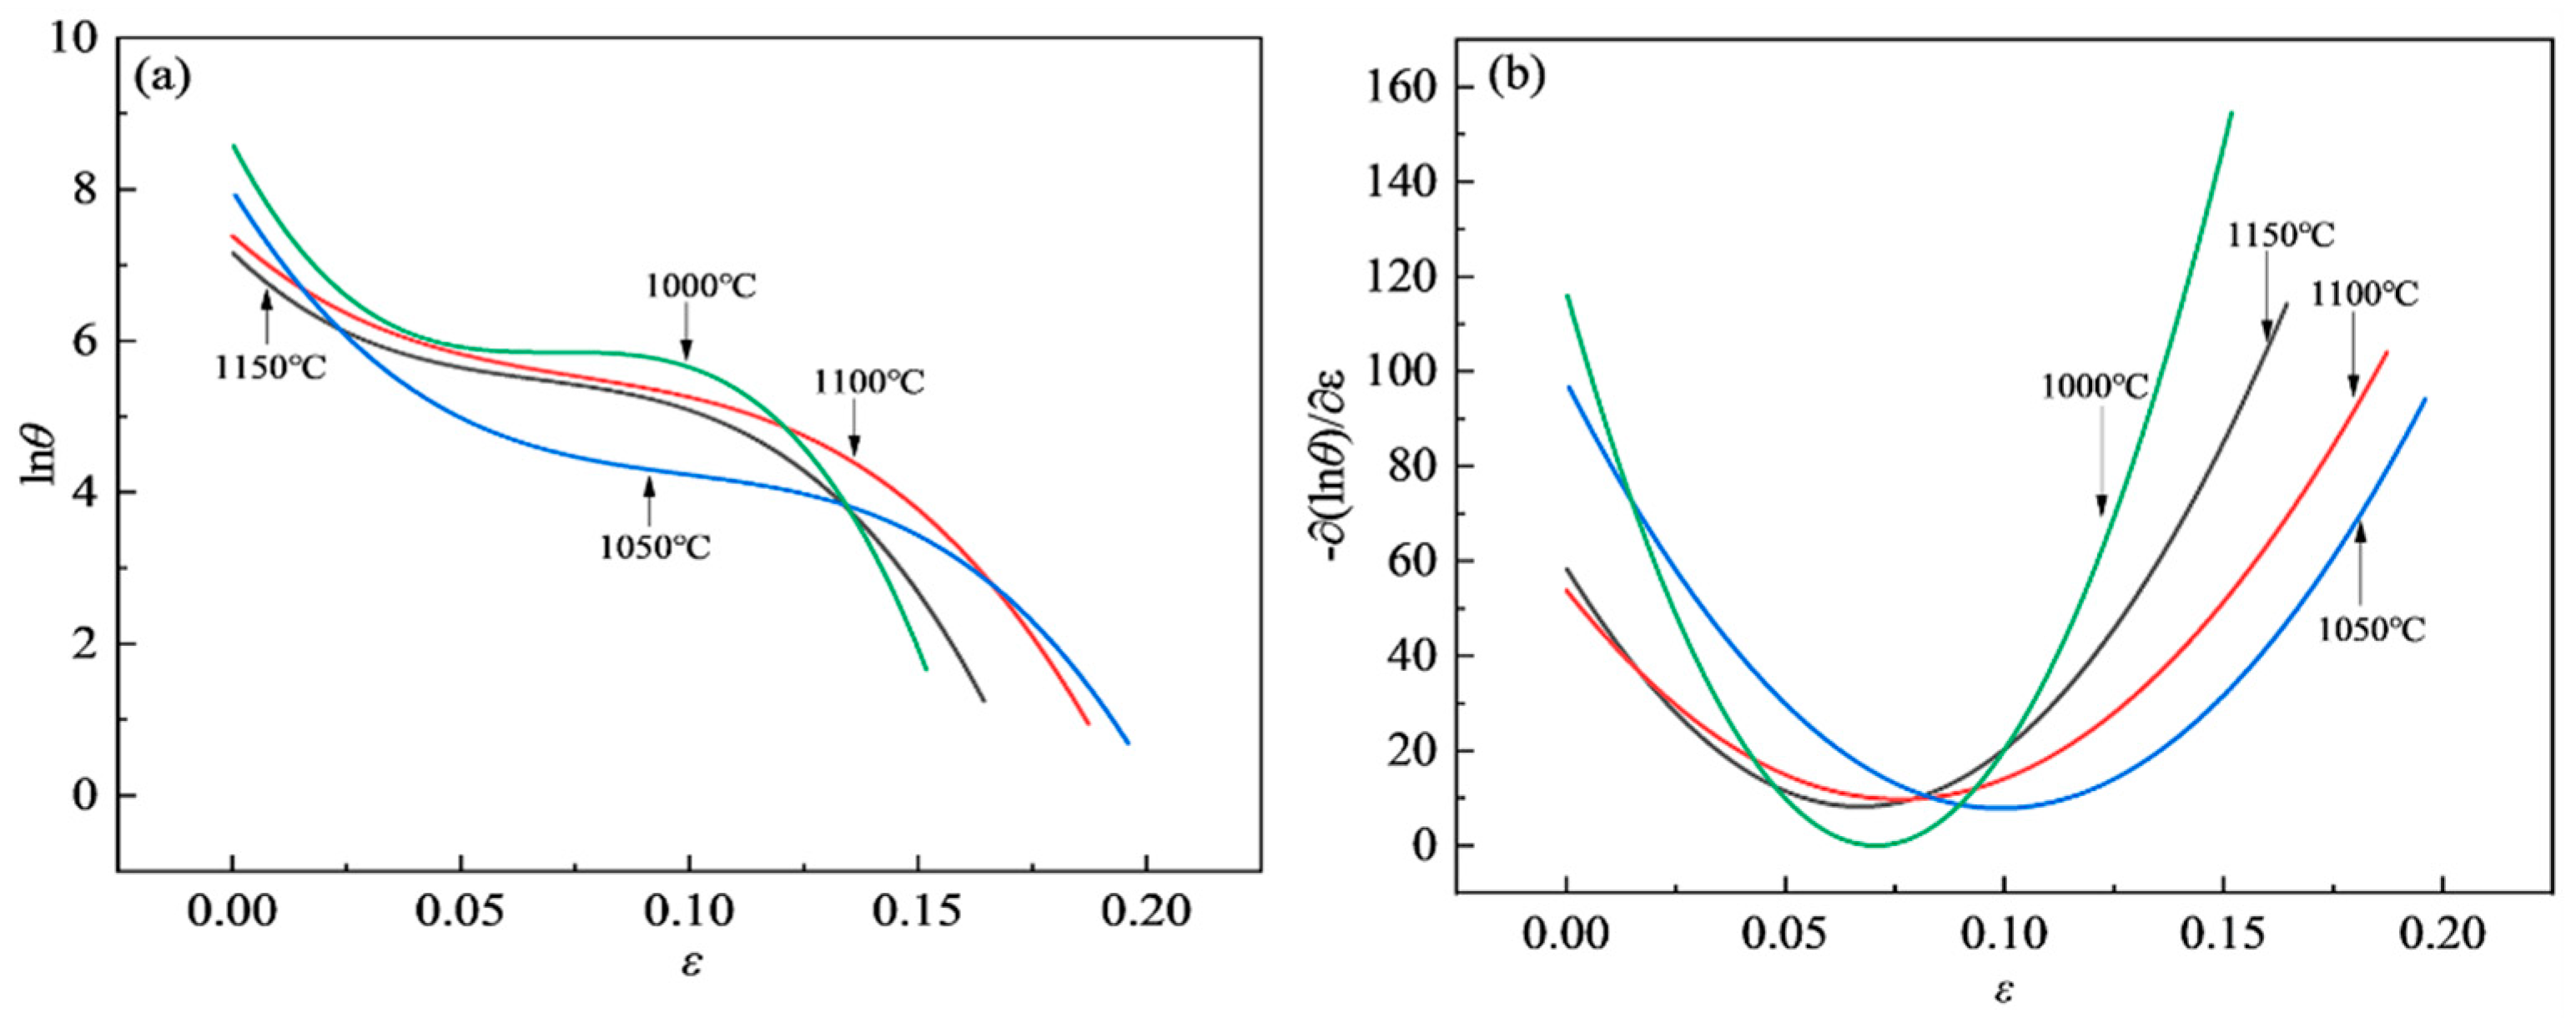
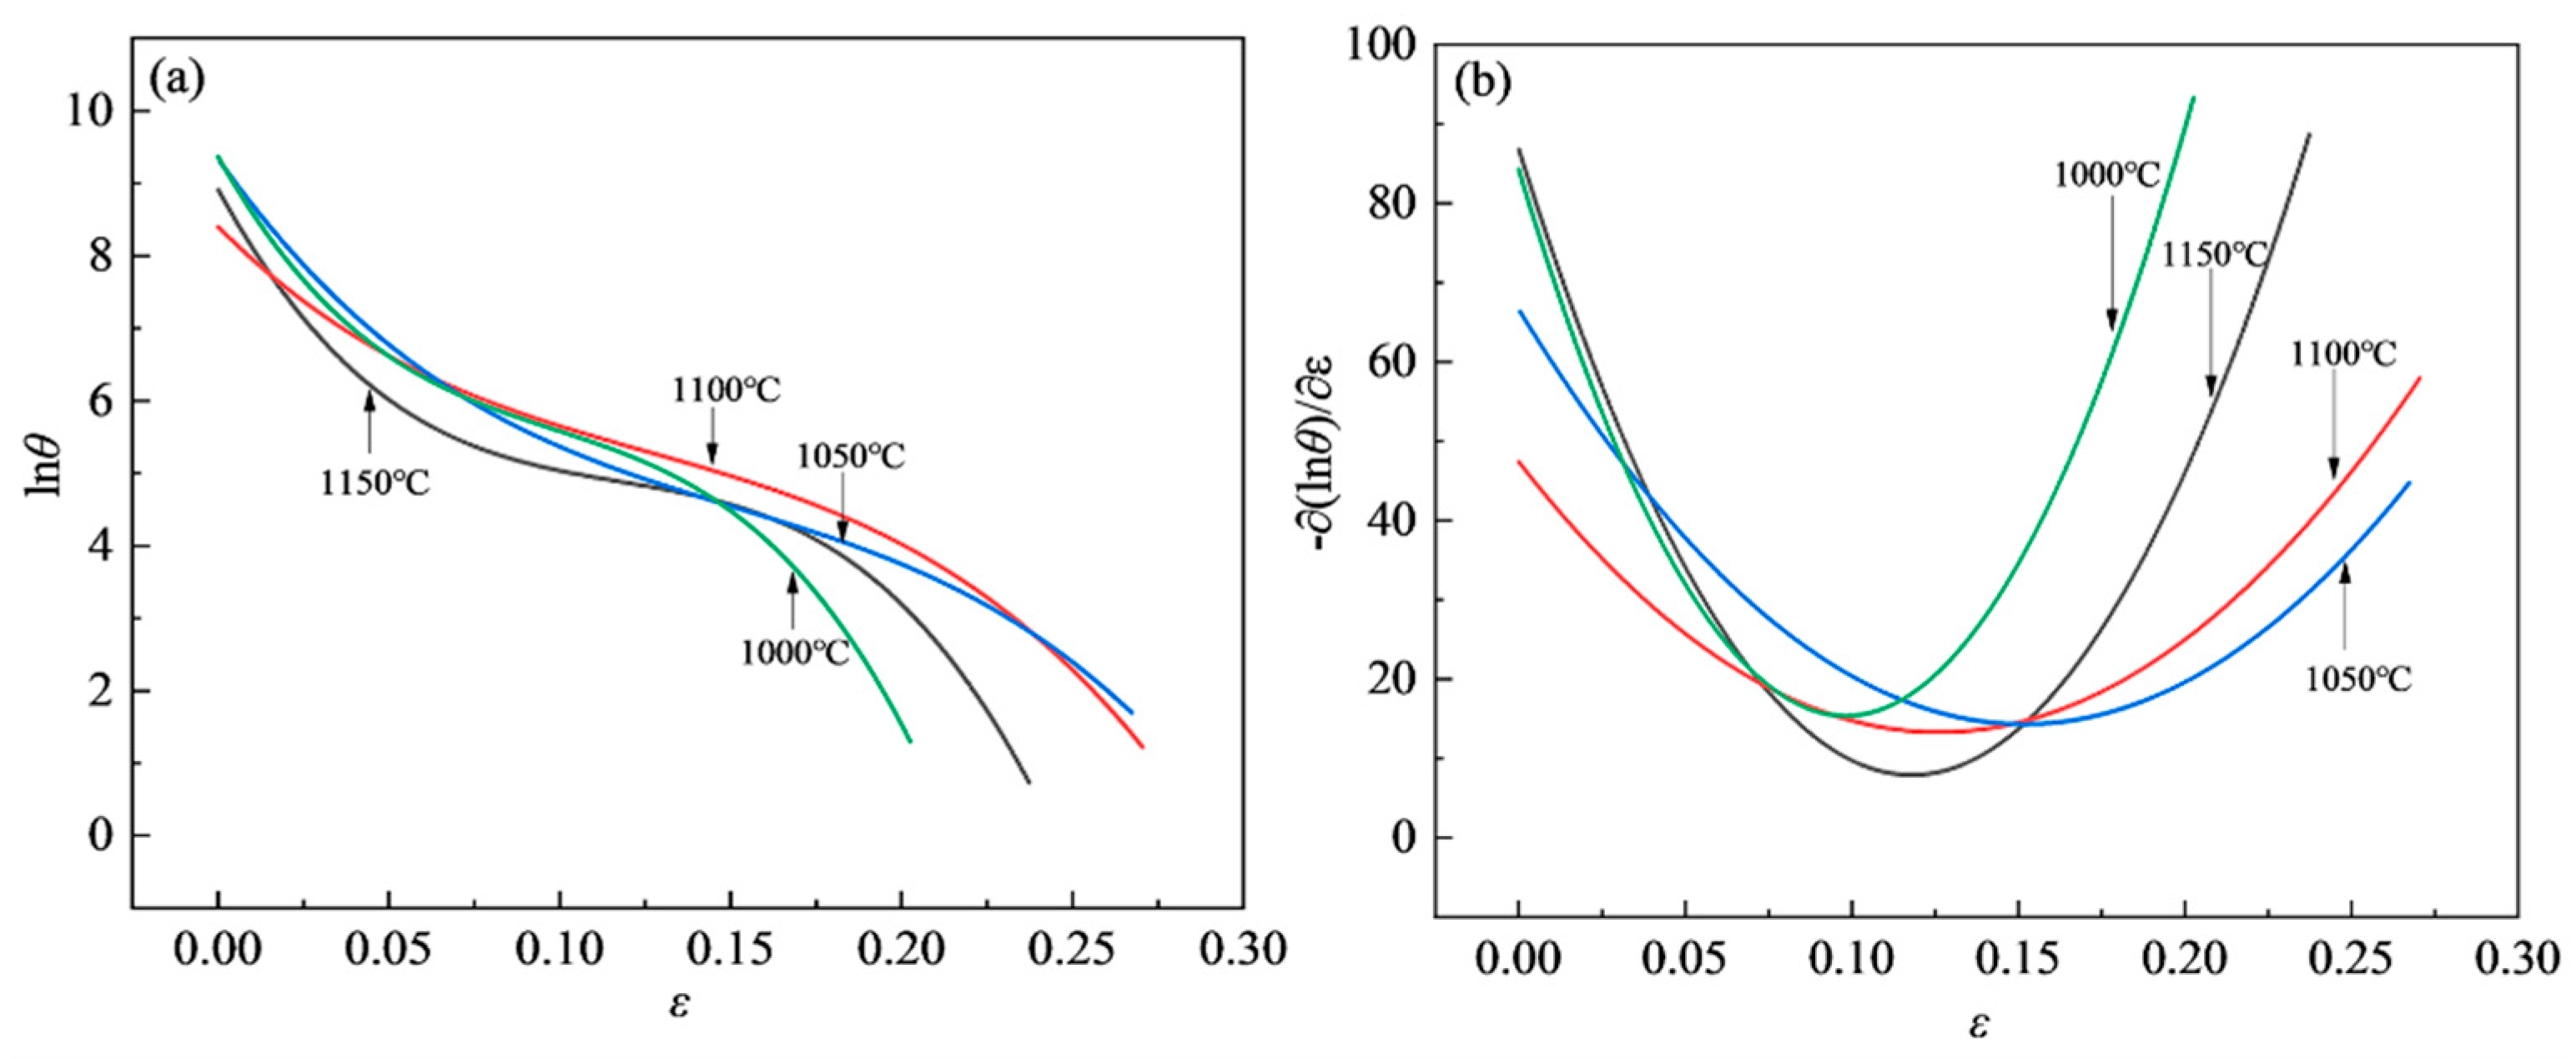
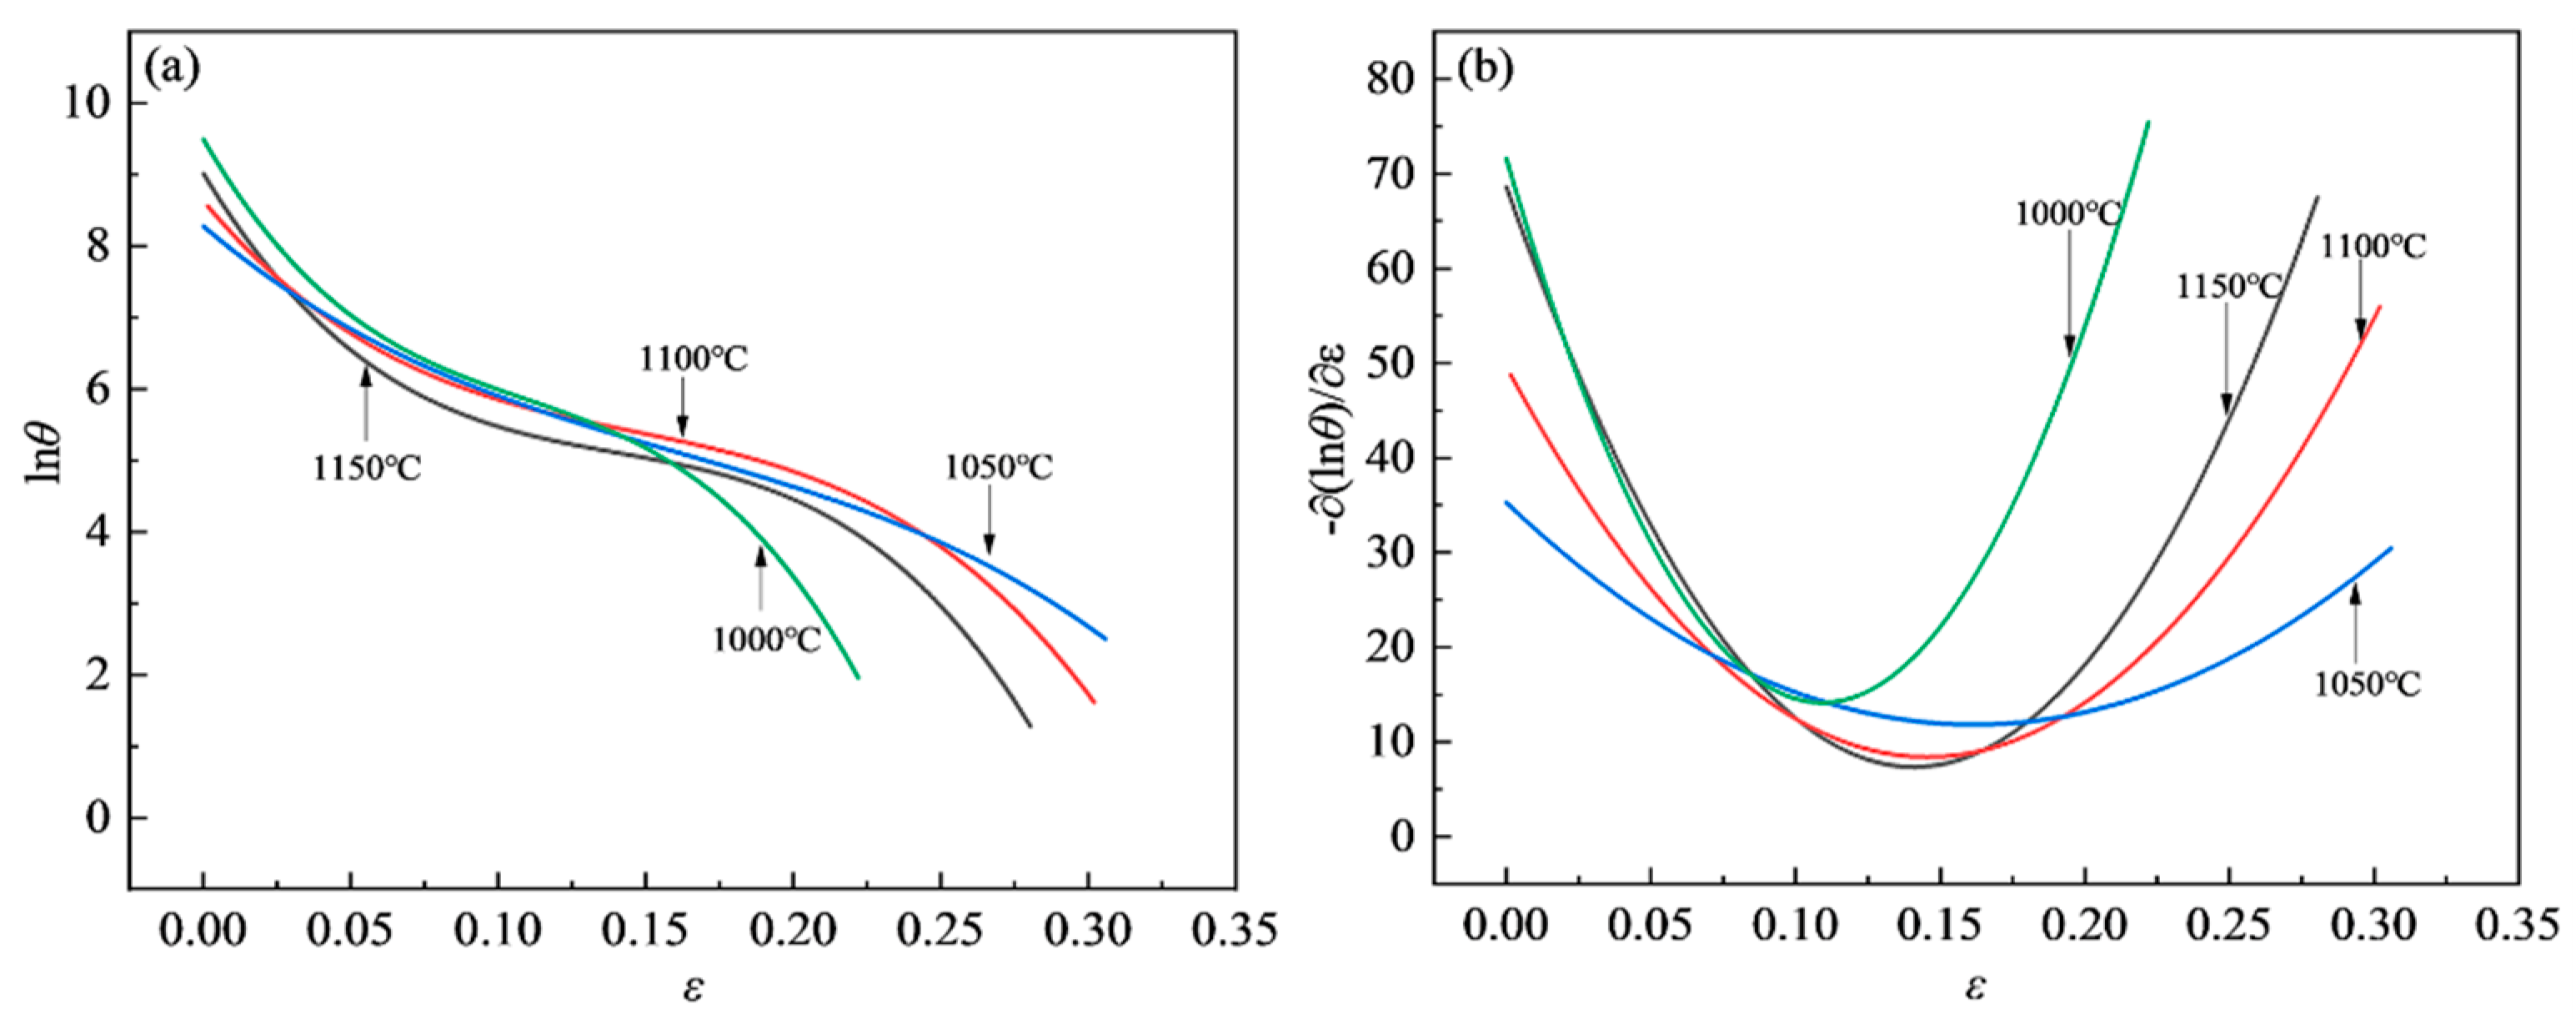
3.3.1. Determination of Critical Strain for DRX Based on Work Hardening Rate
3.3.2. Identification of DRX Critical Strain Model
4. Conclusions
- The flow stress of S280 ultra-high-strength stainless steel increases with an increase in strain rate and decreases with deformation temperature, and the flow–stress curve shows the characteristics of flow softening; the deformation activation energy between 1000 and 1150 °C is 519.064 kJ/mol. The flow softening and high deformation activation energy are caused by dynamic recrystallization during thermal deformation;
- Under the conditions of 1000–1150 °C and strain rates of 0.001–10 s–1, the DRX critical strain for S280 steel determined based on the work-hardening-rate method is approximately 0.0647–0.1907, and the DRX critical stress is approximately 19.5478-294.9036 MPa;
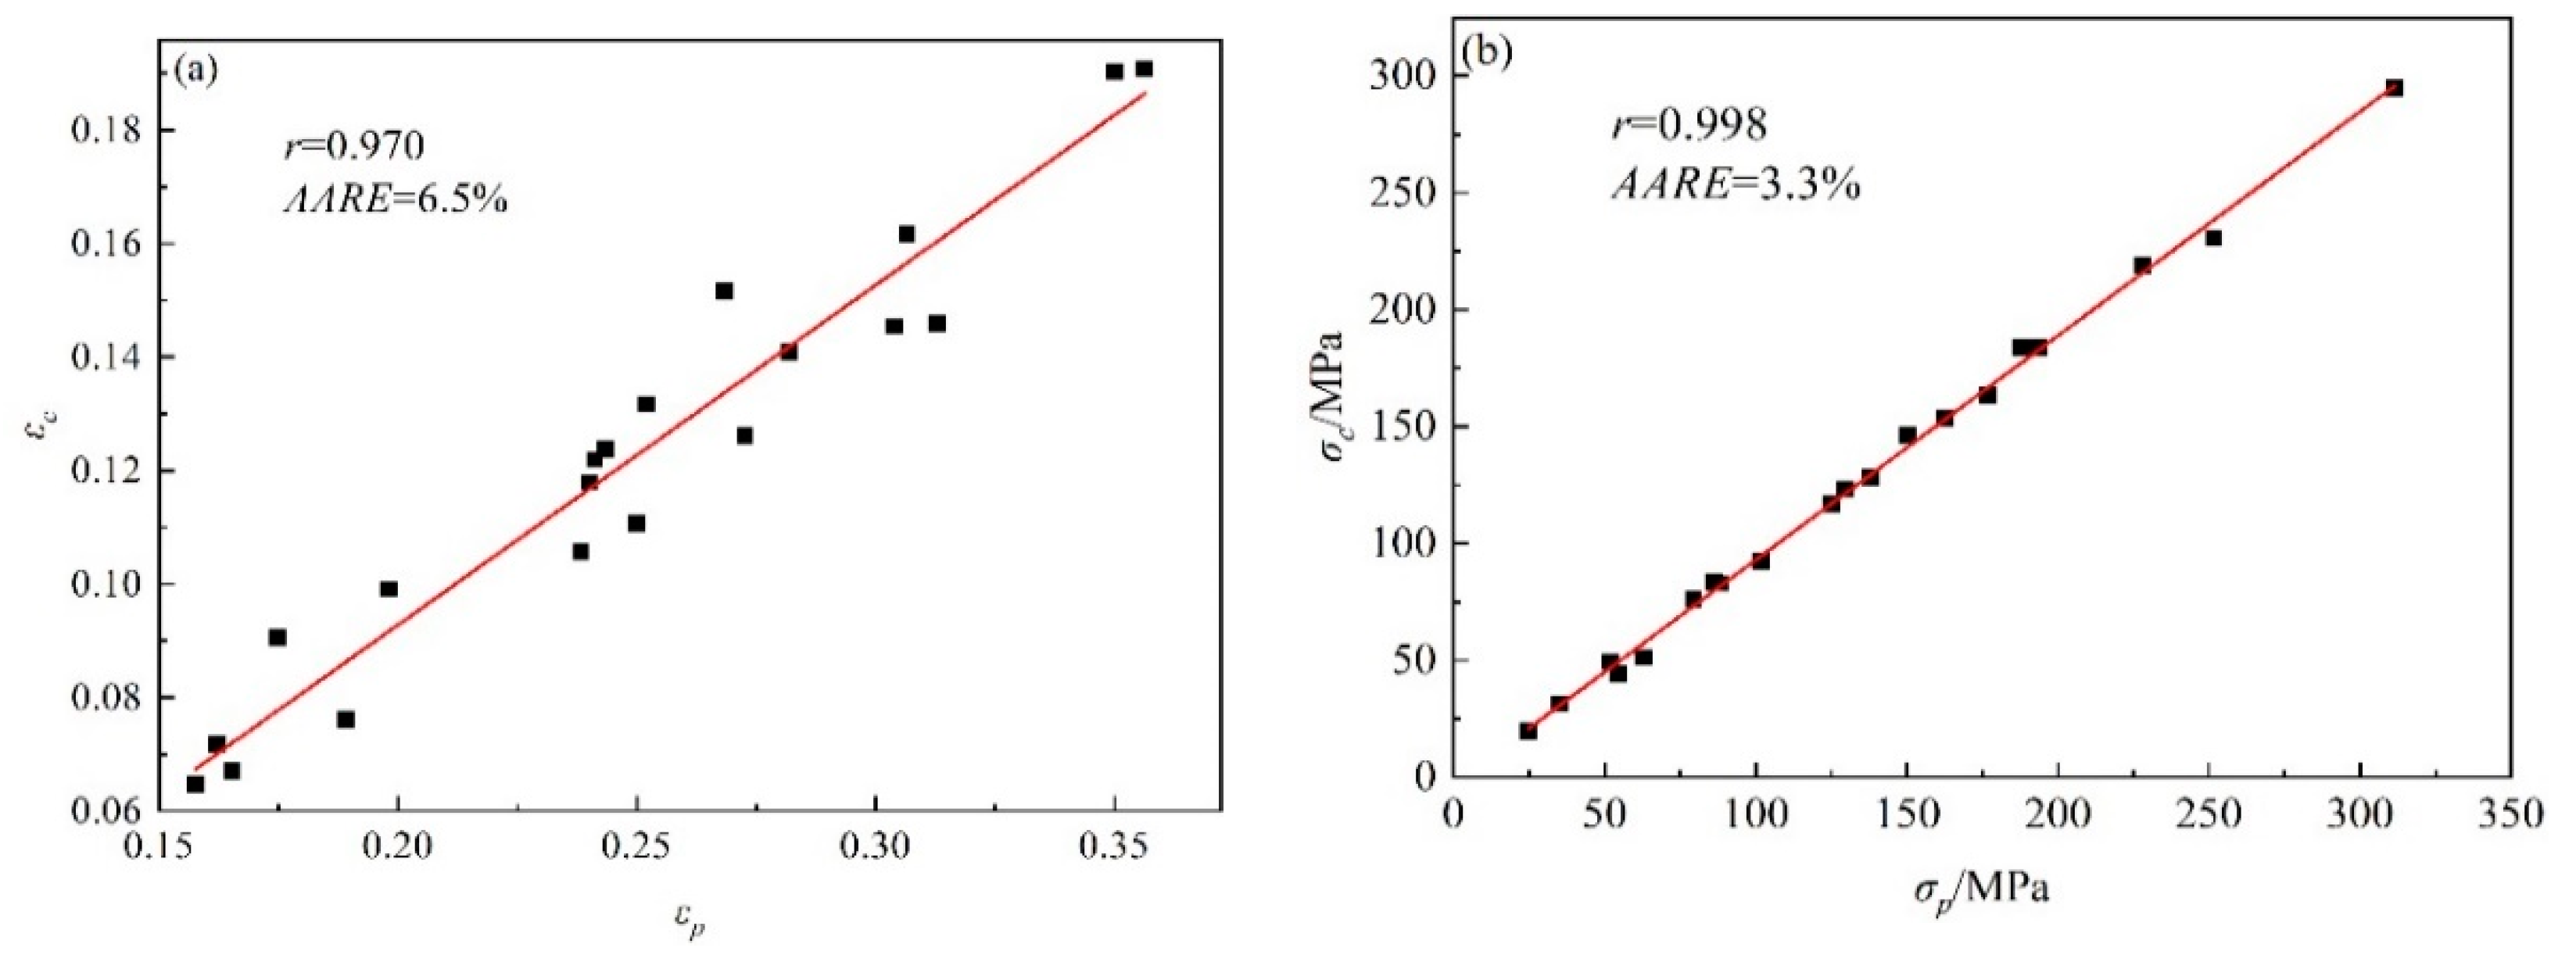
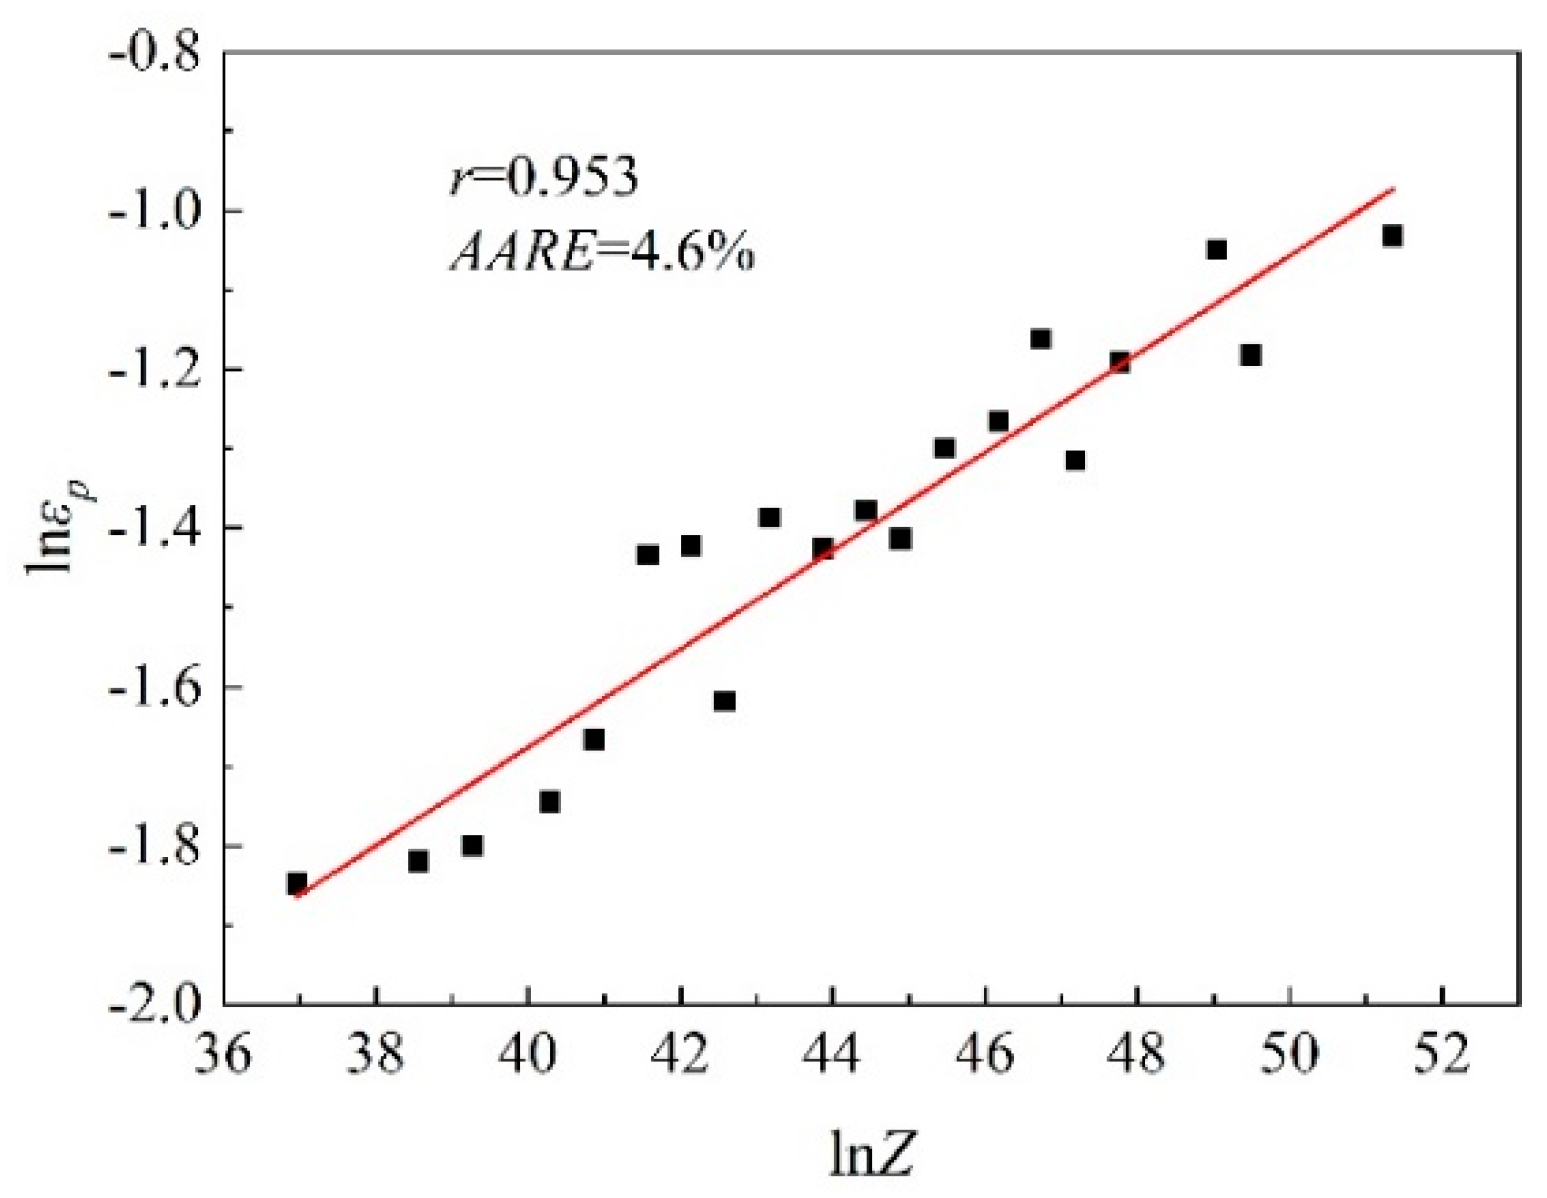
- The relationship between the DRX critical strain and peak strain could be characterized as and the relationship between the DRX critical stress and peak stress could be characterized as = 0.959. The critical strain model for DRX could be expressed as ;
- This study is helpful to master the microstructure evolution behavior of S280 steel during hot deformation. It can provide theoretical support for further numerical simulation of the forming process and precise control of microstructure, allowing the creation of practical components with excellent microstructure and properties.
Author Contributions
Funding
Data Availability Statement
Conflicts of Interest
References
- Zhong, P.; Zhang, Y.Q.; Zhong, J.Y.; Liu, M.T.; Xiao, K. A new type of structural material S280. Sci. Technol. Rev. 2015, 33, 59–62. [Google Scholar]
- Liu, Z.B.; Liang, J.X.; Su, J.; Wang, X.H.; Sun, Y.Q.; Wang, C.J.; Yang, Z.Y. Research and application progress in ultra—High strength stainless steel. Acta Metall. Sin. 2020, 56, 549–557. [Google Scholar]
- Niu, Y.E.; Zhao, P.P.; Li, N.; Song, J. Research status and application of ultra—High strength steel at home and abroad. J. Ord. Eq. Eng. 2021, 42, 274–279. [Google Scholar]
- Zhong, J.Y.; Zhang, Y.Q.; Han, Y.F. New phase precipitated from the new type of ultrahigh strength stainless steel S280. Rare Met. Mater. Eng. 2019, 48, 116–122. [Google Scholar]
- Zhong, J.Y.; Chen, Z.; Yang, S.L.; Li, S.M.; Liu, J.H.; Yu, M. Effect of solution and aging temperatures on microstructure and mechanical properties of 10Cr13Co13Mo5Ni3W1VE (S280) steel. Micromachines 2021, 12, 566. [Google Scholar] [CrossRef]
- Zhan, Z.W.; Sun, Z.H.; Tang, Z.H. Effect of chemical passivation on properties of S280 ultra high—Strength stainless steel. Corros. Prot. 2015, 36, 742–758. [Google Scholar]
- Zhong, J.Y.; Mao, F.X.; Ghanbari, E.; Macdonald, D.D. Passivity breakdown on 300 M and S280 ultra-high strength steels in borate buffer solutions containing chloride ion. Electrochim. Acta 2017, 251, 324–335. [Google Scholar] [CrossRef]
- Tian, S.; Liu, P.G. Influence of shot peening on fatigue behavior of S280 ultrahigh strengh stainless steel. J. Mater. Prot. 2013, 46, 16–18. [Google Scholar]
- Tian, Y.X.; Liu, C.; Cao, H.L.; Lin, H.T.; Wang, Z.A. Research progress of dynamic recrystallization in metallic materials. Rare Met. Mater. Eng. 2019, 48, 3764–3769. [Google Scholar]
- Fang, B.; Ji, Z.; Liu, M.; Tian, G.F.; Jia, C.C.; Zeng, T.T.; Hu, B.F.; Chang, Y.H. Critical strain and models of dynamic recrystallization for FGH96 superalloy during two-pass hot deformation. Mater. Sci. Eng. A 2014, 593, 8–15. [Google Scholar] [CrossRef]
- Poliak, E.I.; Jonas, J.J. A one-parameter approach to determining the critical conditions for the initiation of dynamic recrystallization. Acta Mater. 1996, 44, 127–136. [Google Scholar] [CrossRef]
- Li, C.M.; Huang, L.; Zhao, M.J.; Zhang, X.T.; Li, J.J.; Li, P.C. Influence of hot deformation on dynamic recrystallization behavior of 300M steel: Rules and modeling. Mater. Sci. Eng. A 2020, 797, 139925. [Google Scholar] [CrossRef]
- Wang, Z.T.; Liu, Y.Z.; Wang, M.H.; Liang, H.C. Study on dynamic recrystallization and grain size of magnesium alloy based on compound deformation. J. Netshape Form. Eng. 2021, 13, 115–120. [Google Scholar]
- Li, D.Q.; Xu, L.; Huang, X.M.; Dai, G.Z. Investigation on gritical strain of dynamic recrystallization for 7A04 aluminum alloy. J. Mater. Eng. 2013, 3, 23–27. [Google Scholar]
- Lin, X.J.; Huang, H.J.; Yuan, X.G.; Wang, Y.X.; Zheng, B.W.; Zuo, X.J.; Zhou, G. Study on high-temperature deformation mechanical behavior and dynamic recrystallization kinetics model of Ti-47.5 Al-2.5 V-1.0 Cr-0.2 Zr alloy. J. Alloy. Compd. 2022, 891, 162105. [Google Scholar] [CrossRef]
- Ryan, N.D.; Mcqueen, H.J. Dynamic softening mechanisms in 304 austenitic stainless steel. Can. Metall. Q. 1990, 29, 147–162. [Google Scholar] [CrossRef]
- Najafizadeh, A.; Jonas, J.J. Predicting the critical stress for initiation of dynamic recrystallization. ISIJ Int. 2006, 46, 1679–1684. [Google Scholar] [CrossRef] [Green Version]
- Wang, R.; Zhang, W.; Li, Y.H.; Li, D.Z.; Kang, Y.; Yang, X.M.; Eckert, J.; Yan, Z.J. Stress-strain behavior and microstructural evolution of ultra-high carbon Fe-C-Cr-V-Mo steel subjected to hot deformation. Mater. Charact. 2021, 171, 110746. [Google Scholar] [CrossRef]
- Wan, P.; Kang, T.; Li, F.; Gao, P.F.; Zhang, L.; Zhao, Z.Z. Dynamic recrystallization behavior and microstructure evolution of low-density high-strength Fe–Mn–Al–C steel. J. Mater. Res. Technol. 2021, 15, 1059–1068. [Google Scholar] [CrossRef]
- Zhao, H.T.; Qi, J.J.; Su, R.; Zhang, H.Q.; Chen, H.W.; Bai, L.J.; Wang, C.M. Hot deformation behaviour of 40CrNi steel and evaluation of different processing map construction methods. J. Mater. Res. Technol. 2020, 9, 2856–2869. [Google Scholar] [CrossRef]
- Mohammadi, H.; Eivani, A.R.; Seyedein, S.H.; Ghosh, M.; Jafarian, H.R. An investigation of hot deformation behavior of Zn–22Al alloy and development of its processing maps during isothermal compression. J. Mater. Res. Technol. 2021, 14, 507–520. [Google Scholar] [CrossRef]
- Wang, X.K.; Xiao, D.H.; Wu, M.D.; Liu, W.S. Deformation behavior and microstructure evolution of Al–5.06 Mg–1.67 Li–0.51 Zn alloy under hot compression. J. Mater. Res. Technol. 2021, 15, 4516–4528. [Google Scholar] [CrossRef]
- Zhai, Y.W.; Zhong, Z.P.; Jin, Q.L. Experimental research on mechanical property of P91 under high temperature thermal deformation. J. Plast. Eng. 2012, 19, 88–93. [Google Scholar]
- Gao, W.L.; Guan, Y.F. Correction of flow stress−strain curve and processing maps of 5083 aluminum alloy during hot compression. CHN J. Nonferrous Met. 2018, 28, 1737–1745. [Google Scholar]
- Sun, Y.; Wan, Z.P.; Hu, L.X.; Ren, J.S. Characterization of hot processing parameters of powder metallurgy TiAl-based alloy based on the activation energy map and processing map. Mater. Des. 2015, 86, 922–932. [Google Scholar] [CrossRef]
- Long, J.C.; Xia, Q.X.; Xiao, G.F.; Qin, Y.; Yuan, S. Flow characterization of magnesium alloy ZK61 during hot deformation with improved constitutive equations and using activation energy maps. Int. J. Mech. Sci. 2021, 191, 106069. [Google Scholar] [CrossRef]
- Sellars, C.M.; Mctegart, W.J. On the mechanism of hot deformation. Acta Metall. 1966, 14, 1136–1138. [Google Scholar] [CrossRef]
- Lu, C.Y.; Wang, J.; Zhang, P.Z. Flow behavior analysis and flow stress modeling of Ti17 alloy in β forging process. J. Mater. Eng. Perform. 2021, 30, 7668–7681. [Google Scholar] [CrossRef]
- Ryan, N.D.; Mcqueen, H.J. Comparison of dynamic softening in 301, 304, 316 and 317 stainless steels. High Tem. Technol. 1990, 8, 185–200. [Google Scholar] [CrossRef]
- Wan, P.; Zou, H.; Wang, K.L.; Zhao, Z.Z. Hot deformation characterization of Ti–Nb alloy based on GA-LSSVM and 3D processing map. J. Mater. Res. Technol. 2021, 13, 1083–1097. [Google Scholar] [CrossRef]
- Atkins, A.G. Deformation-mechanism maps (the plasticity and creep of metals and ceramics). J. Mech. W Technol. 1984, 9, 224–225. [Google Scholar] [CrossRef]
- Ren, S.J. Research on Isothermal Compression Behavior and Optimization of Process Parameters for A100 Ultra-High Strength Steel; Nanchang Hangkong University: Nanchang, China, 2018. [Google Scholar]
- Liu, X.G.; Zhang, L.G.; Qi, R.S.; Chen, L.; Jin, M.; Guo, B.F. Prediction of critical conditions for dynamic recrystallization in 316LN austenitic steel. J. Iron Steel Res. Int. 2016, 23, 238–243. [Google Scholar] [CrossRef]


| p1 | p2 | p3 | p4 | p5 |
| −8.56726 | 1584.41009 | −11,783.86258 | 55,897.71989 | −158,546.47991 |
| p6 | p7 | p8 | p9 | |
| 268,037.44580 | −265,828.82359 | 142,943.98934 | −32,120.70831 |
| Strain Rate/s–1 | Deformation Temperature/°C | |||
|---|---|---|---|---|
| 1000 | 1050 | 1100 | 1150 | |
| 0.001 | 0.1219 | 0.0906 | 0.0717 | 0.0647 |
| 0.01 | 0.1317 | 0.0991 | 0.0759 | 0.0670 |
| 0.1 | 0.1459 | 0.1237 | 0.1107 | 0.1057 |
| 1 | 0.1903 | 0.1516 | 0.1262 | 0.1179 |
| 10 | 0.1907 | 0.1616 | 0.1455 | 0.1408 |
| Strain Rate/s–1 | Deformation Temperature/°C | |||
|---|---|---|---|---|
| 1000 | 1050 | 1100 | 1150 | |
| 0.001 | 75.8377 | 49.3479 | 31.4305 | 19.5478 |
| 0.01 | 116.8907 | 83.2727 | 51.1994 | 43.8961 |
| 0.1 | 183.5235 | 146.1575 | 92.1629 | 82.8419 |
| 1 | 230.7050 | 183.7780 | 128.1499 | 123.0821 |
| 10 | 294.9036 | 218.9624 | 163.0207 | 153.2359 |
Publisher’s Note: MDPI stays neutral with regard to jurisdictional claims in published maps and institutional affiliations. |
© 2022 by the authors. Licensee MDPI, Basel, Switzerland. This article is an open access article distributed under the terms and conditions of the Creative Commons Attribution (CC BY) license (https://creativecommons.org/licenses/by/4.0/).
Share and Cite
Liu, M.; Tian, Y.; Wang, Y.; Wang, K.; Zhang, K.; Lu, S. Critical Conditions for Dynamic Recrystallization of S280 Ultra-High-Strength Stainless Steel Based on Work Hardening Rate. Metals 2022, 12, 1123. https://doi.org/10.3390/met12071123
Liu M, Tian Y, Wang Y, Wang K, Zhang K, Lu S. Critical Conditions for Dynamic Recrystallization of S280 Ultra-High-Strength Stainless Steel Based on Work Hardening Rate. Metals. 2022; 12(7):1123. https://doi.org/10.3390/met12071123
Chicago/Turabian StyleLiu, Mutong, Ye Tian, Yu Wang, Kelu Wang, Kaiming Zhang, and Shiqiang Lu. 2022. "Critical Conditions for Dynamic Recrystallization of S280 Ultra-High-Strength Stainless Steel Based on Work Hardening Rate" Metals 12, no. 7: 1123. https://doi.org/10.3390/met12071123
APA StyleLiu, M., Tian, Y., Wang, Y., Wang, K., Zhang, K., & Lu, S. (2022). Critical Conditions for Dynamic Recrystallization of S280 Ultra-High-Strength Stainless Steel Based on Work Hardening Rate. Metals, 12(7), 1123. https://doi.org/10.3390/met12071123