Article

Effects of Non-Metallic Inclusions and Mean Stress on Axial and Torsion Very High Cycle Fatigue of SWOSC-V Spring Steel

1
Department of Material Sciences and Process Engineering, Institute of Physics and Materials Science, University of Natural Resources and Life Sciences, Vienna (BOKU), Peter-Jordan-Str. 82, 1190 Vienna, Austria
2
Materials Research Laboratory, KOBE STEEL LTD., 1-5-5 Takatsukadai, Nishi-ku, Kobe 651-2271, Hyogo, Japan
*
Author to whom correspondence should be addressed.
Metals 2022, 12(7), 1113; https://doi.org/10.3390/met12071113
Submission received: 1 June 2022 / Revised: 23 June 2022 / Accepted: 23 June 2022 / Published: 28 June 2022

Abstract

:
Inclusion-initiated fracture in high-strength spring steel is studied for axial and torsion very high cycle fatigue (VHCF) loading at load ratios of R = −1, 0.1 and 0.35. Ultrasonic S-N tests are performed with SWOSC-V steel featuring intentionally increased numbers and sizes of non-metallic inclusions. The fatigue limit for axial and torsion loading is considered the threshold for mode I cracks starting at internal inclusions. The influence of inclusion size and Vickers hardness on cyclic strength is well predicted with Murakami and Endo’s a r e a parameter model. In the presence of similarly sized inclusions, stress biaxiality is considered by a ratio of torsion to axial fatigue strength of 0.86. Load ratio sensitivity is accounted for by the factor ((1 − R)/2)α, with α being 0.41 for axial and 0.55 for torsion loading. VHCF properties under torsion loading cannot appropriately be deduced from axial data. In contrast to axial loading, the defect sensitivity for torsion loading increases significantly with superimposed static mean load, and no inclusion-initiated fracture is found at R = −1. Size effects and the stress gradient effective under torsion loading are considered to explain smaller crack initiating inclusions found in torsion ultrasonic fatigue tests.

1. Introduction

Change of crack initiation mechanism from strain localization at surface grains in the high cycle fatigue (HFC) regime to internal inclusion-initiated fracture in the very high cycle fatigue (VHCF) regime is a primary reason for the absence of a fatigue limit in high strength steels [1,2,3,4,5]. Fatigue cracks initiate at inclusions at stress amplitudes below the conventional fatigue limit and grow in a vacuum-like environment at extremely low initial growth rates [6,7]. Intermitted growth and mean growth rates below 10−13 m/cycle can add up to lifetimes of 500 million cycles [8]. With the increasing size of an inclusion, its detrimental influence on cyclic strength becomes stronger [9,10,11]. For similarly sized inclusions, interface fracture (e.g., at aluminates) is less detrimental than through-particle fracture of inclusions that are tightly bonded to the matrix (e.g., TiN) [12,13,14]. Cycling at different mean stresses not only shifts the courses of the S-N curves but also affects the probability of internal inclusion-initiated fracture [15,16,17,18,19,20]. However, internal inclusions are not the only crack initiating locations for VHCF failure. Cracks can also start in the metal matrix without an inclusion [12,19,21,22,23,24], at grain boundaries [19,22] or at stress raisers (scratches, surface inclusions) at the surface [25,26,27,28]. However, for high-strength steels with compressive surface residual stresses introduced, e.g., by grinding, shot peening, carburizing or nitriding, inclusion-initiated fracture is the most important VHCF failure mechanism.
In the literature, the influence of inclusions on fatigue lifetimes is mainly described for cyclic axial loading conditions. However, coil springs or roller bearings are technical components that are subjected to very high numbers of shear load cycles in service with mean shear stress superimposed. Valve springs, for example, are loaded with cyclic shear stresses superimposed on a static torque resulting in load ratios between R = 0.3 and 0.5. Crack initiation at internal inclusions was found as an important failure mode in spring steels used for valves in engines that failed above 107 cycles [29,30,31]. Understanding inclusion-initiated fracture under cyclic torsion loading, in particular with superimposed mean shear stresses, is therefore of great scientific as well as technical importance.
With conventional (e.g., servo-hydraulic, rotating bending) testing techniques, fatigue tests in the VHCF regime are very time-consuming, and it is, therefore, favorable to increase the testing frequency. Ultrasonic fatigue testing has been found most appropriate for the rapid collection of VHCF data [32,33]. The high cycling frequency not only shortens testing times but also allows for testing up to extremely high numbers of cycles of 1011 [34], a regime that is not accessible with conventional equipment. Ultrasonic fatigue test set-ups for fully reversed torsion loading [35] and torsion loading with superimposed static shear stresses [36] have been invented in the authors’ laboratory.
Ultrasonic torsion fatigue tests of SWOSC-V spring steel delivered VHCF failures, however, not starting at inclusions but at the surface [37]. Solely one failure from a TiN inclusion was found in high-frequency torsion tests with VDSiCr spring steel [38]. Failures from MnS inclusions under fully reversed cyclic torsion are reported in the literature, however, not for spring steel but for high carbon chromium-bearing steel [39,40]. Further, soft phases at the surface, such as ferrite grains, may act as crack initiation sites under reversed torsion loading [41]. To better simulate actual loading conditions of coil springs, ultrasonic torsion fatigue tests with VDSiCr spring steel were performed at load ratios R = 0.1, 0.35 and 0.5 [36]. These investigations showed that ultrasonic torsion fatigue testing is a powerful method for rapid measurement of the torsion fatigue strength and developed a Haigh diagram for limiting lifetimes of 109 cycles. However, due to the high cleanness of commercial spring steels and the relatively small material volume subjected to high-stress amplitudes of ultrasonic torsion fatigue specimens, it is unlikely to encounter inclusions large enough to initiate a fatal crack. Similar conclusions may be drawn from cyclic torsion ultrasonic tests of super clean SWOSC-V spring steel, where excellent cyclic strength was demonstrated even for high load ratios due to the absence of inclusion-initiated failure [42]. Failure from inclusions were found in a commercial spring steel in axial but hardly in torsion ultrasonic fatigue specimens [43].
Testing spring steel SWOSC-V with intentionally increased numbers and sizes of inclusions has been a successful way to study the effect of inclusions on torsion VHCF properties. With this material, the influence of inclusions on cyclic shear strength at load ratios of R = −1, 0.1 and 0.35 could be investigated in ultrasonic fatigue tests [44]. Cyclic tension-compression and cyclic tension tests of the same material were used to compare the deleterious effects of inclusions under axial and torsion loading [45]. The a r e a parameter model proposed by Murakami and Endo [9] was used to compare experimentally determined and predicted torsion fatigue strengths for inclusion-initiated fracture [8].
The present paper aims to evaluate and compare the influence of inclusions on axial and torsion VHCF strengths. Specimens with artificial surface defects are cycled in a vacuum, and near-threshold fatigue crack growth is compared for fully reversed tension-compression and torsion loading, respectively. Inclusions are considered as initial cracks and hence, fracture mechanics principles are applied to interpret the VHCF strengths as thresholds for crack propagation. The a r e a parameter model [9] is used to quantify the effect of inclusions on cyclic strengths. Loading conditions (axial vs. torsion loading) [46], as well as load ratio effects [47], are considered. Several peculiarities must be taken into account when comparing axial and torsion loading: Types of crack initiating inclusions are different [45]; due to the stress gradient, local stress amplitudes at interior inclusions are lower for torsion but not for axial loading; different specimen geometries (in addition to the aforementioned stress gradient) lead to a size effect which influences the size distribution of crack-initiating inclusions [48,49,50,51].

2. Material and Method

2.1. Testing Material

The material used in the present investigation is laboratory-made high-strength spring steel based on the chemical composition of SWOSC-V, as shown in Table 1.
The material was vacuum-induction furnace melted and cast with a high amount of dissolved oxygen, which was realized by adding iron oxide powder. In this way, the size and density of oxide inclusions, such as aluminate inclusions, were intentionally increased. The material also contains MnS inclusions with an elongated shape aligned approximately in the rolling direction (i.e., specimen’s length direction) as a result of forging [44]. Manufacturing of the material included soaking, forging, heating, oil quenching and tempering. The resulting martensite structure with occasionally retained austenite features a mean prior austenite grain size of 18.7 µm.
Specimen shapes used in ultrasonic axial and torsion fatigue tests at different R-ratios can be seen in Figure 1a. The stress distribution along the specimens’ length axes as a result of resonance vibrations is shown as well as the stress gradient across the cross-section resulting from torsion loading. The volume subjected to more than 95% of the nominal stress is 174 mm3 and 1.79 mm3 under axial and torsion loading, respectively.
For fatigue lifetime measurements in ambient air, the specimens’ surface was prepared in order to correspond to in-service conditions: Prior to testing, the specimens were polished to a mirror-like finish and subsequently shot-peened, resulting in compressive residual stresses of 580 ± 130 MPa in the longitudinal and circumferential direction at the surface. Additionally, the specimens were blued. Mechanical properties determined by using fatigue specimens featuring the above-described surface condition are shown in Table 2.
For fatigue crack growth rate measurements in a high vacuum, the same specimen shapes as in S-N tests were used. The specimens were ground and electro-polished in order to remove residual stresses of the machining process. Small artificial surface defects were then introduced as starter notches by Ar+-milling (Figure 1b). Prior to the tests, the depth and diameter of each artificial defect were analyzed by SEM.

2.2. S-N Tests under Axial and Torsion Loading

Ultrasonic axial and torsion S-N tests in ambient air were performed at load ratios of R = −1, 0.1 and 0.35 up to limiting lifetimes of 5 × 10⁹ load cycles. The hereby employed testing equipment was developed by BOKU and is described extensively in [33,36]. In order to detect nonmetallic inclusions in runout specimens, those surviving 5 × 10⁹ load cycles were further tested as follows: In the case of axial loading, the specimens were reloaded at the same R-ratio at a higher load level. In the case of torsion loading, runouts of all R-ratios were exclusively reloaded at R = 0.1, which had proved to be most favorable for internal inclusion-initiated fracture.
In addition to pressurized air cooling, ultrasonic fatigue loading was applied intermittently, i.e., pulses in the range of 100 to 300 ms were followed by pauses of load level-dependent lengths. During the tests, the specimens’ temperature was monitored by pyrometry and hereby confirmed to be below 30 °C.
In order to analyze crack initiation sites, fracture surfaces were investigated by scanning electron microscopy (SEM) and energy-dispersive X-ray spectroscopy (EDS). For SEM-imaging, the fracture surfaces were oriented perpendicular to the electron beam, thus corresponding to the projection plane perpendicular to the major principal stress direction. In the case of torsion specimens, this required tilting of the specimens by approximately 45° towards their length axes and takes account of the fact that the major part of crack propagation is under mode I. The SEM images were then used to determine the sizes of crack initiating non-metallic inclusions found at crack initiation sites.
Fracture modes effective during crack initiation under torsion loading were determined. Fracture surfaces generated by an MnS and an aluminate inclusion, respectively, were cut parallel to the specimens’ length axes by Ar+-milling, subsequently polished and analyzed by SEM [8].

2.3. Fatigue Crack Growth Tests Using Specimens with Artificial Defects

Fatigue crack growth rate measurements using ultrasonic fatigue testing equipment were performed in a high vacuum of about 2 × 10⁻⁶ mbar in order to eliminate environmental effects and to simulate conditions of very slowly propagating cracks emanating from the interior inclusions. Axial and torsion specimens featuring artificial surface defects were loaded at R = −1 at a constant stress amplitude.
In order to choose appropriate stress amplitudes, depths and diameters of the artificial defects were analyzed by SEM prior to testing, and defect sizes represented by a r e a AD were calculated assuming a semi-elliptical shape according to:
a r e a AD   = 2 a 2 · t · π / 2
with 2a being the diameter at the surface (i.e., 2a = d = 30 µm) and t being the depth of the artificial defect.   a r e a AD is the square root of the projection area of the artificial defect (AD) perpendicular to the major principal stress direction according to Murakami and Endo [9].
Throughout the tests, the specimens were monitored by means of optical lenses and a charge-coupled device (CCD) camera enabling a maximum magnification of 975-fold. A time interval for saving images was chosen according to crack propagation rates with a maximum of 30 min (corresponding to approximately 5 × 10⁶ load cycles) during crack initiation and early crack propagation. The images were then used to determine surface crack lengths, 2a, and crack growth, Δa, during the applied number of cycles, ΔN, respectively. Fatigue cracks initiated and propagated in mode I for axial as well as torsion loading, and the stress intensity factor amplitudes, Ka, were calculated as follows [47]:
K a = 0.65 · σ 1 · π · a r e a  
σ1 is the amplitude of the major principal stress which is the nominal stress amplitude in the specimen’s length direction for cyclic axial loading, σ1 = σa, and the shear stress amplitude for torsion loading, σ1 = τa. a r e a is the square root of the assumed projection area of the crack perpendicular to the major principal stress direction, including the size of the artificial defect, a r e a AD . Based on fractographic investigations in a previous study [28], it is assumed that fatigue cracks initiate at the mouth of the hole (i.e., at the specimen’s surface), that the shape of the crack, including the artificial defect, is semi-elliptical and that the crack grows solely in length at the surface, 2a, (and not in depth) as long as the ratio of half the surface crack length, a, and the depth of the artificial defect, t, is larger than 0.8. If t/a is equal to or less than 0.8, t = 0.8a is used to calculate the crack size a r e a according to Equation (1).
During fatigue loading in vacuum, a specimen temperature of up to 45 °C was tolerated and estimated by the observed decrease in resonance frequency. Prior to testing, the correlation between specimen temperature and resonance frequency was determined. The specimen temperature was then controlled by adjusting pause times accordingly.

3. Results

3.1. S-N Data

Figure 2 show fatigue data measured at load ratios R = −1, 0.1 and 0.35 for cyclic axial loading (2a) and cyclic torsion loading (2b). Fatigue lifetimes between 2 × 10⁵ and 5 × 10⁹ cycles were investigated. Different symbols were used to indicate crack initiation at the surface (without inclusions) or in the interior (at aluminate-, TiN-and MnS inclusions, respectively, or in the metal matrix without an inclusion). Data of specimens that survived 5 × 10⁹ cycles without failure (runout specimens) were marked as open circles with arrows.
Crack initiation at interior inclusions is the most prominent VHCF failure mechanism for axial loading at all load ratios and torsion loading at positive load ratios (Figure 2). At R = −1, where crack initiation was at the surface even in the VHCF regime, no inclusion-initiated fracture was found under torsion loading. This shows that the mechanism of crack initiation is not only influenced by the number of cycles to failure but also by the loading condition.
S-N data shown in Figure 2 correlate nominal stress amplitudes with fatigue lifetimes. For axial loading, the stress amplitude was constant over the specimen’s cross-section and consequently equal to the nominal stress amplitude in the case of surface as well as interior crack initiation. For cyclic torsion loading, the local stress amplitude, τa,loc, decreased linearly from the nominal stress amplitude, τa,nom, at the surface to zero in the center, i.e., the local stress amplitude at the crack initiation site was equal to the nominal stress amplitude in case of surface crack initiation (τa,loc = τa,nom) but lower in the case of interior crack initiation (τa,loc < τa, nom). The location of interior crack initiation was randomly distributed under axial loading. Interior crack initiation in 65% of torsion specimens was between 200 µm and 300 µm below the surface, with a minimum of 160 μm and a maximum of 480 μm corresponding to local stress amplitudes of 92% to 77% of the nominal stress amplitudes. By mean, shear stress amplitudes at crack initiating inclusions, τa,loc, were 87 ± 4% of the nominal shear stress amplitudes at the specimens’ surfaces, τa,nom.

3.2. Crack Initiating Inclusions

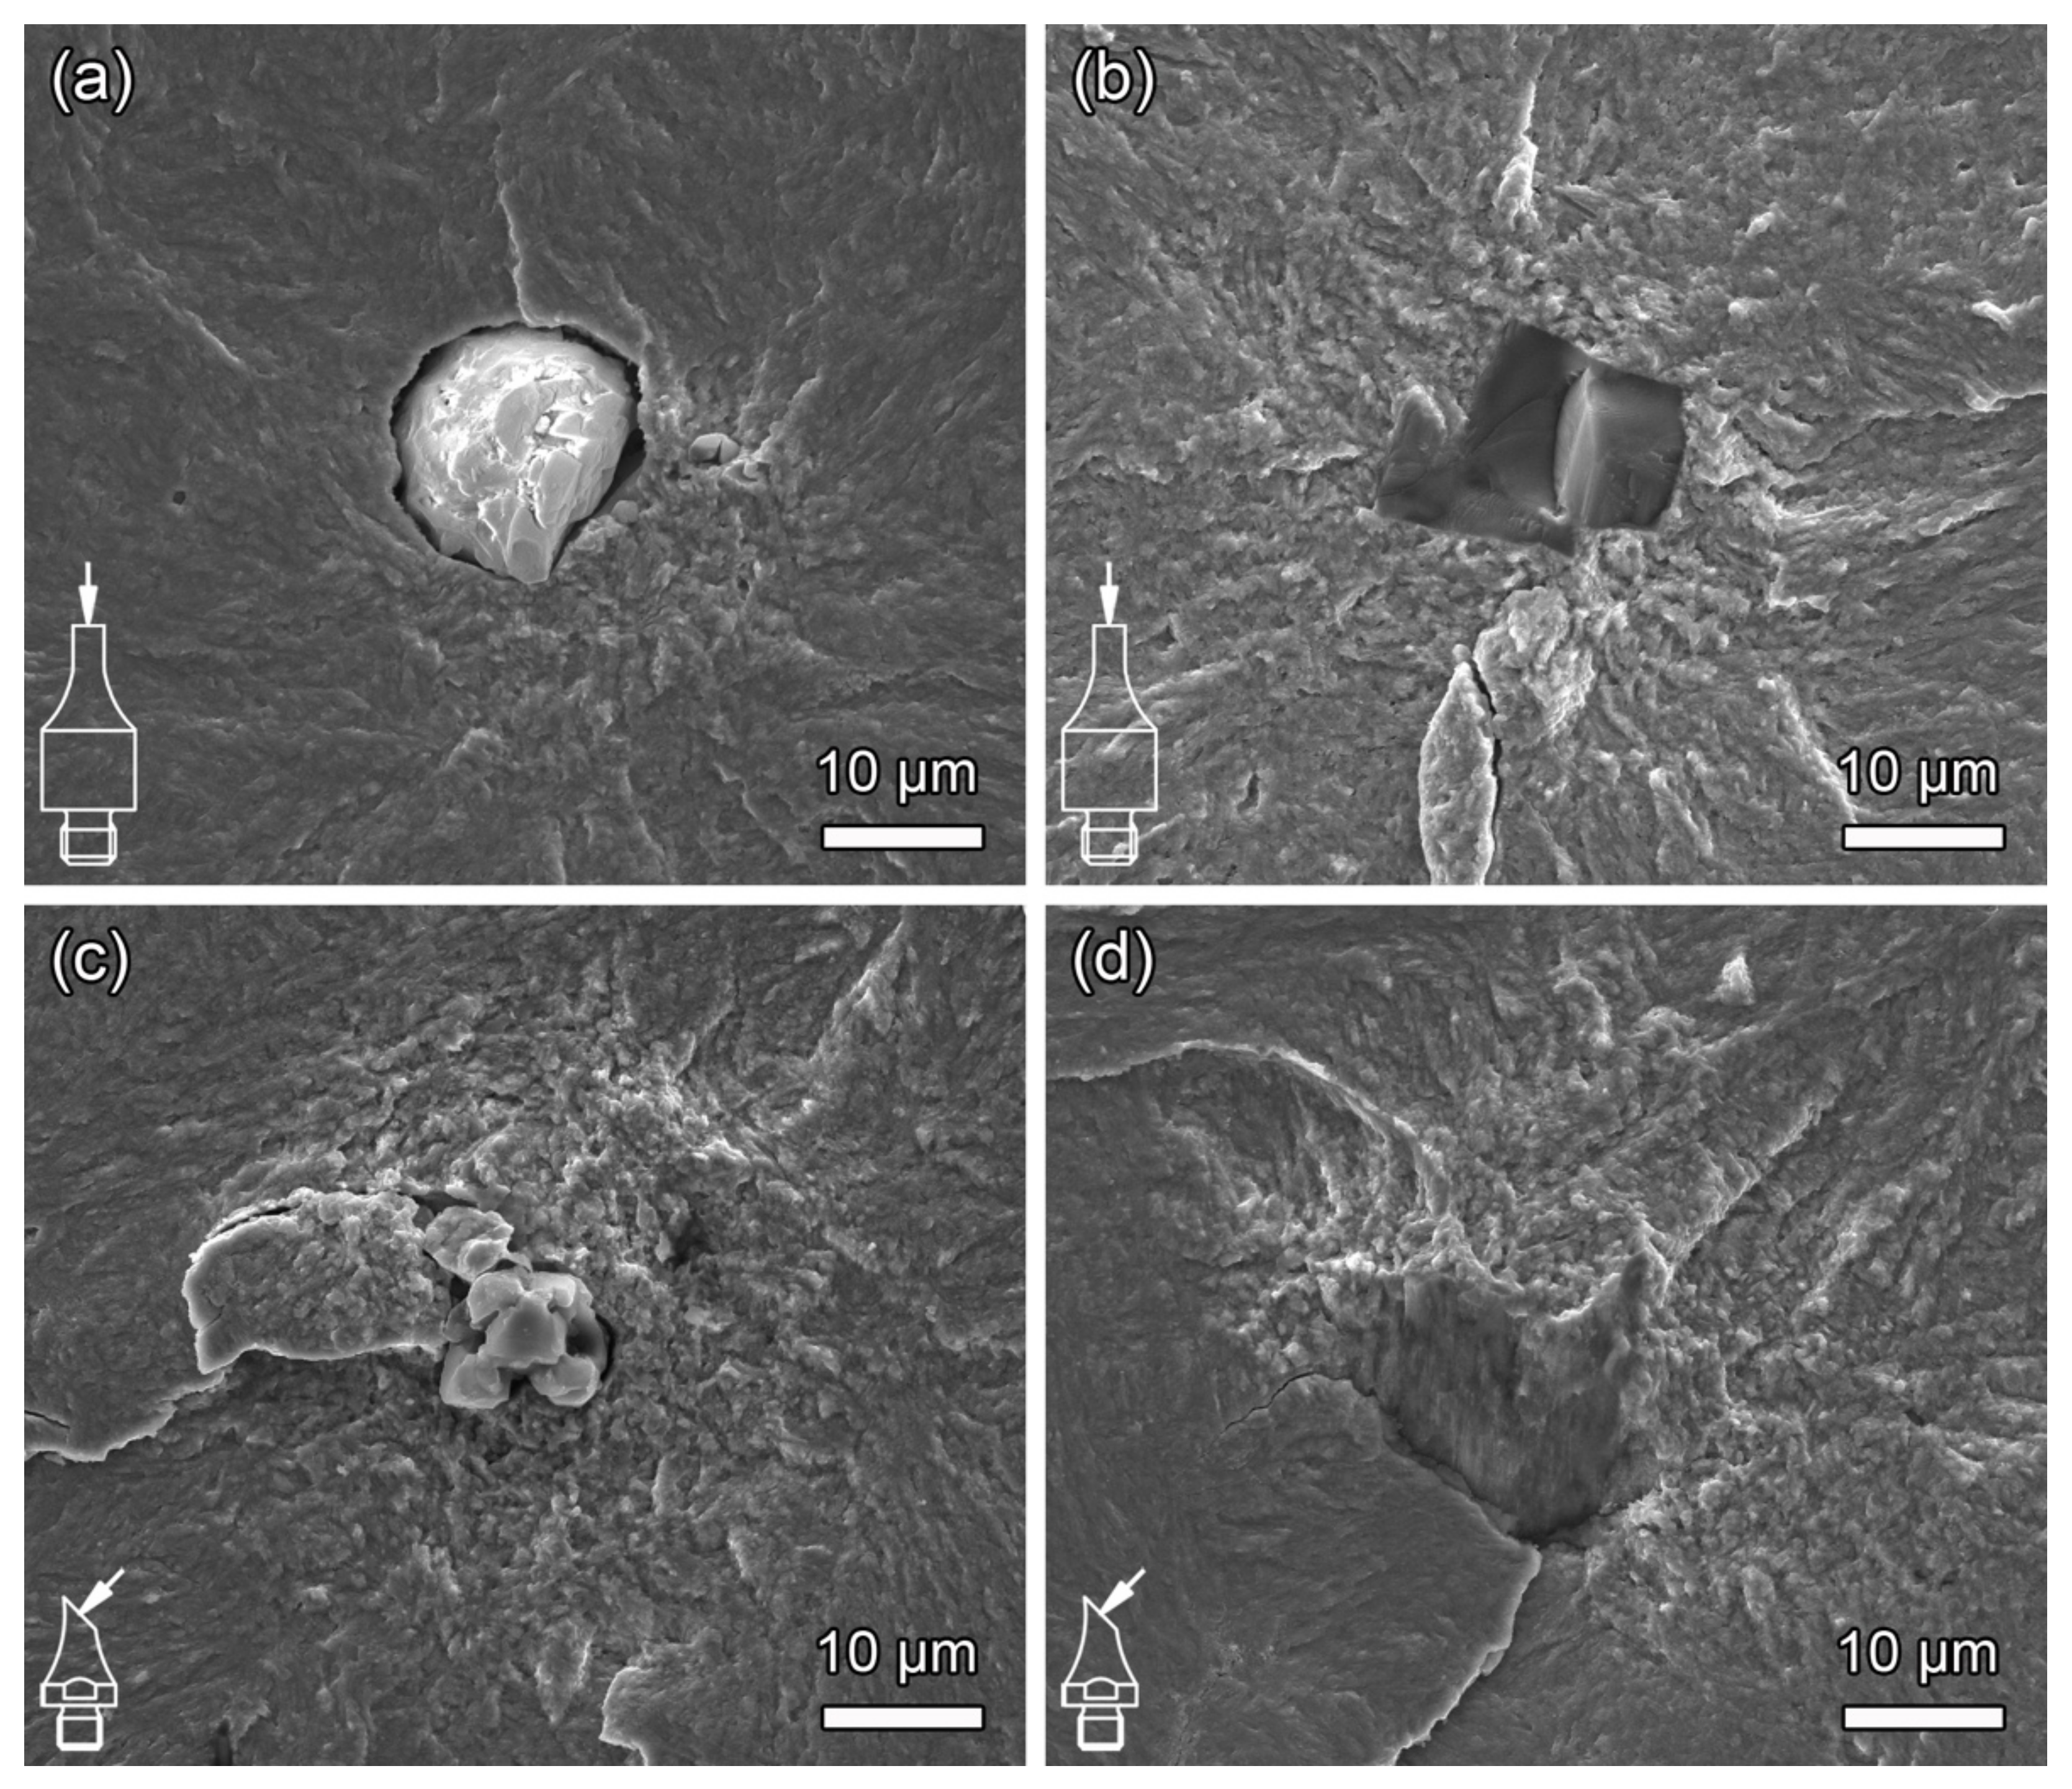
Crack initiating inclusions leading to VHCF failure under axial and torsion loading are shown in Figure 3. Under axial loading, aluminate inclusions (Figure 3a) emanating fatigue cracks accounted for all failures but one which was caused by a TiN inclusion (Figure 3b). Under torsion loading, where inclusion-initiated fracture was observed solely at R = 0.1 and 0.35, aluminate (Figure 3c) and MnS (Figure 3d) inclusions were found at the crack initiation sites. SEM analyses of crack initiation sites revealed a difference in fracture mode dependent on inclusion type. In the case of aluminate inclusions, the fatigue crack initiates by interface failure between matrix and particle and propagates in mode I, i.e., perpendicular to the major principal stress direction. In contrast, in the case of MnS inclusions, a shear crack initiates within and fractures the particle itself. After initially propagating in mode II/III, the crack branches and continues to grow into the matrix in mode I.
The deleterious effect of an inclusion on the cyclic strength is mainly determined by its size, which is, according to Murakami and Endo’s a r e a parameter model [9], represented by the square root of its projection area perpendicular to the major principal stress direction. Furthermore, in [52,53], it was demonstrated that, similar to axial loading, the threshold condition for mode I crack propagation determines the fatigue limit under cyclic torsion, even if crack initiation occurs in mode II/III. Fracture surfaces formed under both loading conditions were therefore oriented accordingly to correspond to the plane perpendicular to the major principal stress direction in order to evaluate the a r e a parameter. Thus determined, minimum and maximum values for a r e a with respect to inclusion type and R-ratio are shown in Table 3. The size ranges shown for aluminate and MnS inclusions refer to specimens that fractured within 5 × 10⁹ load cycles, whereas MnS (runouts) refer to specimens that have been reloaded at R = 0.1, after having survived limiting lifetimes, in order to identify the most detrimental inclusion in the respective specimen.

3.3. Near Threshold Fatigue Crack Growth

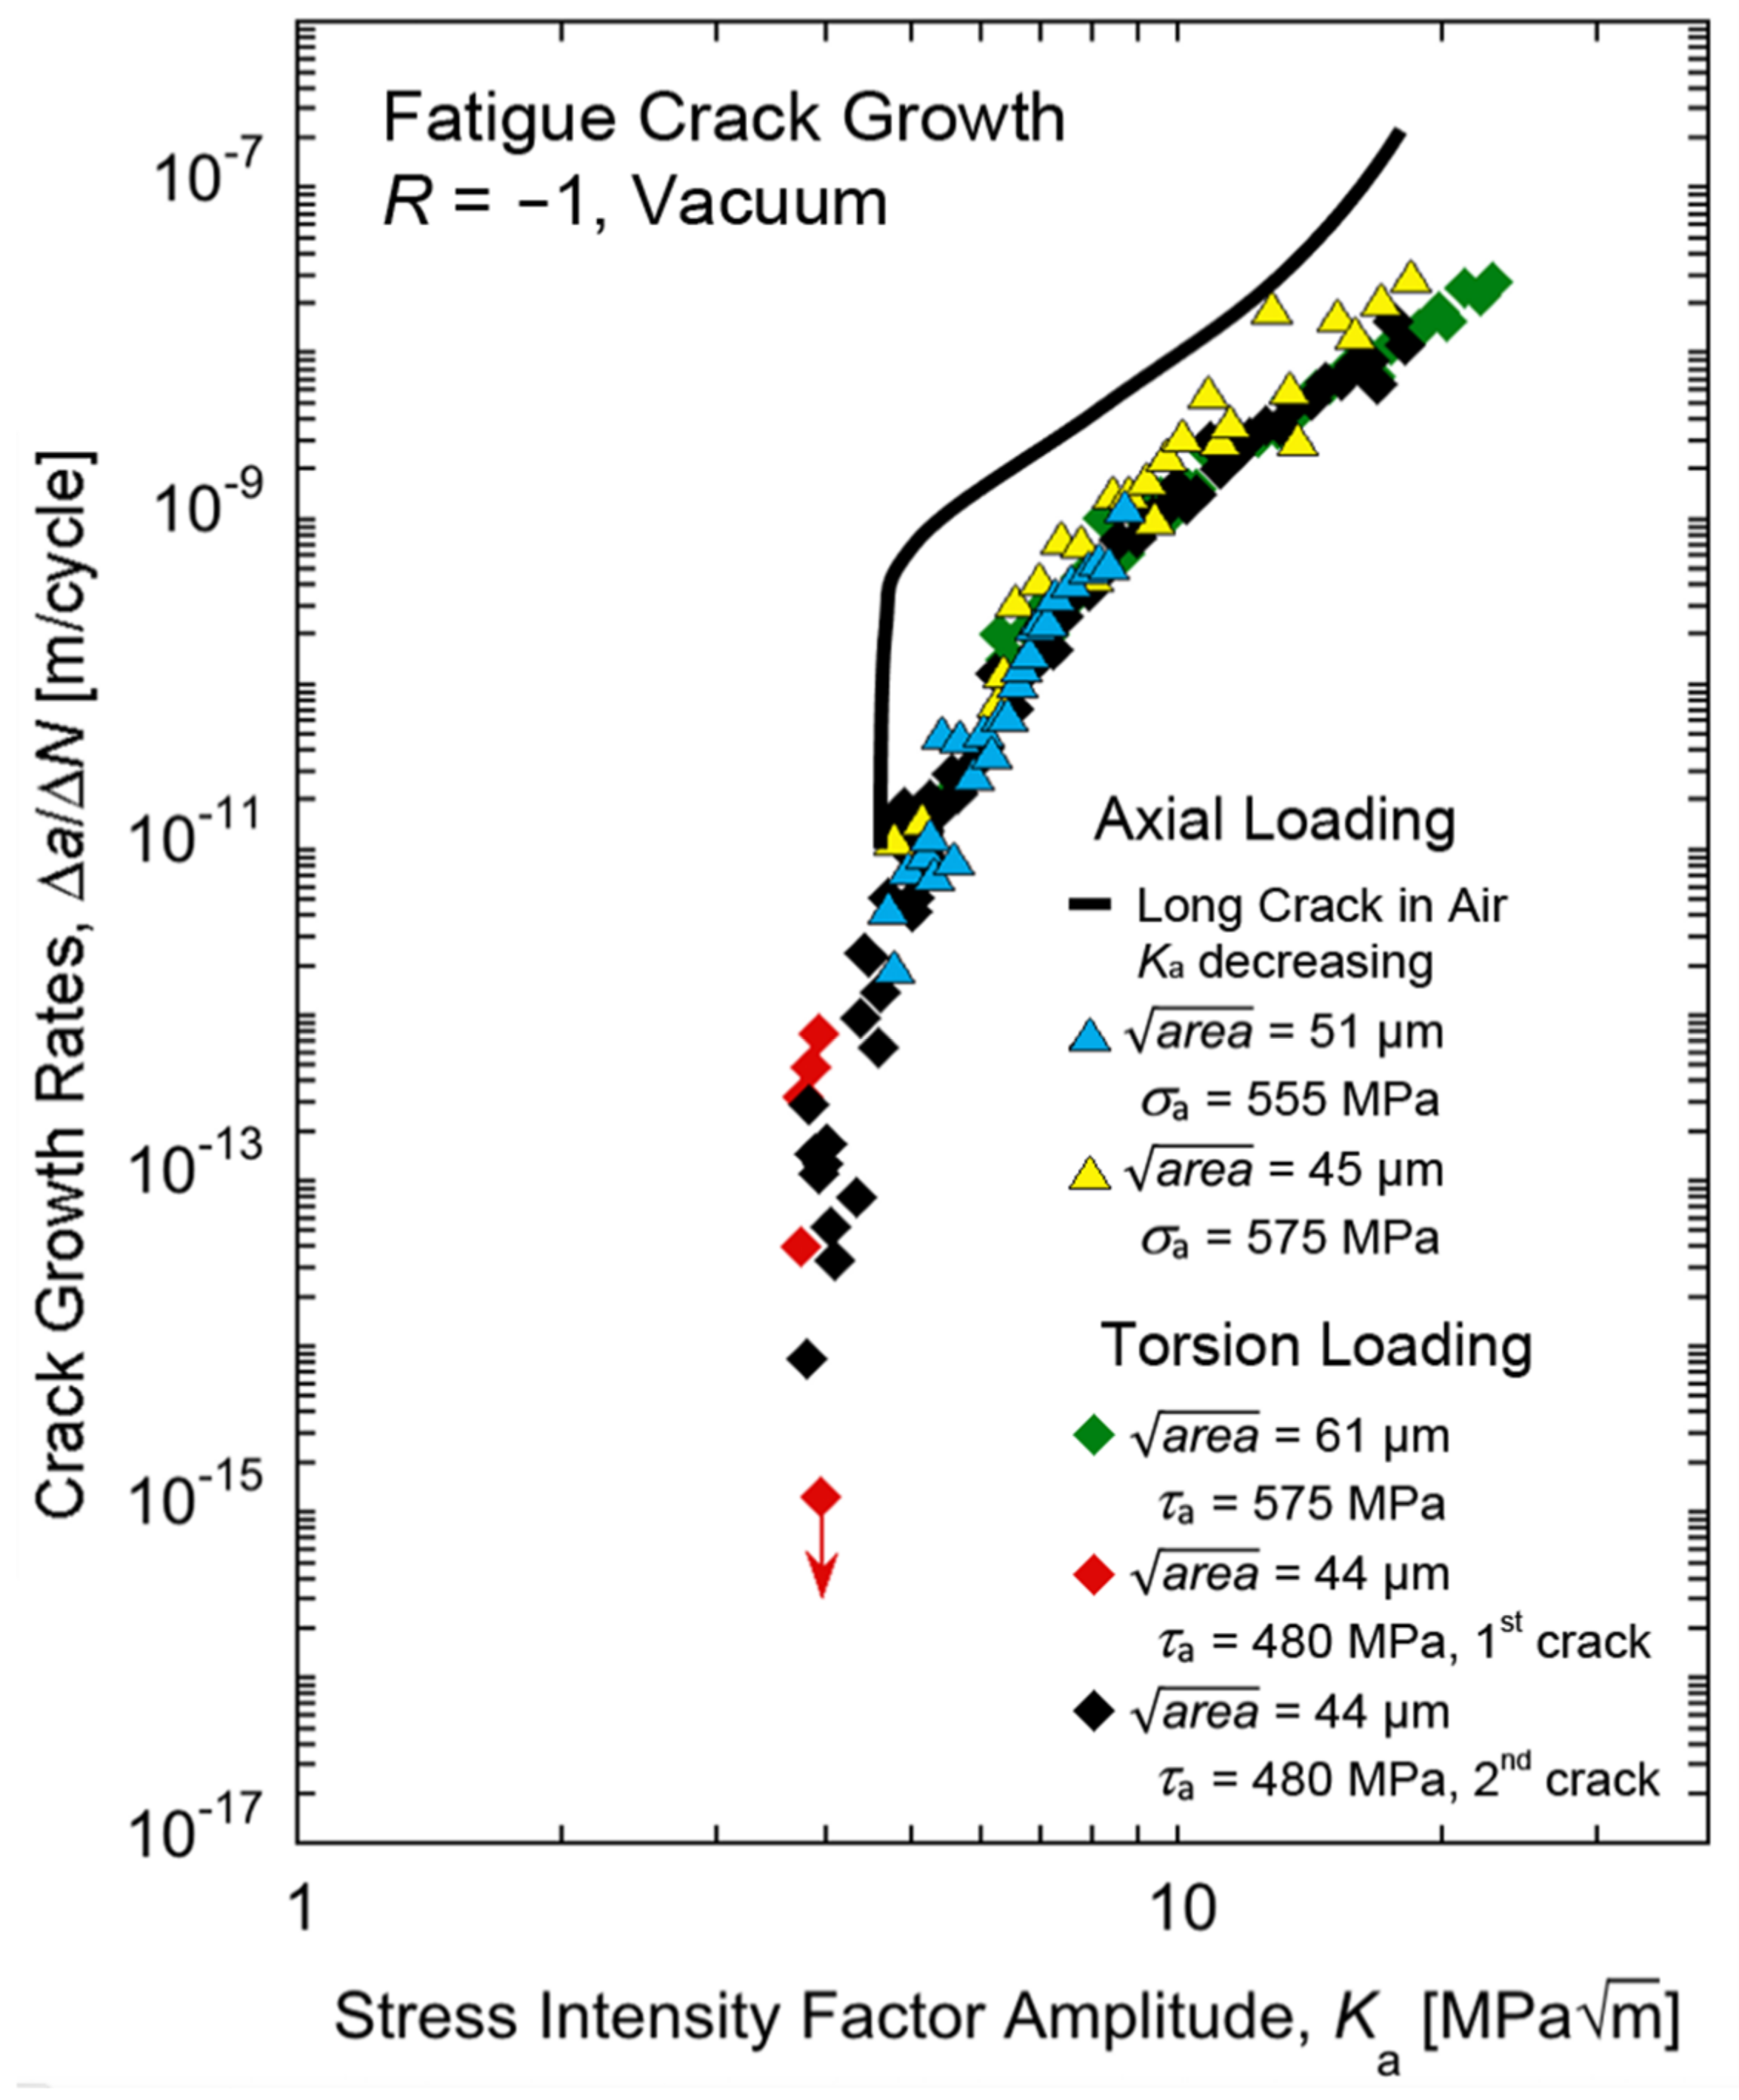
Results of fatigue crack growth rate measurements in vacuum at R = −1 under axial and torsion loading are shown in Figure 4. Artificially initiated holes on the specimens’ surfaces featured diameters of approximately 30 µm and depths between 73 and 97 µm resulting in values of a r e a between 44 µm and 61 µm, according to Equation (1). With these, stress amplitudes near the fatigue limit, according to Murakami and Endo’s a r e a parameter model (see details in Section 4) were estimated prior to the tests. Two specimens were cycled under axial and torsion loading each at nominal stress amplitudes of σa = 550 MPa and 575 MPa and τa = 480 MPa and 575 MPa, respectively. In three specimens, a single crack was observable that initiated at the artificial defect and grew to fracture propagating in mode I, i.e., perpendicular to the specimen’s length axis under axial loading and inclined 45° towards the specimen’s length axis under torsion loading, respectively. In the second specimen subjected to cyclic torsion loading, a first crack initiated at the hole but stopped growing after 3.3 × 10⁷ cycles at a length of 11 µm. Subsequently, a second crack originated and grew to fracture.
Crack propagation rates are plotted vs. stress intensity factor amplitudes, Ka. Data obtained under axial (triangles) and torsion (diamonds) loading fall within the same band of scattering, and no influence of loading condition is visible. The most striking result is that very slow growth rates in the regime between 10−14 m/cycle to 10−13 m/cycle corresponding to values of Ka between 3.8 MPa m and 4.0 MPa m could be experimentally verified. Such slow growth rates correspond to several thousand load cycles that are, by mean, necessary to propagate the crack by one atomic distance. The fracture surface morphology produced by crack growth in vacuum at growth rates below 10−12 m/cycle is a so-called optical dark area (ODA) [54] or fine granular area (FGA) [55] and appears similar to those found around interior inclusions as shown in Figure 3. It was demonstrated that the formation of this area consumed 98% of the VHCF lifetime of the torsion specimen [8]. For comparison, the solid line shows crack growth data measured in ambient air at 30 Hz [37].

4. Discussion

Interior inclusions are the main reason for VHCF failures in the investigated spring steel under axial and torsion loading. The testing material is, therefore, most appropriate to compare the deleterious influence of small inherent defects on the cyclic strength under both loading conditions. Inclusions can be considered as initial cracks, and hence the fatigue limit is determined by the stress intensity factor necessary to propagate the crack to fracture. Fracture mechanics principles will be used in the following to interpret the findings described above.
The growth of fatigue cracks in vacuum for axial and torsion loading at R = −1 was measured, and similar growth rates were observed if presented versus the mode I stress intensity factor amplitude (Figure 4). Biaxiality under torsion loading did not have a significant influence on crack propagation rates. For cracks starting at artificial surface defects with sizes in a r e a of approximately 44 µm, the threshold stress intensity factor amplitude, Ka,th, in vacuum for limiting growth rates of 10−13 m/cycle is 3.7 MPa m . Growth rates of 10−11 m/cycle were observed for stress intensity factor amplitudes between 4.5 MPa m and 5.5 MPa m . This is comparable to literature data for SWOSC-V, where a threshold stress intensity factor amplitude of 4.5 MPa m is found when tested in air at R = −1 [37]. The higher growth rates measured in air compared with vacuum can be explained by corrosive influences.
The threshold stress intensity factor amplitude of 3.7 MPa m determined in a vacuum, however, cannot be used to predict the cyclic strength in the presence of small internal defects. Stress intensity factor amplitudes calculated for five specimens that failed from internal aluminate inclusions after tension-compression loading was lower than this value [45].
The threshold stress intensity factor amplitude decreases with decreasing crack length in the short crack regime. Murakami and Endo [9] suggested the threshold stress intensity factor of short cracks to be proportional to a r e a 1 / 3 . VHCF lifetimes and cyclic strengths for inclusion-initiated fracture can be well correlated to the parameter σ a · a r e a 1 / 6 [25] rather than the stress amplitude or the stress intensity factor amplitude, since this parameter considers the crack length-dependent threshold stress intensity [45].
In addition to the crack length-dependent threshold, Murakami and Endo’s a r e a parameter model [9] considers the Vickers hardness of a material, HV, to predict the fatigue limit, σw, in the presence of small cracks and defects according to Equation (3).
σ w = b · ( H V + 120 ) ( a r e a ) 1 / 6
where b is 1.56 for internal defects, which will be used in the following since all crack initiating inclusions were in the interior in the investigated steel. For surface defects, b would be 1.43. With HV in kgf/mm2 and a r e a in µm, Equation (3) predicts the fatigue limit, σw, for tension-compression loading at R = −1 in MPa.
The influence of load ratio on the fatigue limit can be considered with the factor 1 R 2 α a [47], which leads to Equation (4):
σ w = 1.56 · ( H V + 120 ) ( a r e a ) 1 / 6 · 1 R 2 α a .
The exponent αa accounts for the mean stress sensitivity under axial loading. It is an empirical parameter between 0 and 1.
Murakami and Takahashi [52] extended the a r e a parameter model to cyclic torsion loading. Endo [46] proposed a criterion for the fatigue limit under biaxial loading according to Equation (5):
σ 1 + κ σ 2 = σ w
where σw is the uniaxial fatigue limit, σ1 and σ2 are the major and minor principal stress amplitudes at the fatigue limit and κ quantifies the effect of compressive stresses acting parallel to the direction of mode I crack propagation. For pure cyclic torsion τw = σ1 = −σ2, which leads to Equation (6) for the predicted fatigue limit at R = −1:
τ w = 1 1 κ b · ( H V + 120 ) ( a r e a ) 1 / 6 .
The effect of load ratio on the cyclic torsion strength can be considered similarly as above, using the exponent αt to account for the mean stress sensitivity under torsion loading. With b = 1.56 for interior inclusions, this leads to Equation (7):
τ w = 1 1 κ 1.56 · ( H V + 120 ) ( a r e a ) 1 / 6 · 1 R 2 α t .
Considering the same location and size of the crack initiating defects, the factor 1/(1 − κ) equals the ratio of torsion to axial cyclic strength, τw/σw. Studying thresholds for cracks at artificial defects subjected to axial and torsion loading, ratios in the range of 0.83 to 0.88 were found [56]. An average value of τa/σa = 0.85 has been experimentally confirmed on artificial as well as natural surface defects in carbon steels, ductile cast iron, Cr-Mo steel and 17-4PH stainless steel [41,46,57]. In a previous study on the presently investigated spring steel SWOSC-V, a value for 1/(1 − κ) = 0.86 ± 0.05 was determined by comparing the influence of similar size aluminate inclusions on torsion and axial fatigue strength [45]. With this information, Equation (8) predicts the cyclic torsion strength for internal inclusion-initiated fracture:
τ w = 0.86 · 1.56 · ( H V + 120 ) ( a r e a ) 1 / 6 · 1 R 2 α t .
In the following, it will be investigated if Equation (4) for axial loading and Equation (8) for torsion loading with appropriate exponents αa and αt, respectively, can be used to accurately predict the fatigue limit in the presence of interior inclusions.
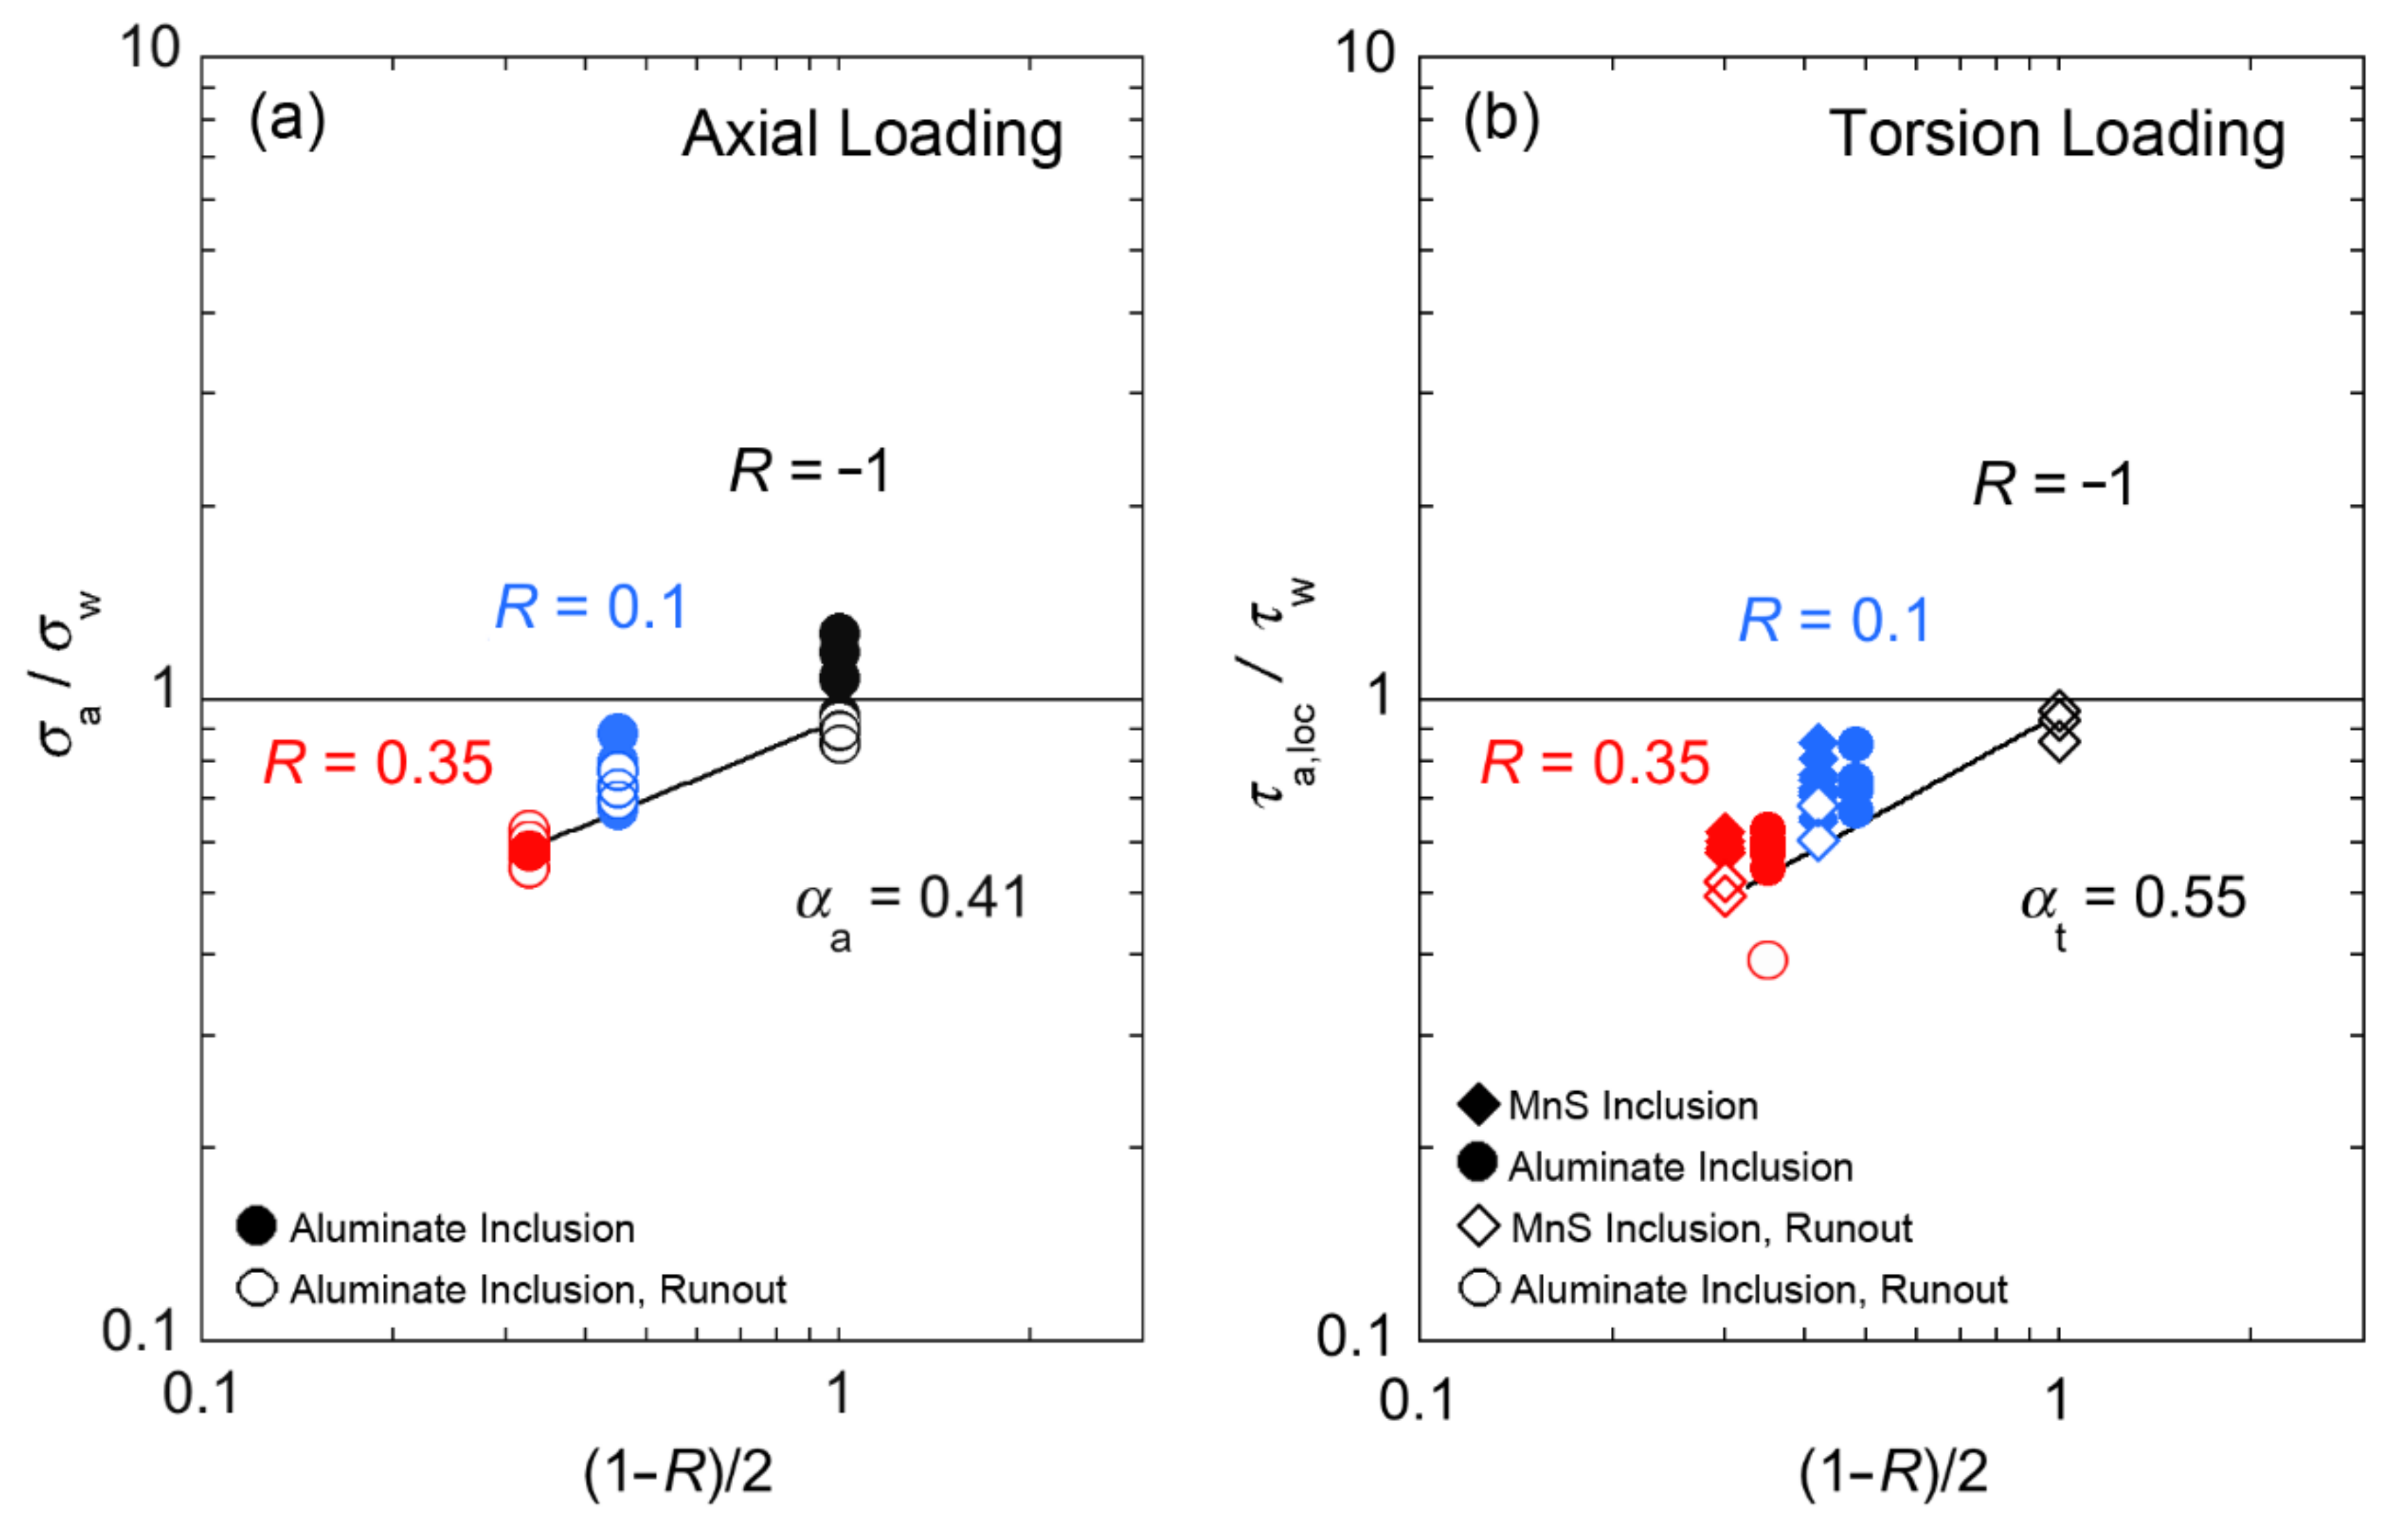
Figure 5 show failures and runouts at different load ratios with respect to relative stress amplitudes. For axial loading at R = −1, runouts were found for σa/σw between 0.86 and 0.92 and failures between 0.95 and 1.27. This means that Equation (3) can predict the endurance limit for fully reversed axial loading accurately within ±10%, which is the prediction error reported by Murakami [47].
Furthermore, runouts and failures—independent of inclusion type—serve to evaluate the exponents αa and αt that consider the R-ratio influence on the fatigue limit. Data for fitting in Figure 5 were chosen as explained in the following: If failure occurred (i.e., at all R-ratios under axial and at R = 0.1 and 0.35 under torsion loading, respectively), the one maximum value of σ a · a r e a 1 / 6 1.56 · H V + 120 and τ a , loc · a r e a 1 / 6 0.86 · 1.56 · H V + 120 obtained by a runout was used that was below the lowest respective value obtained by a failed specimen. If no failure occurred, which is the case at R = −1 under torsion loading, the maximum value of τ a , loc · a r e a 1 / 6 0.86 · 1.56 · H V + 120   of a runout was chosen. Through these data points, straight lines were drawn, and the slopes corresponding to the exponents αa and αt were determined. The exponent for axial loading αa was found to be 0.41, and the exponent for torsion loading αt was 0.55. Values for the exponent α measured for different steels are available in the literature, however, solely for axial and not for torsion loading. The reported exponents are in the range between 0.368 and 0.546 [17,20,28,54]. Hence, the presently determined value fits well with the literature data.
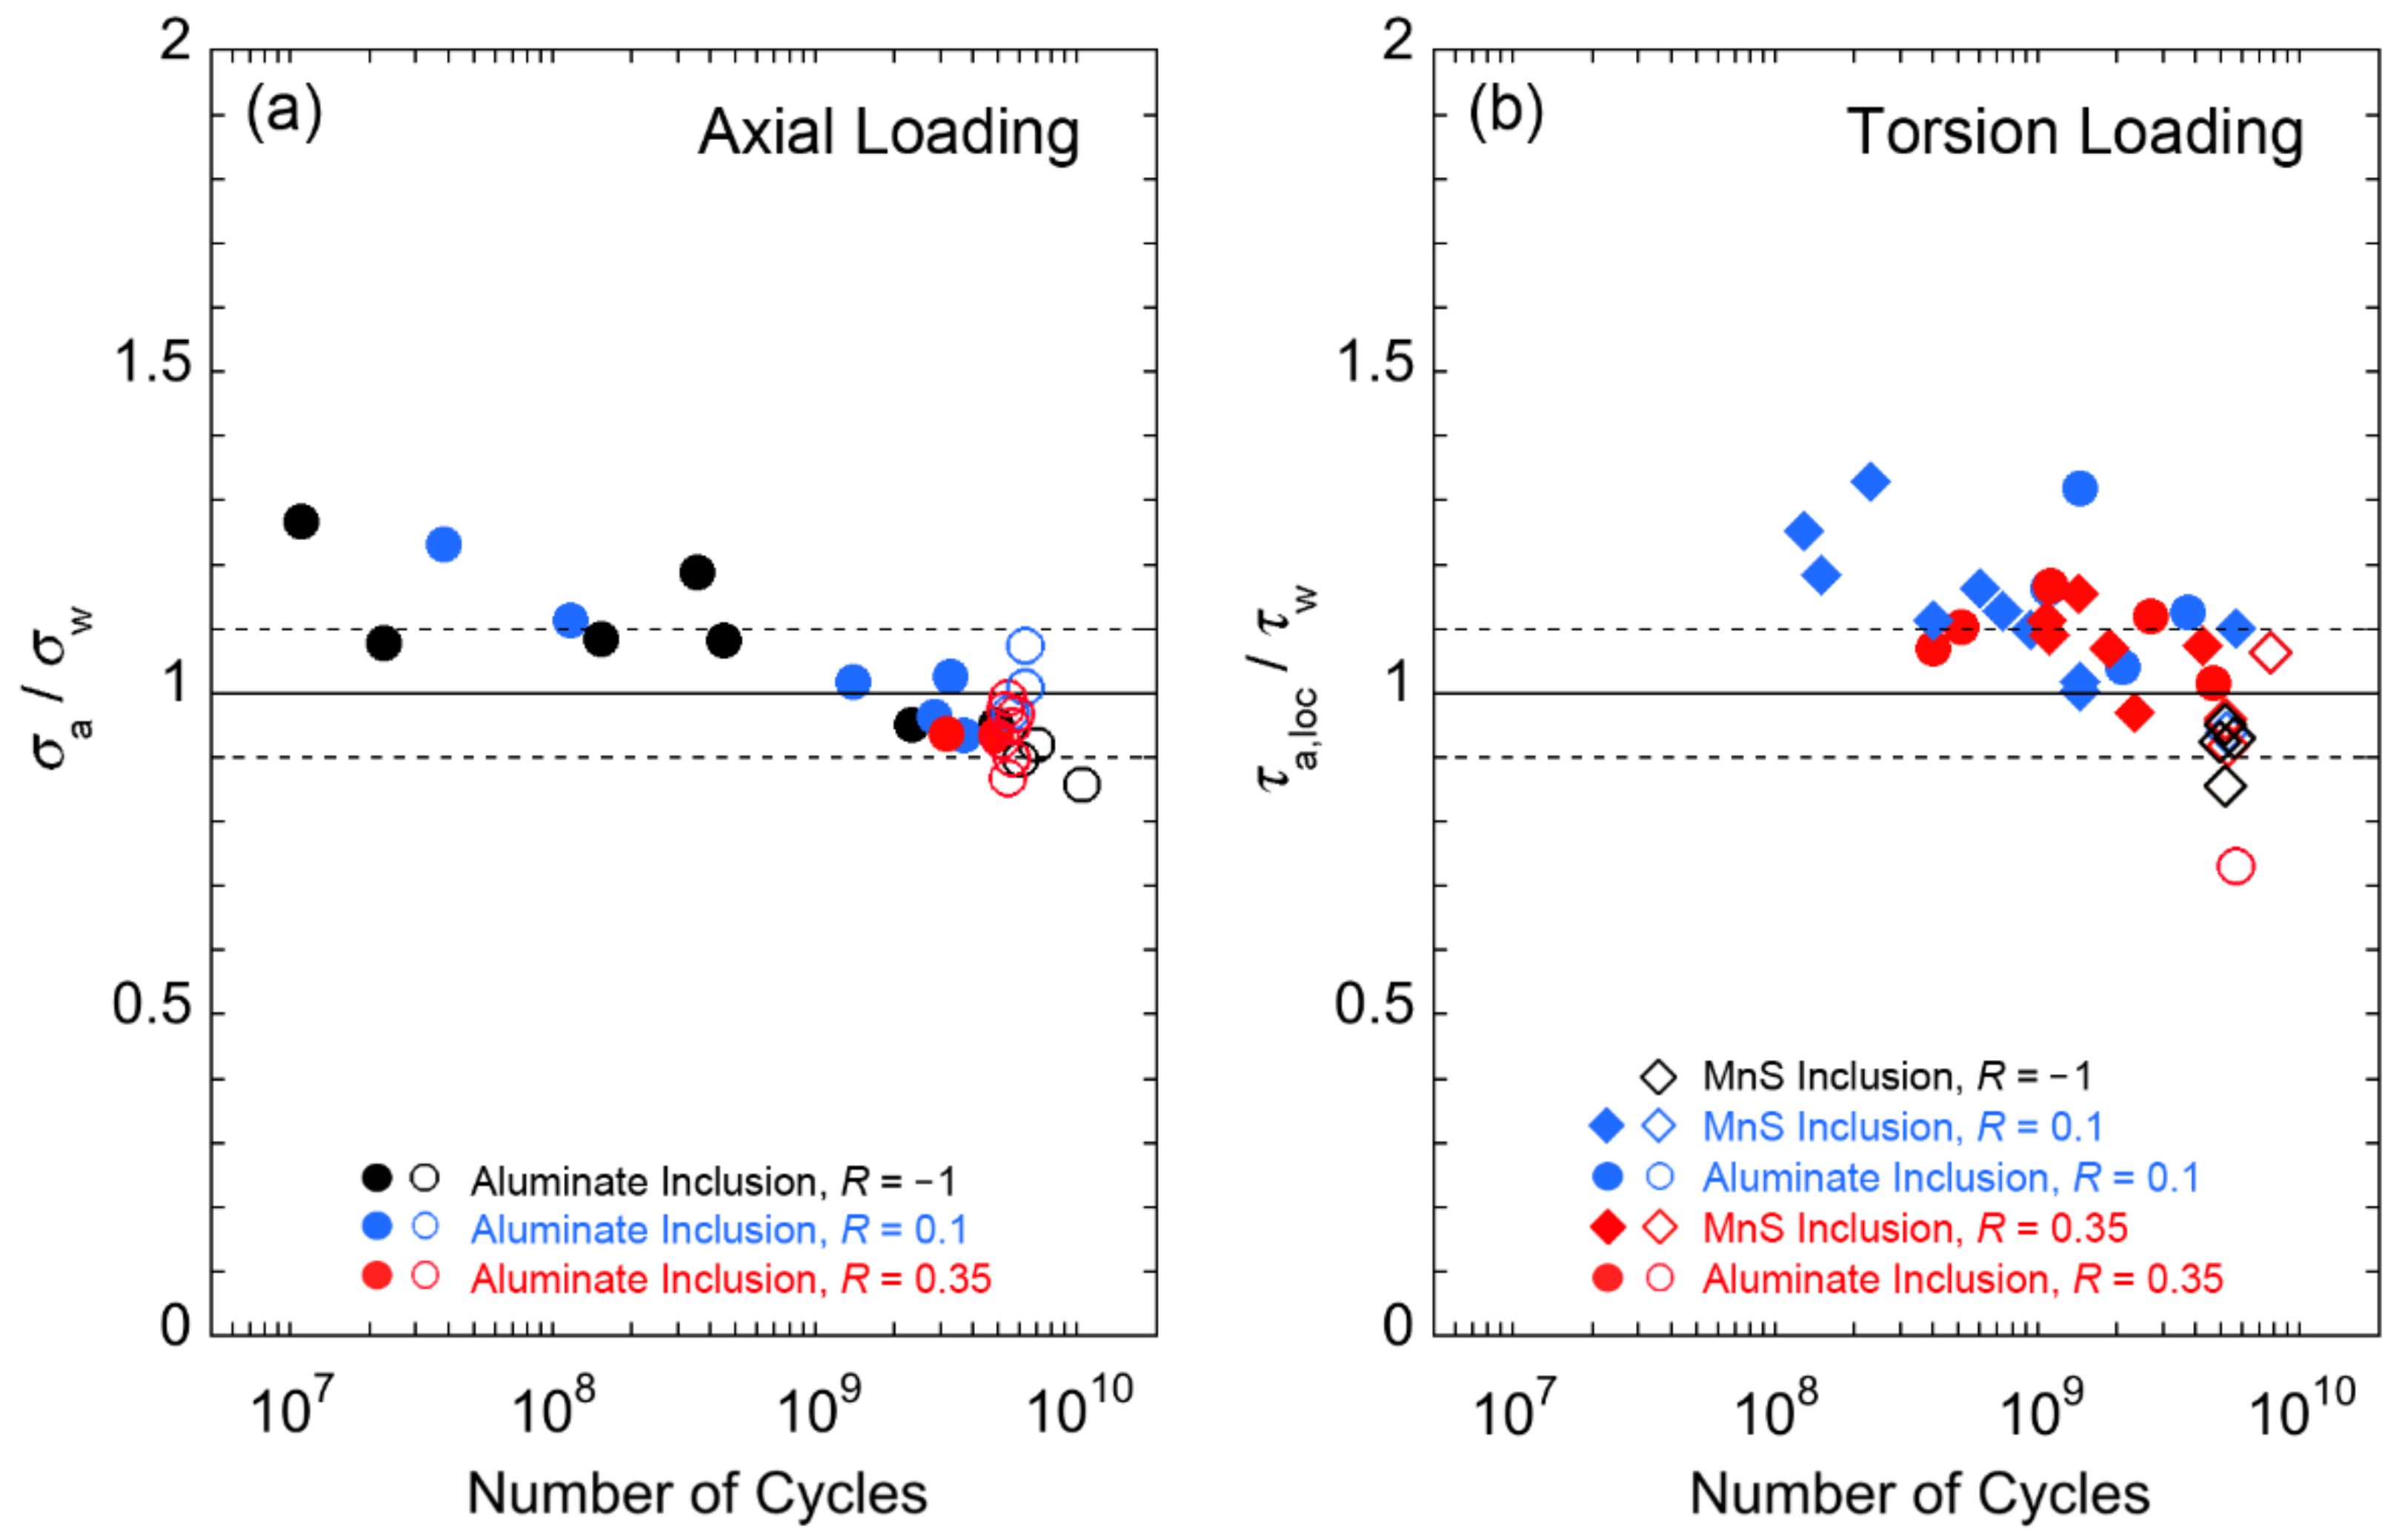
Figure 6 show the ratio of stress amplitudes at crack initiation, σa and τa,loc, and predicted fatigue limits against fatigue lifetimes. The predicted fatigue limit, σw for axial loading, is determined by Equation (9):
σ w = 1.56 · ( H V + 120 ) ( a r e a ) 1 / 6 · 1 R 2 0.41 .
The predicted fatigue limit for torsion loading, τw is determined by Equation (10):
τ w = 0.86 · 1.56 · ( H V + 120 ) ( a r e a ) 1 / 6 · 1 R 2 0.55 .
For the sake of conservatism, all displayed data points in Figure 6 representing failures should be larger than 1. Five data points for axial loading and one for torsion loading fall below this line; however, all these data represent failures above 109 cycles. Equations (9) and (10) therefore well predict the fatigue limit for limiting lifetimes of 109 cycles and only slightly overestimate the fatigue limit at 5 × 10⁹ cycles. Again, the prediction lies within the prediction error of ± 10%.
Figure 7 show the Kitagawa–Takahashi diagrams for axial and torsion loading. The stress amplitudes are multiplied with 1 R 2 α a and 1 R 2 α t , respectively, to eliminate the influence of load ratio.
  • Solid lines with a slope of −1/6 in Figure 7 predict the fatigue limit in the short crack regime using Equations (9) and (10).
  • Solid lines with a slope of −1/2 in Figure 7 predict the fatigue limit in the long crack regime using the long crack threshold stress intensity factor amplitude, Ka,th,lc, according to Equation (11):
σ w = K a , th , lc 0.5 · π · a r e a · 1 / 2
The unit for a r e a using Equation (11) to predict the cyclic strength in the long crack regime is m. In contrast, a r e a in µm is used to calculate the cyclic strength for short cracks using Equations (9) and (10). The long crack threshold of Ka,th,lc = 4.5 MPa m determined in air at R = −1 [37] is used to construct the straight line in the long crack regime in Figure 7. It can be seen that interior inclusions are smaller than a r e a = 125 µm for axial loading and a r e a = 196 µm for torsion loading can be considered as small cracks. Similar transition sizes between small and large defects (short and long cracks) are found for other high-strength steels [28,58].
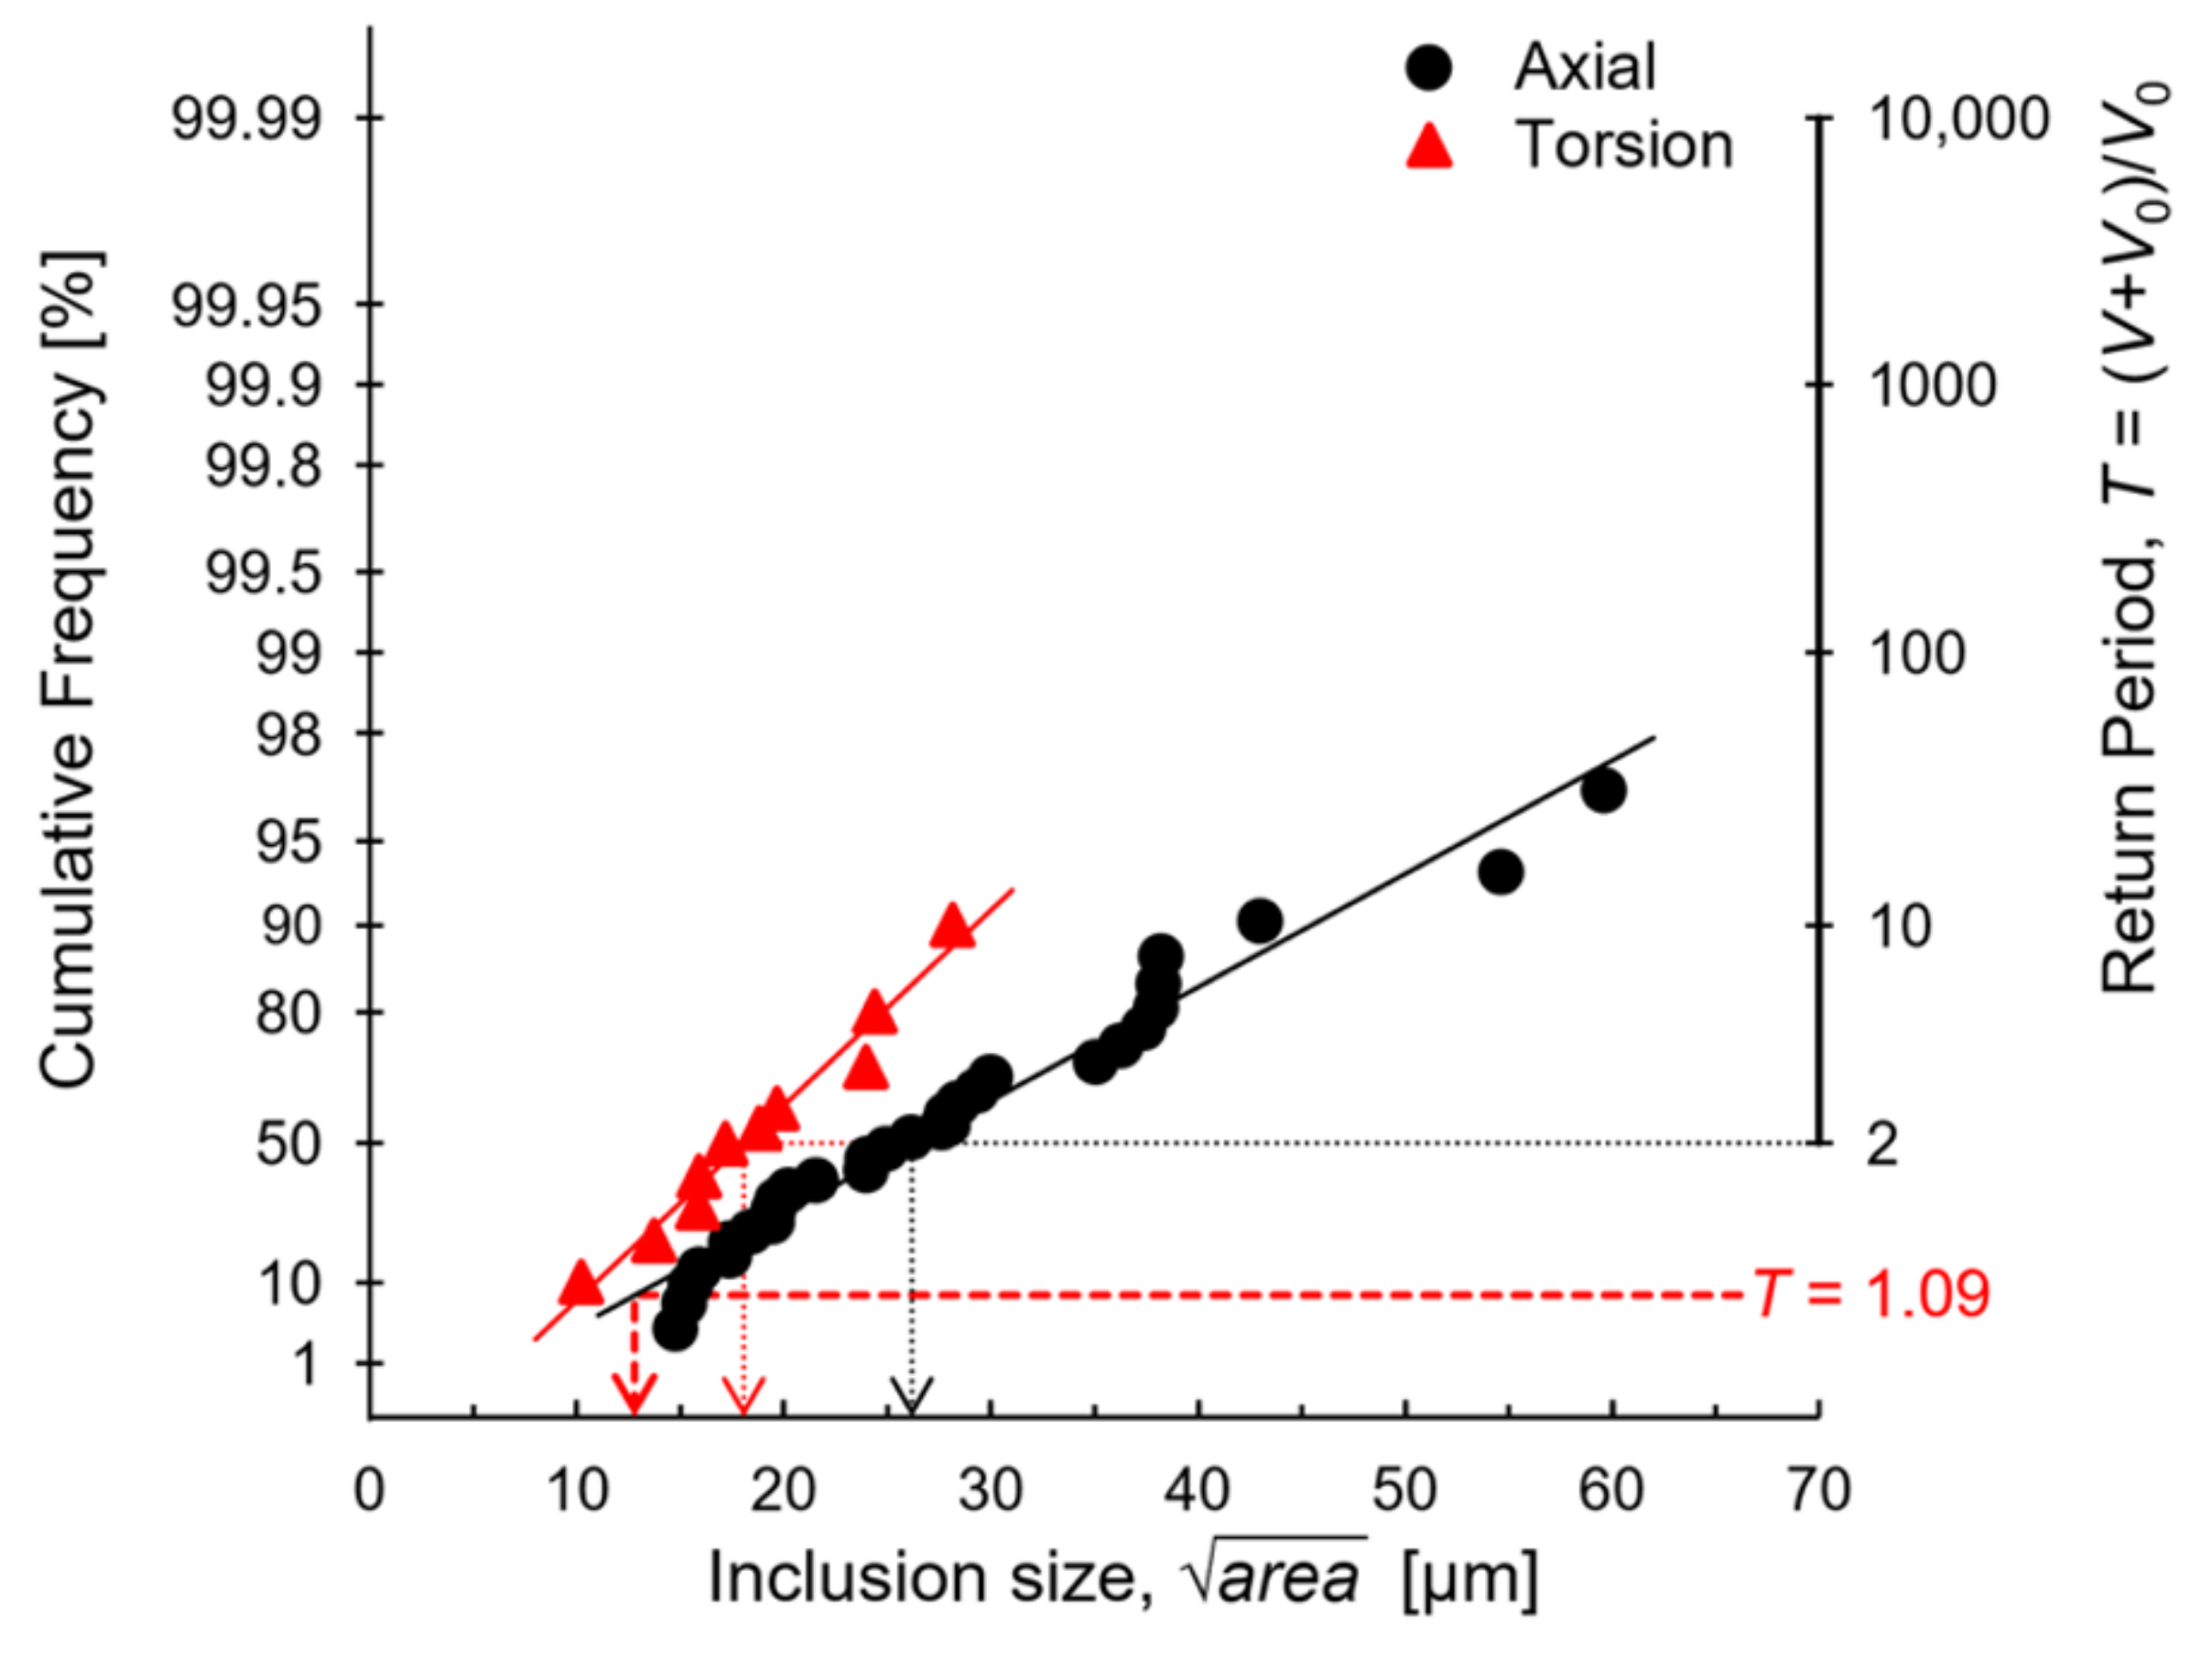
Table 3 show that all crack initiating inclusions are in the short crack regime. However, crack initiating inclusions in torsion fatigue specimens are smaller than those found in axially loaded specimens. This is a consequence of the smaller volume subjected to high stresses in torsion compared with axial fatigue specimens. The material volumes where crack initiating inclusions were observed are 108 mm3 in axial specimens and 9 mm3 in torsion specimens. Assuming that the origin of failure for each test specimen is the largest inclusion in the highly stressed volume, the size distribution of inclusions can be plotted in an extreme value distribution diagram [47]. This is shown for aluminate inclusions in Figure 8. The median inclusion size for axial specimens is 26 µm which is significantly larger than 18 µm for torsion specimens. This can be explained by the much smaller volume of V = 9 mm3 where crack initiation sites under torsion loading were found. Considering that the highly stressed volume in axial specimens is the reference volume V0 = 108 mm3, the median size of an inclusion expected in a volume of interest, V, can be calculated with the return period, T = (V + V0)/V0 [57]. With this, the predicted median size of aluminate inclusions in a volume V = 9 mm3 is 13 µm, which is within the standard deviation of crack initiating inclusions observed in torsion specimens (18 ± 5 µm).
The considerations above suggest that the influence of inclusions can be treated similarly for axial and torsion loading using the a r e a parameter model. However, this does not mean that the cyclic torsion strength can be deduced from axial loading results since mechanisms causing VHCF failures can be different. The first and most striking difference is that MnS inclusions are solely deleterious for cyclic torsion loading. As schematically shown in Figure 9, this can be explained easily with the slender and elongated form of these inclusions parallel to the specimen’s length axis [44]. a r e a projected in the direction of maximum tensile stress is very small for axial loading but not for torsion loading, and consequently, MnS inclusions are deleterious for torsion but not for axial loading. Axial loading tests therefore underestimate the deleterious influence of inclusions aligned in the length direction.
A second important difference between axial and torsion loading is the insensitivity of cyclic torsion at R = −1 against inclusion-initiated fracture. The existence of inclusions in runout specimens could be verified, but they were non-detrimental for fully reversed cyclic torsion. Inclusion-initiated fracture observed at positive load ratios, on the other hand, clearly indicates an increasing defect-sensitivity for cyclic torsion loading with increasing R. In contrast, axial loading tests at R = −1 delivered solely inclusion-initiated failures, even in the high cycle fatigue regime, indicating a strong defect sensitivity. This shows that failure mechanisms for axial and torsion loading may be different and influenced differently by mean stresses. Therefore, it is necessary to perform fatigue tests on a material under comparable conditions as in service in order to deduce meaningful data for the cyclic strength.

5. Conclusions

The influence of non-metallic inclusions on very high cycle fatigue (VHCF) strength under axial and torsion loading was investigated with spring steel SWOSC-V featuring an intentionally increased number and size of non-metallic inclusions. S-N tests were performed at ultrasonic cycling frequency up to limiting lifetimes of 5 × 10⁹ load cycles at load ratios R = −1, 0.1 and 0.35 in ambient air. Fatigue crack growth was studied in a vacuum with specimens containing small artificial surface defects subjected to cyclic axial and torsion loading. The following conclusions can be drawn:
1.
Inclusions can be considered as initial cracks. a r e a measured on the plane perpendicular to the maximum principal stress determines the deleterious influence of an inclusion. Therefore, aluminates are deleterious for axial and torsion loading, whereas elongated MnS inclusions aligned in a rolling direction solely initiate cracks under torsion loading.
2.
Crack initiation and propagation at aluminates are in mode I under axial and torsion loading. Crack initiation at MnS inclusions under torsion loading is in mode II/III, followed by further crack growth in mode I. For both types of inclusions and both loading conditions, the threshold for mode I crack growth determines the fatigue limit.
3.
The long crack threshold stress intensity amplitude in vacuum at R = −1 for limiting growth rates of 10−13 m/cycle is 3.7 MPa m . a r e a of inclusions is in the short crack regime where the threshold stress intensity decreases with decreasing crack length and failures can occur at lower stress intensities.
4.
Murakami and Endo’s a r e a parameter model predicts the axial loading fatigue limit at R = −1 within the reported prediction error of ± 10%. The influence of biaxiality on torsion loading of a material defect is considered with a factor of 0.86. The factor 1 R 2 α accounts for the mean stress sensitivity. With this, the following equation was successfully used to predict the fatigue limit for cyclic axial loading at different R-ratios:
σ w = 1.56 · ( H V + 120 ) ( a r e a ) 1 / 6 · 1 R 2 0.41
The following equation was successfully used to predict the fatigue limit for cyclic torsion loading at different R-ratios:
τ w = 0.86 · 1.56 · ( H V + 120 ) ( a r e a ) 1 / 6 · 1 R 2 0.55
5.
Cyclic torsion properties in the presence of inclusions can hardly be deduced from cyclic axial properties: Shape and orientation of inclusions influence their harmfulness, size effects cause different distributions of inclusion sizes, and R-ratio sensitivity was found to be different for axial and torsion loading. Ultrasonic cyclic torsion tests with different mean loads are most appropriate for rapidly collecting torsion fatigue data of material.

Author Contributions

U.K.: investigation, conceptualization, methodology, formal analysis, validation, visualization, writing—review and editing; B.M.S.: formal analysis, methodology, visualization, writing—review and editing; Y.S.: resources, conceptualization; H.M.: conceptualization, methodology, formal analysis, validation, writing—original draft, supervision, project administration. All authors have read and agreed to the published version of the manuscript.

Funding

This research received no external funding.

Institutional Review Board Statement

Not applicable.

Informed Consent Statement

Not applicable.

Data Availability Statement

The data that support the finding of this study are included in the paper.

Conflicts of Interest

The authors declare no conflict of interest.

Nomenclature

a r e a square root of the projection area of a small, arbitrary-shaped defect perpendicular to the major principal stress direction
HVVickers hardness
Kastress intensity factor amplitude
Rload ratio
αaexponent accounting for the load ratio sensitivity of the fatigue limit for axial loading
αtexponent accounting for the load ratio sensitivity of the fatigue limit for torsion loading
κparameter accounting for the influence of a biaxial stress state on the fatigue limit
σwfatigue limit under axial loading
σanormal stress amplitude
σ1, σ2major and minor principal stress
τwfatigue limit under torsion loading
τashear stress amplitude
τa,nomnominal stress amplitude under torsion loading effective at the specimen surface
τa,loclocal stress amplitude under torsion loading effective at the crack initiation site

References

  1. Naito, T.; Ueda, H.; Kikuchi, M. Fatigue behavior of carburized steel with internal oxides and nonmartensitic microstructure near the surface. Metall. Trans. A 1984, 15, 1431–1436. [Google Scholar] [CrossRef]
  2. Asami, K.; Sugiyama, Y. Fatigue strength of various surface hardened steels. J. Heat Treat. Technol. Assoc. 1985, 25, 147–150. [Google Scholar]
  3. Murakami, Y.; Takada, M.; Toriyama, T. Super-long life tension–compression fatigue properties of quenched and tempered 0.46% carbon steel. Fatigue 1998, 20, 661–667. [Google Scholar] [CrossRef]
  4. Nishijima, S.; Kanazawa, K. Stepwise S-N curve and fish-eye failure in gigacycle fatigue. Fatigue Fract. Engng. Mater. Struct. 1999, 22, 601–607. [Google Scholar] [CrossRef]
  5. Shiozawa, K.; Lu, L.; Ishihara, S. S-N curve characteristics and subsurface crack initiation behaviour in ultra-long life fatigue of a high carbon-chromium bearing steel. Fatigue Fract. Engng. Mater. Struct. 2001, 24, 781–790. [Google Scholar] [CrossRef]
  6. Furuya, Y. Visualization of internal small fatigue crack growth. Mater. Lett. 2013, 112, 139–141. [Google Scholar] [CrossRef]
  7. Stäcker, C.; Sander, M. Experimental, analytical and numerical analyses of constant and variable amplitude loadings in the very high cycle fatigue regime. Theor. Appl. Fract. Mech. 2017, 92, 394–409. [Google Scholar] [CrossRef]
  8. Karr, U.; Schönbauer, B.M.; Sandaiji, Y.; Mayer, H. Influence of load ratio on torsion very high cycle fatigue of high-strength spring steel in the presence of detrimental defects. Fatigue Fract. Eng. Mater. Struct. 2021, 444, 2356–2371. [Google Scholar] [CrossRef]
  9. Murakami, Y.; Endo, M. Effects of defects, inclusions and inhomogeneities on fatigue strength. Int. J. Fatigue 1994, 16, 163–182. [Google Scholar] [CrossRef]
  10. Zhang, J.M.; Li, S.X.; Yang, Z.G.; Li, G.Y.; Hui, W.J.; Weng, Y.Q. Influence of inclusion size on fatigue behavior of high strength steels in the gigacycle fatigue regime. Int. J. Fatigue 2007, 29, 765–771. [Google Scholar] [CrossRef]
  11. Lei, Z.; Hong, Y.; Xie, J.; Sun, C.; Zhao, A. Effects of inclusion size and location on very-high-cycle fatigue behavior for high strength steels. Mater. Sci. Eng. A 2012, 558, 234–241. [Google Scholar] [CrossRef] [Green Version]
  12. Furuya, Y.; Hirukawa, H.; Kimura, T.; Hayaishi, M. Gigacycle fatigue properties of high-strength steels according to inclusion and ODA sizes. Metal. Trans. A 2007, 38, 1722–1730. [Google Scholar] [CrossRef]
  13. Spriestersbach, D.; Grad, P.; Kerscher, E. Influence of different non-metallic inclusion types on the crack initiation in high-strength steels in the VHCF regime. Int. J. Fatigue 2014, 64, 114–120. [Google Scholar] [CrossRef]
  14. Karr, U.; Schuller, R.; Fitzka, M.; Schönbauer, B.; Tran, D.; Pennings, B.; Mayer, H. Influence of inclusion type on the very high cycle fatigue properties of 18Ni maraging steel. J. Mater. Sci. 2017, 52, 5954–5967. [Google Scholar] [CrossRef] [Green Version]
  15. Sakai, T.; Sato, Y.; Nagano, Y.; Takeda, M.; Oguma, N. Effect of stress ratio on long life fatigue behavior of high carbon chromium bearing steel under axial loading. Int. J. Fatigue 2006, 28, 1547–1554. [Google Scholar] [CrossRef]
  16. Shiozawa, K.; Hasegawa, T.; Kashiwagi, Y.; Lu, L. Very high cycle fatigue properties of bearing steel under axial loading condition. Int. J. Fatigue 2009, 31, 880–888. [Google Scholar] [CrossRef]
  17. Kovacs, S.; Beck, T.; Singheiser, L. Influence of mean stresses on fatigue life and damage of a turbine blade steel in the VHCF-regime. Int. J. Fatigue 2013, 49, 90–99. [Google Scholar] [CrossRef]
  18. Sander, M.; Müller, T.; Lebahn, J. Influence of mean stress and variable amplitude loading on the fatigue behaviour of a high-strength steel in the VHCF regime. Int. J. Fatigue 2014, 62, 10–20. [Google Scholar] [CrossRef]
  19. Schuller, R.; Karr, U.; Irrasch, D.; Fitzka, M.; Hahn, M.; Bacher-Höchst, M.; Mayer, H. Mean stress sensitivity of spring steel in the very high cycle fatigue regime. J. Mater.Sci. 2015, 50, 5514–5523. [Google Scholar] [CrossRef]
  20. Schönbauer, B.M.; Yanase, K.; Endo, M. VHCF properties and fatigue limit prediction of precipitation hardened 17-4PH stainless steel. Int. J. Fatigue 2016, 88, 205–216. [Google Scholar] [CrossRef]
  21. Abe, T.; Furuya, Y.; Matsuoka, S. Gigacycle fatigue properties of 1800 MPa class spring steel. Fatigue Fract. Engng. Mater. Struct. 2004, 27, 159–167. [Google Scholar] [CrossRef]
  22. Chai, G. The formation of subsurface non-defect fatigue crack origins. Int. J. Fatigue 2006, 28, 1533–1539. [Google Scholar] [CrossRef]
  23. Yu, Y.; Gu, J.L.; Bai, B.Z.; Liu, Y.B.; Li, S.X. Very high cycle fatigue mechanism of carbide-free bainite/martensite steel micro-alloyed with Nb. Mater. Sci. Engng A 2009, 527, 212–217. [Google Scholar] [CrossRef]
  24. Li, W.; Sakai, T.; Wakita, M.; Mimura, S. Effect of surface finishing and loading condition on competing failure mode of clean spring steel in very high cycle fatigue regime. Mater. Sci. Engng A 2012, 552, 301–309. [Google Scholar] [CrossRef]
  25. Mayer, H.; Haydn, W.; Schuller, R.; Issler, S.; Furtner, B.; Bacher-Höchst, M. Very high cycle fatigue properties of bainitic high-carbon-chromium steel. Int. J. Fatigue 2009, 31, 242–249. [Google Scholar] [CrossRef]
  26. Li, W.; Sakai, T.; Wakita, M.; Mimura, S. Influence of microstructure and surface defect on very high cycle fatigue properties of clean spring steel. Int. J. Fatigue 2014, 60, 48–56. [Google Scholar] [CrossRef]
  27. Zimmermann, M. Diversity of damage evolution during cyclic loading at very high numbers of cycles. Int. Mater. Rev. 2012, 57, 73–91. [Google Scholar] [CrossRef]
  28. Schönbauer, B.M.; Mayer, H. Effect of small defects on the fatigue strength of martensitic stainless steels. Int. J. Fatigue 2019, 127, 362–375. [Google Scholar] [CrossRef]
  29. Kaiser, B.; Berger, C. Fatigue behaviour of technical springs. Mat. Wiss. U. Werkstofftechn. 2005, 36, 685–696. [Google Scholar] [CrossRef]
  30. Kaiser, B.; Pyttel, B.; Berger, C. VHCF-behavior of helical compression springs made of different materials. Int. J. Fatigue 2011, 33, 23–32. [Google Scholar] [CrossRef]
  31. Pyttel, B.; Brunner, I.; Kaiser, B.; Berger, C.; Mahendran, M. Fatigue behaviour of helical compression springs at a very high number of cycles—Investigation of various influences. Int. J. Fatigue 2014, 60, 101–109. [Google Scholar] [CrossRef]
  32. Stanzl-Tschegg, S. Very high cycle fatigue measuring techniques. Int. J. Fatigue 2014, 60, 2–17. [Google Scholar] [CrossRef]
  33. Mayer, H. Recent developments in ultrasonic fatigue. Fatigue Fract. Eng. Mater. Struct. 2016, 39, 3–29. [Google Scholar] [CrossRef]
  34. Schönbauer, B.M.; Fitzka, M.; Karr, U.; Mayer, H. Variable amplitude very high cycle fatigue of 17-4PH steel with a stepwise S-N curve. Int. J. Fatigue 2021, 142, 105963. [Google Scholar] [CrossRef]
  35. Stanzl-Tschegg, S.E.; Mayer, H.R.; Tschegg, E.K. High Frequency Method for Torsion Fatigue Testing. Ultrasonics 1993, 31, 275–280. [Google Scholar] [CrossRef]
  36. Mayer, H.; Schuller, R.; Karr, U.; Irrasch, D.; Fitzka, M.; Hahn, M.; Bacher-Höchst, M. Cyclic torsion very high cycle fatigue of VDSiCr spring steel at different load ratios. Int. J. Fatigue 2015, 70, 322–327. [Google Scholar] [CrossRef]
  37. Akiniwa, Y.; Stanzl-Tschegg, S.; Mayer, H.; Wakita, M.; Tanaka, K. Fatigue strength of spring steel under axial and torsional loading in the very high cycle regime. Int. J. Fatigue 2008, 30, 2057–2063. [Google Scholar] [CrossRef]
  38. Schuller, R.; Mayer, H.; Fayard, A.; Hahn, M.; Bacher-Höchst, M. Very high cycle fatigue of VDSiCr spring steel under torsional and axial loading. Materialwiss. Werkstofftech. 2013, 44, 282–289. [Google Scholar] [CrossRef]
  39. Xue, H.Q.; Bathias, C. Crack path in torsion loading in very high cycle fatigue regime. Engng. Fract. Mech. 2010, 77, 1866–1873. [Google Scholar] [CrossRef] [Green Version]
  40. Sandaiji, Y.; Tamura, E.; Tsuchida, T. Influence of inclusion type on internal fatigue fracture under cyclic shear stress. Proc. Mater. Sci. 2014, 3, 894–899. [Google Scholar] [CrossRef] [Green Version]
  41. Schönbauer, B.M.; Yanase, K.; Chehrehrazi, M.; Endo, M.; Mayer, H. Effect of microstructure and cycling frequency on the torsional fatigue properties of 17-4PH stainless steel. Mater. Sci. Eng. A 2021, 801, 140481. [Google Scholar] [CrossRef]
  42. Nishimura, Y.; Yanase, K.; Tanaka, Y.; Miyamoto, N.; Miyakawa, S.; Endo, M. Effects of mean shear stress on the torsional fatigue strength of a spring steel with small scratches. Int. J. Damage Mech. 2020, 29, 4–18. [Google Scholar] [CrossRef]
  43. Mayer, H.; Schuller, R.; Karr, U.; Fitzka, M.; Irrasch, D.; Hahn, M.; Bacher-Höchst, M. Mean stress sensitivity and crack initiation mechanisms of spring steel for torsional and axial VHCF loading. Int. J. Fatigue 2016, 93, 309–317. [Google Scholar] [CrossRef]
  44. Karr, U.; Schönbauer, B.; Fitzka, M.; Tamura, E.; Sandaiji, Y.; Murakami, S.; Mayer, H. Inclusion initiated fracture under cyclic torsion very high cycle fatigue at different load ratios. Int. J. Fatigue 2019, 122, 199–207. [Google Scholar] [CrossRef]
  45. Karr, U.; Sandaiji, Y.; Tanegashima, R.; Murakami, S.; Schönbauer, B.; Fitzka, M.; Mayer, H. Inclusion initiated fracture in spring steel under axial and torsion very high cycle fatigue loading at different load ratios. Int. J. Fatigue 2020, 134, 105525. [Google Scholar] [CrossRef]
  46. Endo, M. Effects of small defects on the fatigue strength of steel and ductile iron under combined axial/torsional loading. In Small Fatigue Cracks: Mechanics, Mechanisms and Applications; Ravichandran, K.S.R.R.O., Murakami, Y., Eds.; Elsevier Science Ltd.: Amsterdam, The Netherlands, 1999; pp. 375–387. [Google Scholar]
  47. Murakami, Y. Metal Fatigue, Effects of Small Defects and Nonmetallic Inclusions; Academic Press: Cambridge, MA, USA, 2019. [Google Scholar]
  48. Furuya, Y. Notable size effects on very high cycle fatigue properties of high-strength steel. Mater. Sci. Eng. A 2011, 528, 5234–5240. [Google Scholar] [CrossRef]
  49. Fitzka, M.; Pennings, B.; Karr, U.; Schönbauer, B.; Schuller, R.; Tran, M.-D.; Mayer, H. Influence of cycling frequency and testing volume on the VHCF properties of 18Ni maraging steel. Eng. Fract. Mech. 2019, 216, 106525. [Google Scholar] [CrossRef]
  50. Giertler, A.; Krupp, U. Investigation of Fatigue Damage of Tempered Martensitic Steel during High Cycle Fatigue and Very High Cycle Fatigue Loading Using In Situ Monitoring by Scanning Electron Microscope and High-Resolution Thermography. Steel Res. Int. 2021, 92, 2100268. [Google Scholar] [CrossRef]
  51. Tridello, A.; Niutta, C.B.; Berto, F.; Paolino, D.S. Size-effect in Very High Cycle Fatigue: A review. Int. J. Fatigue 2021, 153, 106462. [Google Scholar] [CrossRef]
  52. Murakami, Y.; Takahashi, T. Torsional fatigue of a medium carbon steel containing an initial small surface crack introduced by tension-compression fatigue: Crack branching, non-propagation and fatigue limit. Fatigue Fract. Engng. Mater. Struct. 1998, 21, 1473–1484. [Google Scholar] [CrossRef]
  53. Endo, M.; Iseda, K. Prediction of the fatigue strength of nodular cast irons under combined loading. Int. J. Mod. Phys. B 2006, 20, 3817–3823. [Google Scholar] [CrossRef]
  54. Murakami, Y.; Nomotomo, T.; Ueda, T.; Murakami, Y. On the mechanism of fatigue failure in the superlong life regime (>107 cycles). Part I: Influence of hydrogen trapped by inclusions. Fatigue Fract. Engng. Mater. Struct. 2000, 23, 893–902. [Google Scholar] [CrossRef]
  55. Sakai, T.; Sato, Y.; Oguma, N. Characteristic S-N properties of high-carbon-chromium-bearing steel under axial loading in long-life fatigue. Fatigue Fract. Engng. Mater. Struct. 2002, 25, 765–773. [Google Scholar] [CrossRef]
  56. Beretta, S.; Murakami, Y. SIF and threshold for small cracks at small notches under torsion. Fatigue Fract. Engng. Mater. Struct. 2000, 23, 97–104. [Google Scholar] [CrossRef]
  57. Makkonen, L.; Rabb, R.; Tikanmäki, M. Size effect in fatigue based on the extreme value distribution of defects. Mater. Sci. Eng. A 2014, 594, 68–71. [Google Scholar] [CrossRef]
  58. Schönbauer, B.M.; Ghosh, S.; Kömi, J.; Frondelius, T.; Mayer, H. Influence of small defects and nonmetallic inclusions on the high and very high cycle fatigue strength of an ultrahigh-strength steel. Fatigue Fract. Eng. Mater. Struct. 2021, 44, 2990–3007. [Google Scholar] [CrossRef]
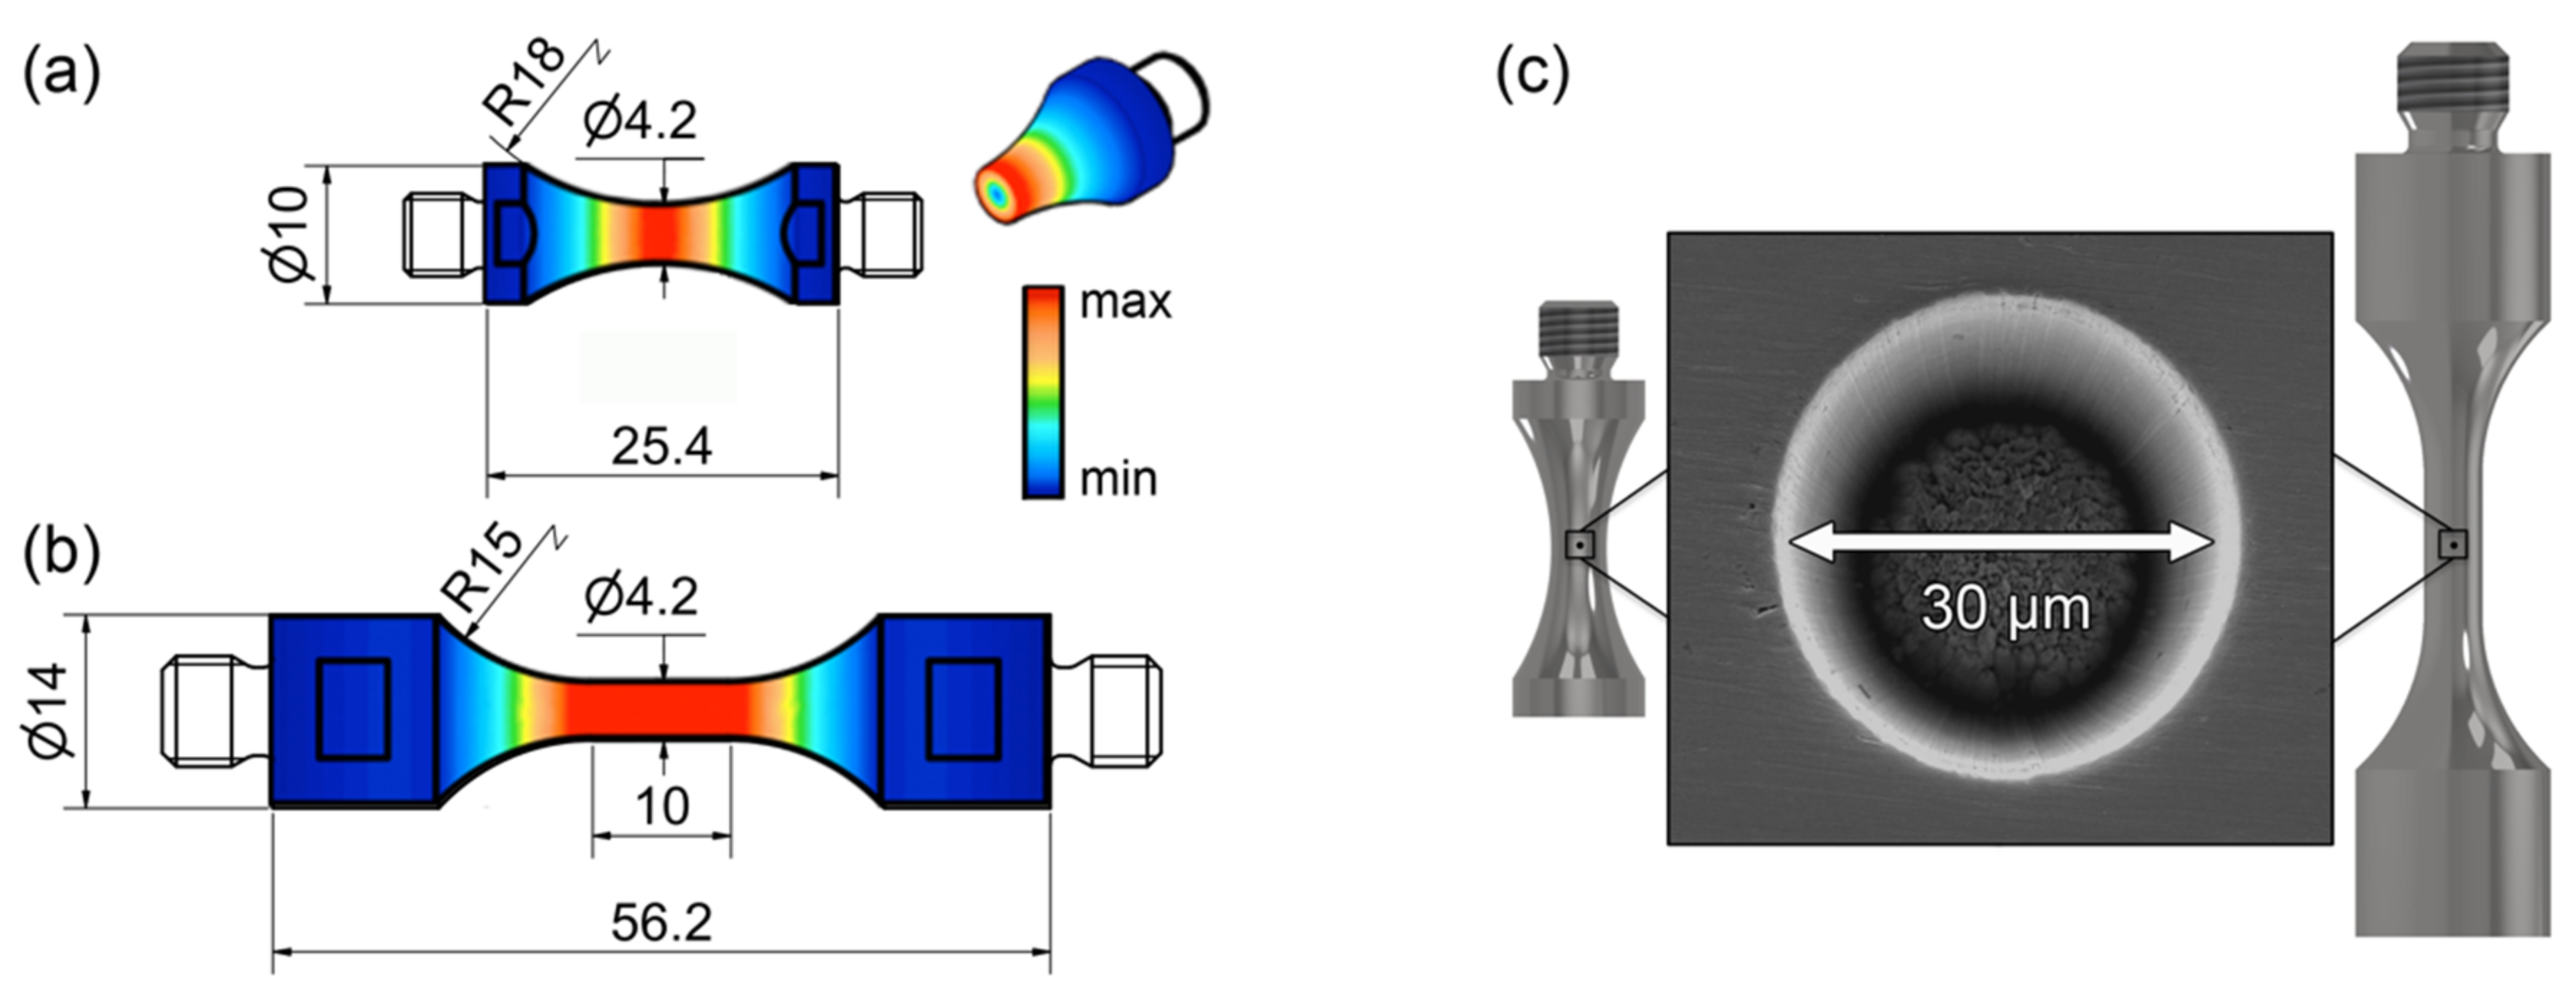
Figure 1. Specimen shapes: for ultrasonic torsion (a) and axial (b) fatigue tests at different R-ratios (dimensions are in mm); (c) for ultrasonic fatigue crack growth rate measurements under fully reversed axial and torsion loading, featuring an artificial defect introduced by Ar+-milling.
Metals 12 01113 g001
Figure 2. Fatigue data for cyclic axial loading (a) and cyclic torsion loading (b) at a load ratio of R = −1 (black symbols), R = 0.1 (blue symbols) and R = 0.35 (red symbols); surface crack initiation and internal crack initiation at aluminate, TiN or MnS inclusions or in the metal matrix are distinguished using different symbols; circles with arrows mark runout specimens.
Metals 12 01113 g002
Figure 3. Crack initiation at inclusions under axial VHCF loading: (a) aluminate inclusion, σa = 450 MPa, R = 0.1, Nf = 2.8 × 10⁹ cycles; (b) TiN inclusion, σa = 375 MPa, R = 0.35, Nf = 2.2 × 10⁸ cycles; Crack initiation at inclusions under torsion VHCF loading: (c) aluminate inclusion, τa,nom = 479 MPa, R = 0.1, Nf = 3.7 × 10⁹ cycles; (d) MnS inclusion, τa,nom = 600 MPa, R = −1, N = 5.1 × 10⁹ cycles (runout), retested at τa,nom = 450 MPa, R = 0.1, Nf = 2.3 × 10⁸ cycles.
Metals 12 01113 g003
Figure 4. Crack growth rates in vacuum for axial and torsion ultrasonic fatigue loading at R = −1; specimens were cycled at constant axial or torsion stress amplitudes until fracture; cracks start at artificial surface defects featuring the indicated size; crack growth rates are presented vs. mode I stress intensity factor amplitudes, Ka; data measured in air [37] are shown for comparison.
Metals 12 01113 g004
Figure 5. Evaluation of the exponents αa and αt that consider the R-ratio dependency of internal inclusion-initiated fracture under axial loading (a) and torsion loading (b); failures (closed symbols) and runouts (open symbols) are shown vs. the ratio of stress amplitudes, σa and σ w = 1.56 · ( H V + 120 ) ( a r e a ) 1 / 6 (a) and the ratio of shear stress amplitudes at crack initiation, τa,loc and τ w = 0.86 · 1.56 · ( H V + 120 ) ( a r e a ) 1 / 6 (b); data points for aluminate and MnS inclusion-initiated fracture under cyclic torsion at R = 0.1 and 0.35 have been intentionally set apart for better visibility.
Metals 12 01113 g005
Figure 6. Normalized S-N data for internal inclusion-initiated fracture obtained under cyclic axial and torsion loading; ratios of stress amplitudes, σa and predicted cyclic strengths,   σ w = 1.56 · ( H V + 120 ) ( a r e a ) 1 / 6 · 1 R 2 0.41 (a) and ratios of shear stress amplitudes at crack initiation, τa,loc, and predicted shear strengths, τ w = 0.86 · 1.56 · ( H V + 120 ) ( a r e a ) 1 / 6 · 1 R 2 0.55 (b) are plotted against fatigue lifetimes; symbols are distinguished by crack initiation site and load ratio; data of runout specimens are shown with open symbols.
Metals 12 01113 g006
Figure 7. Kitagawa–Takahashi diagrams for axial loading (a) and torsion loading (b) and limiting lifetimes of 5 × 10⁹ cycles; stress amplitudes are multiplied with 1 R 2 0.41 and 1 R 2 0.55 to eliminate the influence of load ratio. Solid and open symbols mark failed and runout specimens, respectively.
Metals 12 01113 g007
Figure 8. Extreme value distributions of aluminate inclusion size for axial and torsion loading. Dotted lines mark the median inclusion sizes of 26 µm and 18 µm observed in axial (black) and torsion (red) specimens, respectively. The expected median inclusion size for torsion specimens (V = 9 mm3, T = 1.09) of 13 µm predicted from axial specimens (V0 = 108 mm3) is marked with a red dashed line.
Metals 12 01113 g008
Figure 9. Fracture modes effective under axial ((a,c)) and torsion ((b,d)) loading dependent on inclusion type; (a,b): aluminate inclusion; (c,d): MnS inclusion.
Metals 12 01113 g009
Table 1. Chemical composition of SWOSC-V.
CSiMnCrAlFe
0.551.500.700.700.003balance
Table 2. Mechanical properties of the investigated material.
Yield Strength (MPa)Tensile Strength (MPa)Elongation (%)Shear Yield Strength (MPa)Shear Strength (MPa)Vickers Hardness (HV)
172019101014001550530
Table 3. Minimum and maximum sizes, a r e a , of crack initiating inclusions under axial and torsion loading with respect to inclusion type and R-ratio. All values are given in µm.
R = −1R = 0.1R = 0.35
MinMaxMinMaxMinMax
Axial:
Aluminate17.061.612.454.615.527.6
Torsion:
Aluminate 10.228.213.824.0
MnS 9.524.513.521.2
MnS (runouts)8.815.47.414.49.720.0
Publisher’s Note: MDPI stays neutral with regard to jurisdictional claims in published maps and institutional affiliations.