Article

The Characteristics of Spiral Pipe Increasing Resistance and Reducing Pressure and the Amendment Equation of Stowing Gradient

1
BGRIMM Technology Group, Beijing 102628, China
2
National Centre for International Research on Green Metal Mining, Beijing 102628, China
3
Department of Safety Engineering, Qingdao University of Technology, Qingdao 266106, China
4
Technical Support Center for Prevention and Control of Disastrous Accidents in Metal Smelting, University of Science and Technology Beijing, Beijing 100083, China
5
CCCC Water Transportation Consultants Co., Ltd., Beijing 100007, China
*
Authors to whom correspondence should be addressed.
Metals 2022, 12(7), 1105; https://doi.org/10.3390/met12071105
Submission received: 30 April 2022 / Revised: 14 June 2022 / Accepted: 23 June 2022 / Published: 28 June 2022
(This article belongs to the Special Issue Green Low-Carbon Technology for Metalliferous Minerals)

Abstract

:
To solve the high slurry pressure and severe wear at some sections in backfilling pipelines, this study investigates the solution of using an auxiliary pipe to increase the resistance and reduce the pressure of the mine backfilling pipeline. Using computational fluid dynamics, three auxiliary pipe models, a Z-shaped pipe, a S-shaped pipe and a spiral pipe were constructed and the velocity and pressure distribution characteristics of the filling slurry in the auxiliary pipes were analyzed. The function of friction loss in spiral pipes with different pitches and spiral diameters was established, and the amendment equation for calculating the effective stowing gradient was studied when using spiral pipes to increase resistance and reduce pressure. The results show that, compared with the Z-shaped pipe and the S-shaped pipe, the velocity and pressure in the spiral pipe change continuously and steadily, and there is no obvious sudden change in the local velocity and pressure. Therefore, it is difficult to burst the pipe. When the velocity is 2.5 m/s and the vertical height of the pipe is 2.5 m, the friction loss of the filling slurry in the spiral pipe can reach 3.87~21.26 times that in the vertical pipe, indicating that the spiral pipe can effectively play the role of increasing resistance and reducing pressure. The relationship between the friction loss and spiral diameter is a linear function, and the relationship between the friction loss and pitch is a quadratic function. The three are binary quadratic function relationships. The equation for calculating the effective stowing gradient is obtained, which provides a convenient method for engineering applications and industrial design.

1. Introduction

With the increasing depletion of shallow resources, the mining of deep resources has increased at home and abroad [1]. The number of mines over 1000 m is increasing both in China and in other countries [2,3]. Coal mining is already performed at depths greater than 1500 m in China, whereas metal ores are mined at 4350 m [4]. For the reasons of mine safety [5], environmental protection [6,7], deep sustainable mining and national carbon-neutral targets [8,9], backfilling is playing an increasingly important role in mining [10,11,12], and it has been widely used worldwide [13,14,15,16]. Due to the increase in the vertical depth of the backfilling pipe in deep mining, the stowing gradient decreases, which requires effective solutions to the problems of high pressure and severe wear of the pipe [17,18,19]. Currently, researchers adopt the following methods to reduce the pressure and wear of the slurry on the pipeline [20,21,22,23,24,25,26]: reducing the erosion effect of the filling slurry on the pipeline, using the full pipe flow conveying system in the vertical pipeline, using the depressurization conveying system, decreasing the conveying speed of the slurry, changing the properties of the paste by adding binder content, and using neutral water to prepare the filling slurry and flush the pipeline. However, there are few studies on reducing pressure and pipeline wear from the perspective of pipeline structure design. In addressing the problem, this study proposes the method of using an auxiliary pipe to increase resistance and reduce pressure; that is, to add one or more auxiliary pipes at the appropriate position of the vertical backfilling pipe to increase resistance and reduce pressure to decrease the high pressure of the filling slurry in the backfilling pipe, reduce the wear of the local pipe and simultaneously accomplish realize the continuous transportation of the filling slurry.
Computational fluid dynamics (CFD) approximately converts the continuity equation, momentum equation, energy equation and the integral and differential terms in the constitutive equation in fluid mechanics into discrete algebraic forms so that they can be changed into algebraic equations. CFD then uses the algebraic computing ability of the computer to solve the discrete algebraic equations to obtain the numerical solutions of discrete physical quantities such as pressure and velocity at time and space points [27]. CFD Fluent software is currently a relatively popular large-scale commercial software worldwide. It is used to simulate complex flows from incompressible to highly compressible flows. It has rich physical models, advanced numerical fitting methods, powerful processing capacity and physical models confirmed by engineering. Because Fluent adopts a variety of solution methods and multigrid accelerated convergence technology, it can achieve the best convergence speed and solution accuracy. It is widely used in the mine filling pipeline simulation filed all over the world. Kaushal et al. [28] used Ansys Fluent software to analyze the concentration distribution and pressure drop in pipeline flows with high concentrations of fine particles. Nagar et al. [29] conducted CFD simulations for the predication of pressure drop and concentration profiles for better understating of 25 µm fly ash particles mixed with water in the form of solid–liquid slurry in 50 mm pipe diameter with efflux concentrations in the range of 33–47 percent by volume at different flow velocities as 1–3 m/s. Movahedi et al. [30] brought experimental and CFD simulation of slurry flow in the annular flow path using two-fluid model to predict solid–liquid multiphase flow under different flow conditions including static, laminar and turbulence. Zambrano et al. [31] used a three-dimensional, algebraic slip mixture (ASM) model of the CFD software FLUENT 6.3 to obtain the numerical solutions for investigating the pressure-driven slurry flow of heavy oil in a horizontal pipe. Liu et al. [32] employed a CFD method to investigate the flow characteristics of the cemented paste backfill slurry with a mixture model and represent the multi-phase characteristics of pipe flow. Therefore, CFD can be used to study the effect of increasing the resistance and reducing the pressure of different types of auxiliary pipes.
In order to solve the high slurry pressure and severe wear of some sections in the backfilling pipeline, this paper investigates the solution of using an auxiliary pipe to increase the resistance and reduce the pressure of the mine backfilling pipeline by applying computational fluid dynamics to study the flow characteristics of filling slurry in the auxiliary pipe. First, three types of auxiliary pipes, namely the Z-shaped pipe, the S-shaped pipe and the spiral pipe, were designed, and the dimensions of the auxiliary pipes were determined according to the actual conditions in the mine to allow for easy installation. Their computational models were drawn. To verify the feasibility of the CFD method and the matching of simulation parameters, an L-shaped pipe model was established. The reliability of the model and parameters was verified by comparing the similarity between the theoretical and simulated results of pressure loss. Next, the viscosity, density, yield stress and other parameters of the filling slurry were confirmed through laboratory experiments, and the velocity and pressure distribution characteristics of the filling slurry in the three types of auxiliary pipes were simulated using CFD. Then, the friction loss of the filling slurry in spiral pipes with different sizes was calculated, and the functional relationship between friction loss and pitch and spiral diameter was obtained. Finally, the amendment equation for calculating the effective stowing gradient was proposed when using the auxiliary pipes to increase resistance and reduce pressure. This study provides a convenient method for the design of backfilling pipes in engineering applications.

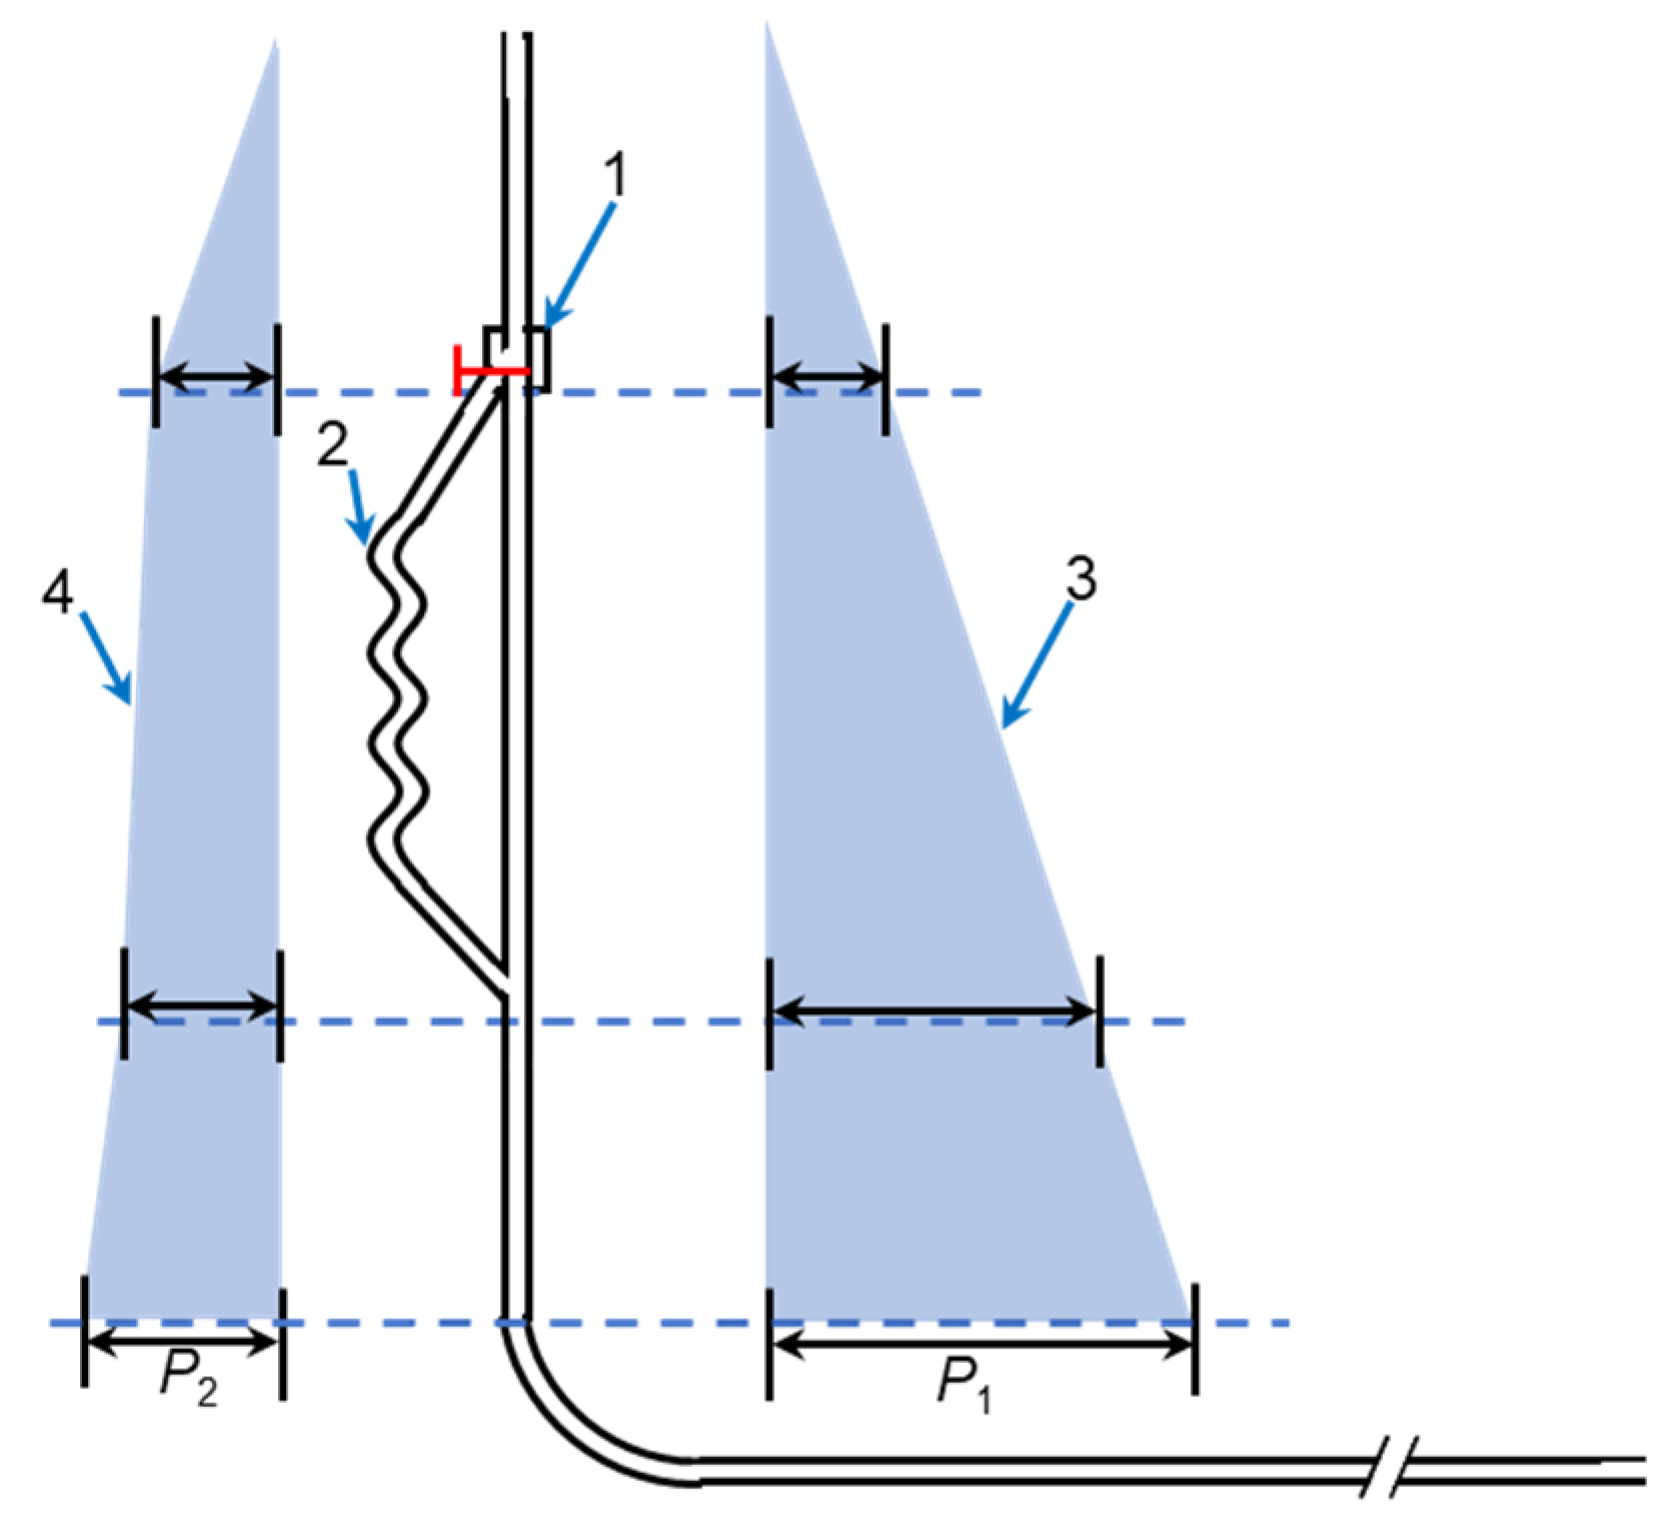
2. Principle of the Increasing Resistance and Reducing Pressure of Auxiliary Pipe

In the backfilling mining method, the cementing material, water and aggregate are evenly mixed in the surface mixing station to form a uniform filling slurry with a solid mass fraction of approximately 60~80%. The filling slurry is transported to the underground goaf by means of gravity or pumping and is hardened for a period of time to form a solid cemented filling body [33,34]. This method can provide support for the rock mass around the goaf, prevent the collapse of the rock mass around the goaf, effectively manage the pressure in the rock mass and improve the safety of underground mining [6,13,35].
In engineering, the friction loss of filling slurry in pipeline transportation directly affects or even determines many core issues, such as whether the filling slurry can be transported by self-flow, the construction of the backfilling system, the selection of equipment (especially pumps) and the layout of the pipeline network [36].
Due to the filling slurry viscosity and the influence of pipe wall roughness, when fluid motion occurs, friction will be produced between the fluid and pipe wall and among fluid particles [37,38], which is called frictional resistance. The energy loss caused by the moving fluid overcoming the frictional resistance along the pipe is called the friction loss. Its calculation equation is shown in Equation (1).
P f = λ l D v 2 2 g γ
where Pf is the friction loss; λ is the resistance coefficient along the pipe, 0.036, which is related to the roughness of the pipe; l represents the pipe length in m; D is pipe inner diameter in m; v represents the velocity of fluid in m/s; g is the acceleration of gravity, 9.81 m/s2; and γ is the bulk density of filling slurry in N/m3.
According to Equation (1), the friction loss along the process is proportional to the resistance coefficient, the length and the velocity.
The auxiliary pipe is installed in the vertical pipe section, as shown in Figure 1, and the specific position is adjusted according to the pipe arrangement and pressure distribution in the mine. When the slurry is transported along the pipeline, due to the friction between the slurry particles and the pipe wall and the viscosity of the slurry itself, the slurry will rub against the pipe wall, resulting in energy loss. Therefore, when the backfilling system does not use the auxiliary pipe, the slurry is directly transported along the L-shaped pipe. The energy loss in the vertical section is small, and the slurry pressure is large when it reaches the bottom. When the auxiliary pipe is used, the slurry will be transported along the auxiliary pipe. As the path becomes longer and the friction loss increases, the energy loss of the slurry increases, and the pressure of the slurry when it reaches the bottom is small, which can increase resistance and reduce pressure. In practice, the auxiliary pipe can be connected with the main pipe through the program-controlled electric valve. When the vertical height of the pipe is too large and the stowing gradient is too small, the auxiliary pipe is activated to increase the resistance of the filling slurry, reduce the velocity and pressure of the filling slurry when the filling slurry reaches the bottom of the vertical pipe and relieve wear at the pipe elbow. When the horizontal pipe is long and the stowing gradient is large, the auxiliary pipe is not activated, so that the filling slurry keeps its original transport energy to avoid a blocked pipe.

3. Numerical Simulation Methods

The mechanical properties of the filling slurry and the complexity of the backfilling pipe system make it impossible to solve the backfilling pipe transport problem accurately using CFD. Therefore, the numerical simulation model needs to be simplified [39,40], i.e., it is assumed that the filling slurry does not undergo phase change during transport and maintains a homogeneous full pipe flow. The effects of mining and temperature on filling slurry transport are not considered during the calculation.

3.1. Mathematical Model and Control Equations

3.1.1. Model Selection

In this study, the mixture multiphase flow model and standard k-e turbulence model in Fluent were used to calculate the along-travel friction loss in the flow field and analyze the flow velocity and pressure variation characteristics of the filling slurry.

3.1.2. Boundary Conditions

The Z-axis negative direction was set as the gravitational acceleration direction with a magnitude of 9.81 m/s, and the boundary conditions for each type of pipe were the velocity inlet and pressure outlet.

3.1.3. Control Equations

(1) Continuity equation
t ( k = 1 n α k ρ k ) + ( k = 1 n α k ρ k ν k ) = 0
where α k is the volume fraction of the kth phase; ρ k is the density of the kth phase in kg/m3; ν k is the average velocity of the kth phase in m/s; and t is time in s.
(2) Momentum equation
t ( k = 1 n α k ρ k ν k ) + ( k = 1 n α k ρ k ν k ν k ) = α k p + [ α k ( τ k + τ k ) ] + α k ρ k g + M k + ( F int ) k + S D
where p is pressure in Pa; τ k is molecular dynamics in N/m2; τ k is turbulent stress in N/m3; M k is interphase momentum transfer per unit volume in N/m3; ( F int ) k is intrinsic force in N/m3; g is the gravity acceleration in m/s2; and SD is momentum source term in N/m3.

3.2. Geometric Modeling and Parameter Setting

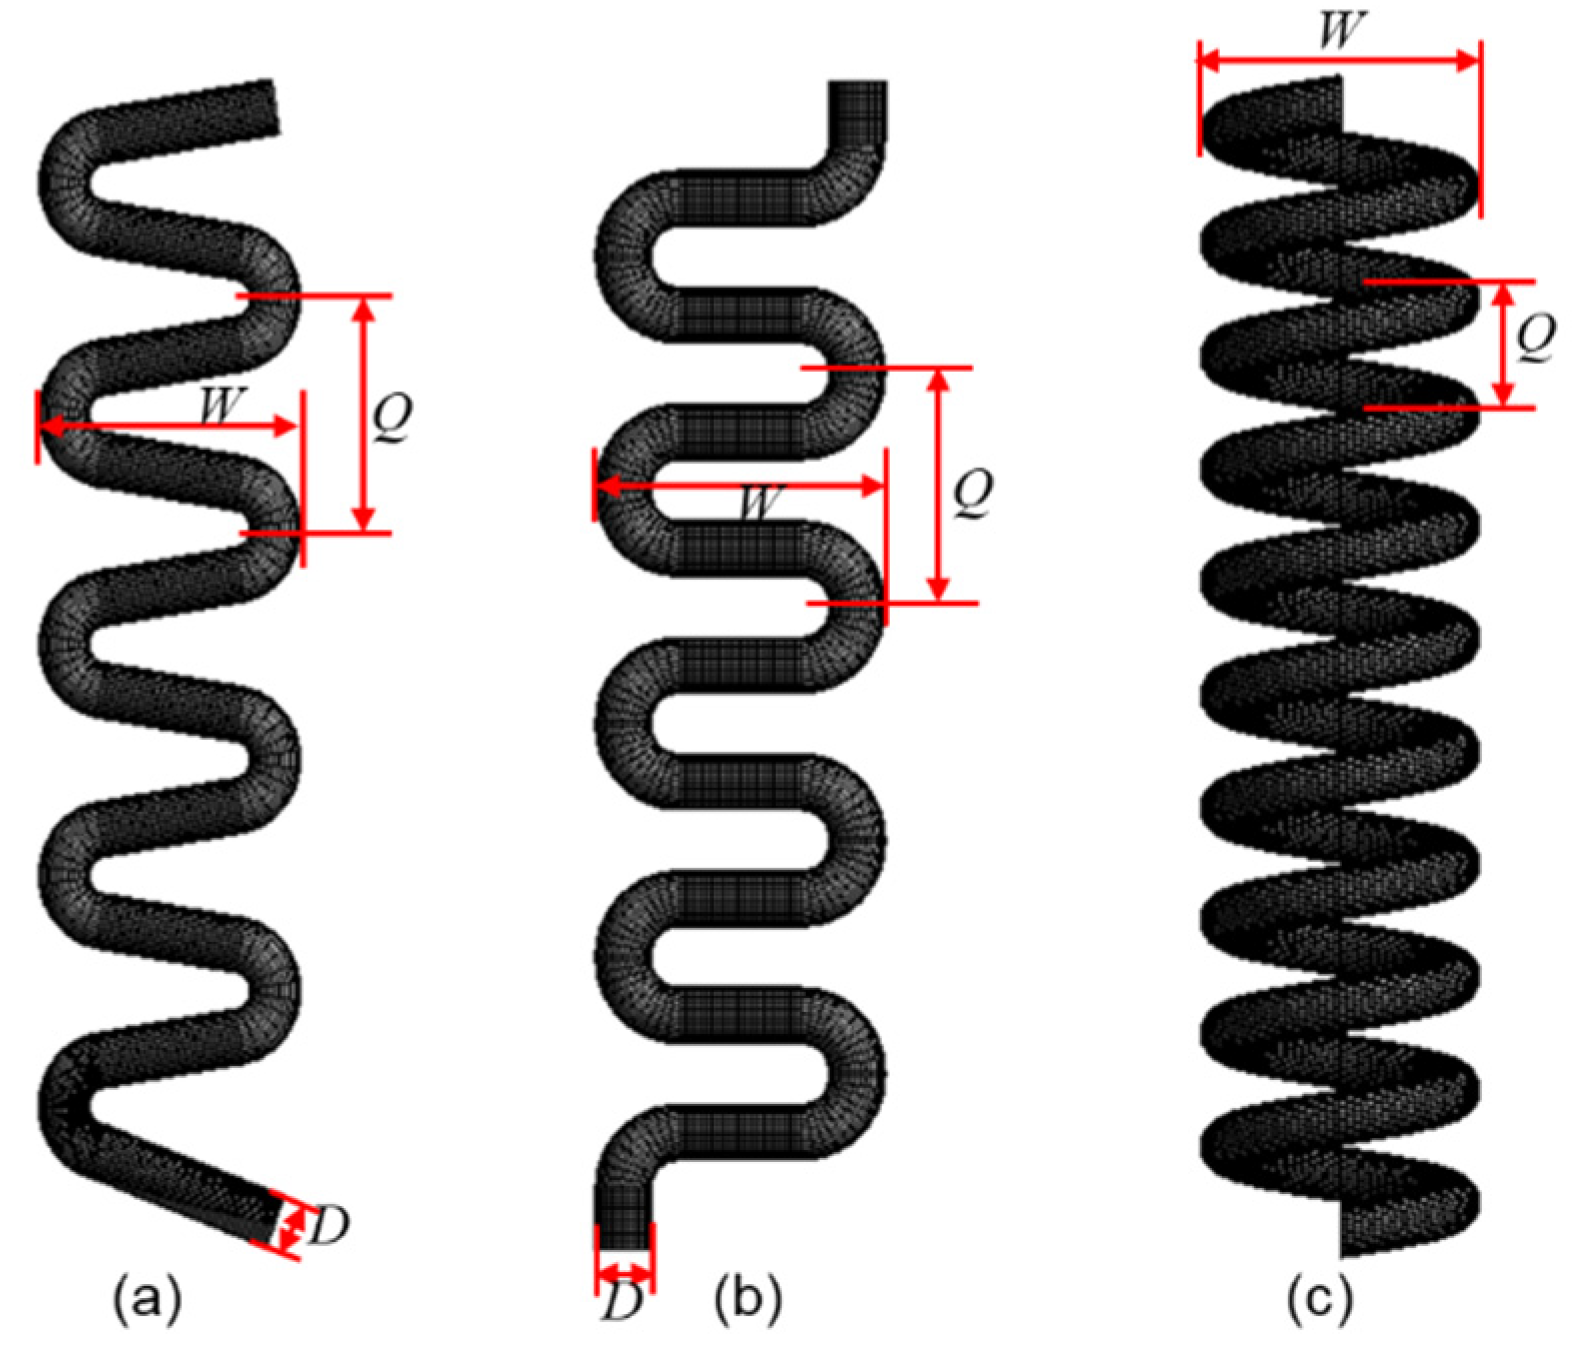
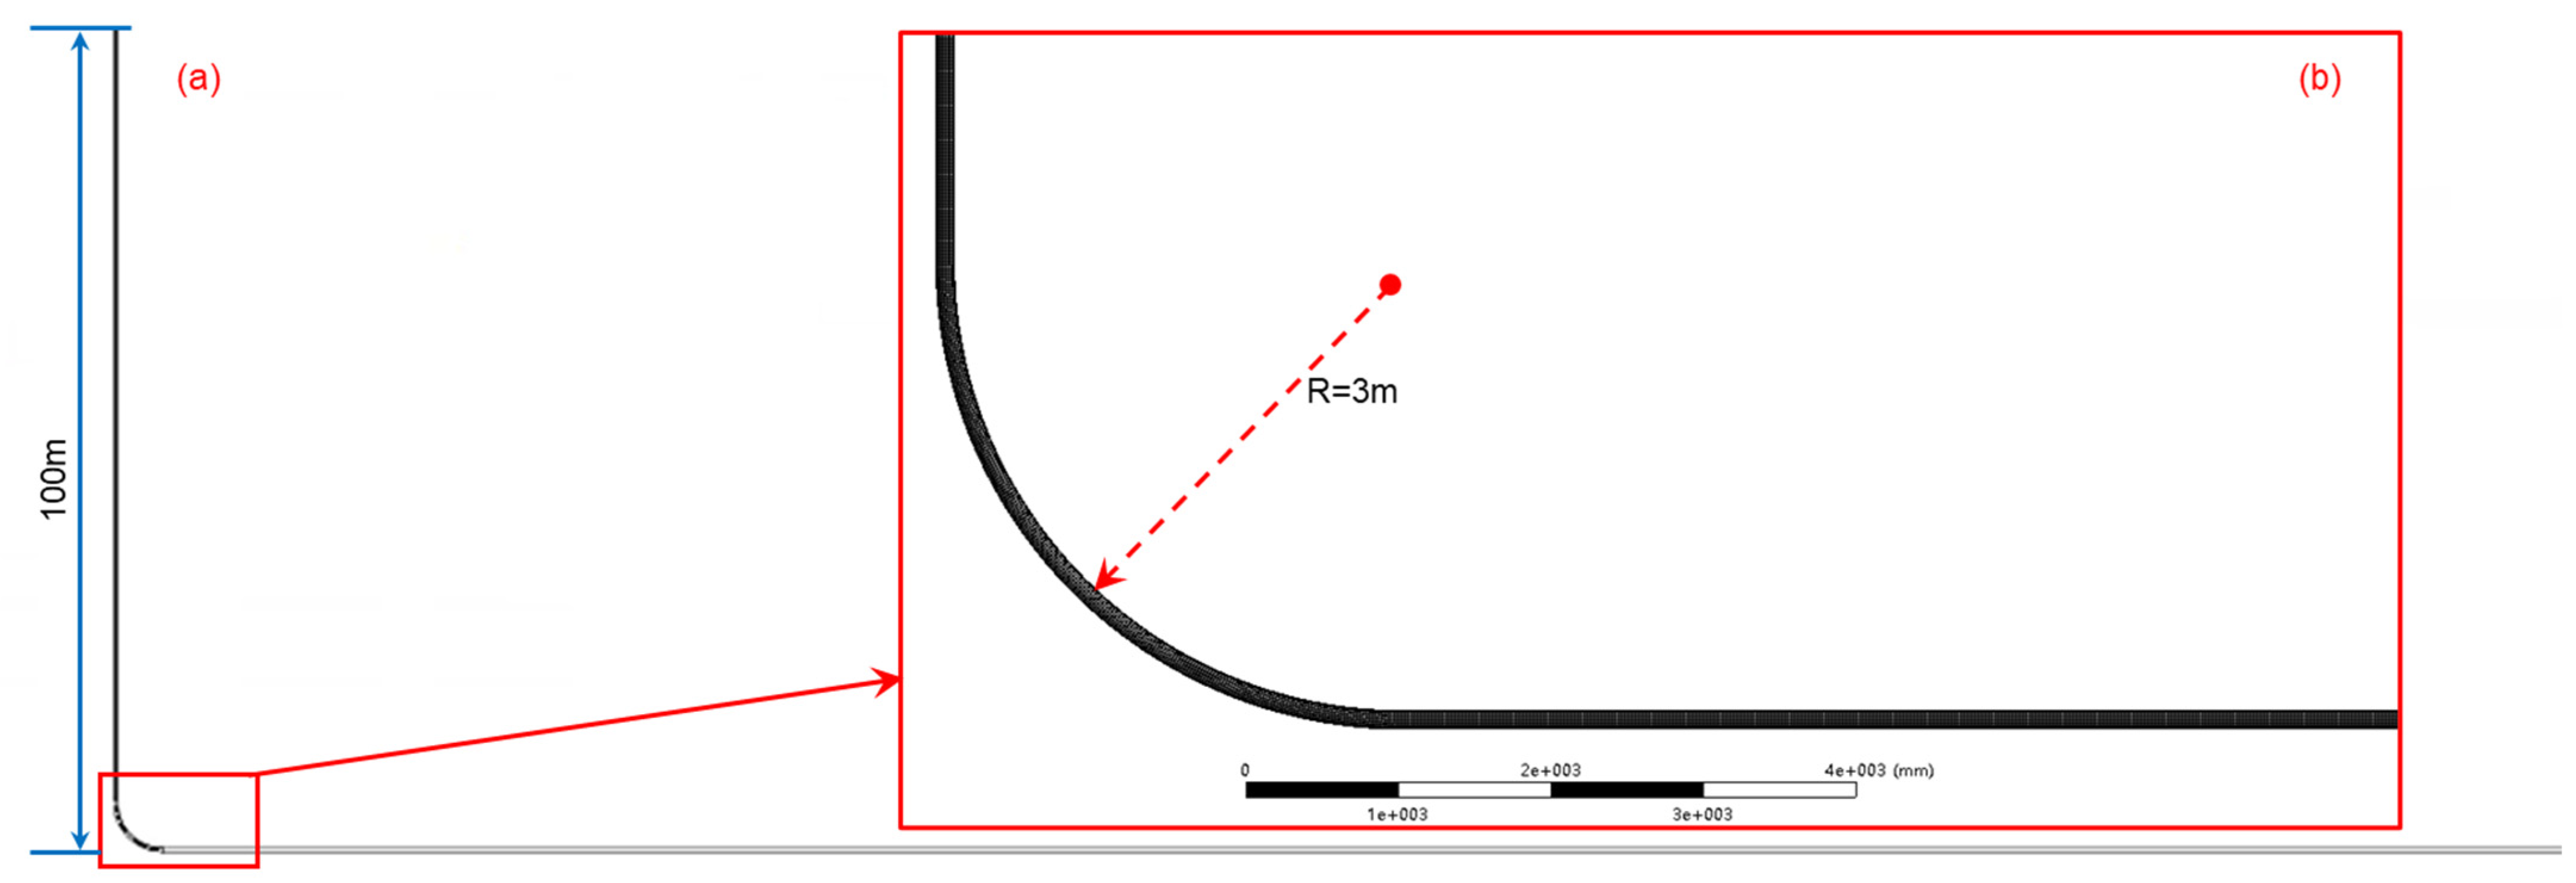
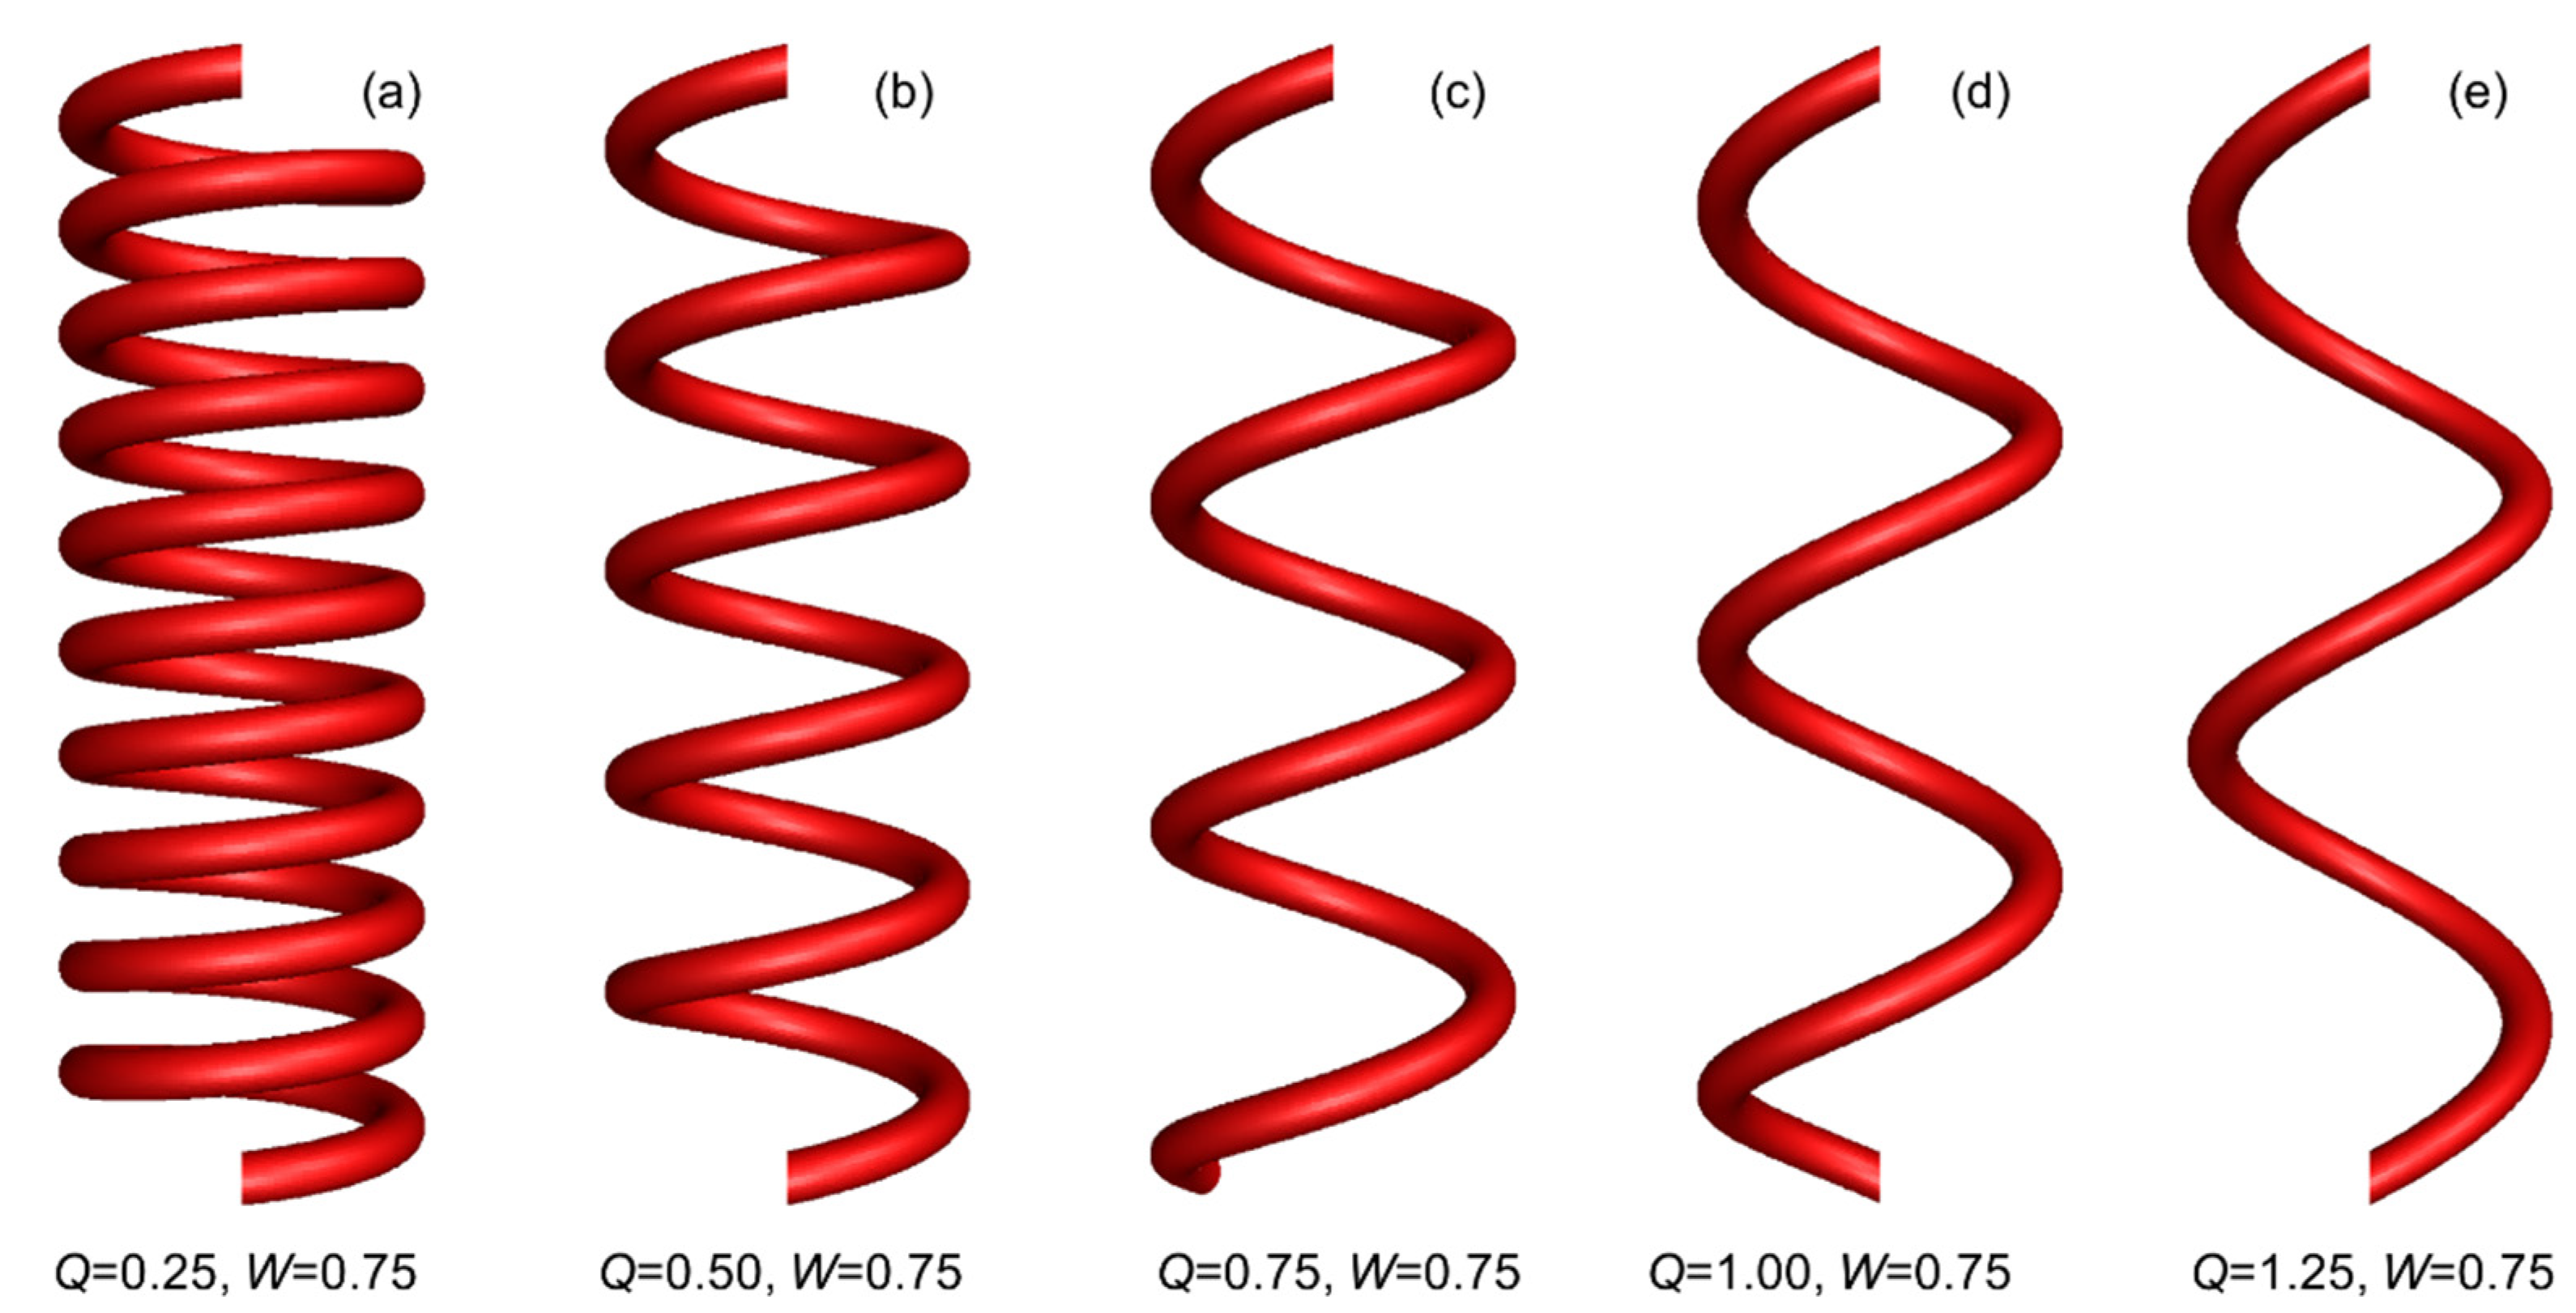
3.2.1. Geometric Modeling

The three types of auxiliary pipe models, namely the Z-shaped pipe, the S-shaped pipe and the spiral pipe, were designed as shown in Figure 2, in which Q indicates the pitch, W represents the spiral diameter and D expresses the pipe inner diameter, which is 0.12 m. The height h of the pipe model is 2.5 m. Additionally, 25 dimensional parameters were designed for each of the three types of pipes, as shown in Table 1.
To verify the feasibility of the CFD method and the matching of simulation parameters, an L-shaped pipe model was established. The specific parameters were vertical pipe height of 100 m, horizontal pipe length of 300 m, pipe inner diameter of 0.12 m, elbow of 90° and radius of curvature of 3 m, as shown in Figure 3.

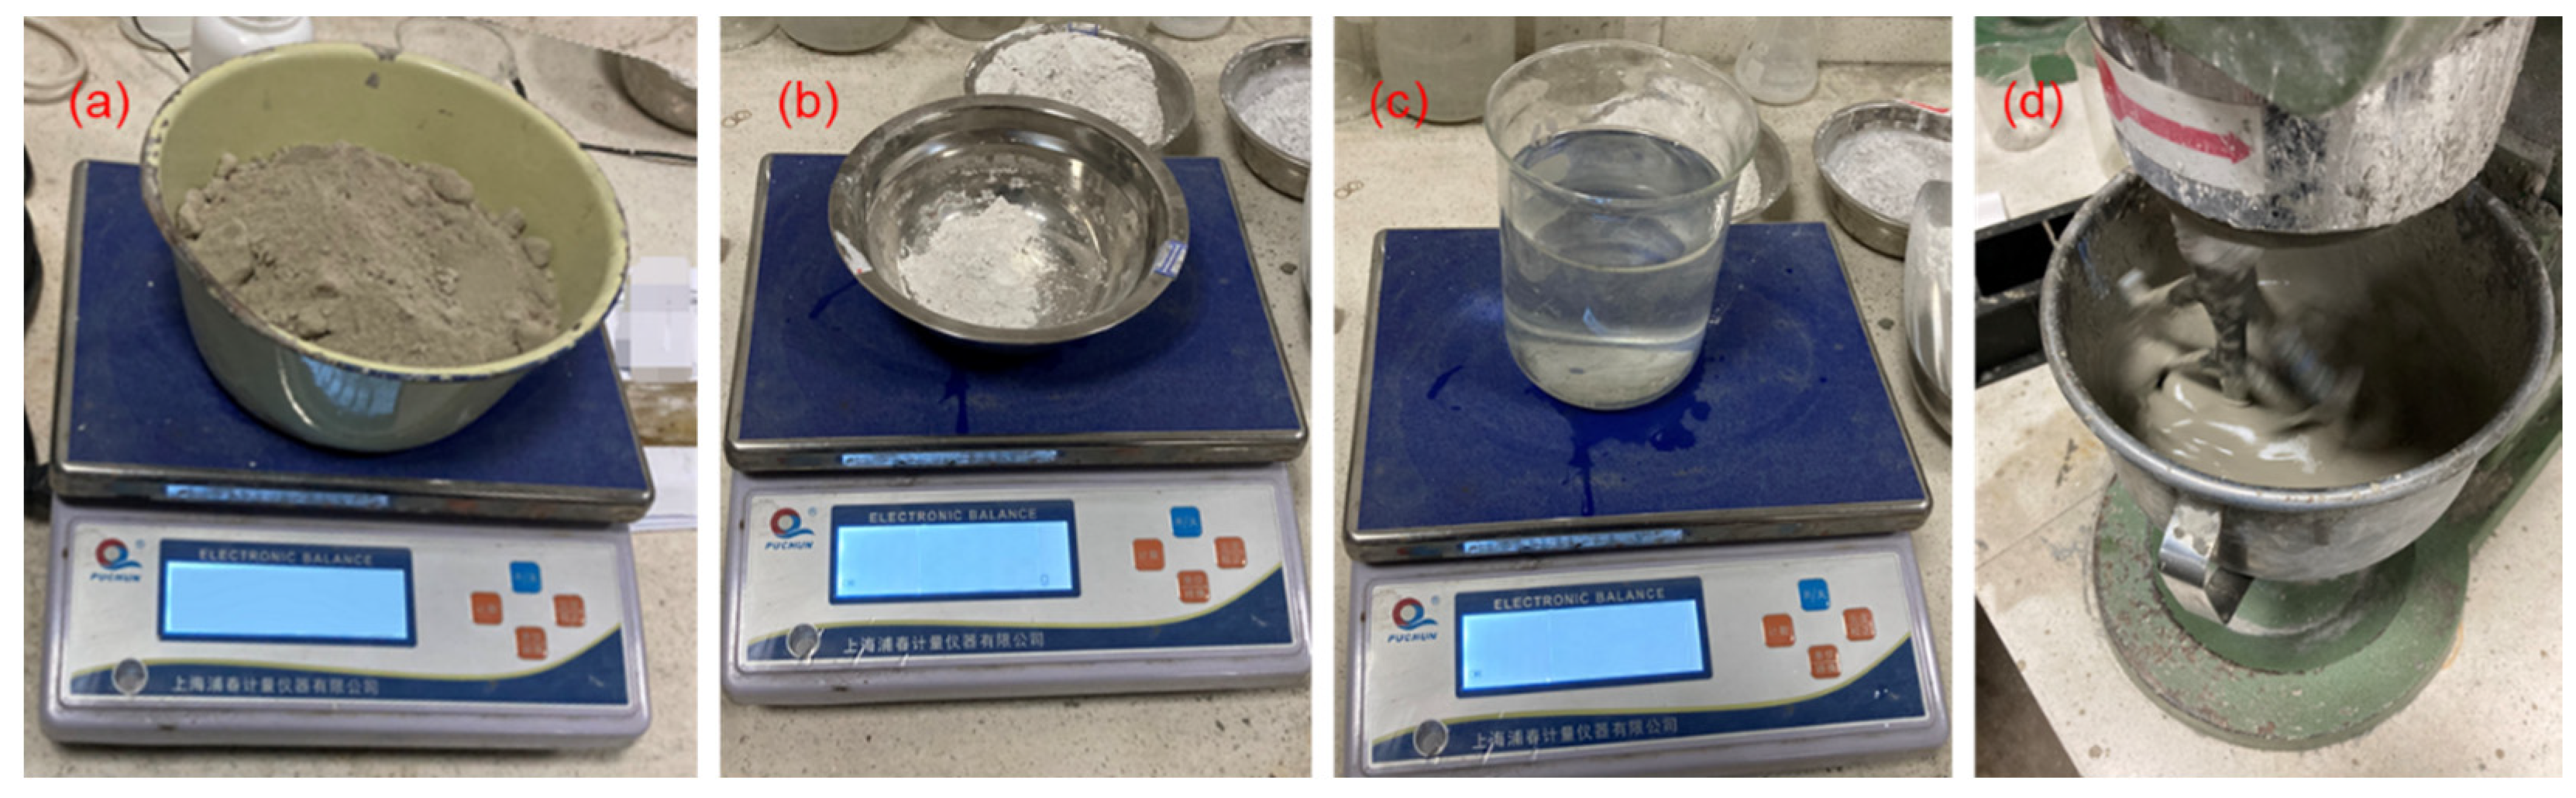
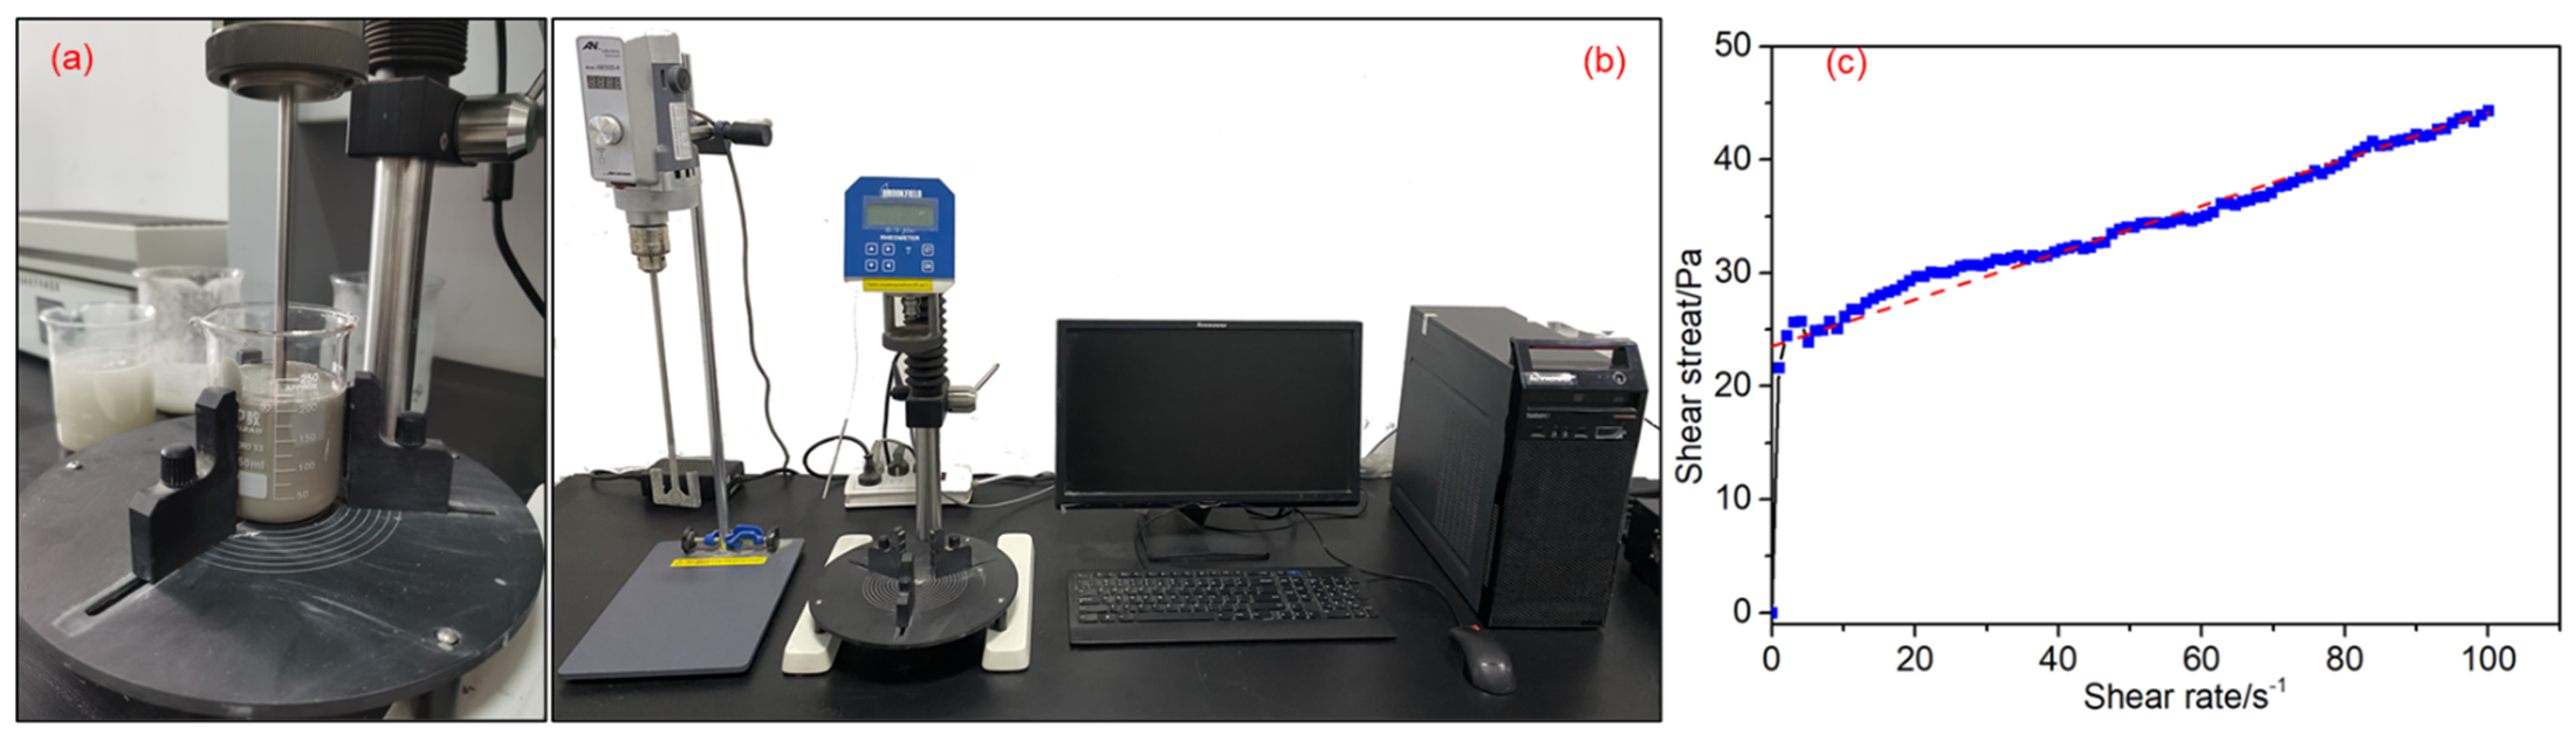
3.2.2. Determination of Filling Slurry Parameters

A gold mine filling slurry in Shandong Province was studied. The filling slurry with a concentration of 72% (wt) was selected for simulation calculations. The same filling slurry sample was prepared in the laboratory using the concentration of filling slurry and the aggregate-to-cement ratio found in the industrial field. The preparation process of the filling slurry sample is shown in Figure 4, and the composition of tailings is shown in Table 2. The prepared filling slurry sample is shown in Figure 5a, and its rheological parameters were tested by a Brookfield R/S Plus rheometer (shown in Figure 5b). The results are shown in Figure 5c.
The regression equation of the slurry rheological curve is shown in Equation (4) [41].
τ 0 = 0.207 η + 23.53
where τ0 is the shear stress in Pa and η is the viscosity coefficient of the filling slurry.
Therefore, the yield stress τ is 23.53 Pa and η is 0.207 Pa·s. The filling slurry density ρ is 1700 kg/m3, which was obtained by weighing 1 L of filling slurry. A 2.5 m/s velocity of the filling slurry in the pipe was selected. The Reynolds number of the filling slurry in the pipe is calculated using Equation (5) as Re = 2463.77 > 2300, and the flow state is judged to be the transition state.
Re = ρ ν D η
where ρ is the fluid density in kg/m3; υ is the flow velocity in m/s; η is the viscosity coefficient in Pa·s; and D is the pipe inner diameter in m.

3.2.3. Reliability Verification of the Model and Parameters

The reliability of the model and parameters was verified by comparing the similarity ξ between the theoretical and simulated results of pressure loss.
First, the L-shaped pipe model was input into Fluent, and then the physical parameters of the filling slurry were brought into the Fluent solver. After iterative calculation, convergence was achieved, and the pressure difference Pm between the inlet and outlet was obtained as 669,320 Pa.
The total pressure loss of the filling slurry in the pipeline is calculated by Equation (6) [42,43,44].
P w = P f + P j
where Pw is the total pressure loss; Pf is the friction loss along the path; and Pj is the local pressure loss.
Pf is calculated according to Equation (1), and Pj is calculated by Equation (7).
P j = ζ v 2 2 g γ
where ζ is the local resistance coefficient, 1.2; v represents the velocity of the fluid in m/s; g is the acceleration of gravity in m/s2; and γ is the bulk density of the filling slurry in N/m3.
The similarity ξ between the theoretical and simulated results of pressure loss can be calculated by Equation (8).
ξ = P w P m × 100 %
The total pressure loss of the filling slurry in the pipeline Pw = 643,875 Pa, which was obtained via theoretical calculation. The similarity ξ is 96.2%, which meets the requirements of numerical simulation; that is, the model and parameters are suitable for this study.

4. Results and Analysis

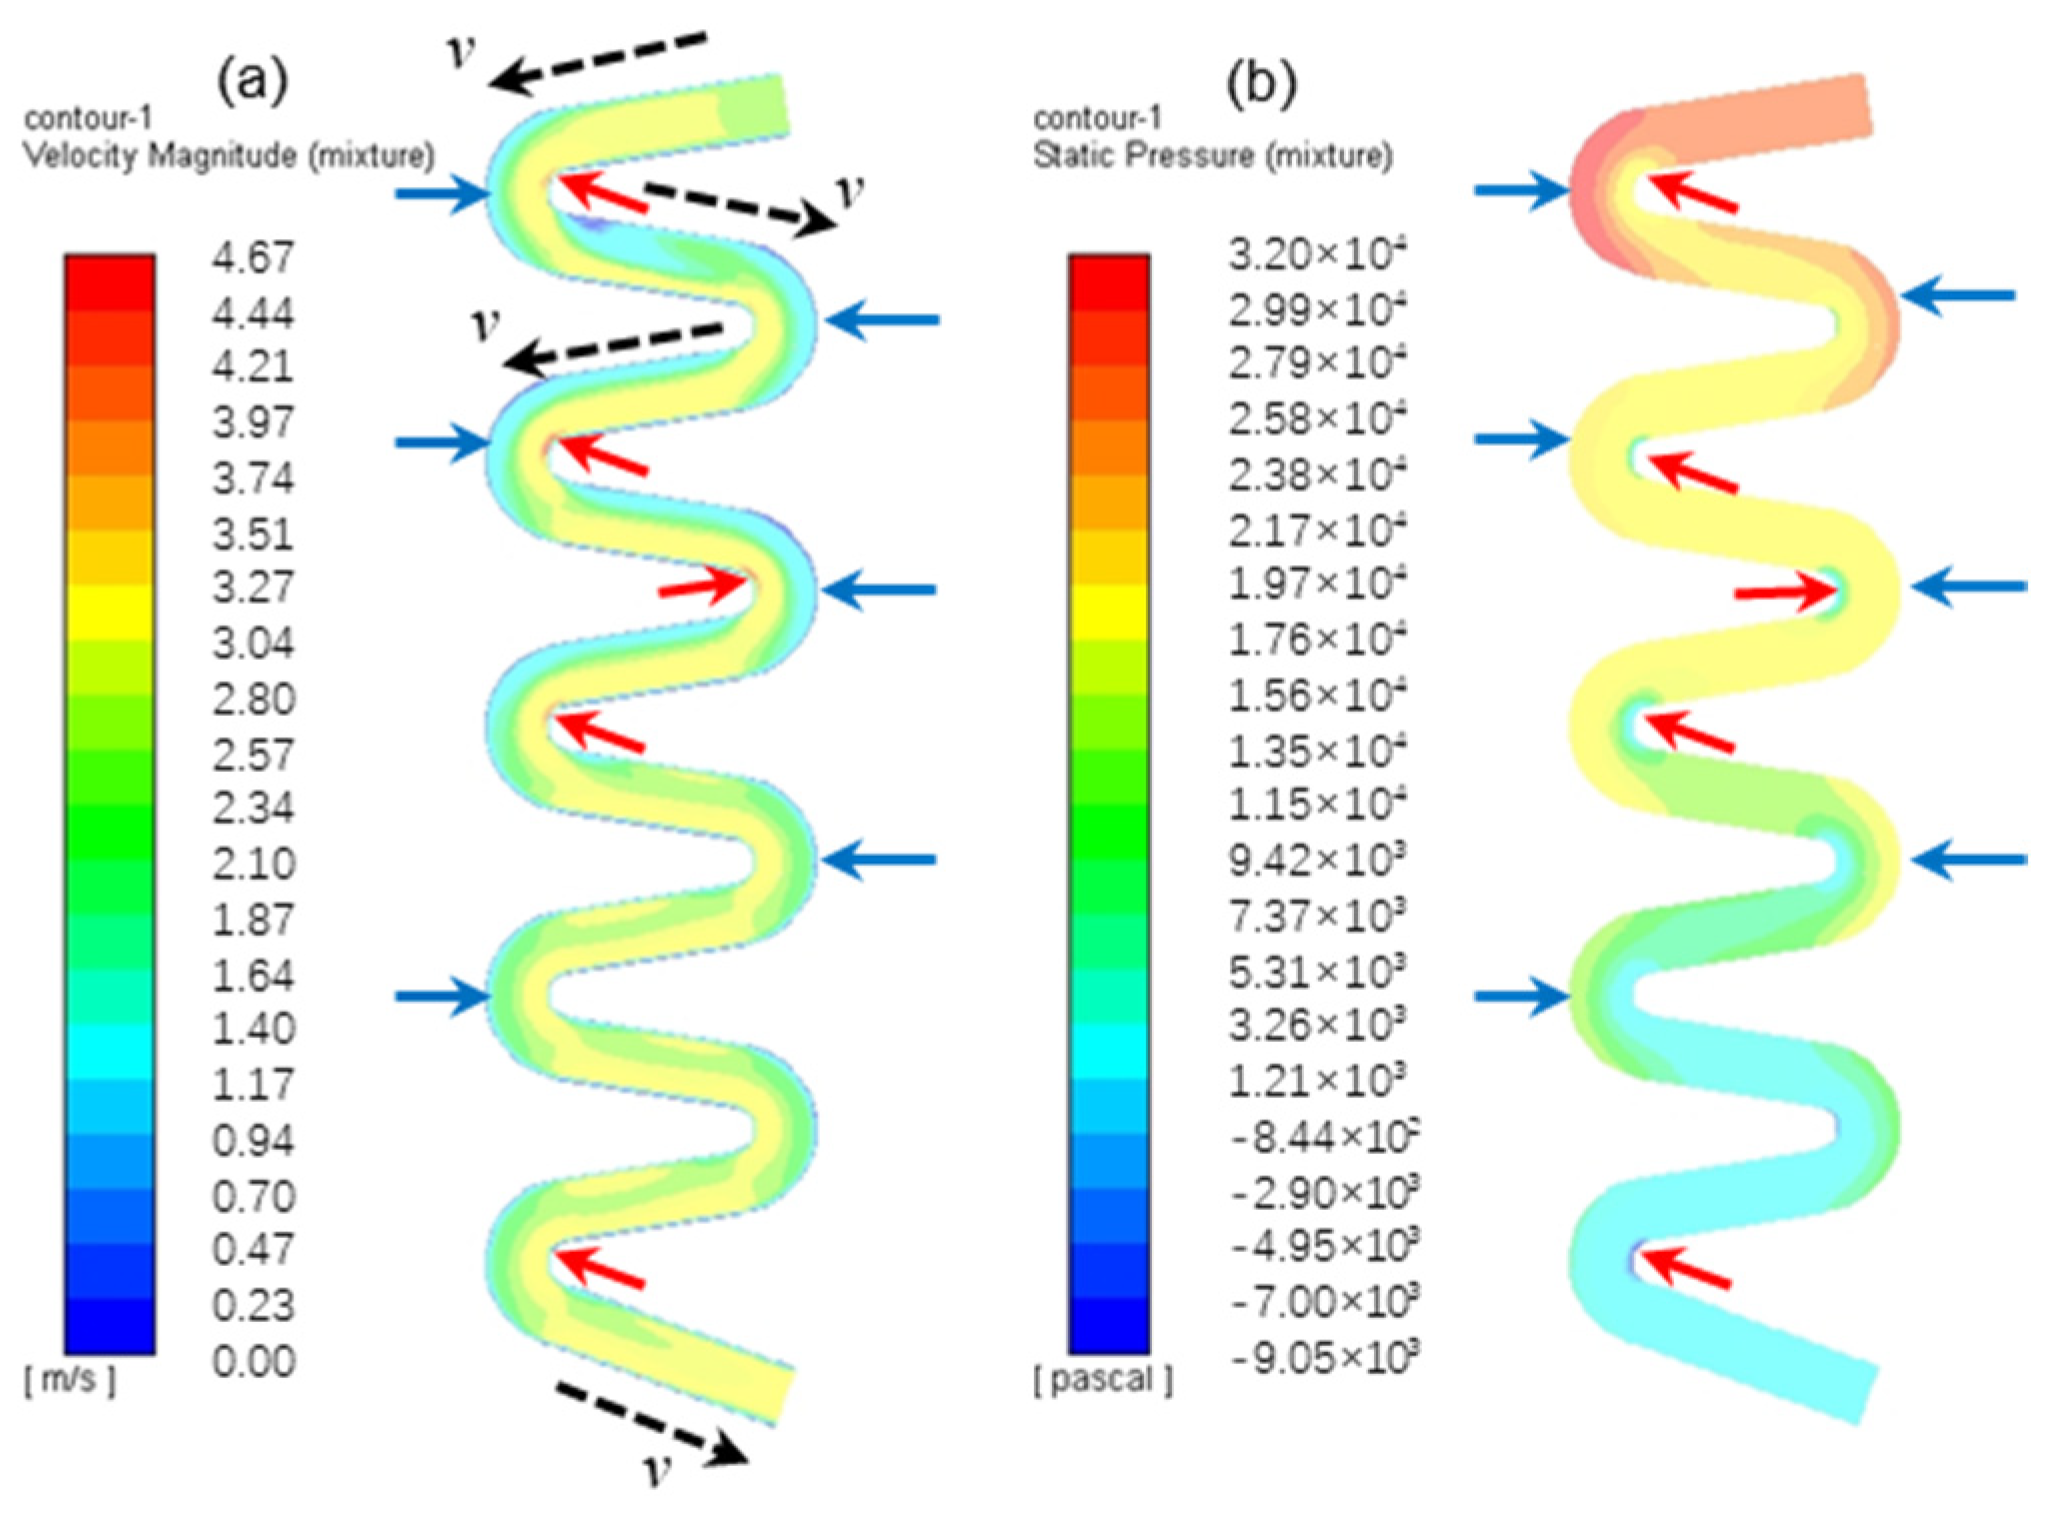
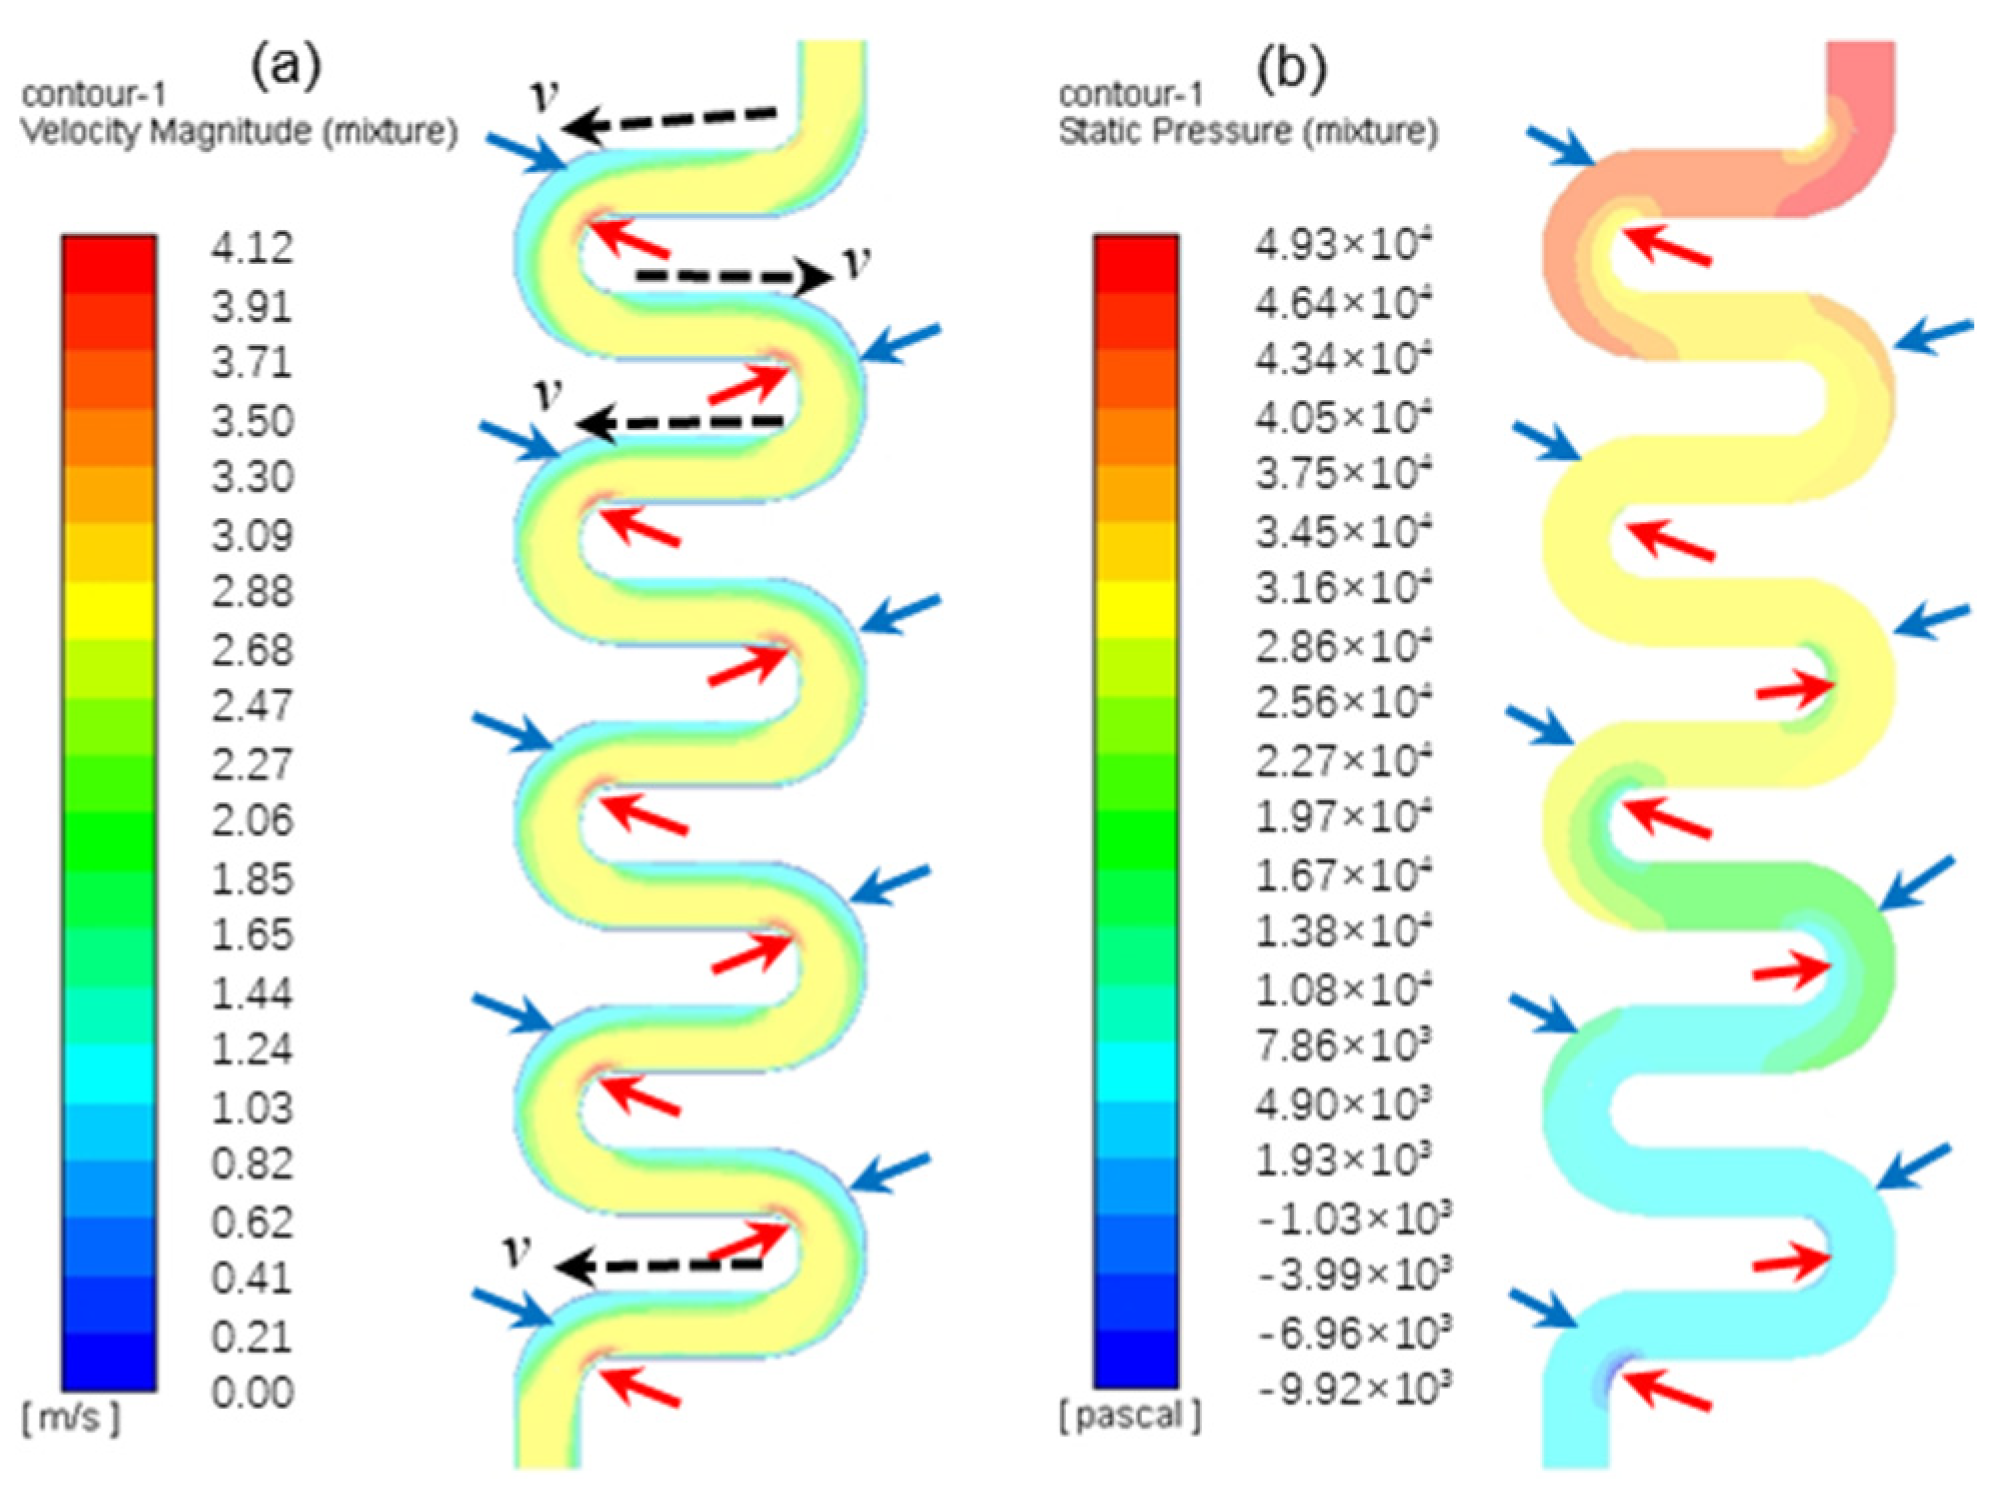
4.1. Velocity and Pressure Fields of the Filling Slurry in the Auxiliary Pipe

Three types of auxiliary pipes were established with Q = W = 0.5 m, D = 0.12 m and h = 2.5 m, and the velocity and pressure fields of the filling slurry were obtained, as shown in Figure 6, Figure 7 and Figure 8.
Figure 6 shows that, for the Z-shaped pipe, the velocity of the filling slurry in the outer Z-shaped pipe is small (as shown by the blue arrow in Figure 6a), and the velocity of the filling slurry in the inner Z-shaped pipe is large (as shown by the red arrow in Figure 6a). At the point shown by the red arrow, there is a sudden increase in velocity, where the velocity of the filling slurry oscillates and the movement direction changes drastically, as shown by the black arrow in the figure. Therefore, the filling slurry energy varies dramatically, and the pipe is liable to burst, while the pressure characteristics of the filling slurry are opposite to the velocity characteristics, that is, the pressure of the filling slurry in the outer Z-shaped pipe is large (as shown by the blue arrow in Figure 6b), the pressure of the filling slurry in the inner Z-shaped pipe is small (as shown by the red arrow in Figure 6b). At the point shown by the red arrow, there is a sudden drop in pressure, where the pipe absorbs the energy of the filling slurry and the local pressure difference is large, so the pipe is liable to burst [45]. This feature is consistent with the results shown in the velocity field. In addition, the more filling slurry that is transported to the lower part of the pipe, the lower the pressure, indicating that the auxiliary pipe has a better effect of increasing resistance and reducing pressure. The characteristics of the S-shaped pipe velocity and pressure fields in Figure 7 are consistent with the characteristics expressed in Figure 6 and will not be repeated here.
Figure 8 clearly shows that the velocity of the filling slurry in the outer spiral pipe is large (as shown by the blue arrow in Figure 8a) and the velocity of the filling slurry in the inner spiral pipe is small (as shown by the red arrow in Figure 8a). There is no obvious velocity change. The pressure characteristics of the filling slurry are similar to the velocity characteristics, i.e., the pressure of the filling slurry in the outer spiral pipe is large (as shown by the blue arrow in Figure 8b) and the pressure of the filling slurry in the inner spiral pipe is small (as shown by the red arrow in Figure 8b). There is no abrupt pressure variation, indicating that the velocity and pressure of the filling slurry in the spiral pipe uniformly change, the impact of filling slurry transport on the pipe is small and the wear is small. Similarly, the further the filling slurry is transported into the lower part of the spiral pipe, the lower its pressure, indicating that the auxiliary pipe has a better effect of increasing resistance and reducing pressure.
Comparing the velocity and pressure fields in the three types of auxiliary pipes shows that the three types of pipes can ensure the continuous transport of filling slurry and achieve the purpose of increasing resistance and reducing pressure. However, the filling slurry velocity and pressure in the Z-shaped pipe and the S-shaped pipe are prone to local sudden changes, and the pipe is liable to burst. However, the spiral pipe slurry velocity and pressure change continuously and steadily, and there are no obvious sudden changes in local velocity and pressure, so it does not easily burst. Hence, in engineering applications, spiral pipes have more obvious advantages than Z-shaped and S-shaped pipes and should be used more often.
The simulation results show that the filling slurry velocity and pressure in the outer spiral pipe are greater than those in the inner spiral pipe, and the wear of the outer spiral pipe is relatively serious. In practical applications, the design and production of the outer spiral pipe need to carry out special treatment, and special materials can be thickened or added to enhance the wear resistance of the local spiral pipe [46,47], so that the pipe structure can maintain overall stability, increasing the service life of the pipe and reducing cost.

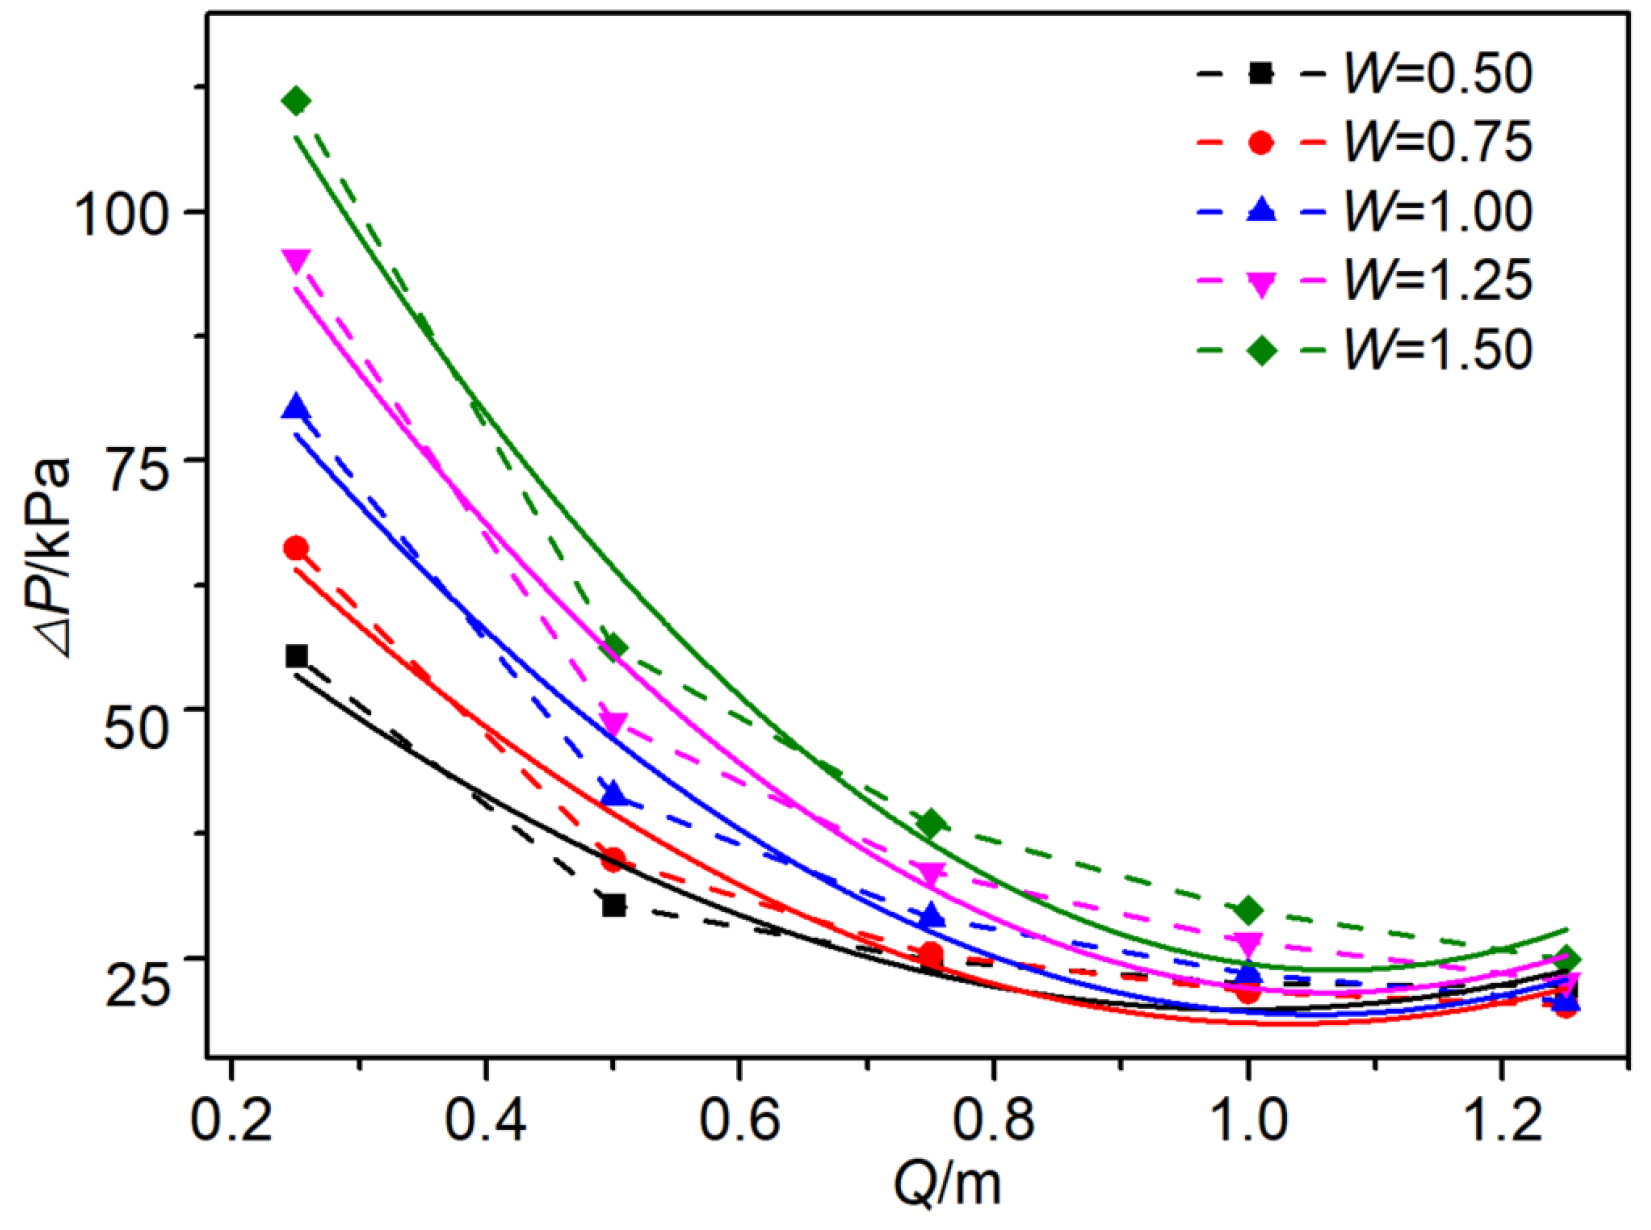
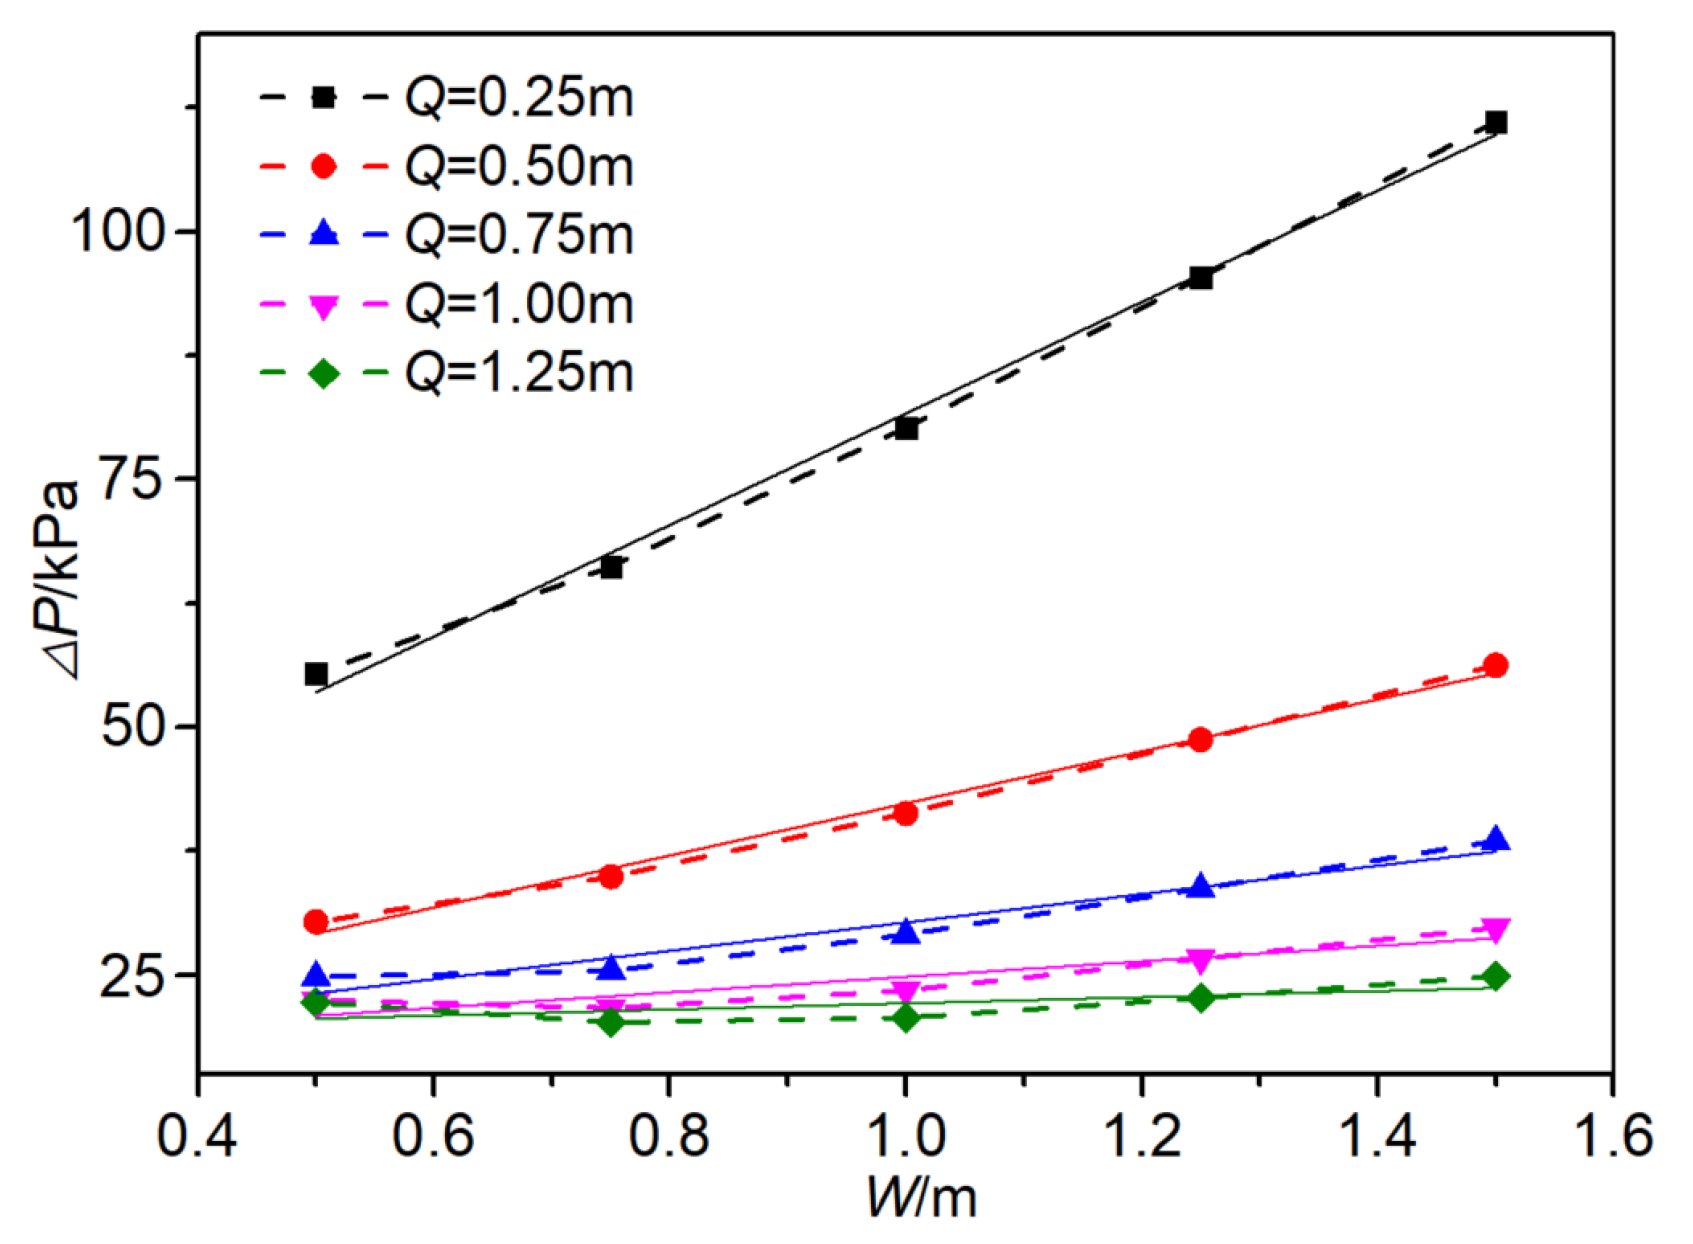
4.2. Characteristics of Friction Loss in Spiral Pipes with Different Sizes

The above study shows that spiral pipes are more suitable for engineering applications. Therefore, we only study the effect of increasing resistance and reducing pressure of spiral pipes here and calculate the friction loss (∆P) of filling slurry in 25 different sized spiral pipes (Figure 9 shows some spiral pipe models with the same height, spiral diameter and different pitch). The results are shown in Table 3. Through the simulation calculation, the friction loss at the center of the inlet and outlet of the vertical pipe with a height of 2.5 m is 5228 Pa at the same parameters of filling slurry. The ratio of friction loss generated by the spiral pipe to that generated by the vertical pipe at the same height is ω, which is shown in Table 4. When the velocity is 2.5 m/s and the vertical height of the pipe is 2.5 m, the friction loss of the spiral pipe can reach 3.87~21.26 times that of the vertical pipe, which indicates that the spiral pipe can effectively play the role of increasing resistance and reducing pressure.
Using data from Table 3, Figure 10 and Figure 11 are plotted. From Figure 10, when Q is a constant, ∆P increases with increasing W, and the relationship between the two is a linear function. The solid line in the figure is the linear fitting curve for each group of data, and the fitting degree R2 is above 0.9. From Figure 11, when W is a constant, ∆P decreases with increasing Q, and the relationship between the two is a monotonically decreasing quadratic function. The solid line in the figure is the corresponding quadratic function fitting curve for each group of data, and the fitting degree R2 is above 0.9. Therefore, to obtain a larger friction loss, a spiral pipe with small Q and large W should be chosen. W is limited by the actual shaft size in the mine, and there is a maximum value, which can be determined in combination with the actual engineering application.

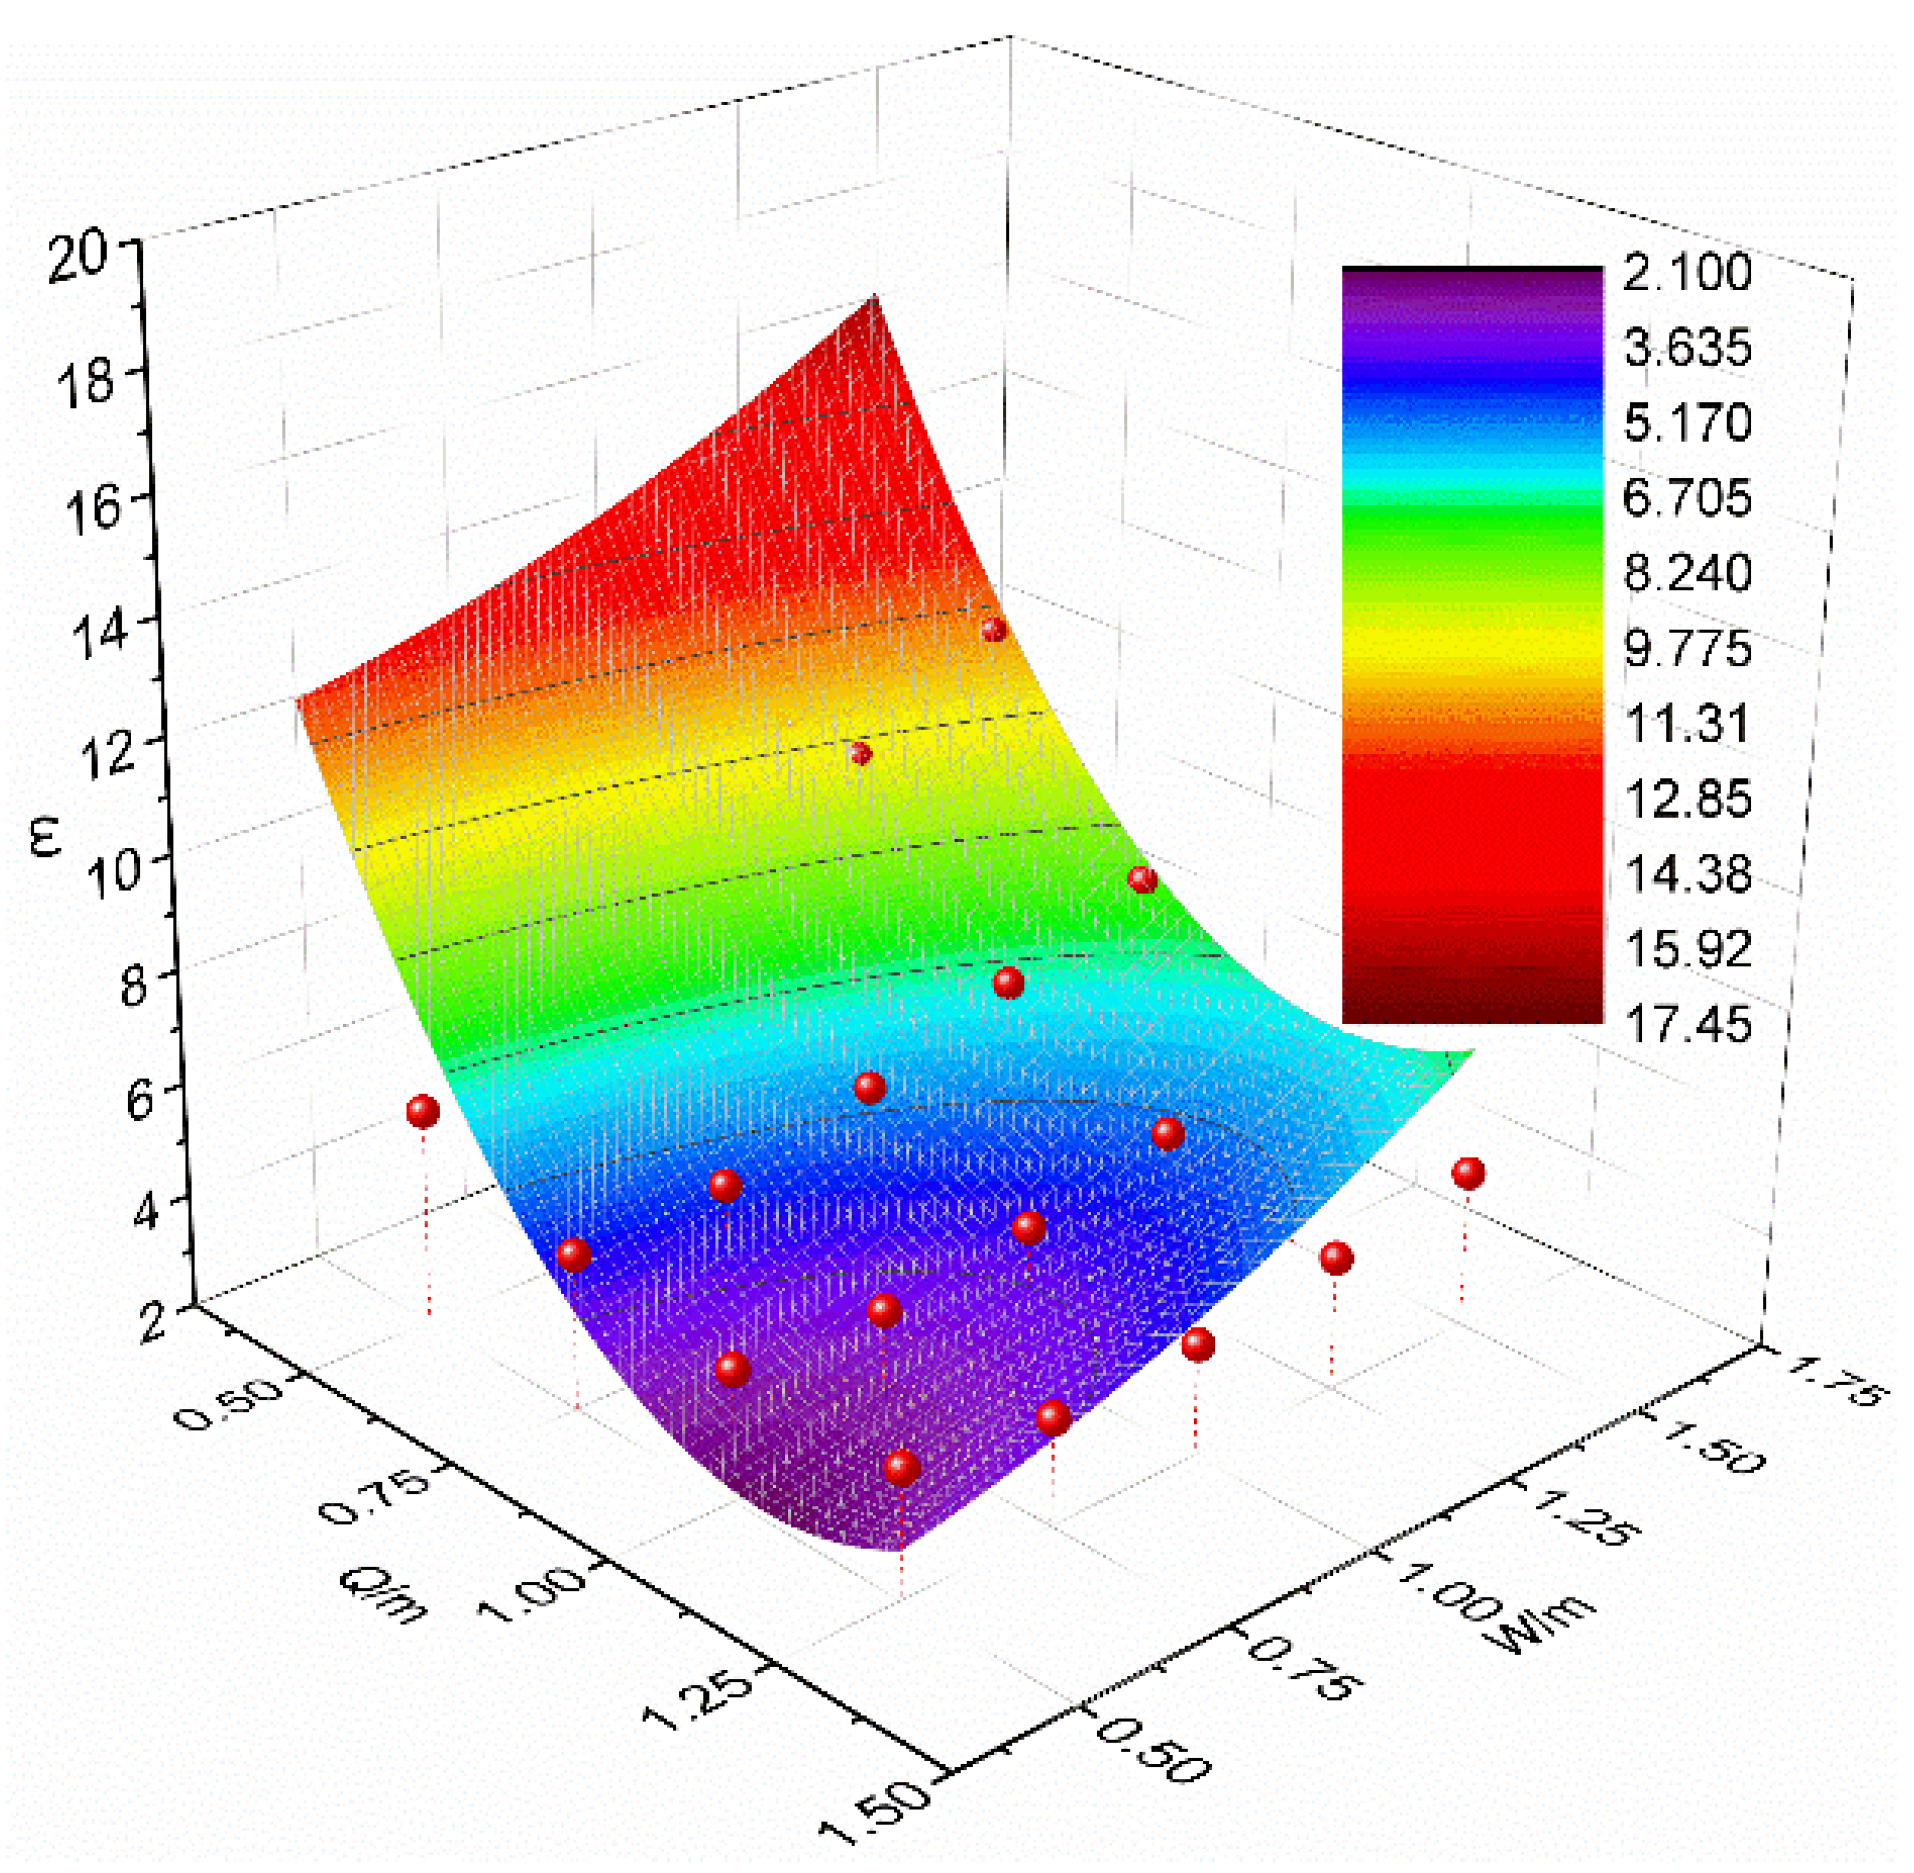
4.3. Amendment Equation of the Stowing Gradient

In the backfilling method, the stowing gradient is the most important parameter of the backfilling pipe system, which expresses the engineering characteristics of the mine backfilling pipe and is one of the key factors of whether the mine filling slurry can be transported by self-flow. The calculation equation of the stowing gradient is shown in Equation (9). Since ∆P along the pipe changes after the addition of a spiral pipe to the backfilling pipe, Equation (9) cannot accurately calculate the stowing gradient. Therefore, it is important to propose a calculation method for the effective stowing gradient when using spiral pipes to increase resistance and reduce pressure. The relevant calculation analysis will also become the basis of mine backfilling pipe design. We propose an amendment equation for calculating the stowing gradient based on the friction loss calculation results, which is shown in Equation (10).
N = L H
N = L + ( ω 1 ) h H
where N is the stowing gradient; N′ is the effective stowing gradient; H is the height difference between the starting point and ending point of the backfilling pipe; L is the total length of the backfilling pipe including the length of the elbows, joints and other fittings; and h is the total height of the spiral pipe.
Because ω is obtained by many simulation calculations, it is not intuitive in practice. To simplify Equation (10), a relationship between ω and Q and W needs to be established.
Figure 12 shows the three-dimensional coordinate of ω and Q and W. According to the above study, when W is a constant, the relationship between ω and Q is a monotonically decreasing quadratic relationship. Because it can determine the relationship between ω and Q and W, the binary quadratic function is chosen to fit the data for Figure 12. The results are shown in Figure 12, and the relationship between ω and Q and W is shown in Equation (11).
ω = 17.47 Q 2 + 2.03 W 2 36.66 Q + 0.06 W + 20.84
The fitting degree R2 of the equation in Figure 12 is 0.90. Bringing Equation (11) into Equation (10):
N = L + ( 17.47 Q 2 + 2.03 W 2 36.66 Q + 0.06 W + 19.84 ) h H
It can be seen from Equation (12) that when L, Q, W, h and H are known, the effective stowing gradient N′ can be found when spiral pipe is used to increase resistance and reduce pressure. Otherwise, when L, h and H are known, the relationship between N′ and Q and W can be found, and then suitable backfilling pipe parameters can be designed in combination with the actual industrial application.

5. Conclusions

In this study, the flow state of filling slurry in auxiliary pipes with different sizes was simulated using CFD, and the distribution characteristics of filling slurry velocity and pressure were analyzed. The relationship between friction loss along the pipe and spiral diameter and pitch was established, and the calculation equation of the stowing gradient was revised. The following conclusions were obtained.
(1)
The three types of pipes can achieve the purpose of increasing resistance and reducing pressure, but the velocity and pressure of filling slurry in spiral pipe change continuously and steadily, and there are no obvious sudden changes in local velocity and pressure, so it is difficult to burst. Hence, in engineering applications spiral pipes have more obvious advantages than Z-shaped and S-shaped pipes and should be used more often.
(2)
In practical applications, the design and production of the outer spiral pipe need to carry out special treatment, and special materials can be thickened or added to enhance the wear resistance of the local spiral pipe, so that the pipe structure can maintain overall stability, increasing the service life of the pipe, and reducing cost.
(3)
The relationship between ∆P and Q and W was obtained. ∆P increases with increasing W, and decreases with increasing Q. The relationship between ω and Q and W is a binary quadratic function relationship, and the equation for calculating the effective stowing gradient when using spiral pipe is proposed.
(4)
This study provides an idea for industrial design and engineering applications. First, the parameters of the filling slurry are determined through laboratory experimental tests. Second, the parameter combination of the backfilling pipe is determined by the actual industrial situation. Third, the relationship between ω and Q and W is obtained via numerical simulation and analysis. Therefore, the relationship between N′ and Q and W can be found by the calculation equation of the effective stowing gradient. Finally, a suitable filling pipe is designed from actual conditions.

Author Contributions

Conceptualization, W.W. and H.M.; Data curation, W.W. and A.W.; Formal analysis, H.M. and R.S.; Funding acquisition, G.M., L.G. and X.L.; Investigation, W.W. and X.L.; Methodology, H.M.; Resources, L.G.; Validation, G.M. and L.G.; Writing—original draft, W.W., A.W. and R.S.; Writing—review and editing, H.M. and L.G. All authors have read and agreed to the published version of the manuscript.

Funding

This research was supported by the National Key R&D Program of China (2018YFC0604605, 2021YFC2900600, 2021YFE0102900); This research was also funded by the Key Research Fund of BGRIMM the Exploration fund of BGRIMM (04-2122, 04-2213).

Institutional Review Board Statement

Not applicable.

Informed Consent Statement

Not applicable.

Data Availability Statement

The original contributions presented in the study are included in the article, and further inquiries can be directed to the corresponding authors.

Conflicts of Interest

The authors declare that the research was conducted in the absence of any commercial or financial relationships that could be construed as a potential conflict of interest.

References

  1. Zhang, C.; Jin, G.H.; Liu, C.; Li, S.G.; Xue, J.H.; Cheng, R.H.; Wang, X.L.; Zeng, X.Z. Prediction of rockbursts in a typical island working face of a coal mine through microseismic monitoring technology. Tunn. Undergr. Space Technol. 2021, 113, 103972. [Google Scholar] [CrossRef]
  2. Aleksakhin, A.; Sala, D.; Golovin, K.; Kovalev, R. Reducing energy costs for pipeline transportation. Transp. Res. Procedia 2021, 57, 24–32. [Google Scholar] [CrossRef]
  3. Cai, M.F. Prediction and prevention of rockburst in metal mines—A case study of Sanshandao gold mine. J. Rock Mech. Geotech. 2016, 8, 204–211. [Google Scholar] [CrossRef]
  4. Xie, H.P.; Ju, Y.; Gao, F.; Gao, M.Z.; Zhang, R. Groundbreaking theoretical and technical conceptualization of fluidized mining of deep underground solid mineral resources. Tunn. Undergr. Space Technol. 2017, 67, 68–70. [Google Scholar] [CrossRef]
  5. Cheng, H.Y.; Wu, S.C.; Li, H.; Zhang, X.Q. Influence of time and temperature on rheology and flow performance of cemented paste backfill. Constr. Build. Mater. 2020, 231, 117117. [Google Scholar] [CrossRef]
  6. Mashifana, T.; Sithole, T. Clean production of sustainable backfill material from waste gold tailings and slag. J. Clean. Prod. 2021, 308, 127357. [Google Scholar] [CrossRef]
  7. Rybak, J.; Adigamov, A.; Kongar-Syuryun, C.; Khayrutdinov, M.; Tyulyaeva, Y. Renewable-resource technologies in mining and metallurgical enterprises providing environmental safety. Minerals 2021, 11, 1145. [Google Scholar] [CrossRef]
  8. Lyu, X.; Yang, K.; Fang, J.J. Utilization of resources in abandoned coal mines for carbon neutrality. Sci. Total Environ. 2022, 822, 153646. [Google Scholar] [CrossRef]
  9. Zhao, X.; Ma, X.W.; Chen, B.Y.; Shang, Y.P.; Song, M.L. Challenges toward carbon neutrality in China: Strategies and countermeasures. Resour. Conserv. Recycl. 2022, 176, 105959. [Google Scholar] [CrossRef]
  10. Qi, C.C.; Fourie, A. Cemented paste backfill for mineral tailings management: Review and future perspectives. Miner. Eng. 2019, 144, 106025. [Google Scholar] [CrossRef]
  11. Chen, Q.S.; Zhou, H.L.; Wang, Y.M.; Li, X.S.; Zhang, Q.L.; Feng, Y.; Qi, C.C. Resistance Loss in Cemented Paste Backfill Pipelines: Effect of Inlet Velocity, Particle Mass Concentration, and Particle Size. Materials 2022, 15, 3339. [Google Scholar] [CrossRef] [PubMed]
  12. Abdul-Hussain, N.; Fall, M. Thermo-hydro-mechanical behaviour of sodium silicate-cemented paste tailings in column experiments. Tunn. Undergr. Space Technol. 2012, 29, 85–93. [Google Scholar] [CrossRef]
  13. Yin, S.H.; Shao, Y.J.; Wu, A.X.; Wang, H.J.; Liu, X.H.; Wang, Y. A systematic review of paste technology in metal mines for cleaner production in China. J. Clean. Prod. 2020, 247, 119590. [Google Scholar] [CrossRef]
  14. Ercikdi, B.; Kuekci, G.; Yilmaz, T. Utilization of granulated marble wastes and waste bricks as mineral admixture in cemented paste backfill of sulphide-rich tailings. Constr. Build. Mater. 2015, 93, 573–583. [Google Scholar] [CrossRef]
  15. Hefni, M.; Ahmed, H.A.M.; Omar, E.S.; Ali, M.A. The potential re-use of Saudi mine tailings in mine backfill: A path towards sustainable mining in Saudi Arabia. Sustainability 2021, 13, 6204. [Google Scholar] [CrossRef]
  16. Qi, C.C.; Chen, Q.S.; Fourie, A.; Zhao, J.W.; Zhang, Q.L. Pressure drop in pipe flow of cemented paste backfill: Experimental and modeling study. Powder Technol. 2018, 333, 9–18. [Google Scholar] [CrossRef]
  17. Wang, Y.Y.; Wang, Y.; Yang, G.F.; Ruan, Z.E.; Wang, Z.Q. Effect of cement-to-tailings ratio and flow rate on the wear performance of filling pipeline. Powder Technol. 2022, 397, 117027. [Google Scholar] [CrossRef]
  18. Hewitt, D.; Allard, S.; Radziszewski, P. Pipe lining abrasion testing for paste backfill operations. Miner. Eng. 2009, 22, 1088–1090. [Google Scholar] [CrossRef]
  19. Emad, M.Z.; Mitri, H.; Kelly, C. State-of-the-art review of backfill practices for sublevel stoping system. Int. J. Min. Reclam. Environ. 2015, 29, 544–556. [Google Scholar] [CrossRef]
  20. Javaheri, V.; Porter, D.; Kuokkala, V.T. Slurry erosion of steel—Review of tests, mechanisms and materials. Wear 2018, 408, 248–273. [Google Scholar] [CrossRef]
  21. Mc Guinness, M. Wear Profile of the Kidd Mine Pastefill Distribution System. Master’s Thesis, McGill University, Montreal, QC, Canada, 2014. [Google Scholar]
  22. Steward, N.R.; Spearing, A. The performance of backfill pipelines. South. Afr. Inst. Min. Metall. 1992, 92, 27–34. [Google Scholar]
  23. Buchan, A.J.; Spearing, A.J.S. The effect of corrosion on the wear rate of steel pipelines conveying backfill slurry. South. Afr. Inst. Min. Metall. 1994, 94, 37–45. [Google Scholar]
  24. Calderon-Hernandez, J.W.; Sinatora, A.; de Melo, H.G.; Chaves, A.P.; Mano, E.S.; Leal Filho, L.S.; Paiva, J.L.; Braga, A.S.; Pinto, T.C.S. Hydraulic convey of iron ore slurry: Pipeline wear and ore particle degradation in function of pumping time. Wear 2020, 450, 203272. [Google Scholar] [CrossRef]
  25. Zhou, K.P.; Gao, R.; Gao, F. Particle flow characteristics and transportation optimization of superfine unclassified backfilling. Minerals 2017, 7, 6. [Google Scholar] [CrossRef] [Green Version]
  26. Wang, X.L.; Wang, H.J.; Wu, A.X.; Kang, G.W. Wear law of Q345 steel under the abrasion–corrosion synergistic effect of cemented paste backfill. Constr. Build. Mater. 2022, 332, 127283. [Google Scholar] [CrossRef]
  27. Garrido, P.; Burgos, R.; Concha, F.; Bürger, R. Software for the Design and Simulation of Gravity Thickeners. Miner. Eng. 2003, 16, 85–92. [Google Scholar] [CrossRef]
  28. Kaushal, D.R.; Thinglas, T.; Tomita, Y.; Kuchii, S.; Tsukamoto, H. CFD modeling for pipeline flow of fine particles at high concentration. Int. J. Multiph. Flow 2012, 43, 85–100. [Google Scholar] [CrossRef]
  29. Nagar, H.; Gupta, T.; Kumar, N. CFD modeling for the flow of fly ash slurry in straight pipeline. Mater. Today. 2022, 57, 2223–2227. [Google Scholar] [CrossRef]
  30. Movahedi, H.; Jamshidi, S. Experimental and CFD simulation of slurry flow in the annular flow path using two-fluid model. J. Pet. Sci. Eng. 2021, 198, 108224. [Google Scholar] [CrossRef]
  31. Zambrano, H.; Sigalotti, L.D.G.; Klapp, J.; Peña-Polo, F.; Bencomo, A. Heavy oil slurry transportation through horizontal pipelines: Experiments and CFD simulations. Int. J. Multiph. Flow 2017, 91, 130–141. [Google Scholar] [CrossRef]
  32. Liu, L.; Fang, Z.Y.; Qi, C.C.; Zhang, B.; Guo, L.J.; Song, K.I.-I.L. Numerical study on the pipe flow characteristics of the cemented paste backfill slurry considering hydration effects. Powder Technol. 2019, 343, 454–464. [Google Scholar] [CrossRef]
  33. Peng, X.P.; Guo, L.J.; Liu, G.S.; Yang, X.C.; Chen, X.Z. Experimental Study on Factors Influencing the Strength Distribution of In Situ Cemented Tailings Backfill. Metals 2021, 11, 2059. [Google Scholar] [CrossRef]
  34. Zhu, J.Q.; Wu, S.C.; Cheng, H.Y.; Geng, X.J.; Liu, J. Response of Floc Networks in Cemented Paste Backfill to a Pumping Agent. Metals 2021, 11, 1906. [Google Scholar] [CrossRef]
  35. Sun, Q.; Tian, S.; Sun, Q.W.; Li, B.; Cai, C.; Xia, Y.J.; Wei, X.; Mu, Q.W. Preparation and microstructure of fly ash geopolymer paste backfill material. J. Clean. Prod. 2019, 225, 376–390. [Google Scholar] [CrossRef]
  36. Füreder, K.; Svardal, K.; Krampe, J.; Kroiss, H. Rheology and friction loss of raw and digested sewage sludge with high TSS concentrations: A case study. Water Sci. Technol. 2018, 2017, 276–286. [Google Scholar] [CrossRef]
  37. Azizi, N.; Homayoon, R.; Hojjati, M.R. Predicting the Colebrook–White friction factor in the pipe flow by new explicit correlations. J. Fluids Eng. 2019, 141, 051201. [Google Scholar] [CrossRef]
  38. Li, M.Z.; He, Y.P.; Liu, Y.D.; Huang, C. Effect of interaction of particles with different sizes on particle kinetics in multi-sized slurry transport by pipeline. Powder Technol. 2018, 338, 915–930. [Google Scholar] [CrossRef]
  39. Messa, G.V.; Malin, M.; Malavasi, S. Numerical prediction of fully-suspended slurry flow in horizontal pipes. Powder Technol. 2014, 256, 61–70. [Google Scholar] [CrossRef]
  40. Rathore, R.K.; Gupta, P.K.; Kumar, N. Numerical investigation of zinc tailings slurry flow field in a horizontal pipeline. Mater. Today 2021, 45, 2702–2706. [Google Scholar] [CrossRef]
  41. Shao, X.P.; Wang, L.; Li, X.; Fang, Z.Y.; Zhao, B.C.; Tao, Y.Q.; Liu, L.; Sun, W.L.; Sun, J.P. Study on Rheological and Mechanical Properties of Aeolian Sand-Fly Ash-Based Filling Slurry. Energies 2020, 13, 1266. [Google Scholar] [CrossRef] [Green Version]
  42. Sinha, S.L.; Dewangan, S.K.; Sharma, A. A review on particulate slurry erosive wear of industrial materials: In context with pipeline transportation of mineral—Slurry. Part. Sci. Technol. 2017, 35, 103–118. [Google Scholar] [CrossRef]
  43. Bharathan, B.; McGuinness, M.; Kuhar, S.; Kermani, M.; Hassani, F.P.; Sasmito, A.P. Pressure loss and friction factor in non-newtonian mine paste backfill: Modelling, loop test and mine field data. Powder Technol. 2019, 344, 443–453. [Google Scholar] [CrossRef]
  44. Yang, X.B.; Xiao, B.L.; Gao, Q.; He, J.Y. Determining the pressure drop of cemented Gobi sand and tailings paste backfill in a pipe flow. Constr. Build. Mater. 2020, 255, 119371. [Google Scholar] [CrossRef]
  45. Zhang, Q.L.; Cui, J.Q.; Zheng, J.J.; Wang, X.M.; Wang, X.L. Wear mechanism and serious wear position of casing pipe in vertical backfill drill-hole. Trans. Nonferrous Met. Soc. China 2011, 21, 2503–2507. [Google Scholar] [CrossRef]
  46. Sanin, V.N.; Andreev, D.E.; Yukhvid, V.I. Self-propagating high-temperature synthesis metallurgy of pipes with wear-resistant protective coating with the use of industrial wastes of metallurgy production. Russ. J. Non-Ferr. Met. 2013, 54, 274–279. [Google Scholar] [CrossRef]
  47. Kumar, K.; Kumar, S.; Singh, G.; Singh, J.P.; Singh, J. Erosion Wear investigation of HVOF sprayed WC-10Co4Cr coating on slurry pipeline materials. Coatings 2017, 7, 54. [Google Scholar] [CrossRef]
Figure 1. Increasing resistance and reducing pressure schematic of auxiliary pipe (illustration by authors). 1—Program-controlled electric valve, 2—auxiliary pipe, 3—pressure change of vertical pipe of L-shaped pipe, 4—pressure change of vertical pipe after using auxiliary pipe.
Metals 12 01105 g001
Figure 2. Models of the Z-shaped pipe (a), the S-shaped pipe (b) and the spiral pipe (c).
Metals 12 01105 g002
Figure 3. Models of the L-shaped pipe (a,b) elbow of the L-shaped pipe.
Metals 12 01105 g003
Figure 4. Preparation process of the filling slurry sample. (a) Weigh tailings of a certain mass, (b) weigh cementitious materials of a certain mass, (c) weigh some water, (d) pour the tailings, curing material and water into the hopper of the mixer successively and mix for 10 min at 60 r/min to evenly distribute the components.
Metals 12 01105 g004
Figure 5. Slurry under test (a), Brookfield R/S Plus rheometer (b) and rheological curve of filling slurry (c).
Metals 12 01105 g005
Figure 6. Velocity field (a) and pressure field (b) of the filling slurry in the Z-shaped pipe.
Metals 12 01105 g006
Figure 7. Velocity field (a) and pressure field (b) of the filling slurry in the S-shaped pipe.
Metals 12 01105 g007
Figure 8. Velocity field (a) and pressure field (b) of the filling slurry in the spiral pipe.
Metals 12 01105 g008
Figure 9. Spiral pipe models with the same height, spiral diameter W and different pitch Q. (a) Q = 0.25, W = 0.75, (b) Q = 0.50, W = 0.75, (c) Q = 0.75, W = 0.75, (d) Q = 1.00, W = 0.75, (e) Q = 1.25, W = 0.75.
Metals 12 01105 g009
Figure 10.P vs. Q at different W.
Metals 12 01105 g010
Figure 11.P vs. W at different Q.
Metals 12 01105 g011
Figure 12. Three-dimensional coordinate diagram of ω with Q and W.
Metals 12 01105 g012
Table 1. Parameters for different sizes of pipes.
ParameterValue/m
Q0.250.50.751.01.25
W0.50.751.01.251.5
D0.12
h2.5
Table 2. The composition of tailings.
CompositionSiO2Al2O3K2OCaOFe2O3Na2OSO3MgOMnOOthers
Proportion (%)61.2422.145.102.192.961.821.461.410.171.51
Table 3. Friction loss ∆P (Pa) of spiral pipes with different sizes.
W0.50.7511.251.5
Q
0.2555,393.7266,217.2480,239.8795,401.62111,148.30
0.530,364.6734,905.2041,307.3948,744.8056,278.46
0.7524,800.3725,413.4129,062.0933,701.8038,536.95
122,478.2221,682.9223,457.8226,639.4329,790.07
1.2522,234.6020,211.3220,685.3322,677.8124,867.83
Table 4. ω of spiral pipes of different size.
W0.50.7511.251.5
Q
0.2510.6012.6715.3518.2521.26
0.55.816.687.909.3210.76
0.754.744.865.566.457.37
14.304.154.495.105.70
1.254.253.873.964.344.76
Publisher’s Note: MDPI stays neutral with regard to jurisdictional claims in published maps and institutional affiliations.

