Article

Model and Mechanism of Anode Effect of an Electrochemical Cell for Nd or (Nd, Pr) Reduction

by
Andre Luiz Nunis da Silva
1,2,*,
Celia Aparecida Lino dos Santos
3,
Rogério de Melo Riberio de Araújo
1,
Dominic Feldhaus
4,
Bernd Friedrich
4,
Fernando José Gomes Landgraf
5 and
Roberto Guardani
2
1
Laboratory of Metallurgical Processes, IPT—Institute for Technological Research of Sao Paulo State, Av. Prof. Almeida Prado, Sao Paulo 05508-901, SP, Brazil
2
Department of Chemical Engineering, University of Sao Paulo, Av. Luciano Gualberto, Sao Paulo 05508-010, SP, Brazil
3
Laboratory for Corrosion and Protection, IPT—Institute for Technological Research of Sao Paulo State, Av. Prof. Almeida Prado, Sao Paulo 05508-901, SP, Brazil
4
IME Process Metallurgy and Metal Recycling, RWTH Aachen University, Intzestraße 3, 52056 Aachen, Germany
5
Department of Metallurgical and Materials Engineering, University of Sao Paulo, Av. Prof. Mello Moraes, Sao Paulo 05508-030, SP, Brazil
*
Author to whom correspondence should be addressed.
Metals 2022, 12(3), 498; https://doi.org/10.3390/met12030498
Submission received: 21 February 2022 / Revised: 11 March 2022 / Accepted: 13 March 2022 / Published: 15 March 2022
(This article belongs to the Special Issue Advances in Understanding Metal Electrolysis Processes)

Abstract

:
The anode effect can occur during neodymium and didymium oxide electrowinning, causing a surge in the electrochemical cell voltage, interrupting the process, and increasing the greenhouse gas emissions. In this work, we develop a mathematical model, based on the mass balance of gas bubbles evolving from the anode, to understand the influence of some process parameters on the anode effect. The anode effect occurs due to bubble coverage and limitations on the mass transfer of the oxide species. Variables such as current density, oxide content, viscosity, and electrolyte composition play an important role in the anodic process. Finally, we propose a mechanism for the occurrence of the anode effect during Nd or Di (Nd–Pr) oxide electrolytic reduction based on models used in aluminum electrolysis.

Graphical Abstract

1. Introduction

The anodic process is an important part of the electrochemical reduction of neodymium or didymium oxide (a mixture of Nd2O3 and Pr6O11). Depending on process parameters such as oxide concentration, molten salt content, viscosity, and others, the potential at the anode can increase, and consequently the potential of the cell can also increase [1,2,3]. In extreme conditions, the cell operation can be interrupted. The anode effect is also observed in other electrochemical cells such as aluminum reduction cells and is characterized by a surge in potential at the anode [4,5,6,7]. The increase in the potential at the anode is also associated with emissions of perfluorocarbon (PFC), which has a much bigger potential as a greenhouse gas than CO2 [8].
Various mechanisms have been proposed for aluminum reduction, which has been more intensely described in the literature than neodymium reduction [5]. Many publications associate the anode effect with lower wettability, low concentrations of electroactive species, and bubble formation at the anode [6,9,10,11]. The wettability can diminish due to anode polarization [5,6], adsorbed fluoride species on the anode surface (formed probably due to low oxide concentration), and porosity of the anode. At low wettability, bubbles tend to cover the anode area, diminishing the available area for electron transfer and increasing the potential at the anode.
Bubble formation can involve different mechanisms, depending on parameters such as wettability, surface tension, size of cavities on the surface, and others. Jones et al. [12] classified these mechanisms into four different types. Type I refers to homogenous nucleation and consists of the formation of nuclei in the bulk of the liquid. Type II refers to heterogeneous nucleation, where the nuclei are formed on the solid surface, cavities, or particles present in the liquid. Both nucleation mechanisms are based on the classical theory of nucleation. Type III refers to a pseudo-classical theory, where bubbles are formed in pre-existing gas in cavities or on suspended particles by homogenous or heterogeneous nucleation. In Type IV, which relies on non-classical theory, bubble nucleation occurs in cavities where there are pre-existing gases, as in Type III, but for radii of curvature of the gas cavity menisci higher than the critical nucleation value. In this case, no energy barrier needs to be overcome, and nucleation becomes a bubble growth mechanism.
For electrochemical processes, there is no consensus in the literature about which mechanisms prevail. For electrodes with cavities, it is supposed that gas can be formed and nucleation of Type IV prevails because this leads to a minimum energy condition for nuclei formation [13]. If the wettability of the electrolyte on the electrode is small, the energy barrier for nucleation is not negligible, and this higher energy barrier must be overcome as predicted by the classical theory [14,15]. A decrease in wettability due to anodic polarization was observed for molten fluoride aluminum reduction that could lead to complete anode coverage by the gases produced [6,10].
Bubble fluid dynamics at the electrode is also important for the potential of the cell. Vogt [10] showed that the bubble motion under horizontal anodes was important for the cell behavior. The motion of bubbles on vertical anodes is different from that on horizontal anodes [16], but bubbles moving within the mass transfer boundary layer, such as the bubbles growing at the electrode surface, can affect the mass transfer of the electroactive species from the bulk to the electrode [17]. Vogt [10] described by means of a mathematical model the influence of the bubble dynamics over horizontal anodes on the critical current density, where the entire anode can be covered by gases.
Although significant differences are expected in the bubble motion in a vertical neodymium cell anode, a similar approach can be adopted to try to understand the mechanism of the anode effect. In this work, we present a model for the potential of a neodymium electrochemical reduction cell with vertical electrodes. The model is based on the mass balance at a vertical anode. Then, the influence of some cell parameters on nucleation is discussed, and a mechanism is proposed for the anode effect based on models used in aluminum electrolysis.

2. Materials and Methods

2.1. Study on Gas Bubble Evolution

A laboratory-scale cell was assembled at the IPT (Institute for Technological Research of Sao Paulo State) facility to study the reduction of neodymium and didymium oxide. The cell consisted of an Inconel-lined reactor heated by an external furnace to 1050 °C. The experimental procedure consisted of inserting graphite crucibles into the reactor containing approximately 19 kg of salt mixture (LiF-NdF3-PrF3) in different proportions. Each sample was heated up, dried under vacuum for more than 12 h, and melted. A ¼-inch tungsten rod was immersed in the center of the molten salt, surrounded by a cylindrical anode with a 120 mm inner diameter. Both anode and cathode were immersed in the molten salt to a depth of approximately 100 mm. Between the anode and cathode, a platinum rod was installed as a quasi-reference electrode. A small molybdenum crucible was positioned below the cathode to collect the rare earth metal produced.
The reactor lid had a silo containing didymium oxide that was fed to the molten salt at a determined rate through an endless screw feeding system. Continuous current between 80 and 150 A was provided by a CR rectifier (CR Comércio de Retificadores, Charqueada, SP, Brazil).
Previous studies on didymium oxide reduction by molten salt electrolysis have been carried out by this research team, aimed at verifying the influence of some process parameters on the operational stability of the cell [3]. In these studies, it was observed that, for example, while oxide is being fed, the electrochemical reduction process remains relatively stable. However, when there is a lack of oxide, the oxide activity decreases, the process becomes unstable, and the anode effect can be observed, as in aluminum reduction cells.
Some of our visual observations suggested that the bubbles formed at the anode change in size and frequency depending on the operational conditions (Figure 1). Under stable operation, the bubbles at the surface of the electrolyte look bigger and appear with lower frequency compared with unstable operations with significant anode effects, when the bubbles look significantly smaller and appear as a cloud of smaller bubbles. Under unstable conditions, the cell potential is higher than under stable conditions.
Similarly to the case for the horizontal anode [10], the gas evolution rate V ˙ g can be described by a mass balance in the vertical anode. Hence, Faraday’s law is given by:
V ˙ g A = ν g ν N d n η j F Z R T P ,
where A is the total anode area, ν g and ν N d are the stoichiometric coefficients of the gas and neodymium or didymium, respectively, according to Equation (2) [2], n is the number of electrons in the reaction, η is the current efficiency, j is the current density, F is the Faraday constant, R is the gas constant, T is the temperature, P is the pressure, and Z is the compressibility factor.
N d 2 O 3 + 3 C   2 N d + 3 C O .  
The gas bubbles formed can nucleate and grow on the anode surface, and the fraction of the area occupied by bubbles Θ can be represented as the ratio of the total bubble area on the anode surface and the total anode area, as follows:
Θ = n b π R t 2 A ,
where n b is the total number of bubbles and R t is the mean radius for a given distribution size at time t . The gas evolution rate can also be described as a function of the volume of bubbles V b   as follows:
V ˙ g = n b V b t r b .
By substituting Equations (2) and (3) in (1), the fraction of the anode area occupied by bubbles can be expressed as:
Θ = 3 t r b 4 R t υ g a s υ N d n η J F Z R T P f g ,
where f g is the gas evolution efficiency in the anode and is given by [10,18]:
f g = 0.55 Θ 0.1 + 0.45 Θ 8 .
Bubbles nucleate, grow, and detach from the anode to move to the electrolyte surface. To describe the bubble dynamics at the anode, the residence time was divided into two components: t r b _ a for the residence time while growing to detaching and t r b _ b for the residence time of bubbles after detaching from the anode and moving to the electrolyte surface. The total residence time t r b is the sum of these two components. As bubbles move next to the vertical anode [16], the mass transfer layer is affected [17].

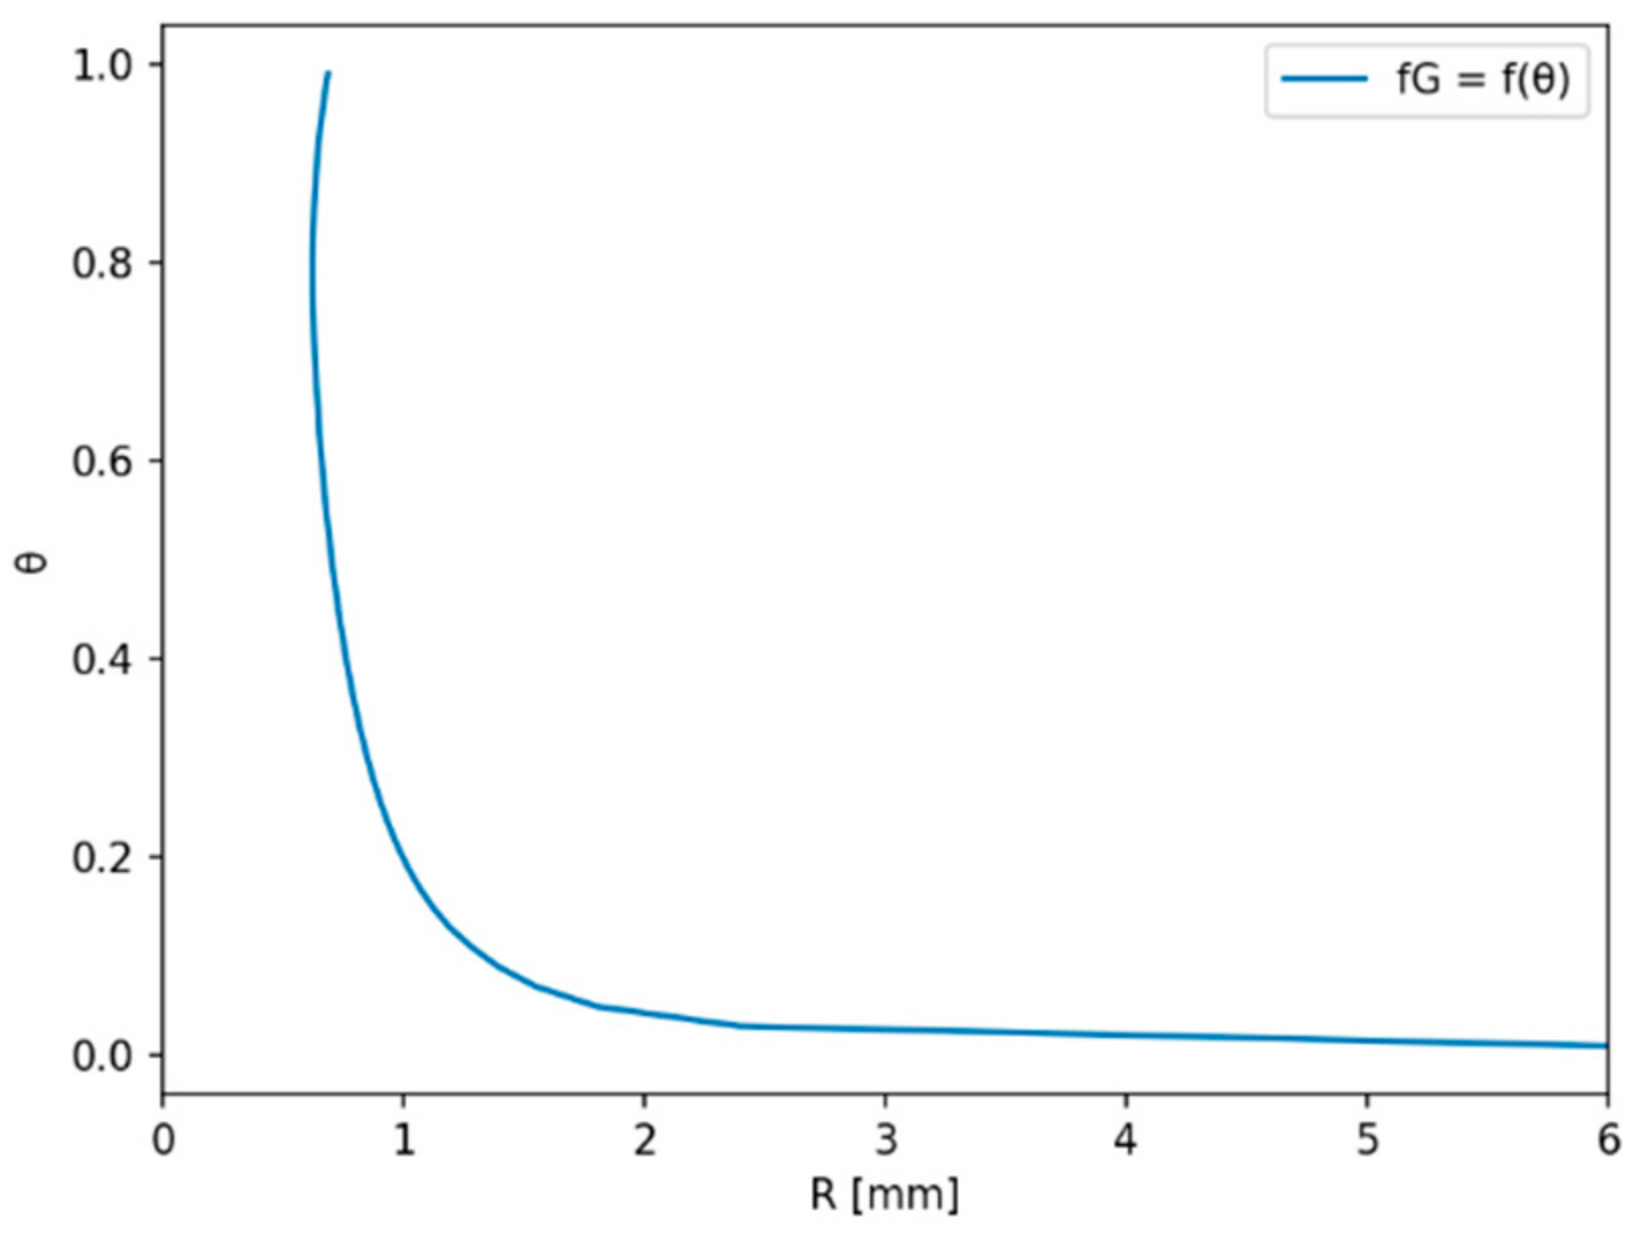
2.1.1. Residence Time Due to Bubble Growth t r b _ a

If nucleation is assumed to be considerably faster than the bubble growth rate, then the total residence time before bubble detachment from the anode is mainly due to bubble growth. Bubbles grow by mass transfer from the dissolved gas molecules in the electrolyte to the bubbles. The driving force for mass transfer is the supersaturation of the gas-forming species and its rate is given by [19]:
η I / A ( υ N d n / υ g a s ) F 1 2 3 f g = k b C o C s a t ,
where C o is the concentration of the dissolved species at the electrolyte and C s a t is its saturation concentration in mol·m−3. In addition, k b is the mass transfer coefficient and can be determined, considering the influence of the area occupied by bubbles, by [20]:
k b = 1.65 D S R e b 0.5 μ L ρ L D s 0.5 Θ 0.5 1 Θ / 2 R ,
where   R e b is the Reynolds number for the gas bubbles. The mass transfer coefficient is a function of the diffusion coefficient D S , viscosity μ L , and electrolyte density ρ L .
A number of empirical expressions can be found in the literature relating the bubble radius and growth time. In this work the expression proposed by Scriven was adopted due to its high acceptance in the literature [12,21,22]:
R = 2 β D S t r b _ a ,
where β is a nondimensional growth parameter. Based on the study by Scriven, since the relation between the density of the gas and the electrolyte ρ G / ρ L at high temperatures is negligible, the β parameter was fitted to the following expression:
β = 1.152 ϕ 2 + 801.3 ϕ + 948 ϕ + 879.6 ,
where
ϕ = ρ L C o C s a t ρ G ρ L C s a t .
To calculate the residence time due to bubble growth from Equation (9), supersaturation is calculated by Equations (7) and (8).

2.1.2. Residence Time after Detachment t r b _ b

For a vertical anode immersed in the electrolyte, bubbles are formed at different positions. Bubbles formed at the top of the anode reach the electrolyte surface faster than bubbles formed at the bottom. For a bubble formed at a distance y from the top of the anode, ascending with a velocity v b , the residence time can be represented by:
t r b _ b i = f v b , y = y v b .
By applying the mean-value theorem to Equation (12) and considering that f v b , y is a continuous function, the mean residence time of the bubbles can be determined by:
t r b _ b =   1 y 2 y 1 y 1 y 2 f v b , y d y .
For an anode of length L, Equation (13) can be integrated from length 0 to L, resulting in
t r b _ b = L 2 v b .
The velocity of an ascending bubble can be determined from a balance of the drag and buoyancy forces applied to the bubble. The relative velocity is, in general, represented as a function of the bubble radius and its drag coefficient   C D as follows [16]:
v b = 8 ρ L ρ G g R 3 ρ L C D .  
where
C D = m a x 24 R e b 1 + 0 , 1 R e b 0.75 , m i n 2 3 E o , 8 3 .
This correlation was proposed by Ishii et al. [23] to estimate the drag coefficient and gave a good result in the simulation of a similar process [16].
The mathematical treatment adopted for the other boundary conditions, namely open circuit potential, ohmic drop, and anodic overpotential, is presented below.

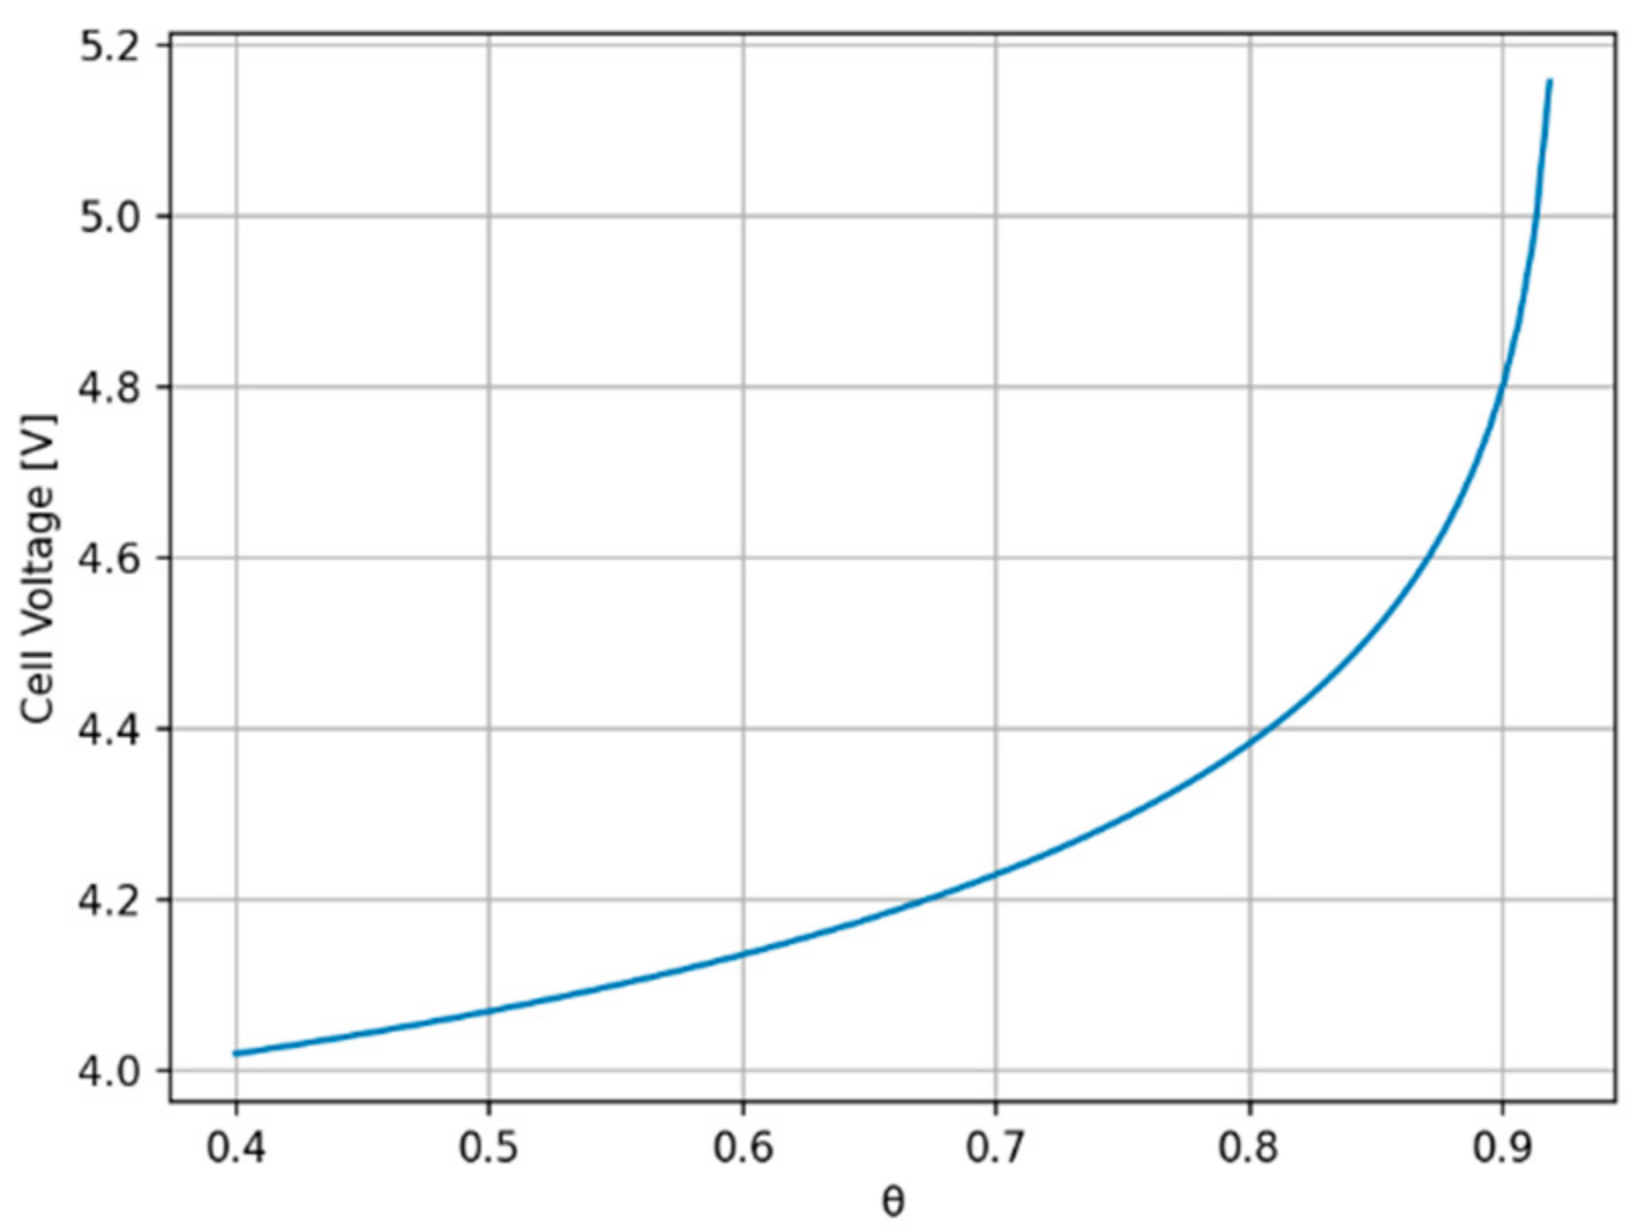
2.2. Overall Cell Voltage

The potential of an electrochemical cell is a summation of different potential components. These are the ohmic potential drop Δ Φ , the open-circuit potential E, the gas diffusion overpotential   η d i f f , and the charge transfer overpotential   η c .
E c e l l = E + η d i f f + η c + Δ Φ + Δ Φ e l e c t r o d e s

2.2.1. Open-Circuit Potential

The open-circuit potential of the reaction represented by Equation (2) is given by the Nernst equation, as follows [2]:
E = E 0 R T n F l n a N d 2 . a C O 3 a N d 2 O 3 . a C 3 .
Considering that the activity values of neodymium metal, CO gas, and carbon are 1 and the activity of neodymium oxide can be represented by the ratio of neodymium concentration and its saturation, the open-circuit potential can be rewritten as [2]:
E = E 0 R T n F l n 1 C N d 2 O 3 / C s a t N d 2 O 3 .

2.2.2. Ohmic Potential Drop

The resistance to ionic and electronic current leads to an ohmic drop, represented by:
Δ Φ = I R e l ,
where I is the applied current and Rel is the resistance of the electrolyte or of the electrode material and is dependent on the resistivity ρ e l as follows:
R e l = ρ e l x 1 x 2 d x A x
Classical neodymium and didymium reduction cells have a W or Mo cathode rod at the center of the cell, surrounded by a graphite anode. The electrolyte resistance varies with the cathode and the anode diameters, and consequently with the distance between the electrodes x. Considering this cell geometry, the resistance due to the electrolyte can be written as:
R e l = ρ e l D c D a d x 2 π L x ,
where Da and Dc are the internal diameter of the anode and the diameter of the cathode, respectively. Solving the integral and substituting in (20) results in:
Δ Φ = ρ e l 2 π L l n D a D c I .  

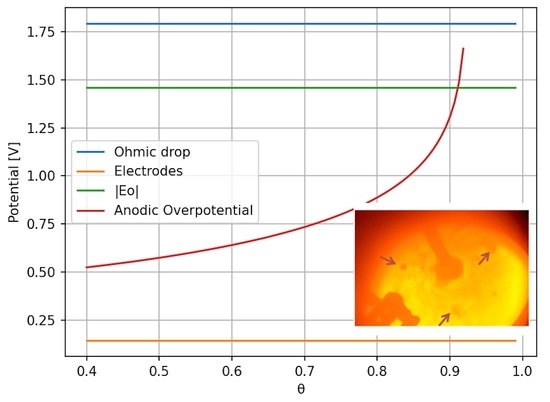
2.2.3. Anodic Overpotential

Charge Transfer Overpotential

There is an overpotential attributed to the charge transfer on the anode surface due to diffusion, which can be important to the overall cell voltage. This overpotential can be represented by the corrected concentration form of the Butler–Volmer equation, considering that the current density j is much larger than the exchange current density jo [24]:
η c = R T α F l n j / j o 1 j / j l i m ,
where α is the transfer coefficient at the anode and j l i m is the current density when the concentration of the oxygen-containing species next to the electrode C w is zero. Since there are bubbles covering the anode, the real current density can be represented by j = I / A 1 Θ . Similarly to the gas molecule, the mass transfer of the oxygen carrier species can be represented by:
I n / υ N d 2 O 3 F = k N d 2 O 3 A 1 θ C N d 2 O 3 C w ,
where C N d 2 O 3 is the bulk concentration of the electrolyte. As the oxygen carrier species and the gas molecule are different species, their mass transfer coefficients are not necessarily equal [19]. However, due to the lack of enough data and to aid simplification of the model, in this study their mass transfer coefficients were considered similar. Given these considerations, Equation (24) is rewritten as follows:
η c = R T α F l n I A 1 Θ j 0 l n 1 v N d 2 O 3 n I F k b A C N d 2 O 3 .  

Gas Diffusion Overpotential
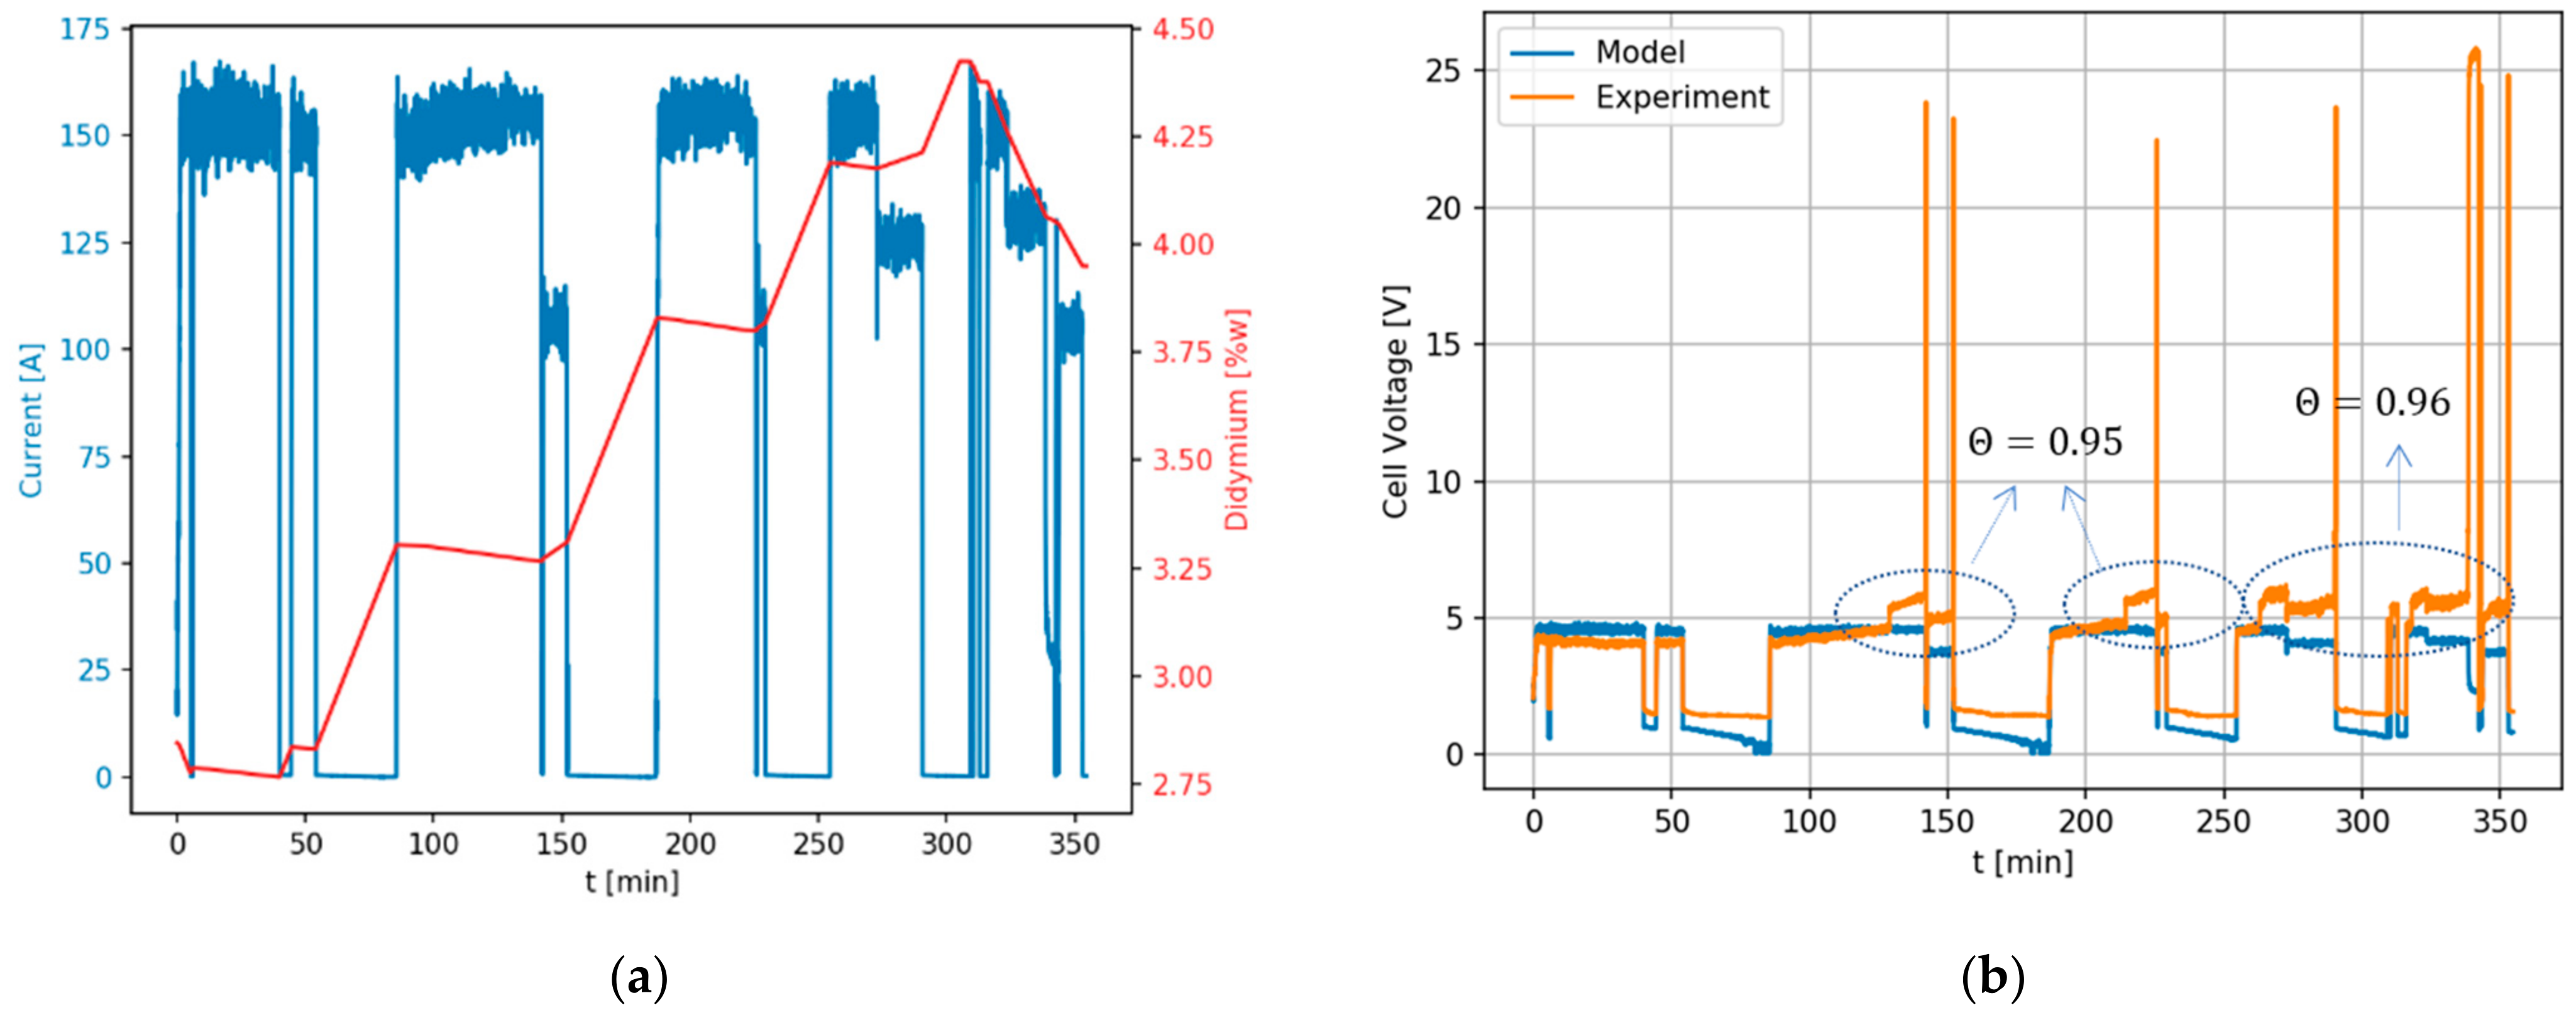
The overpotential due to the gas diffusion at the anode is also important. Since the dissolved gas is supersaturated and diffuses to the anode resulting in bubble formation and growth, it is probable that the gas concentration at the electrode surface C s is close to saturation [24]. Assuming that the reaction at the surface is fast enough for the system to be considered to be in equilibrium, the electrode potential can be represented by the Nernst equation [24]. Thus, the gas diffusion overpotential is written as a function of the gas concentration as follows:
η d i f f = R T n F l n C o C s .
As discussed by Vogt and Stephan [20], the mechanism of mass transfer of dissolved gas formed at the electrode must not be represented by the diffusion mass transfer only. The convective component of the mass transfer due to the induced convection resulting from bubble growth, detachment, and ascension is an important part of the dissolved gas transport phenomenon. The dissolved gas concentration depends on this mechanism.
With the aforementioned assumptions and considering the driving force for mass transfer, the gas diffusion overpotential can be written in a simplified form as:
η d i f f = R T n F l n 1 + I A F k b C s a t .
Note that the second logarithm terms of Equations (26) and (28) do not contain the correction for the fraction of anode coverage, since it is already considered in k b .
The parameters in these equations refer to the neodymium oxide decomposition. However, the same equations can be applied to didymium oxide.
The model presented here is limited to electrochemical cells with vertical anodes. Horizontal anodes are not represented properly by this model due to significant differences in bubble motion and physical interaction with the anode. Another limitation is related to the mass transfer correlation proposed by Vogt and Stephan [20] and adopted here, which considers that convection is induced by bubble evolution at the anode. This correlation is restricted to processes in which free or forced convection is negligible. Finally, as the charge transfer overpotential depends on the current density, meaningless physical results were obtained for current densities lower than 0.05 A/cm2.

3. Results

The geometric and physical properties considered in the simulations are summarized in Table 1 and correspond to the electrochemical cell described.
The fraction of the anode area covered by bubbles is a function of the bubble radius and residence time. Figure 2 shows the variation in bubble coverage as a function of bubble size for a current of 150 A. Figure 2 was obtained by solving Equations (1)–(16) for different values of R.
For large bubble sizes, the bubble coverage is not significant. Bubbles of large size tend to detach easily from the anode. However, bubbles smaller than about 1 mm lead to a large increase in the bubble coverage. Considering that the applied current is constant, and the volume of gas evolving from the anode is also constant, then the total bubble area increases as the bubble size decreases. Furthermore, small bubbles have lower velocities and tend to have a higher residence time at the anode. This may explain the fast increase in bubble coverage for bubble radii less than 1 mm. This behavior is compatible with visual observations.
The cell voltage can be estimated by solving Equations (1)–(26). Figure 3 shows the evolution of the cell voltage as a function of the anode coverage. The simulation considers a neodymium oxide content of 3% by weight.
The cell potential increases gradually up to 80% of anode coverage. After this point, the potential increases faster, and at about 94% of anode coverage, a surge in the potential is observed, similar to the observations of the anode effect in neodymium or didymium reduction [1,3,28] and aluminum reduction [5,6]. These results indicate that the anode effect can occur before the complete coverage of the anode, as reported in the literature for aluminum production. To understand the increase in cell potential as a function of electrode coverage, the overall cell voltage is shown in Figure 4a and the anodic overpotential in Figure 4b, together with the contributions of the main factors considered.
As shown in the model description, the increase in the potential is due to the anodic overpotential when the anode is covered with bubbles. For Θ < 0.9 , the principal contribution to the cell potential is the ohmic drop in the electrolyte, followed by the open-circuit potential, as observed by Vogel and Friedrich [2]. The ohmic drop due to the electrode material is negligible compared to the other components. Figure 4b shows that the contribution to the surge in the potential at the anode is mainly due to charge transfer of the oxide species and represents 90 to 95% of the anodic overpotential.
The model results were compared with two different experimental situations. The first experiment, with data presented in Figure 5, represents a situation where the operation is stable, with low overall cell potential and no anode effect. The second experiment, in Figure 6, shows high overall cell voltage and unstable operation, with many oscillations due to the anode effect.
In the experiment shown in Figure 5, the cell remained stable for about 200 min, with a short interval for operational adjustments. During the reduction stage, with a cell voltage close to 4 V, the model was fitted to a value of Θ equal to 0.76, that is, 76% anode coverage. At the end of each section, close to the occurrence of the anode effect, the voltage rose to values above 4.5 V. In these cases, for the model to represent this potential, the proportion of the anode area occupied by bubbles must have been 91 and 93%, respectively. At this moment, the oxide content was lower.
Figure 6 shows the time evolution of the current and didymium content for an experiment with a higher oxide feed rate. Thus, the estimated oxide content is high, probably resulting in poor oxide dissolution in the electrolyte, which can cause the formation of insoluble oxyfluorides [29]. This can be the cause of the observed instability and many anodic effects. The overall cell voltage was higher compared to the previous experiment. The model predicts that, when the anodic effect is imminent, the anode coverage by bubbles is nearly 95%, in the unstable region of the potential surge (Figure 6b). Note that the model does not consider PFC formation, which is normally observed during the anode effect [1]. PFC formation may contribute to the increase in the potential as the decomposition potential value of the fluoride species is higher than the potential of the oxide species [1]. In this case, the anode coverage may be lower than shown here.
The insoluble oxyfluoride formed increases the viscosity of the electrolyte, which can affect the bubble dynamics and the mass transfer of the different species. Previous results published by IME Aachen also discussed the alteration of the viscosity due to electrolyte content [30] and the difference in the cell behavior for different LiF contents. Other variables important to the cell operation are the current density at the anode and the oxide concentration. The model was explored to evaluate the sensitivity of the overall cell voltage to the fraction of electrode area covered by gas, Θ. The results are shown in Figure 7.
Figure 7a shows that for higher current densities, corresponding to higher cell voltages, the anode effect can occur at lower values of Θ. This is because for higher current densities, the mass transfer of the electroactive species is increased, and this process can be limited by the electrode area available for mass transfer. The decrease in anode area due to the coverage by bubbles leads to a decrease in the overall mass transfer. As a result, the cell can exhibit the anode effect when lower fractions of the anode are covered by bubbles. Higher current densities can disrupt the electrochemical process when the known critical current density is reached [5].
Like high current densities, low oxide concentrations can also limit the overall mass transfer. Figure 7b shows that the surge in the potential can occur at lower fractions of the area of the anode covered by bubbles when the oxide content is low.
The viscosity, as shown in Figure 7c, also contributes to changes in the cell voltage behavior as a function of the anode coverage. Higher viscosities affect the bubble flow from the anode and can limit the mass transfer process. As a result, as the viscosity increases, the anode effect can occur at lower values of Θ. The curves in Figure 7d correspond to the effect of conductivity due only to different LiF contents. However, the viscosity of the electrolyte can also be affected by the composition, according to Hu et al. [26]. The electrolyte composition can also affect the limit of anode coverage for the anode effect because it can influence the oxide dissolution and the viscosity, as shown by Feldhaus et al. [30].

4. Discussion

The model presented here shows the effect of parameters such as viscosity, current density, oxide content, and electrolyte composition on the anode effect, a characteristic of electrolytic processes that can limit their performance by adding operational instabilities. The anode effect is treated as a function of anode coverage only, without considering nucleation, coalescence, and other phenomena. Although the literature presents empirical equations relating Θ to the current density [31], these models are limited, as other parameters and properties are also important to bubble formation, mainly surface conditions, wettability, and surface tension, which in turn depend on the oxide content and electrolyte composition [32].
Low wettability of the electrolyte on the anode, as reported for molten fluoride electrolysis [6], can lead to a high energy barrier that must be overcome to nucleate bubbles [14]. Although no previous study has been published for rare earth electrolysis, due to the similarity between these systems low wettability is likely to be observed on the anode due to anode polarization, fluoride compounds adsorbed on the anode surface, and surface rugosity, among other factors. In this case, the nucleation mechanism could possibly be represented by the classical nucleation theory. In this case, the nucleation rate can be represented by the equation below [15,33]:
J = C e x p 16 π γ 3 Φ ϑ 3 k T S P 2 ,
where C is not a constant but its importance is lower than the exponential term and it can be considered as a constant [15], k is the Boltzmann constant, S is the supersaturation, P is the pressure, γ is the surface tension, and Φ ϑ is a function of the contact angle ϑ , represented by:
Φ ϑ = 1 4 1 + c o s ϑ 2 2 c o s ϑ .
The bubble size depends on the number of nuclei formed on the anode. When many nuclei are formed, the bubbles tend to be smaller than when bubbles nucleate at lower rates. Furthermore, small bubbles tend to coalesce more and form a gas film or occupy a larger area of the anode, as previously mentioned. Equation (29) shows that the nucleation rate depends on the supersaturation, surface tension, and wettability, represented by the contact angle. All these parameters depend on process variables and can affect the nucleation rate of bubbles on the anode. Each parameter is discussed below, considering that the bubble nucleation rate can be represented by classical nucleation theory.
Wettability. A high contact angle or low wettability leads to a high nucleation rate and smaller bubble size. Lower wettability can be caused by fluoride compounds adsorbed at the surface [34], anodic polarization [5,6], and low LiF content [30]. Studies carried out at IPT (not published yet) showed that low neodymium oxide content also leads to low wettability. In this case, as was shown by Vogel et al. [1], low oxide content and/or an increase in the anodic potential can lead to the reaction of fluoride, causing surface adsorption. Lower LiF content can cause oxide dissolution, resulting in low oxide content and low wettability.
Surface Tension. The energy barrier for nucleation is a function of the surface tension. The higher the surface tension, the more difficult it is to overcome this barrier and the lower the nucleation rate [35]. According to the study by Zhu et al. [32], a lower neodymium oxide concentration tends to lower the surface tension of the electrolyte. The surface tension increases as the neodymium oxide concentration increases and decreases when the neodymium oxide is fed in at supersaturation conditions. In this case, insoluble oxyfluorides are likely to be formed.
Supersaturation. Supersaturation is the driving force for bubble formation and growth. According to classical theory, the higher the supersaturation, the higher the nucleation rate. It can be observed from Equation (7) that high current densities lead to high supersaturation, and consequently a high nucleation rate and smaller bubbles. If the viscosity of the electrolyte increases, the diffusivity mass transport decreases, and the supersaturation tends to increase. High viscosities can be caused by insoluble oxyfluorides formed due to neodymium oxide supersaturation or due to high feeding rates [29] and low LiF content, since the electrolyte liquidus temperature increases and thus superheating decreases [30,36].
Some variables can affect the nucleation rate in more than one way, and can also affect the anodic overpotential, leading to a surge in the potential, as shown in Section 3. Hence, the mechanism of the anodic effect is a summation of different factors that are interconnected. Figure 8 summarizes the relations among the several factors considered in this study, and their relations to the anode effect.

5. Summary

In this study, a mathematical model was proposed to estimate the neodymium and didymium electrochemical cell voltage in an electrolytic cell with vertical electrodes as a function of pertinent process variables and parameters. Some parameters affect the anodic process and can lead to a surge in the cell voltage, known as the anode effect. This effect is related to the covering of the electrode surface with gas, and the effects of those parameters affecting bubble nucleation at the anode are discussed. The principal findings are:
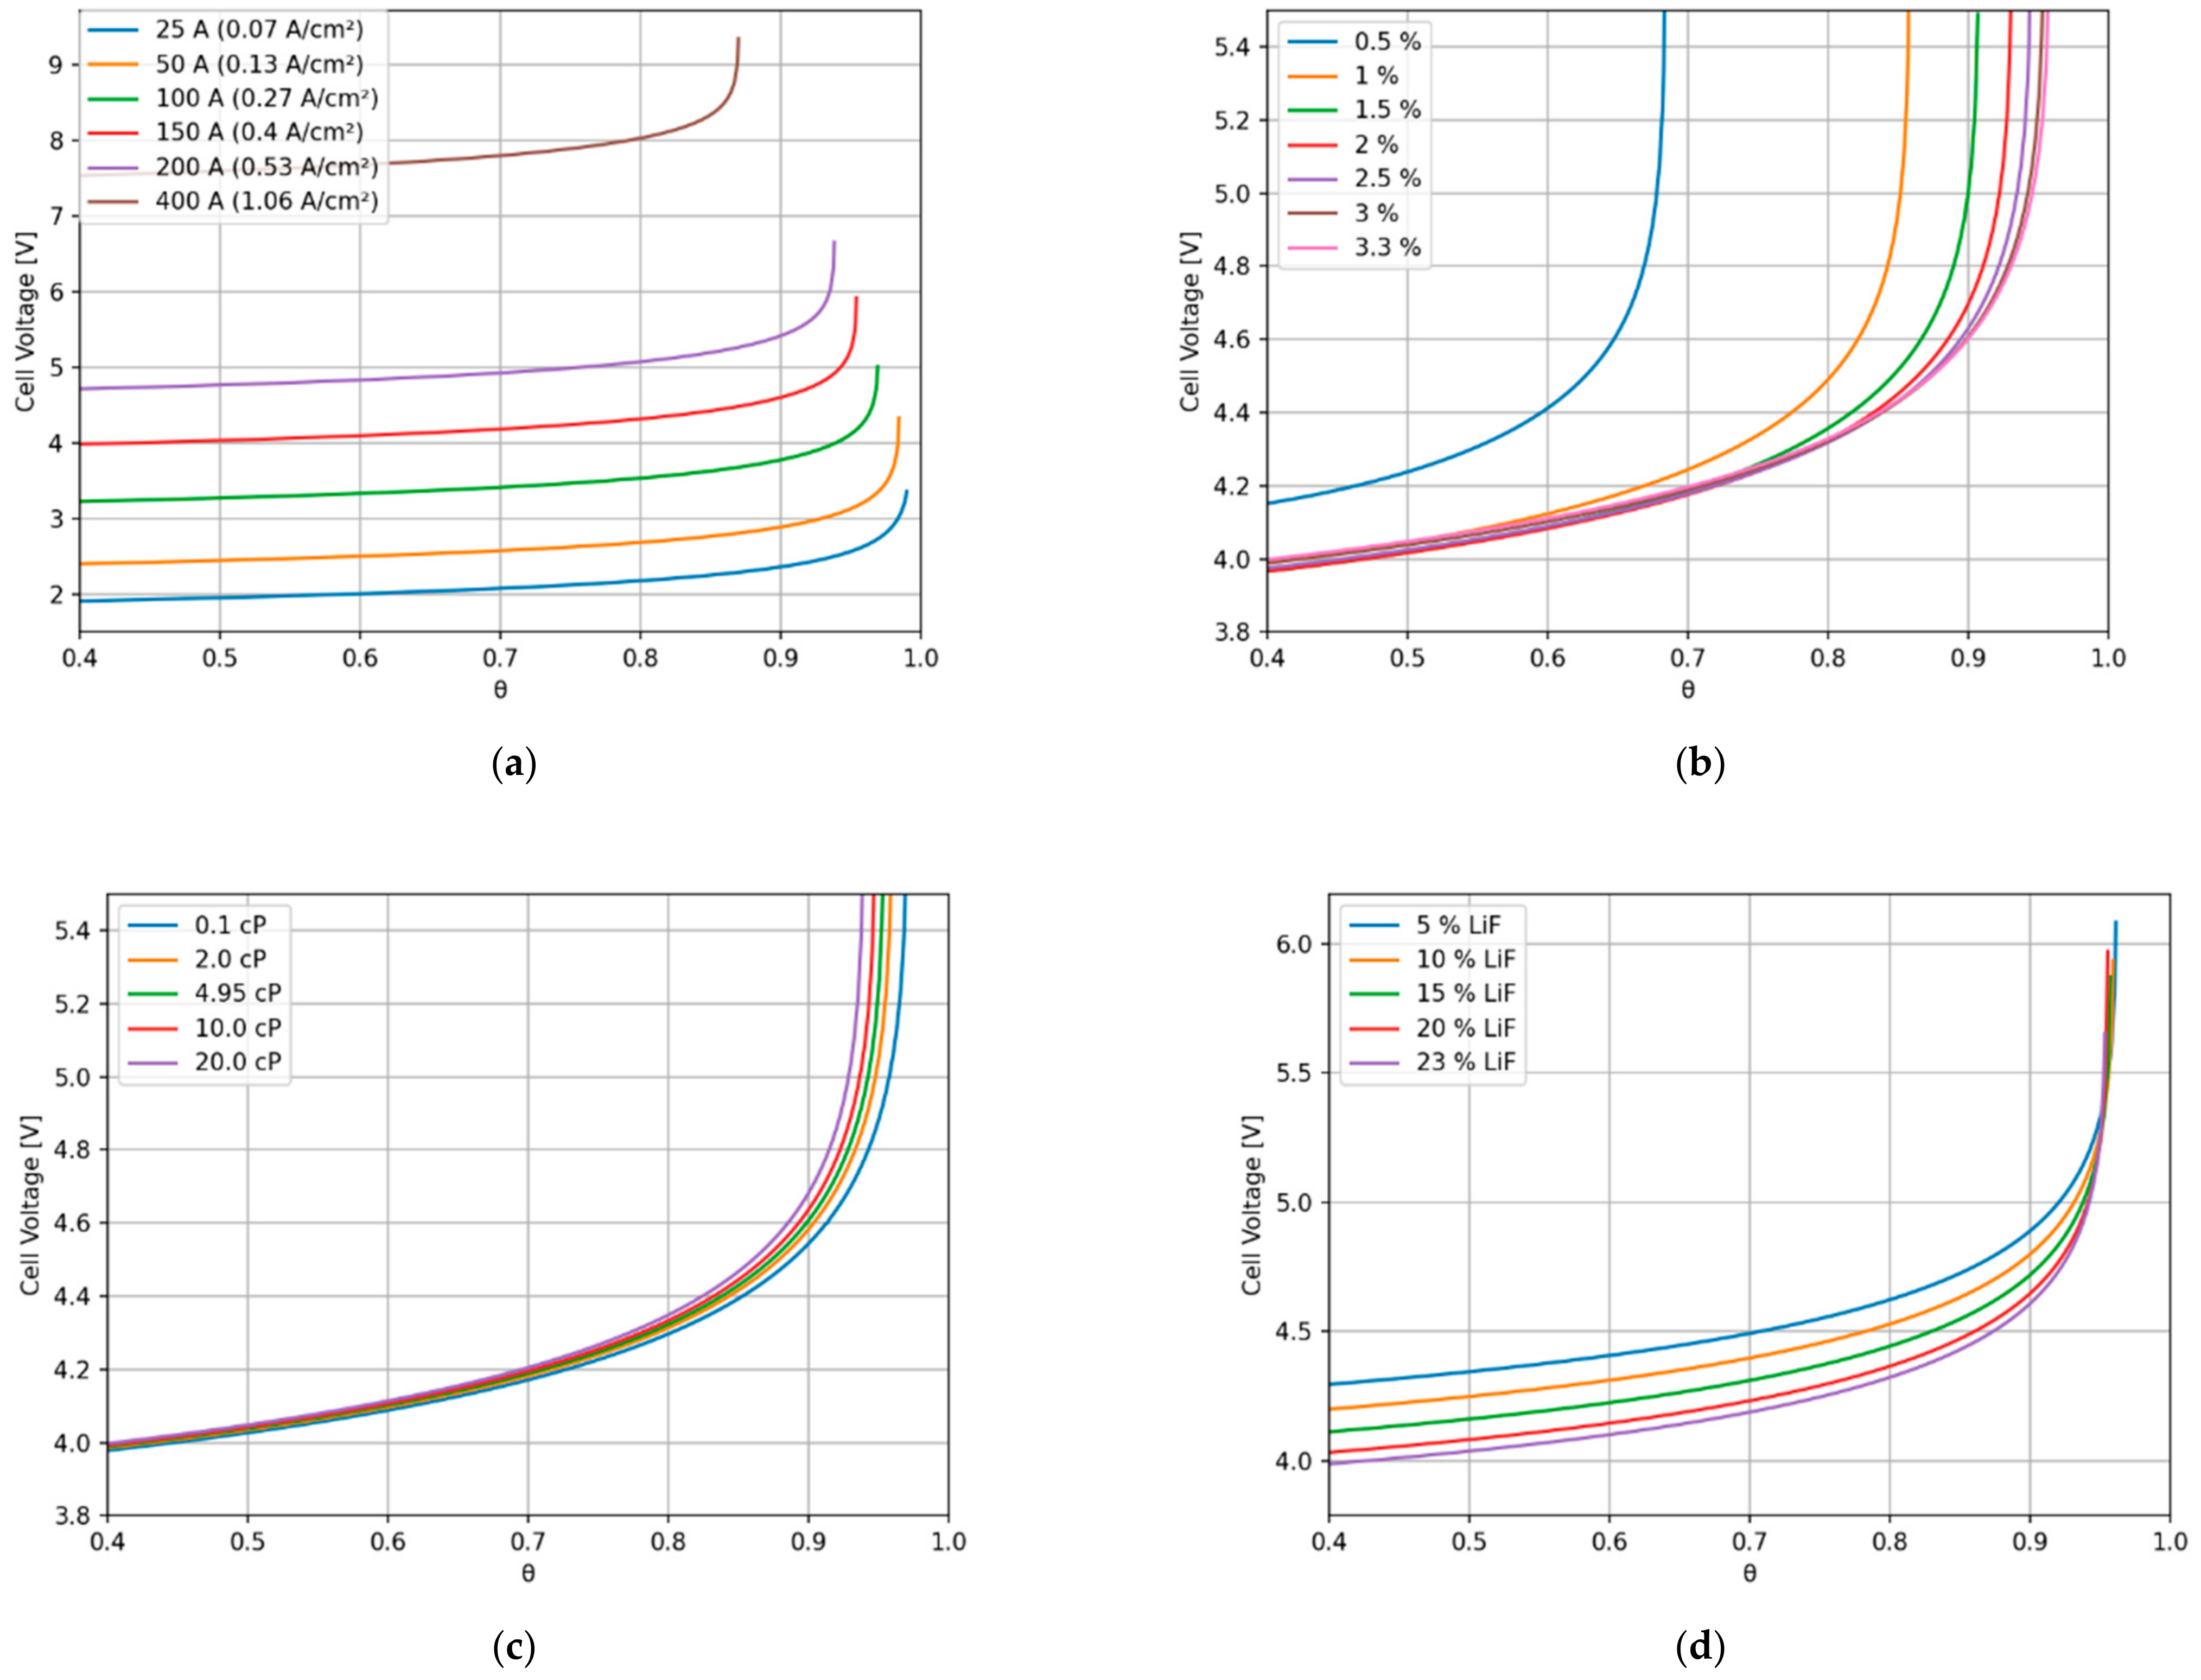
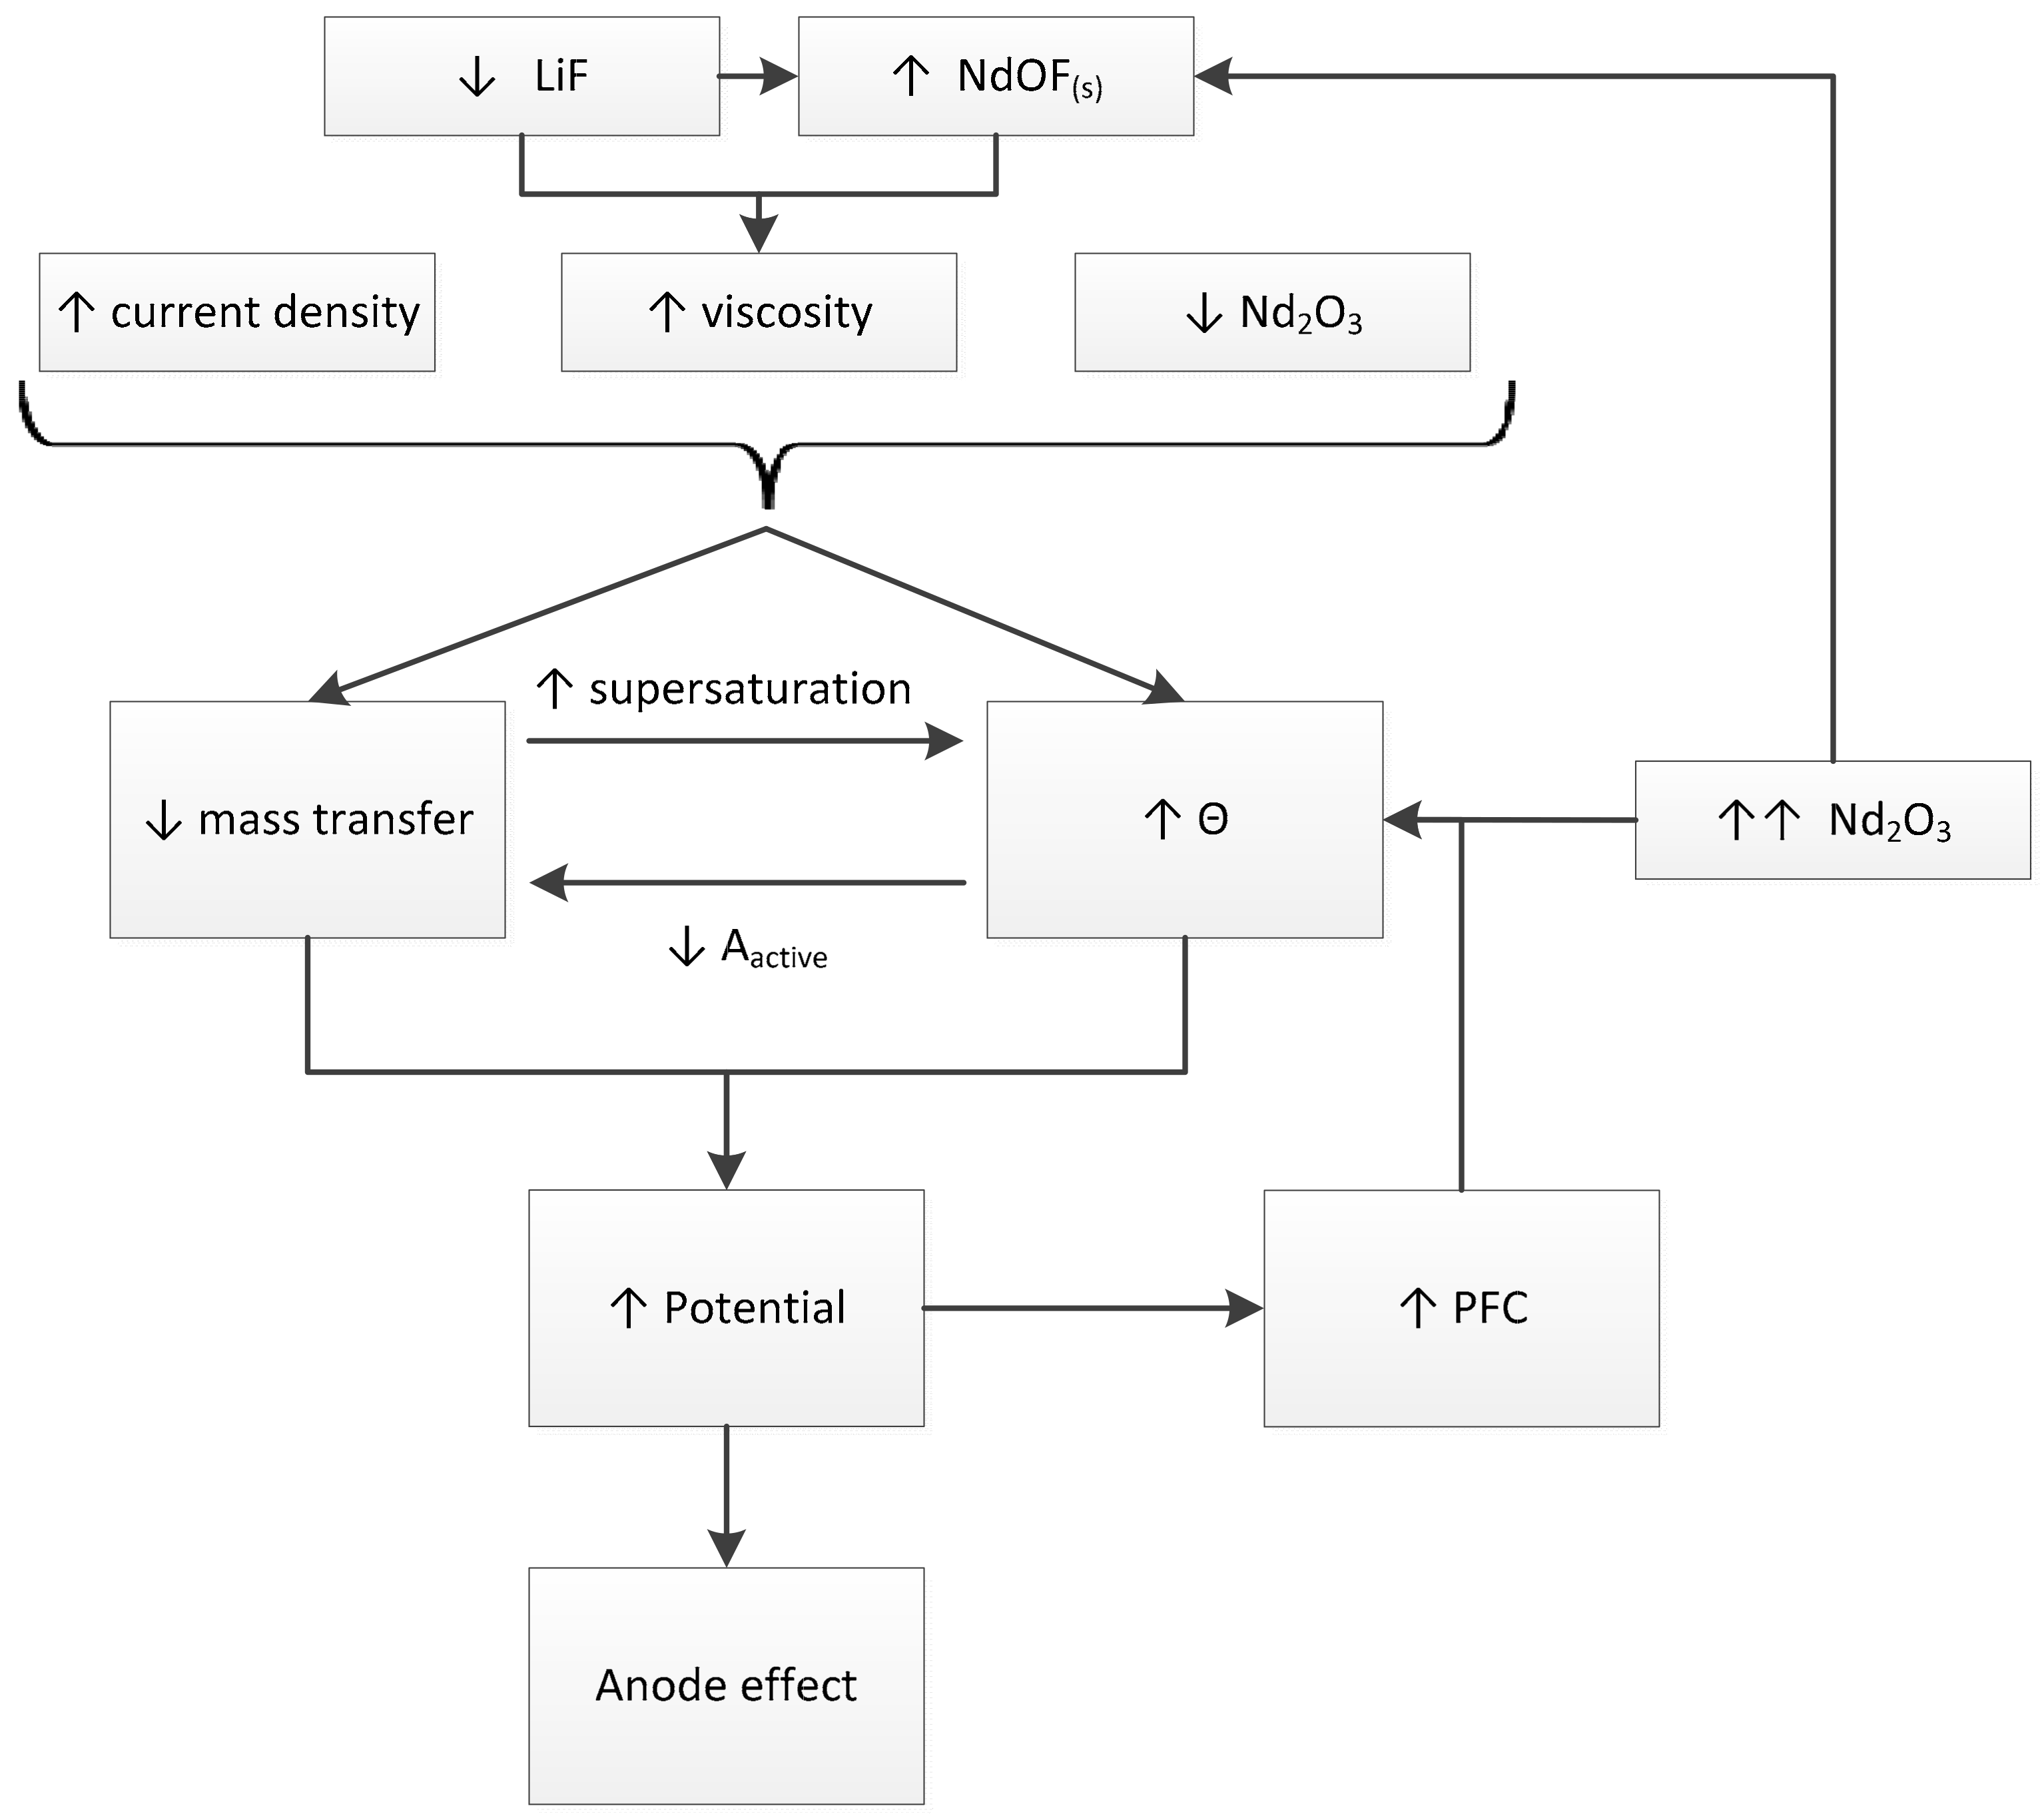
  • For high current densities, the anode effect can occur due to mass transfer limitation. High current densities can also increase the bubble nucleation rate, leading to small bubbles and an increase in electrode surface coverage by the bubbles.
  • Low neodymium or didymium oxide content can lead to low mass transfer rates to the anode, which can lead to an increase in the potential due to charge transfer limitations. Low oxide content tends to lower surface tension, increasing the nucleation rate.
  • High viscosity affects the bubble dynamics, increasing the residence time at the anode and consequently the anode coverage. High viscosity also affects the mass transfer coefficient and supersaturation, which can increase the nucleation rate.
  • Electrolyte composition can affect the occurrence of the anode effect by affecting viscosity and neodymium dissolution rate. Viscosity and oxide content can affect bubble nucleation, as previously mentioned.
Thus, a mechanism was proposed for the occurrence of the anode effect, relating this effect to properties and process variables involved in the process, such as viscosity, bubble nucleation, and anode coverage, leading to an increase in the electrochemical cell voltage.

Author Contributions

Conceptualization, A.L.N.d.S.; funding acquisition, F.J.G.L.; investigation, A.L.N.d.S. and R.d.M.R.d.A.; methodology, A.L.N.d.S.; project administration, C.A.L.d.S., B.F. and F.J.G.L.; supervision, R.G.; validation, A.L.N.d.S.; visualization, R.d.M.R.d.A. and B.F.; writing—original draft, A.L.N.d.S.; writing—review and editing, A.L.N.d.S., C.A.L.d.S., D.F., F.J.G.L. and R.G. All authors have read and agreed to the published version of the manuscript.

Funding

The authors are grateful to Fundação de Amparo à Pesquisa do Estado de São Paulo—FAPESP 2014/50887-4 for financial support in the context of the INCT PATRIA, and FINEP for supporting the computational structure for simulation at IPT (n° 0045/16 conv: 01.18.0082.00).

Institutional Review Board Statement

Not applicable.

Informed Consent Statement

Not applicable.

Data Availability Statement

Not applicable.

Acknowledgments

We would like to thank CBMM for supporting RE research at IPT.

Conflicts of Interest

The authors declare no conflict of interest.

References

  1. Vogel, H.; Flerus, B.; Stoffner, F.; Friedrich, B. Reducing Greenhouse Gas Emission from the Neodymium Oxide Electrolysis. Part I: Analysis of the Anodic Gas Formation. J. Sustain. Metall. 2017, 3, 99–107. [Google Scholar] [CrossRef]
  2. Vogel, H.; Friedrich, B. Reducing Greenhouse Gas Emission from the Neodymium Oxide Electrolysis. Part II: Basics of a Process Control Avoiding PFC Emission. Int. J. Nonferr. Metall. 2017, 6, 27–46. [Google Scholar] [CrossRef] [Green Version]
  3. Da Silva, A.L.N.; Neto, J.B.F.; Landgraf, F.J.G.; Ett, G.; dos Santos, C.A.L.; da Silveira, J.R.F.; Vieira, F.Y.M.; dos Santos Luz, M. Obtenção de didímio metálico a partir dos óxidos de terras raras produzidos em Araxá, Brasil. In Proceedings of the 72° Congresso Anual da ABM, Editora Edgard Blucher, Ltda., São Paulo, Brazil, 2–6 October 2017; pp. 2282–2294. [Google Scholar]
  4. Thonstad, J.; Nordmo, F.; Vee, K. On the anode effect in cryolite-alumina melts-I. Electrochim. Acta 1973, 18, 27–32. [Google Scholar] [CrossRef]
  5. Thonstad, J.; Fellner, P.; Haarberg, G.M.; Híves, J.; Kvande, H.; Sterten, Å. Aluminium Electrolysis/Fundamentals of the Hall-Héroult Process; Aluminium-Verl: Düsseldorf, Germany, 2001; ISBN 3-87017-270-3. [Google Scholar]
  6. Zhu-Xian, Q.; Ching-Bin, W.; Ming-Ji, C. Studies on Anode Effect in Aluminium Electrolysis. Essent. Read. Light Met. 2013, 2, 119–126. [Google Scholar] [CrossRef]
  7. Åsheim, H.; Aarhaug, T.A.; Sandnes, E.; Kjos, O.S.; Solheim, A.; Kolås, S.; Haarberg, G.M. Anode Effect Initiation During Aluminium Electrolysis in A Two Compartment Laboratory Cell. Light Metals 2016, 551–556. [Google Scholar] [CrossRef]
  8. Environmental Panel on Climate Change. Climate Change 2007 Physical Science Basis; Working Group i Contribution Fourth Assessment Report IPCC; Climatology and Climate Change; Cambridge University Press: Cambridge, UK, 2007; Available online: https://www.cambridge.org/br/academic/subjects/earth-and-environmental-science/climatology-and-climate-change/climate-change-2007-physical-science-basis-working-group-i-contribution-fourth-assessment-report-ipcc?format=PB&isbn=9780521705967 (accessed on 20 July 2020).
  9. Vogt, H. On the mechanism of the anode effect in aluminum electrolysis. Metall. Mater. Trans. B Process Metall. Mater. Process. Sci. 2000, 31, 1225–1230. [Google Scholar] [CrossRef]
  10. Vogt, H. The anode effect as a fluid dynamic problem. J. Appl. Electrochem. 1999, 29, 137–145. [Google Scholar] [CrossRef]
  11. Vogt, H. Effect of alumina concentration on the incipience of the anode effect in aluminum electrolysis. J. Appl. Electrochem. 1999, 29, 779–788. [Google Scholar] [CrossRef]
  12. Jones, S.F.; Evans, G.M.; Galvin, K.P. Bubble nucleation from gas cavities—A review. Adv. Colloid Interface Sci. 1999, 80, 27–50. [Google Scholar] [CrossRef]
  13. Einarsrud, K.E.; Johansen, S.T. Modelling of bubble behaviour in aluminium reduction cells. Prog. Comput. Fluid Dyn. 2012, 12, 119. [Google Scholar] [CrossRef]
  14. Vachaparambil, K.J.; Einarsrud, K.E. Explanation of Bubble Nucleation Mechanisms: A Gradient Theory Approach. J. Electrochem. Soc. 2018, 165, E504–E512. [Google Scholar] [CrossRef]
  15. Lubetkin, S.D. Why is it much easier to nucleate gas bubbles than theory predicts? Langmuir 2003, 19, 2575. [Google Scholar] [CrossRef]
  16. Haas, T.; Hilgendorf, S.; Vogel, H.; Friedrich, B.; Pfeifer, H. A Comparison between Two Cell Designs for Electrochemical Neodymium Reduction Using Numerical Simulation. Metall. Mater. Trans. B 2017, 48, 2187–2194. [Google Scholar] [CrossRef]
  17. Shibata, S. Supersaturation of oxygen in acidic solution in the vicinity of an oxygen-evolving platinum anode. Electrochim. Acta 1978, 23, 619–623. [Google Scholar] [CrossRef]
  18. Vogt, H. Mechanisms of mass transfer of dissolved gas from a gas-evolving electrode and their effect on mass transfer coefficient and concentration overpotential. J. Appl. Electrochem. 1989, 19, 713–719. [Google Scholar] [CrossRef]
  19. Vogt, H. The Quantities Affecting the Bubble Coverage of Gas-Evolving Electrodes. Electrochim. Acta 2017, 235, 495–499. [Google Scholar] [CrossRef]
  20. Vogt, H.; Stephan, K. Local microprocesses at gas-evolving electrodes and their influence on mass transfer. Electrochim. Acta 2015, 155, 348–356. [Google Scholar] [CrossRef]
  21. Scriven, L.E. On the dynamics of phase growth. Chem. Eng. Sci. 1959, 10, 1–13. [Google Scholar] [CrossRef]
  22. Moreno Soto, A. Bubbles on Surfaces: Diffusive Growth and Electrolysis; University of Twente: Enschede, The Netherlands, 2019. [Google Scholar]
  23. Ishii, M.; Zuber, N. Drag coefficient and relative velocity in bubbly, droplet or particulate flows. AIChE J. 1979, 25, 843–855. [Google Scholar] [CrossRef]
  24. Vogt, H.; Thonstad, J. The voltage of alumina reduction cells prior to the anode effect. J. Appl. Electrochem. 2002, 32, 241–249. [Google Scholar] [CrossRef]
  25. Hu, X.; Wang, Z.; Gao, B.; Shi, Z.; Liu, F.; Cao, X. Density and ionic structure of NdF3-LiF melts. J. Rare Earths 2010, 28, 587–590. [Google Scholar] [CrossRef]
  26. Hu, X.; Wang, Z.; Shi, Z.; Gao, B.; Lu, G.; Cui, J.; Cao, X.; Zhang, B. Electrical conductivity and Nd solubility of NdF3-LiF-Nd 2O3 melts. In Proceedings of the TMS Annual Meeting, Orlando, FL, USA, 25 February–1 March 2007; pp. 77–80. [Google Scholar]
  27. Liu, K.R.; Chen, J.S.; Han, Q.; Wei, X.J. Study of anodic overvoltage in neodymium electrolysis. Acta Metall. Sin. 2003, 16, 355–359. [Google Scholar]
  28. Cai, B.; Liu, H.; Kou, F.; Yang, Y.; Yao, B.; Chen, X.; Wong, D.S.; Zhang, L.; Li, J.; Kuang, G.; et al. Estimating perfluorocarbon emission factors for industrial rare earth metal electrolysis. Resour. Conserv. Recycl. 2018, 136, 315–323. [Google Scholar] [CrossRef]
  29. Guo, X.; Sun, Z.; Sietsma, J.; Blanpain, B.; Guo, M.; Yang, Y. Quantitative Study on Dissolution Behavior of Nd2O3 in Fluoride Melts. Ind. Eng. Chem. Res. 2018, 57, 1380–1388. [Google Scholar] [CrossRef] [Green Version]
  30. Feldhaus, D.; Tshcauner, M.; Friedrich, B. Influence of LiF on the synthesis of the neodymium & praseodymium molten salt electrolysis. In Proceedings of the EMC, Web Conference, 27–30 June 2021; pp. 189–200. [Google Scholar]
  31. Vogt, H. The actual current density of gas-evolving electrodes—Notes on the bubble coverage. Electrochim. Acta 2012, 78, 183–187. [Google Scholar] [CrossRef]
  32. Zhu, X.; Sun, S.; Lu, S.; Huang, X.; Li, K.; Tu, G.; Huang, X.; Huang, S. Surface tension of light rare earth fluoride molten salts electrolyte system. Thermochim. Acta 2016, 636, 42–47. [Google Scholar] [CrossRef]
  33. Lubetkin, S.; Blackwell, M. The nucleation of bubbles in supersaturated solutions. J. Colloid Interface Sci. 1988, 126, 610–615. [Google Scholar] [CrossRef]
  34. Haverkamp, R.G. An XPS study of the fluorination of carbon anodes in molten NaF–AlF3–CaF2. J. Mater. Sci. 2012, 47, 1262–1267. [Google Scholar] [CrossRef]
  35. Angulo, A.; van der Linde, P.; Gardeniers, H.; Modestino, M.; Fernández Rivas, D. Influence of Bubbles on the Energy Conversion Efficiency of Electrochemical Reactors. Joule 2020, 4, 555–579. [Google Scholar] [CrossRef] [Green Version]
  36. Berkani, M.; Gaune-Escard, M. Study of binary systems NdF3- MF (M = Li, Na, K): Experimental, modeling and thermodynamic computation. MATEC Web Conf. 2013, 3, 1033. [Google Scholar] [CrossRef]
Figure 1. Bubble evolution during didymium electrolysis in: (a) stable operational conditions; (b) unstable operational conditions.
Metals 12 00498 g001
Figure 2. Bubble coverage fraction as a function of bubble mean size.
Metals 12 00498 g002
Figure 3. Cell voltage for different anode coverage values.
Metals 12 00498 g003
Figure 4. (a) Principal contributions to the overall cell voltage; (b) anodic overpotential due to charge transfer and gas diffusion.
Metals 12 00498 g004
Figure 5. (a) Applied current and estimated oxide content evolution with time; (b) measured cell voltage compared to the model for stable operation.
Metals 12 00498 g005
Figure 6. (a) Applied current and estimated oxide content; (b) measured cell voltage compared to the model for unstable operation.
Metals 12 00498 g006
Figure 7. Overall cell potential for different: (a) current densities; (b) oxide contents; (c), viscosities; (d) electrolyte compositions.
Metals 12 00498 g007
Figure 8. Schematic representation of the relation of the overall cell potential to different factors considered in this study. Arrows in the block: —increase; —decrease; —high feeding rate or above saturation.
Metals 12 00498 g008
Table 1. Electrochemical cell geometry and properties.
Cell Data
Anode inner diameter Da [m]0.12
Immersed anode length L [m]0.1
Cathode diameter Dc [m]0.00635
Current I [A]25–150
Temperature T [K]1323
Properties
ρ L [kg m−3] [25]4040
μ L [Pa s] [16]4.95 × 10⁻³
D [m2 s−1]9.9 × 10⁻⁹
s e l   [S m−1] [26] 2.111 + 0.005323 T 273 + 0.0322 P L i F 0.1026 P N d 2 O 3
jo [A m−2] [2]1000
Csat [mol m−3] [2]100
α [27]0.5
η 0.7
ρ e l = 1 / s e l .
Publisher’s Note: MDPI stays neutral with regard to jurisdictional claims in published maps and institutional affiliations.

