Abstract
A laboratory-scale procedure was developed to obtain lanthanum oxide from spent fluid catalytic cracking catalyst, commonly used in the heavy crude oil cracking process. Two different solids, consisting mainly of silica, alumina, and a certain amount of rare earth elements, were leached under several conditions to recover the rare earths. Nitric acid leaching lead to the highest recovery of lanthanum, reaching a recovery percentage greater than 95% when a 1.5 M concentration was used. Subsequently, liquid phases were subjected to a liquid–liquid extraction process using Cyanex 923 diluted in Solvesso 100, and the lanthanum was quantitatively extracted. Lanthanum was also quantitatively stripped using oxalic acid to obtain the corresponding lanthanum oxalates, as revealed by X-ray diffraction (XRD), thermogravimetric analysis (TGA), differential thermal analysis (DTA), and Fourier transform infrared (FTIR) techniques. After thermal treatment at 1200 °C for 2 h, these solids yielded lanthanum oxide.
1. Introduction
Fluid catalytic cracking is a widely used process in crude oil processing in petroleum refineries, to ‘crack’ the heavy crude oil into lighter products under the action of catalysts at high temperatures [1,2]. The FCC catalyst process was established in the last century in order to improve gasoline production and increase the octane number of the fuel [3]. However, this process consumes a great amount of catalyst. It is estimated that more than 700,000 ton are consumed worldwide annually [4]. Normally, FCC catalyst consists of a rare earth-ultra-stabilized zeolite (USY-zeolite) held in an amorphous silica–alumina matrix [5,6]. The use of rare earths (REEs) in FCC catalysts, especially La and Ce, arose from the need for the use of more active and stable products, with high yield performance [7,8]. Addition of REEs improves the catalytic activity and prevents the loss of acid sites during operation [7].
During the process, the FCC catalyst is frequently purged and replaced with fresh catalyst to manage the process performance [9]. The withdrawn material discharged during the FCC catalyst process is called spent FCC catalyst (sFCC), or equilibrium catalyst (Ecat). This waste slag contains REEs and aluminum [2,10], among other elements. The amount of spent FCC catalyst generated annually is uncertain or even unknown. Nevertheless, some estimates in recent years have put production at 840,000 ton per year [8], revealing the great extent of the problem. Most of the spent FCC is disposed of in landfills [11], which can lead to serious environmental pollution and human health problems, therefore it is must be treated properly. Because spent FCC catalyst powders are mainly composed of active silica (SiO2) and alumina (Al2O3), the final spent FCC catalyst can subsequently be employed as raw material for cement, or as a partial replacement for cement or sand in cement mortars [12,13]. However, the amount of spent catalyst that can be incorporated in cementitious materials is limited, and the added value of these applications is low. Due to the relatively high amounts of alumina and silica in spent FCC catalysts, an attractive option for decreasing the environmental impact generated by their final disposal is their recycling as feedstock for mullite refractories. Such an application would allow large volumes of material to be recycled and conserve large volumes of minerals [14].
On the other hand, due to their unique physicochemical properties, REEs are indispensable elements in the high technology industry and are widely used in a variety of advanced applications [2,4,15]. Due to their wide variety of uses in electrical and electronic technology development, the demand for rare earths is increasing day-to-day, indicating that natural resources requirements will also continue to increase [16]. Secondary resources such as manufacturing waste and used rare-earth-based materials could be an interesting alternative to meet REE demand; therefore, secondary-resource processing will become a necessity [17].
One rare earth oxide widely used in catalysts is lanthanum oxide (La2O3). Thus, considering the great amount of spent FCC generated and its content of REEs, recovery of La from the recycling of spent FCC materials could be an important source of this rare earth [18].
Hydrometallurgical methods which involve leaching, precipitation, solvent extraction, and/or ion exchange processes have been used to recover metal from different wastes [19,20].
REE recovery from spent FCC has previously been reported using different conditions such as mineral acids [21], basic media [22], and/or organic acids [23]. Even different leaching conditions to extract REEs from the sFCC solid have been reported [19,21]. However, despite numerous laboratory-scale studies having been published regarding the recovery of REEs from several residues or waste [21], no processes have been developed on an industrial scale.
In this work, a laboratory-scale process for lanthanum extraction from two spent FCC catalysts with very different amounts of La2O3, and the final obtention of La2O3 was assessed. Then, we evaluated of the insoluble residues obtained from the process as raw materials for refractories. The final amounts of impurities, in particular of La2O3, and the alumina/silica ratio in the insoluble residues were analyzed for their possible application [14].
Several conditions were analyzed to recover lanthanum from the spent fluid catalytic cracking catalyst initial solids by a leaching process. Different leaching agents, as well as concentrations, were evaluated. Subsequently, liquid–liquid extraction was carried out to selectively separate the rare-earths of interest. Various conditions were also assessed. Finally, lanthanum stripped in the liquid phase was precipitated, and the solid formed was thermally treated to obtain pure lanthanum oxide as product.
2. Materials and Methods
The two different spent fluid catalytic cracking catalyst powders investigated were named SC1 and SC2. Raw materials were provided by the Research Center of CEPSA (Compañia Española de Petróleos S.A., Madrid, Spain).
2.1. Leaching Process of the Spent Fluid Catalytic Cracking Catalyst Powders
Different conditions were evaluated in order to recover lanthanum from the spent fluid catalytic cracking catalysts powders (FCC) (i.e., SC1 and SC2).
Based on previous investigations related to the recovery of REE from spent FCC [2,21,22,23], hydrochloric acid (HCl), nitric acid (HNO3), oxalic acid (C2H2O4, OA), and sodium hydroxide (NaOH) were used. All the chemicals used were of laboratory reagent grade. SC1 and SC2 powders were put in contact with a leaching solution in a glass reactor at 60 °C for 4 h using a solid/liquid ratio (S/L) equal to 10. The leaching process was carried out into a large-capacity glass reactor. Previous investigations have reported that an increase in the temperature improves the recovery of the metals [2]. The final mixtures were filtered, and the final solids were dried. Lanthanum content in each liquid phase was analyzed to evaluate the efficiency of the leaching process.
2.2. Liquid–Liquid Extraction Procedure
Leached feed solutions were used for the liquid–liquid extraction experiments. The extractant used was the commercially available Cyanex 923, which is composed of four phosphine oxides (R3PO, R2R’PO, RR2’PO, and R3PO) where R = n-octyl and R’ = n-hexyl. The extractant was used undiluted or diluted in Solvesso 100 (aromatic diluent).
Extractions were carried out in thermostatic separator funnels with mechanical stirring via a four blades impeller (2.5 cm diameter). Various aqueous to organic (A/O) ratios were investigated. After phase disengagement, typically 2–3 min, the lanthanum and acid contents remaining in the raffinate (aqueous solution) were analyzed. Their content in the equilibrated organic phases was calculated by the mass balance.
Lanthanum content in liquid phases was analyzed by inductively coupled plasma optical emission spectrometry (ICP-OES) using an Agilent ICP-OES model 5100 VDV (Agilent Technologies, California, USA). In addition, acid content was analyzed by titration with standard NaOH solution using bromothymol blue as indicator.
2.3. Stripping
In the stripping procedure, organic phases loaded with 7.8 g/L La (SC-1) or 20 g/L La (SC-2) and 1 M oxalic acid solutions, in the case of SC-1, or 2 M oxalic acid solution, in the case of SC-2, were put into contact, at room temperature during 30 min, using 1/1 volume ratio:
Stripping yield was calculated accordingly with the next relationship:
where the subscripts exp and cal represent the experimental and calculated (according to the stoichiometry of Equation (1)) weights of the precipitate, respectively.
The precipitates were then centrifuged and subsequently calcinated at 1200 °C for 2 h in order to yield the La2O3 phase.
It should be noted that in the described process the extractant is regenerated, thus, it can be recycled and reused to another extraction step.
The schematic procedure of the tests carried out is summarized in Figure 1.
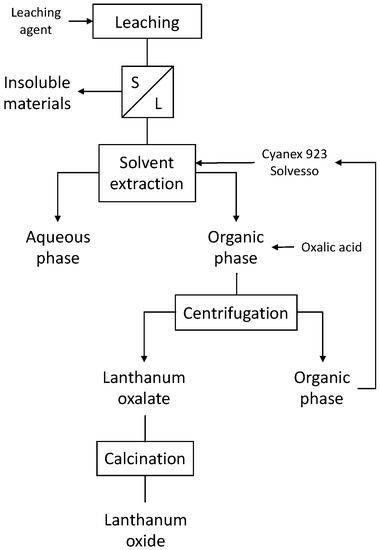
Figure 1.
Schematic process for the obtention of lanthanum oxide.
2.4. Characterization
The chemical composition of the starting powders was determined by X-ray fluorescence (XRF) using a PANalytical Axios wavelength-dispersive spectrometer (4 kW) (PANalytical, Malvern, UK).
Lanthanum content in the liquid phases was analyzed by inductively coupled plasma-optical emission spectrometry (ICP-OES) using an Agilent 5100 VDV model (Agilent Technologies, California, USA), with an associated analytical error of ±2%.
The structural characterization of the final solids was carried out by X-ray diffraction (XRD) using a Siemens D5000 diffractometer ( Siemens AG, Munich, Germany) equipped with a Cu anode (Cu Kα,1 radiation) and a LiF monochromator.
Thermal decomposition of the precursor powders was analyzed by thermogravimetric analysis (TGA) and differential thermal analysis (DTA) using a differential thermal analyzer from 20 °C to 900 °C with a 10 °C/min heating rate, using as an inert medium helium gas, and aluminum oxide was used as reference material.
Fourier-transformed infrared spectroscopy (FTIR) using a Varian 670 FTIR spectrometer (Varian Inc., Palo Alto, CA, USA) within the frequency range 4000–400 cm−1 in transmittance mode with a spectral resolution of 4 cm−1 was also performed. Measurements were carried out using the KBr pellet technique.
Average particle distribution for the final products was analyzed using a Malvern Mastersizer 3000 (PANalytical, Malvern, UK) laser particle size analyzer. Measurements were carried out at room temperature, using water as the dispersant.
Finally, the morphological characterization was performed by scanning electron microscopy (SEM) using a JEOL-6400 electron microscope (JEOL Ltd., Concord, MA, USA) operating at 20 kV. For sample preparation, the powder samples were placed on an adhesive conductive carbon disk and gold coated.
3. Results and Discussion
Figure 2 shows the XRD patterns of both initial powders. In both cases, more intense diffraction maxima correspond to a Y-type zeolite (JCPDS 01-077-1549) (marked as a triangle) as the main crystalline phase. Some reflections that can be attributed to ZSM-5 zeolite (JCPDS 00-044-0002) can be also seen (marked as a circle). These results agree with previously reported studies, where spent fluid catalytic cracking catalysts usually contain Zeolite-Y and ZSM-5 zeolite [24,25,26].
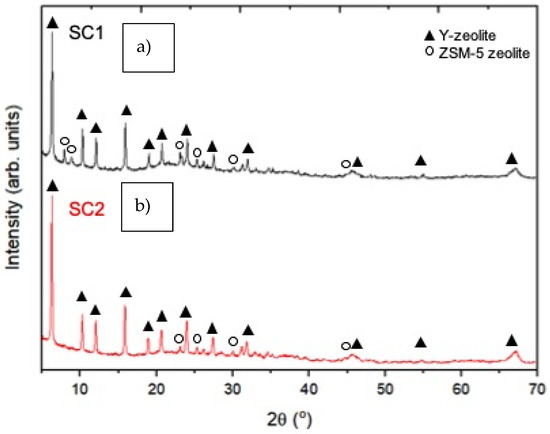
Figure 2.
X-ray diffraction patterns of the (a) SC1 and (b) SC2 samples.
The chemical compositions of the two starting spent FCC powders are shown in Table 1. According to the authors of [7], both powders are mainly composed of alumina and silica. The nature and amounts of the minor impurities are similar, while the lanthanum contents are significantly different.

Table 1.
Chemical composition (wt%) for both spent FCC powders.
3.1. Leaching of the Spent FCCs
To recover lanthanum from both powders, tests were carried out using a leaching agent concentration of 2 M. Table 2 shows the lanthanum concentrations in the leaching solutions for each experiment carried out. Lanthanum recovery percentages from both starting powders by modifying the leaching conditions are shown in Figure 3.
Table 2.
Lanthanum concentration in the leaching solutions for both spent FCC powders.
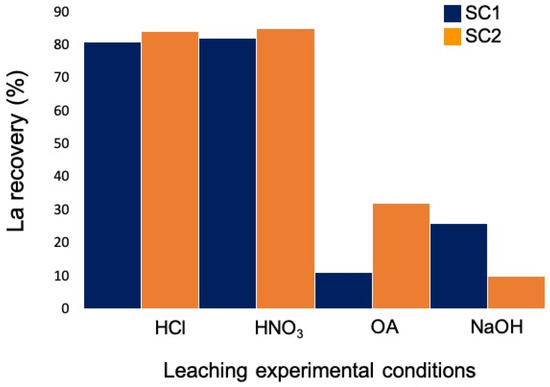
Figure 3.
Experimental conditions and lanthanum recovery of the different tests carried out from SC1 (blue) and SC2 (orange) powders.
Lanthanum recovery from both starting powders using OA as well as NaOH was poor. Therefore, these experimental conditions were not pursued. The highest recovery percentages were obtained when HCl and HNO3 were used as leaching agents.
In order to increase the lanthanum recovery percentage, several additional tests were carried out using HNO3 in the same experimental conditions (i.e., 60 °C for 4 h, at a 100 g/L pulp density), but varying the acid concentration. The obtained results are summarized in Table 3.
Table 3.
Experimental conditions and lanthanum recovery of the different tests carried out from both starting powders.
The obtained results showed that the highest recovery percentage was found using a leached concentration of 1.5 M.
Table 4 shows the chemical composition for both insoluble residues (called SC1-B and SC2-B, respectively) after the leaching process using the optimal conditions. Lanthanum content in the final solids was practically negligible. As can also be seen in Table 3, lanthanum extraction from the spent FCC catalysts leads to partial extraction of aluminum from the solids.
Table 4.
Chemical compositions (wt%) for both spent FCC insoluble residue powders.
Based the obtained results, the leached phases using nitric acid of 1.5 M (i.e., Nº 9 and Nº 12) were subsequently used for the liquid–liquid extraction process due to their higher lanthanum content.
3.2. Extraction of the Lanthanum from the Spent FCC
The recovery of lanthanum was investigated using a liquid–liquid extraction methodology from starting liquid solutions composed of 1.1 g/L La and 1.5 M nitric acid.
3.2.1. Extraction of Lanthanum from Leaching Solutions
Previous experiments showed that the equilibrium of both lanthanum and nitric acid extractions was reached after 5 min of contact between the organic phase and acid aqueous feed solutions. Thus, 10 min was used as the contact time in all cases.
The effect of the aqueous/organic ratio (A/O ratio), and the extractant concentration on lanthanum and nitric acid loading onto the organic phase were investigated. The results of these investigations are shown in Figure 4 and Figure 5.
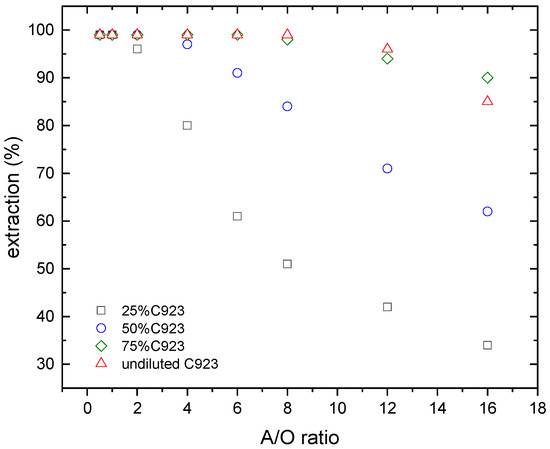
Figure 4.
Lanthanum extraction at various Cyanex 923 concentrations. Temperature: 20 °C.
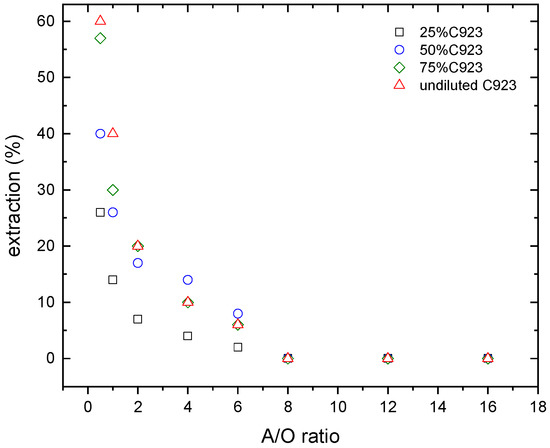
Figure 5.
Nitric acid extraction at various Cyanex 923 concentrations. Temperature: 20 °C.
In the case of lanthanum, the percentage of lanthanum extraction increased with the extractant concentration (i.e., A/O low ratios), where lanthanum was practically quantitatively extracted from the leach solution.
The responsible equilibrium for the lanthanum extraction could be represented by the Equation (3):
where L is the organic extractant, and the subscripts aq and org are the aqueous and organic phases, respectively.
The extraction constant for the above equilibrium (Equation (4)) can be defined as:
and the definition of the lanthanum distribution coefficient (Equation (5)) is:
where and are the total metal concentrations in the organic and aqueous phases at equilibrium, respectively.
Thus, by substituting in (Equation (3)) and subsequent rearranging leads to the Equation (6):
A plot of versus , for the experimental data obtained in the present work, gives an estimate of the value of the stoichiometric n coefficient. The plot indicated that the slope was 3.4 (r2 = 0.9636), thus it was logical to assign a value of 3 for the n coefficient in Equation (4).
Once the above estimation was done, the experimental data were treated numerically by a tailored computer program in order to confirm the proposed model. This program searched the best set of extraction constants that minimized the squares error sum, defined as:
where and are the experimental and calculated metal distribution coefficients, respectively. was obtained by solving the mass balance equation for lanthanum, extractant and nitrate, assuming a set of species and constants.
The best fit was obtained using the formation of La(NO3)3·3 L species in the organic phase, as derived from the graphical treatment of the data, with a value of the extraction constant according to:
In the case of the nitric acid extraction (Figure 6), similar results were found. The nitric acid extraction decreases with the A/O ratio. Despite that, at the lowest A/O ratio investigated (i.e., A/O = 0.5), the maximum nitric acid extraction reached 60% when undiluted Cyanex 923 was used as extractant phase.
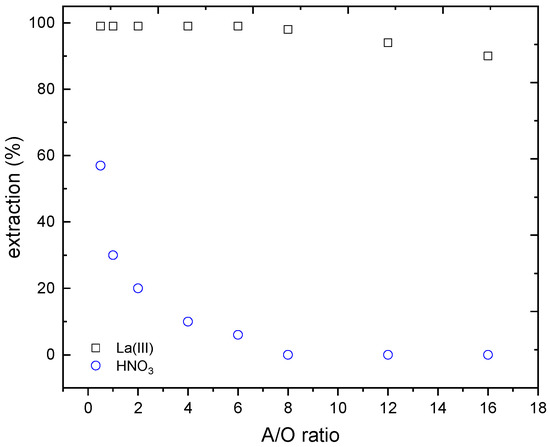
Figure 6.
Separation La(III)-HNO3 at various A/O ratios. Organic phase: 75% v/v Cyanex 923 in Solvesso 100. Temperature: 20 °C.
The results obtained in the separation of lanthanum from the nitric acid are plotted in Figure 6.
Effectively, using the A/O ratio of 8, a quantitative La-HNO3 was obtained, since DLa = 355, and not nitric acid extraction was achieved. In this condition, lanthanum concentration in the organic phase reached 7.8 g/L, thus a metal concentration factor near 8 was reached just in one step (it should be noted that the initial concentration of lanthanum in the aqueous phase was 1.1 g/L). Moreover, after the proper acid adjustment, the raffinate can be recycled for another leaching step.
The responsible equilibrium for the nitric acid extraction could be represented by Equation (9) at these nitric acid concentrations (at around 1–2 M) since the value of the extraction constant was dependent on the diluent used in the organic phase [27].
3.2.2. Stripping Process
Finally, the obtained organic phases with concentrated lanthanum were stripped according to the procedure described in Section 2.3. Mixtures were mechanically stirred until the formation of a solid precipitate. After some minutes, the final mixtures were centrifugated and the solids were dried at 80 °C for 24 h to obtain the corresponding lanthanum oxalates with a yield higher than 87% in both cases.
The obtained results demonstrate that it is possible to recover 8.7 g and 20.7 g of lanthanum from 100 g of SC1 and SC2 spent fluid catalytic cracking catalysts, respectively.
3.3. Characterization of the Final Solid Products
3.3.1. X-ray Diffraction (XRD)
XRD patterns of the final solids are shown in Figure 7. In the case of the stripped solids using oxalic acid (Figure 7a), poorly defined diffraction maxima were obtained. These results could be due to the presence of the organic phase in the powder samples. After the stripping of the organic phase, an small amount of Cyanex 923 could adhere onto the surface of the particles, resulting in an amorphous diffraction pattern. Nonetheless, the diffraction maxima can be attributed to the lanthanum oxalate in both cases. These results reveal the formation of the lanthanum oxalate phase as a unique phase, which can be used as a precursor to the corresponding lanthanum oxide.
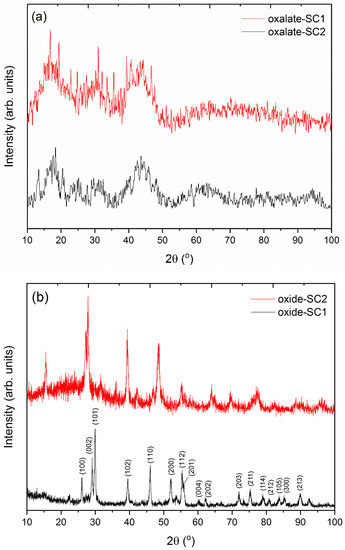
Figure 7.
XRD patterns of (a) the stripped precursor solids and (b) after the subsequent thermal treatment.
After the subsequent thermal treatment at 1200 °C for 2 h of both samples, several diffraction maxima were found in the XRD patterns (Figure 7b). All diffraction maxima can be indexed to a La2O3 phase. Miller indices for the more intense diffraction maxima are also shown in each corresponding peak. No peaks attributable to secondary phases were detected within the sensitivity of the experimental system used, which reveals the purity of the obtained samples.
In addition, the chemical composition of the final lanthanum oxides was analyzed by XRF. The obtained results are shown below (Table 5). Some minor impurities of cerium and aluminum were found. However, the obtained results reveal that the final oxides are mainly composed of lanthanum.
Table 5.
Chemical composition (wt%) for the obtained lanthanum oxides.
These results demonstrate that it is possible to recover lanthanum from spent FCC catalysts and to yield lanthanum oxide.
3.3.2. Thermogravimetric Analysis (TGA) and Differential Thermal Analysis (DTA)
Thermal decomposition of the stripping solids was examined by thermogravimetric analysis (TGA) and differential thermal analysis (DTA). Similar thermal decomposition behavior was found in both precursor samples. As an example, Figure 8 shows DTA/TGA curves for the lanthanum oxalate sample obtained after the corresponding stripping step.
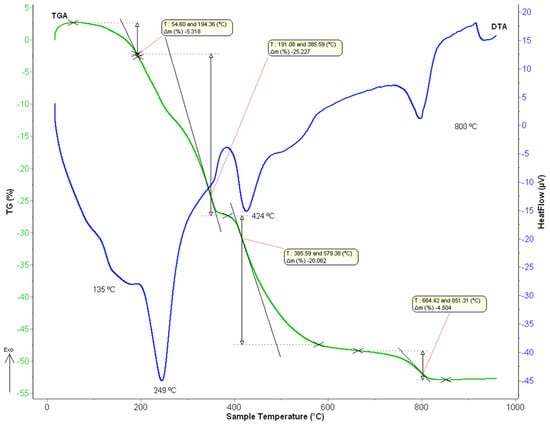
Figure 8.
DTA/TGA curves of the obtained lanthanum oxalates.
Different endothermic peaks were found. First, an endothermic peak can be observed in the range of 106 °C–191 °C with a maximum centered at 135 °C, with a mass loss of about 5.3 wt%, which can be assigned to the loss of two water molecules to the lanthanum oxalate decahydrate. On the other hand, a second endothermic peak can be seen between 191 °C and 385 °C (Tmax = 249 °C), corresponding to a mass loss of 25.2 wt%. This result could be attributed to the loss of six water molecules and the formation of anhydrous lanthanum oxalate. The next endothermic peak appears in the range of 383–488 °C (Tmax = 424 °C) with a mass loss of 21 wt% which can be attributed to the formation of lanthanum carbonate basic or La-dioxycarbonate, according to Equation (10):
Finally, the last endothermic peak can be observed at around 664 °C–840 °C (Tmax = 800 °C), which corresponds to the lanthanum oxide formation with a mass loss of about 4.5 wt%, according to the Equation (11):
The thermal decomposition of lanthanum oxalate decahydrate has previously been described by Grivel et al. [28] and Purwani et al. [29] through three steps: first, the loss of 10 water molecules to form the anhydrous acetate; next, the formation of lanthanum carbonate basic, and finally, the formation of lanthanum oxide. Lanthanum oxalate decomposition has been reported by Balboul et al. [30] as occurring in twelve steps, which include the loss of water molecules, the formation of different basic carbonates (La2(CO3)2, La2O(CO3)2 y La2O2CO3) and finally, the formation of lanthanum oxide. Zhan et al. [31] described the decomposition of lanthanum oxalate decahydrate through three endothermic dehydration reactions in which the loss of six, two, and two water molecules occurs, followed by the formation of lanthanum carbonate basic (Tmax = 410 °C), and the formation of lanthanum oxide (Tmax = 708 °C).
The dehydration process proposed in the present work is slightly different in the dehydration stages. This result could be a consequence of the obtention process of the lanthanum oxalate by precipitation with oxalic acid in an organic medium.
3.3.3. Fourier Transform Infrared (FTIR)
FTIR spectra of the lanthanum oxalates are exhibited in Figure 9. The corresponding assignations of each registered band are also shown [32,33,34]. A broad emission band can be seen with a peak at 3500 cm−1 that can be attributed to the –OH of the carboxylic group. According to their structure, oxalates do not exhibit this type of H+ so the presence of this band suggested the presence of the coordinate H2O molecules, and a strong link between the chemical structure and the oxalate. Other bands at around 1600 cm−1 and 1500 cm−1, which can be attributed to the asymmetric and the symmetric vibrations of the carboxylate group, respectively, can also be seen. The intense band at around 1300 cm−1 corresponds to the asymmetric tension of the C-O bond. A typical band of this type of compound was found at 800 cm−1 and corresponds to the vibration of the La-O bond, as well as the bending of the O-C=O group. In addition, a band at around 650 cm−1 was observed, related to the content of water molecules. Finally, the band at 500 cm−1 is related to the La-O bond vibration, and the chelated ligand ring deformation.
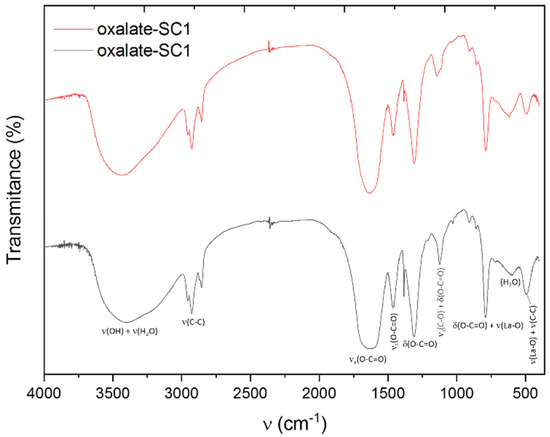
Figure 9.
FTIR spectrum of the obtained oxalates.
3.3.4. Scanning Electron Microscopy (SEM)
Figure 10 exhibits SEM micrographs of the lanthanum oxalates (Figure 10a,b) obtained from both initial sFCC powders, and the corresponding lanthanum oxides after the thermal treatment (Figure 9).
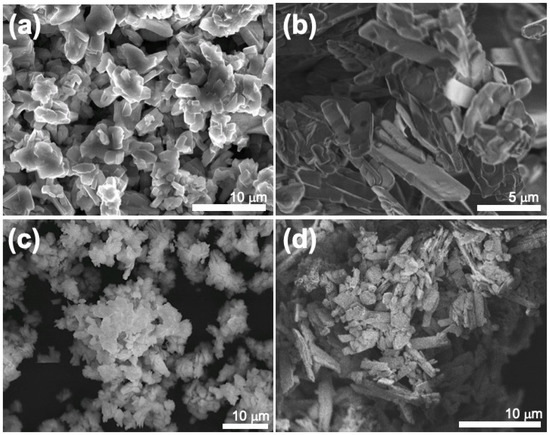
Figure 10.
SEM micrographs of (a,b) lanthanum oxalates and (c,d) lanthanum oxides samples.
Agglomerations of approximately sheet-like particles were found in the case of the obtained lanthanum oxalates (Figure 10a,b). After the thermal treatment at 1200 °C for 2 h (Figure 10c,d), the powder samples exhibit nanoparticle agglomerates with irregular particle shape and size. This morphology is in good agreement with that previously reported in calcined samples of La2O3 composition [35].
3.3.5. Granulometric Analyses
The particle size distribution graph of lanthanum oxide is shown in Figure 11. The curve of the granulometric distribution (sigmoidal line) represents the particle-size distribution expressed as % volume. Classical granulometric parameters D50, and D90 were used to characterize the final product. DX designates the diameter for which X% of the particles have a smaller size. The calculated D50 (medium), and D90 particle sizes were 14.3 µm and 168 µm, respectively.
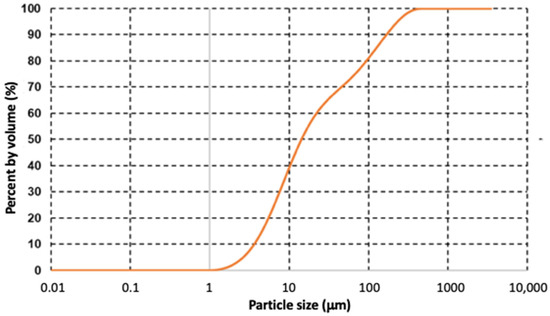
Figure 11.
Particle size distribution of lanthanum oxide.
4. Conclusions
An effective process to obtain lanthanum oxide from spent fluid catalytic cracking catalysts was assessed using two different solids. Several leaching conditions were evaluated to extract lanthanum from the initial solids. The highest lanthanum recovery percentage was found using nitric acid with a 1.5 M concentration for both samples investigated. Subsequently, the liquid–liquid extraction process using Cyanex923 (Barcelona, Spain) undiluted, and diluted using Solvesso100 (Exxon Mobil, Texas, USA), was investigated to selectively separate lanthanum from nitric acid. Optimal separation was found with an aqueous/organic (A/O) ratio of 8. Finally, lanthanum was stripped from the organic phases using oxalic acid to precipitate the corresponding lanthanum oxalate. After thermal treatment at 1200 °C for 2 h, pure lanthanum oxide was effectively obtained. The present work demonstrates that it is possible to obtain lanthanum oxide from different spent fluid catalytic cracking catalysts powders.
Author Contributions
L.A. methodology, validation, formal analysis, investigation, writing—original draft preparation, writing—review and editing; O.R.L., F.J.A., M.Á.M., C.B. and F.A.L. methodology, validation, formal analysis, investigation; F.J.A., C.B. and F.A.L., conceptualization, methodology investigation, writing, funding acquisition, supervision, project administration. All authors have read and agreed to the published version of the manuscript.
Funding
This research received no external funding.
Data Availability Statement
The data presented in this study are available on request from the corresponding authors.
Acknowledgments
Thanks to CEPSA Research Center (Spain).
Conflicts of Interest
The authors declare no conflict of interest.
References
- Le, T.; Wang, Q.; Ravindra, A.V.; Li, X.; Ju, S. Microwave intensified synthesis of Zeolite-Y from spent FCC catalyst after acid activation. J. Alloys Compd. 2019, 776, 437–446. [Google Scholar] [CrossRef]
- Wang, J.; Huang, X.; Cui, D.; Wang, L.; Feng, Z.; Hu, B.; Long, Z.; Zhao, N. Recovery of rare earths and aluminum from FCC waste slag by acid leaching and selective precipitation. J. Rare Earths 2017, 35, 1141–1148. [Google Scholar] [CrossRef]
- Sposato, C.; Catizzone, E.; Blasi, A.; Forte, M.; Romanelli, A.; Morgana, M.; Braccio, G.; Giordano, G.; Migliori, M. Towards the circular economy of rare earth elements: Lanthanum leaching from spent FCC catalyst by acids. Processes 2021, 9, 1369. [Google Scholar] [CrossRef]
- Zhou, Y.; Schulz, S.; Lindoy, L.F.; Du, H.; Zheng, S.; Wenzel, M.; Weigand, J.J. Separation and recovery of rare earths by in situ selective electrochemical oxidation and extraction from spent fluid catalytic cracking (FCC) catalysts. Hydrometallurgy 2020, 194, 105300. [Google Scholar] [CrossRef]
- Silva, J.S.; Medeiros de Jesus-Neto, R.; Fiuza, R.A.; Gonçalves, J.P.; Mascarenhas, A.J.S.; Andrade, H.M.C. Alkali-activation of spent fluid cracking catalysts for CO 2 capture. Microporous Mesoporous Mater. 2016, 232, 1–12. [Google Scholar] [CrossRef]
- Senter, C.; Mastry, M.C.; Zhang, C.C.; Maximuck, W.J.; Gladysz, J.A.; Yilmaz, B. Role of chlorides in reactivation of contaminant nickel on fluid catalytic cracking (FCC) catalysts. Appl. Catal. A Gen. 2021, 611, 117978. [Google Scholar] [CrossRef]
- Akah, A. Application of rare earths in fluid catalytic cracking: A review. J. Rare Earths 2017, 35, 941–956. [Google Scholar] [CrossRef]
- Ferella, F.; D’Adamo, I.; Leone, S.; Innocenzi, V.; De Michelis, I.; Vegliò, F. Spent FCC E-Cat: Towards a Circular Approach in the Oil Refining Industry. Sustainability 2018, 11, 113. [Google Scholar] [CrossRef]
- Maidel, M.; de Santana Ponte, M.J.J.; de Araújo Ponte, H.; Valt, R.B.G. Lanthanum recycling from spent FCC catalyst through leaching assisted by electrokinetic remediation: Influence of the process conditions on mass transfer. Sep. Purif. Technol. 2022, 281, 119905. [Google Scholar] [CrossRef]
- Wang, J.; Huang, X.; Wang, L.; Wang, Q.; Yan, Y.; Zhao, N.; Cui, D.; Feng, Z. Kinetics study on the leaching of rare earth and aluminum from FCC catalyst waste slag using hydrochloric acid. Hydrometallurgy 2017, 171, 312–319. [Google Scholar] [CrossRef]
- Akcil, A.; Vegliò, F.; Ferella, F.; Okudan, M.D.; Tuncuk, A. A review of metal recovery from spent petroleum catalysts and ash. Waste Manag. 2015, 45, 420–433. [Google Scholar] [CrossRef] [PubMed]
- Al-Jabri, K.; Baawain, M.; Taha, R.; Al-Kamyani, Z.S.; Al-Shamsi, K.; Ishtieh, A. Potential use of FCC spent catalyst as partial replacement of cement or sand in cement mortars. Constr. Build. Mater. 2013, 39, 77–81. [Google Scholar] [CrossRef]
- Vogt, E.T.C.; Weckhuysen, B.M. Fluid catalytic cracking: Recent developments on the grand old lady of zeolite catalysis. Chem. Soc. Rev. 2015, 44, 7342–7370. [Google Scholar] [CrossRef] [PubMed]
- Restrepo, E.; Vargas, F.; López, E.; Baudín, C. The potential of La-containing spent catalysts from fluid catalytic cracking as feedstock of mullite based refractories. J. Eur. Ceram. Soc. 2020, 40, 6162–6170. [Google Scholar] [CrossRef]
- Maheshwaran, G.; Selva Muneeswari, R.; Nivedhitha Bharathi, A.; Krishna Kumar, M.; Sudhahar, S. Eco-friendly synthesis of lanthanum oxide nanoparticles by Eucalyptus globulus leaf extracts for effective biomedical applications. Mater. Lett. 2021, 283, 128799. [Google Scholar] [CrossRef]
- Balaram, V. Rare earth elements: A review of applications, occurrence, exploration, analysis, recycling, and environmental impact. Geosci. Front. 2019, 10, 1285–1303. [Google Scholar] [CrossRef]
- Jyothi, R.K.; Thenepalli, T.; Ahn, J.W.; Parhi, P.K.; Chung, K.W.; Lee, J.-Y. Review of rare earth elements recovery from secondary resources for clean energy technologies: Grand opportunities to create wealth from waste. J. Clean. Prod. 2020, 267, 122048. [Google Scholar] [CrossRef]
- Chiranjeevi, T.; Pragya, R.; Gupta, S.; Gokak, D.T.; Bhargava, S. Minimization of Waste Spent Catalyst in Refineries. Procedia Environ. Sci. 2016, 35, 610–617. [Google Scholar] [CrossRef]
- Wenzel, M.; Schnaars, K.; Kelly, N.; Götzke, L.; Robles, S.M.; Kretschmer, K.; Le, P.N.; Tung, D.T.; Luong, N.H.; Duc, N.A.; et al. Hydrometallurgical Recovery of Rare Earth Metals from Spent FCC Catalysts; Springer: Cham, Switzerland, 2016; ISBN 9783319486161. [Google Scholar]
- Sadeghi, M.; Jesus, J.; Soares, H. Recycling spent fluid cracking catalysts for rare earth metal recovery: A review. Recycl. Sustain. Dev. 2018, 11, 43–52. [Google Scholar] [CrossRef]
- Zhao, Z.; Qiu, Z.; Yang, J.; Lu, S.; Cao, L.; Zhang, W.; Xu, Y. Recovery of rare earth elements from spent fluid catalytic cracking catalysts using leaching and solvent extraction techniques. Hydrometallurgy 2017, 167, 183–188. [Google Scholar] [CrossRef]
- Wang, J.; Xu, Y.; Wang, L.; Zhao, L.; Wang, Q.; Cui, D.; Long, Z.; Huang, X. Recovery of rare earths and aluminum from FCC catalysts manufacturing slag by stepwise leaching and selective precipitation. J. Environ. Chem. Eng. 2017, 5, 3711–3718. [Google Scholar] [CrossRef]
- Lin, X.; Fan, Y.; Liu, Z.; Shi, G.; Liu, H.; Bao, X. A novel method for enhancing on-stream stability of fluid catalytic cracking (FCC) gasoline hydro-upgrading catalyst: Post-treatment of HZSM-5 zeolite by combined steaming and citric acid leaching. Catal. Today 2007, 125, 185–191. [Google Scholar] [CrossRef]
- Madeti, M.; Lande, S.V.; Kalpana, G.; Mewada, R.K.; Jasra, R.V. A Green Approach. Int. J. Green Nanotechnol. 2013, 1, 194308921350702. [Google Scholar] [CrossRef]
- Gusev, A.A.; Psarras, A.C.; Triantafyllidis, K.S.; Lappas, A.A.; Diddams, P.A.; Vasalos, I.A. ZSM-5 Additive Deactivation with Nickel and Vanadium Metals in the Fluid Catalytic Cracking (FCC) Process. Ind. Eng. Chem. Res. 2020, 59, 2631–2641. [Google Scholar] [CrossRef]
- Ferella, F.; Leone, S.; Innocenzi, V.; De Michelis, I.; Taglieri, G.; Gallucci, K. Synthesis of zeolites from spent fluid catalytic cracking catalyst. J. Clean. Prod. 2019, 230, 910–926. [Google Scholar] [CrossRef]
- Alguacil, F.J.; López, F.A. The extraction of mineral acids by the phosphine oxide Cyanex 923. Hydrometallurgy 1996, 42, 245–255. [Google Scholar] [CrossRef]
- Grivel, J.-C.; Zhao, Y.; Suarez Guevara, M.J.; Watenphul, A. Studies on the thermal decomposition of lanthanum(III) valerate and lanthanum(III) caproate in argon. Thermochim. Acta 2015, 612, 1–9. [Google Scholar] [CrossRef]
- Purwani, M.V.; Suyanti, S.; Adi, W.A. THERMAL DECOMPOSITION KINETICS OF LANTHANUM OXALATE HYDRATE PRODUCT TREATMENT FROM MONAZITE. J. Sains Mater. Indones. 2019, 20, 50. [Google Scholar] [CrossRef][Green Version]
- Balboul, B.A.; El-Roudi, A.M.; Samir, E.; Othman, A.G. Non-isothermal studies of the decomposition course of lanthanum oxalate decahydrate. Thermochim. Acta 2002, 387, 109–114. [Google Scholar] [CrossRef]
- ZHAN, G.; YU, J.; XU, Z.; ZHOU, F.; CHI, R. Kinetics of thermal decomposition of lanthanum oxalate hydrate. Trans. Nonferrous Met. Soc. China 2012, 22, 925–934. [Google Scholar] [CrossRef]
- Dumitru, R.; Negrea, S.; Ianculescu, A.; Păcurariu, C.; Vasile, B.; Surdu, A.; Manea, F. Lanthanum Ferrite Ceramic Powders: Synthesis, Characterization and Electrochemical Detection Application. Materials 2020, 13, 2061. [Google Scholar] [CrossRef] [PubMed]
- Bîrzescu, M.; Niculescu, M.; Dumitru, R.; Carp, O.; Segal, E. Synthesis, structural characterization and thermal analysis of the cobalt(II) oxalate obtained through the reaction of 1,2-ethanediol with Co(NO3)2 · 6H2O. J. Therm. Anal. Calorim. 2009, 96, 979–986. [Google Scholar] [CrossRef]
- Nakamoto, K. Infrared and Raman Spectra of Inorganic and Coordination Compounds; John Wiley & Sons, Inc.: Hoboken, NJ, USA, 2008; ISBN 9780470405840. [Google Scholar]
- Karthikeyan, S.; Selvapandiyan, M. Effect of Annealing Temperature on the Properties of Lanthanum Oxide (La2O3) Nanoplates by Reflux Routes. Int. J. Eng. Sci. Res. Technol. 2018, 7, 559–562. [Google Scholar] [CrossRef]


Publisher’s Note: MDPI stays neutral with regard to jurisdictional claims in published maps and institutional affiliations. |
© 2022 by the authors. Licensee MDPI, Basel, Switzerland. This article is an open access article distributed under the terms and conditions of the Creative Commons Attribution (CC BY) license (https://creativecommons.org/licenses/by/4.0/).