
Microstructure, Mechanical Properties, and Corrosion Behavior of Al-4.0Cu-1.1Li-0.5Mg-xAg Alloys


Abstract
:1. Introduction
2. Experimental Procedures
3. Results
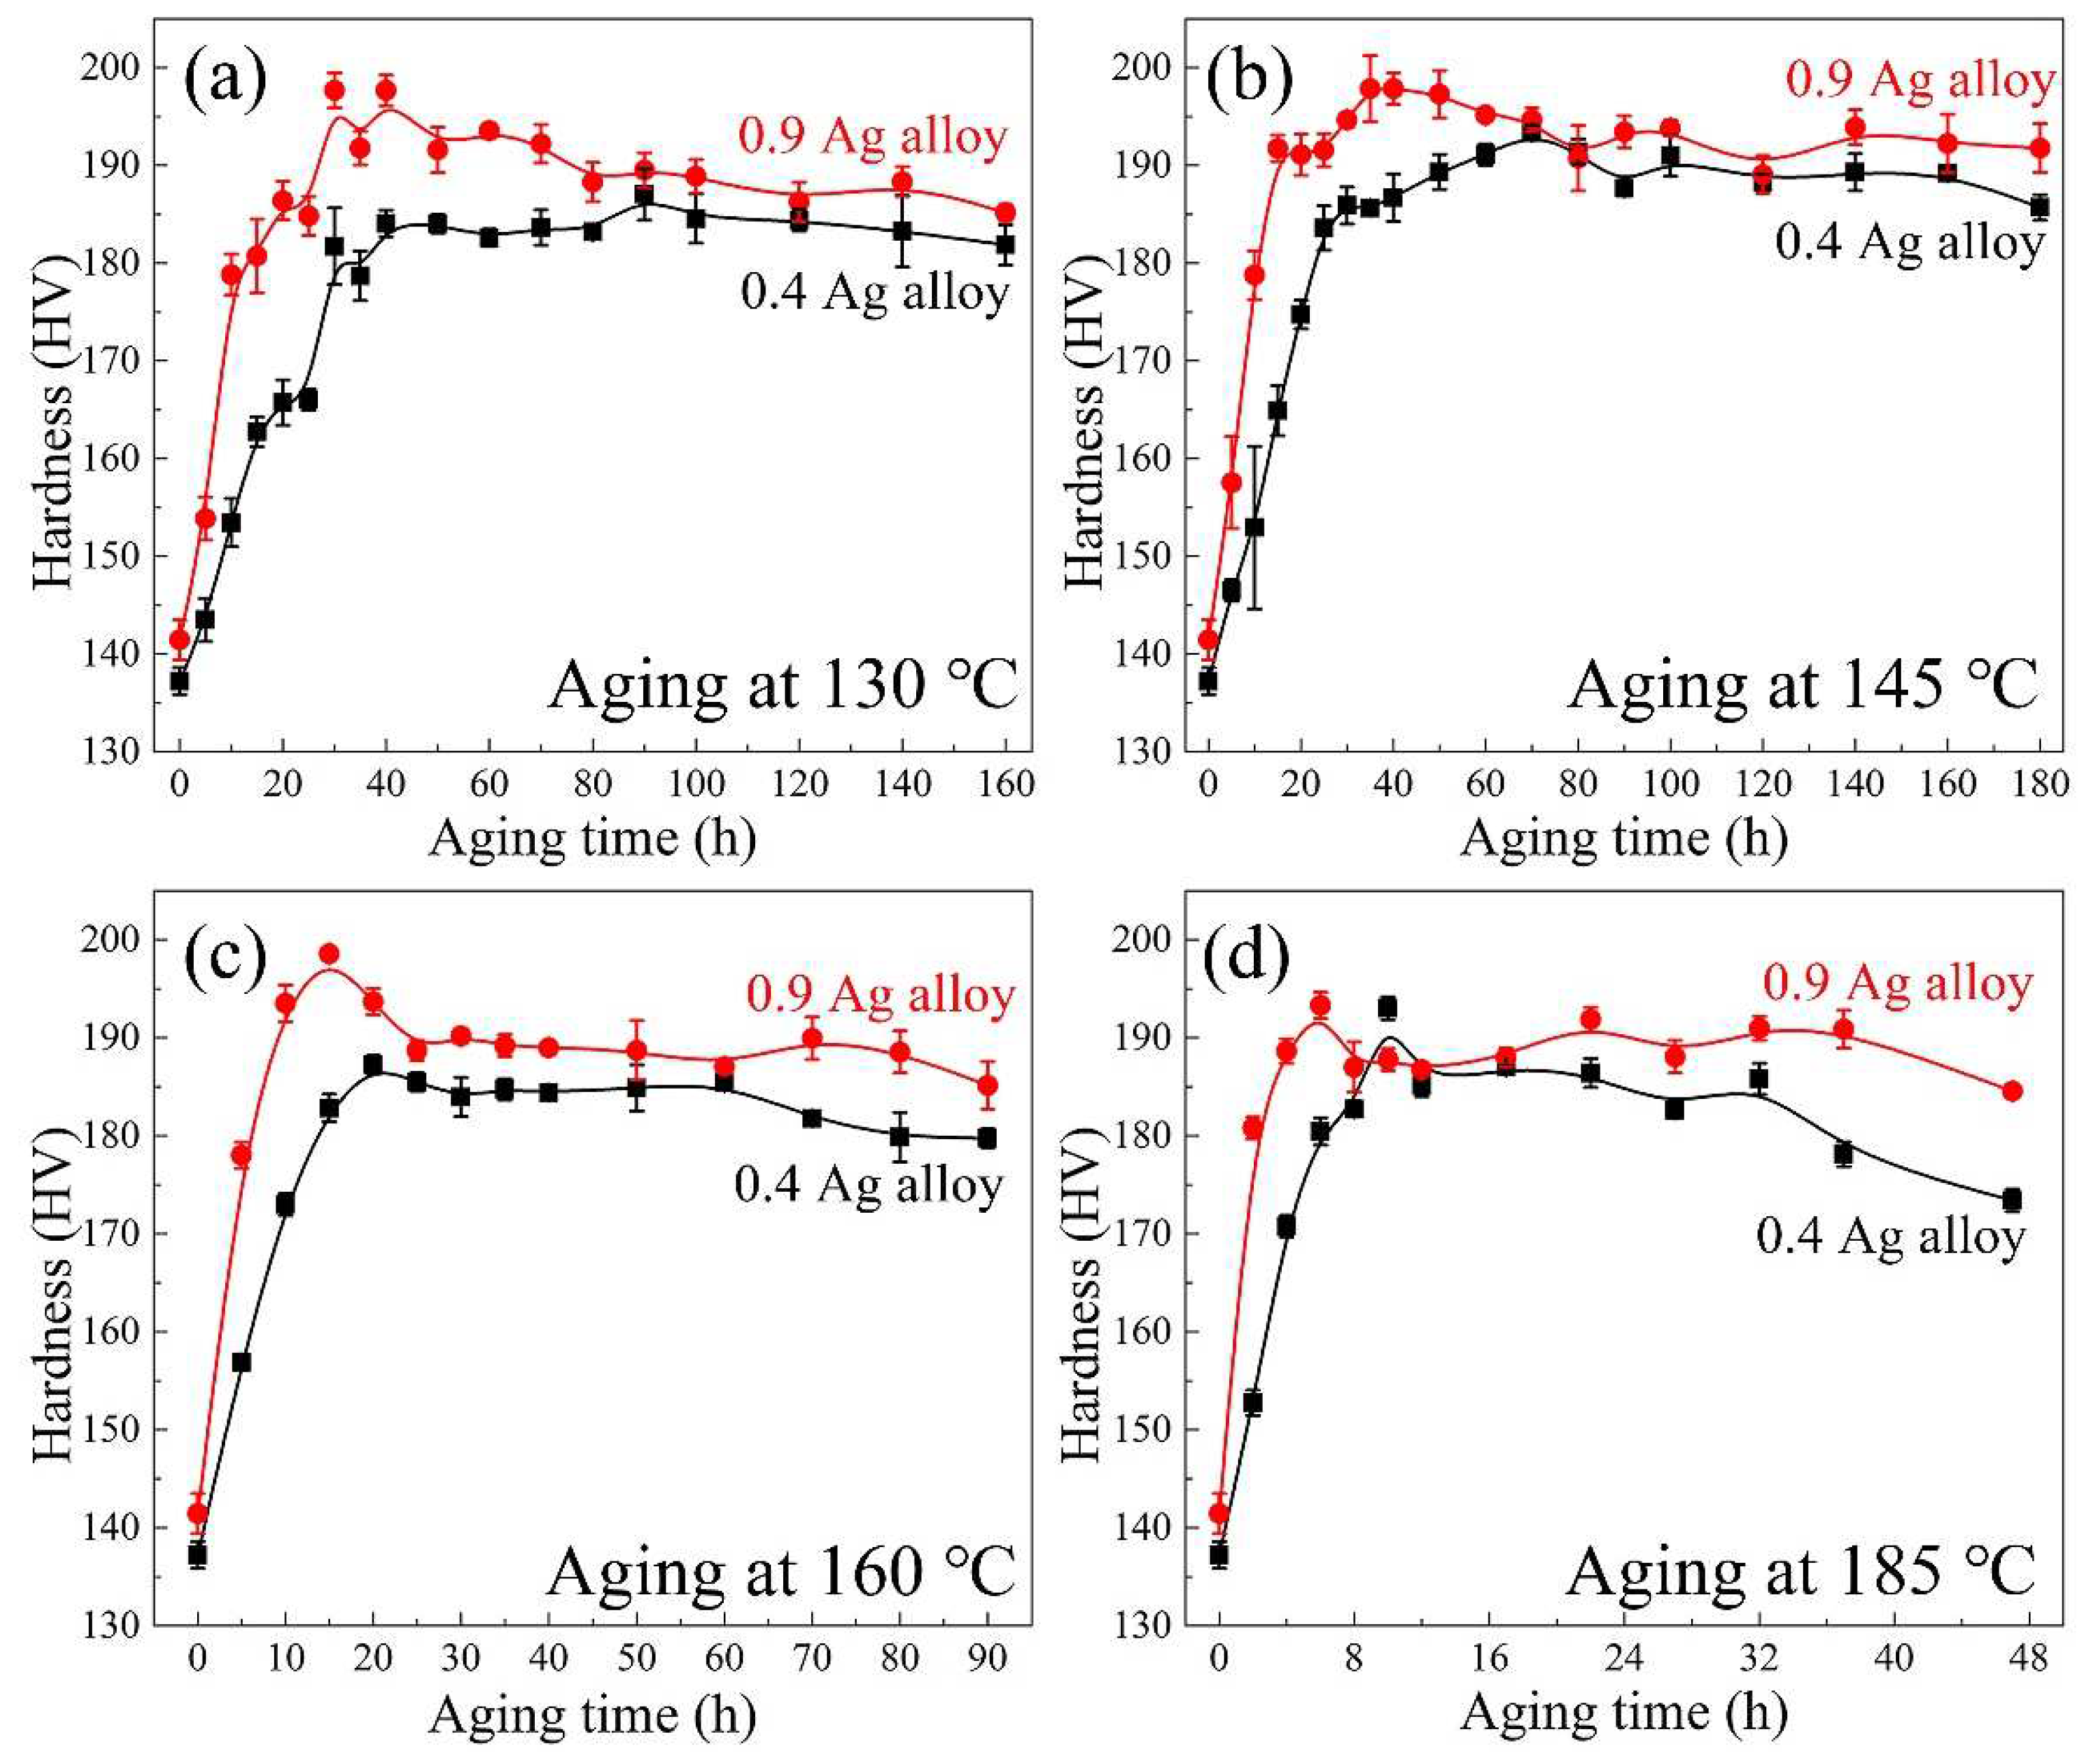
3.1. Hardness
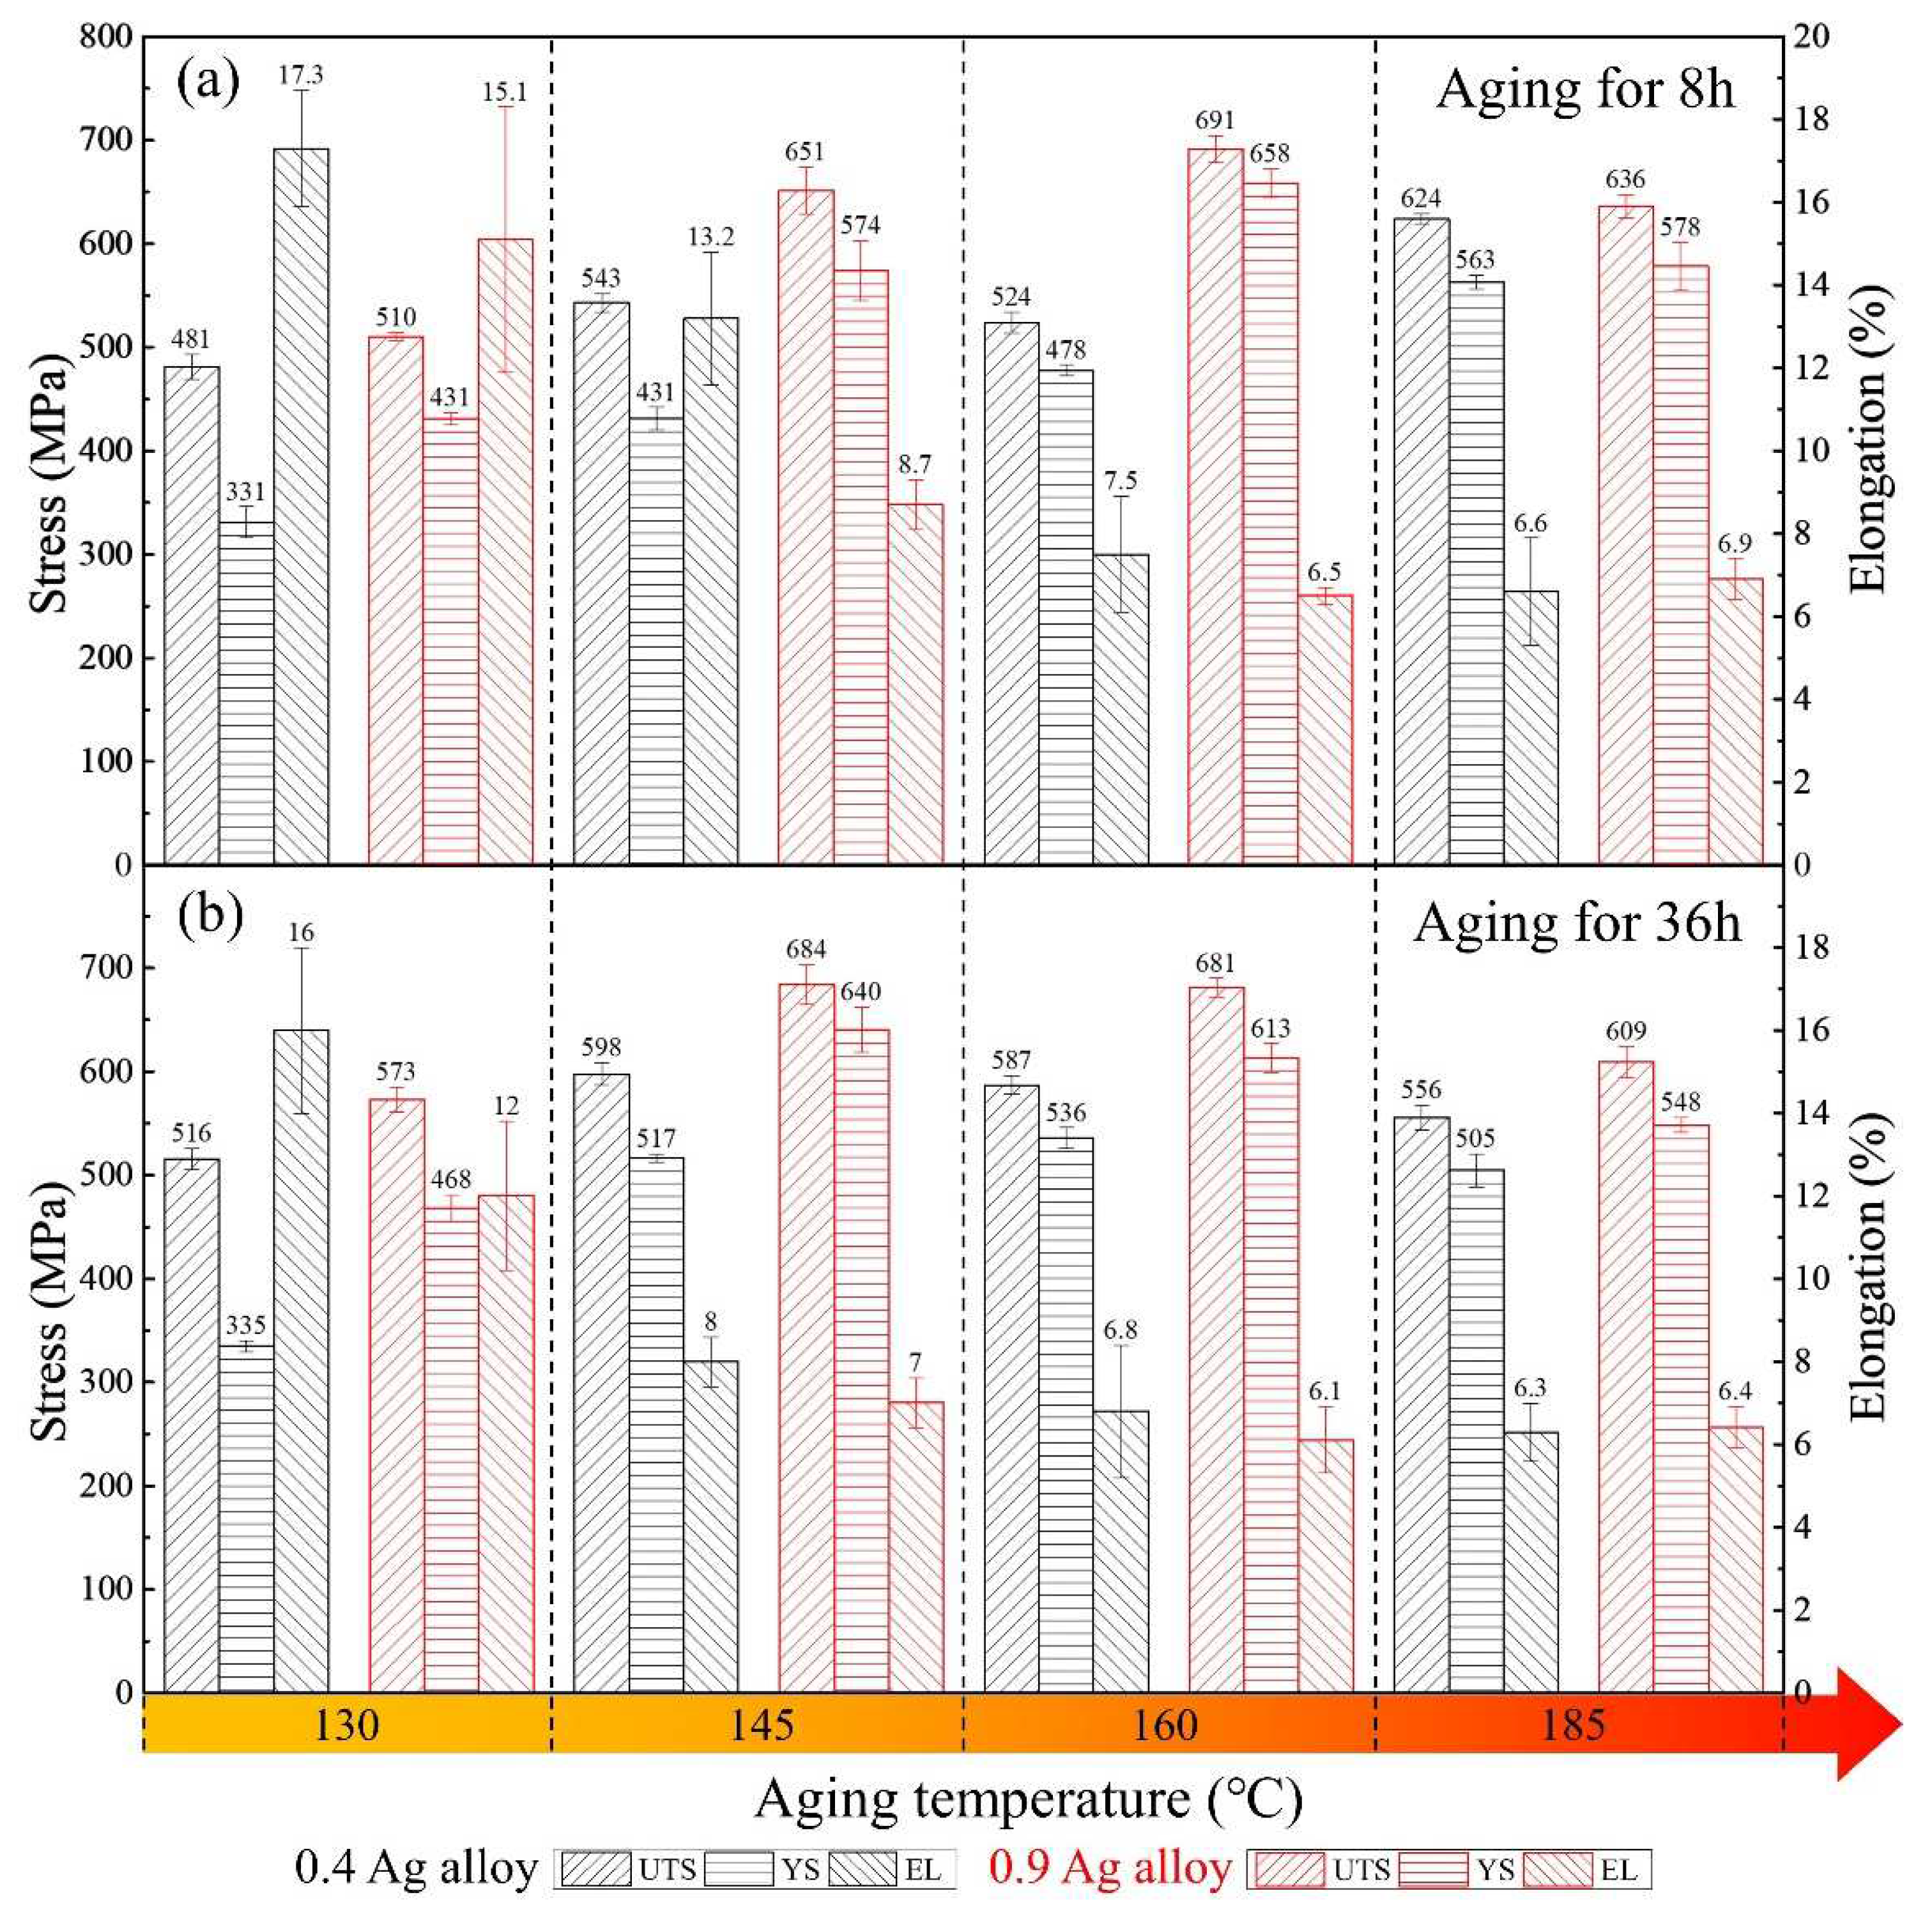
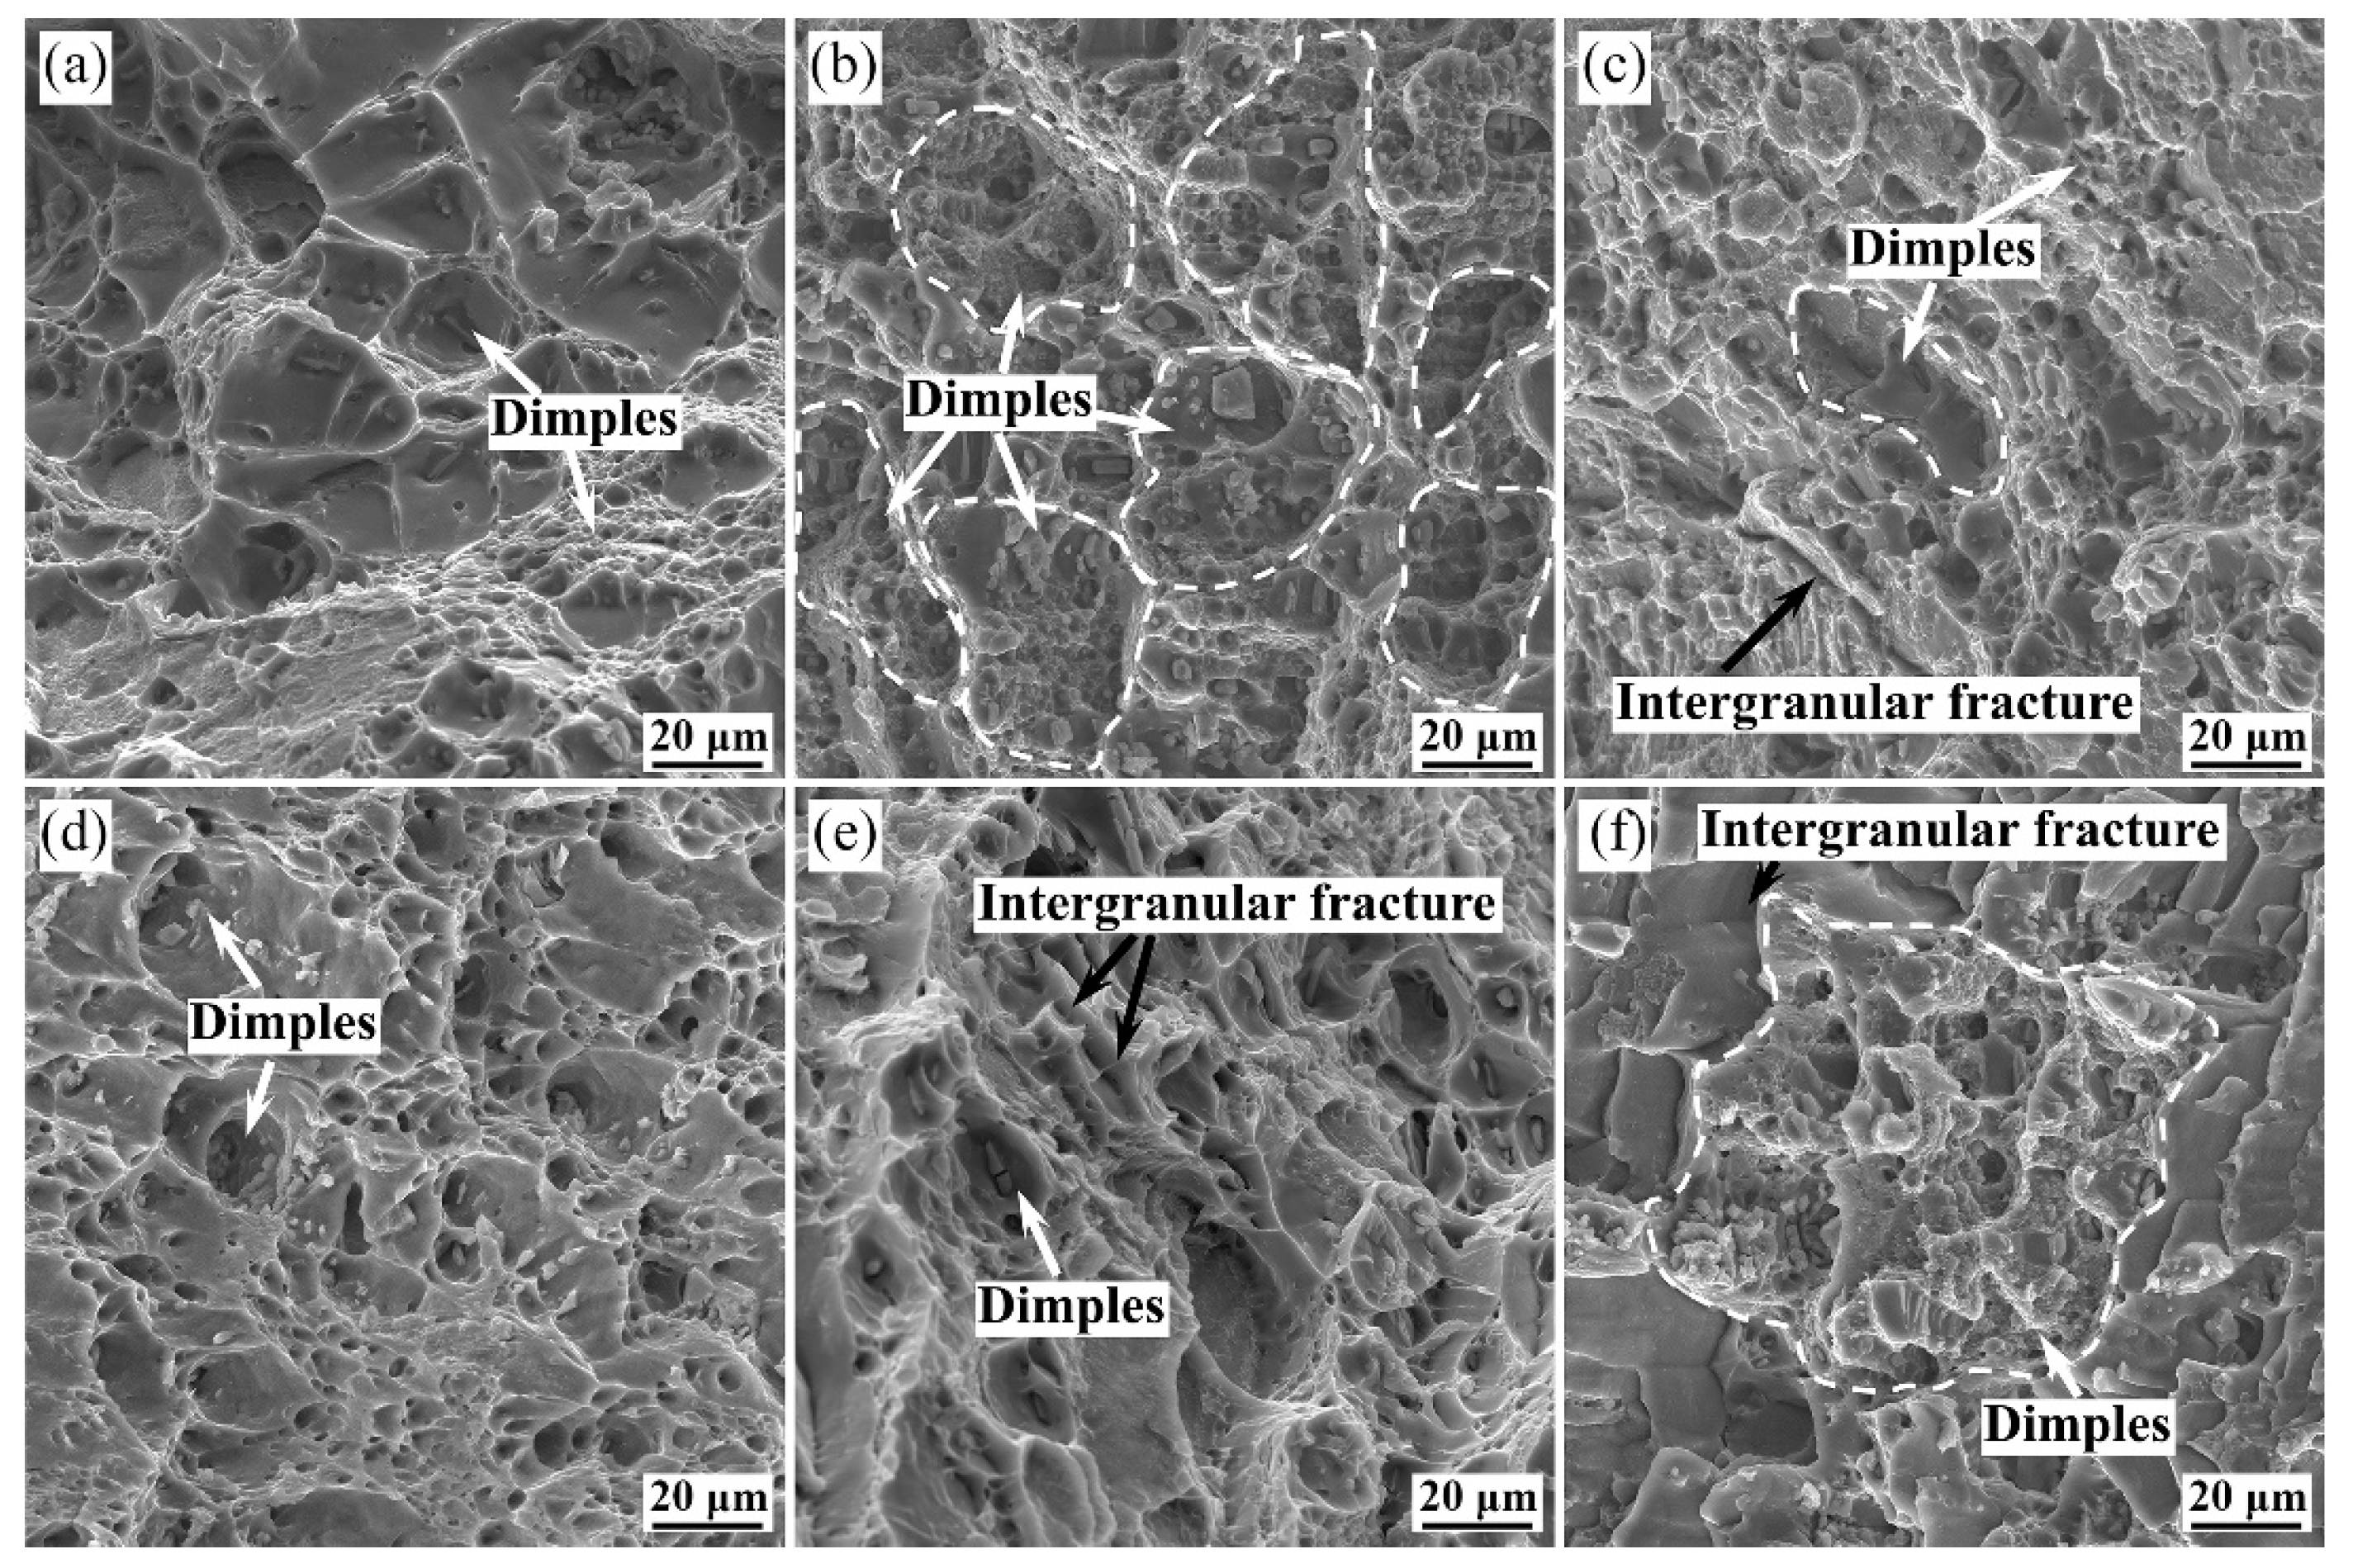
3.2. Tensile Properties
3.3. Corrosion Behaviors
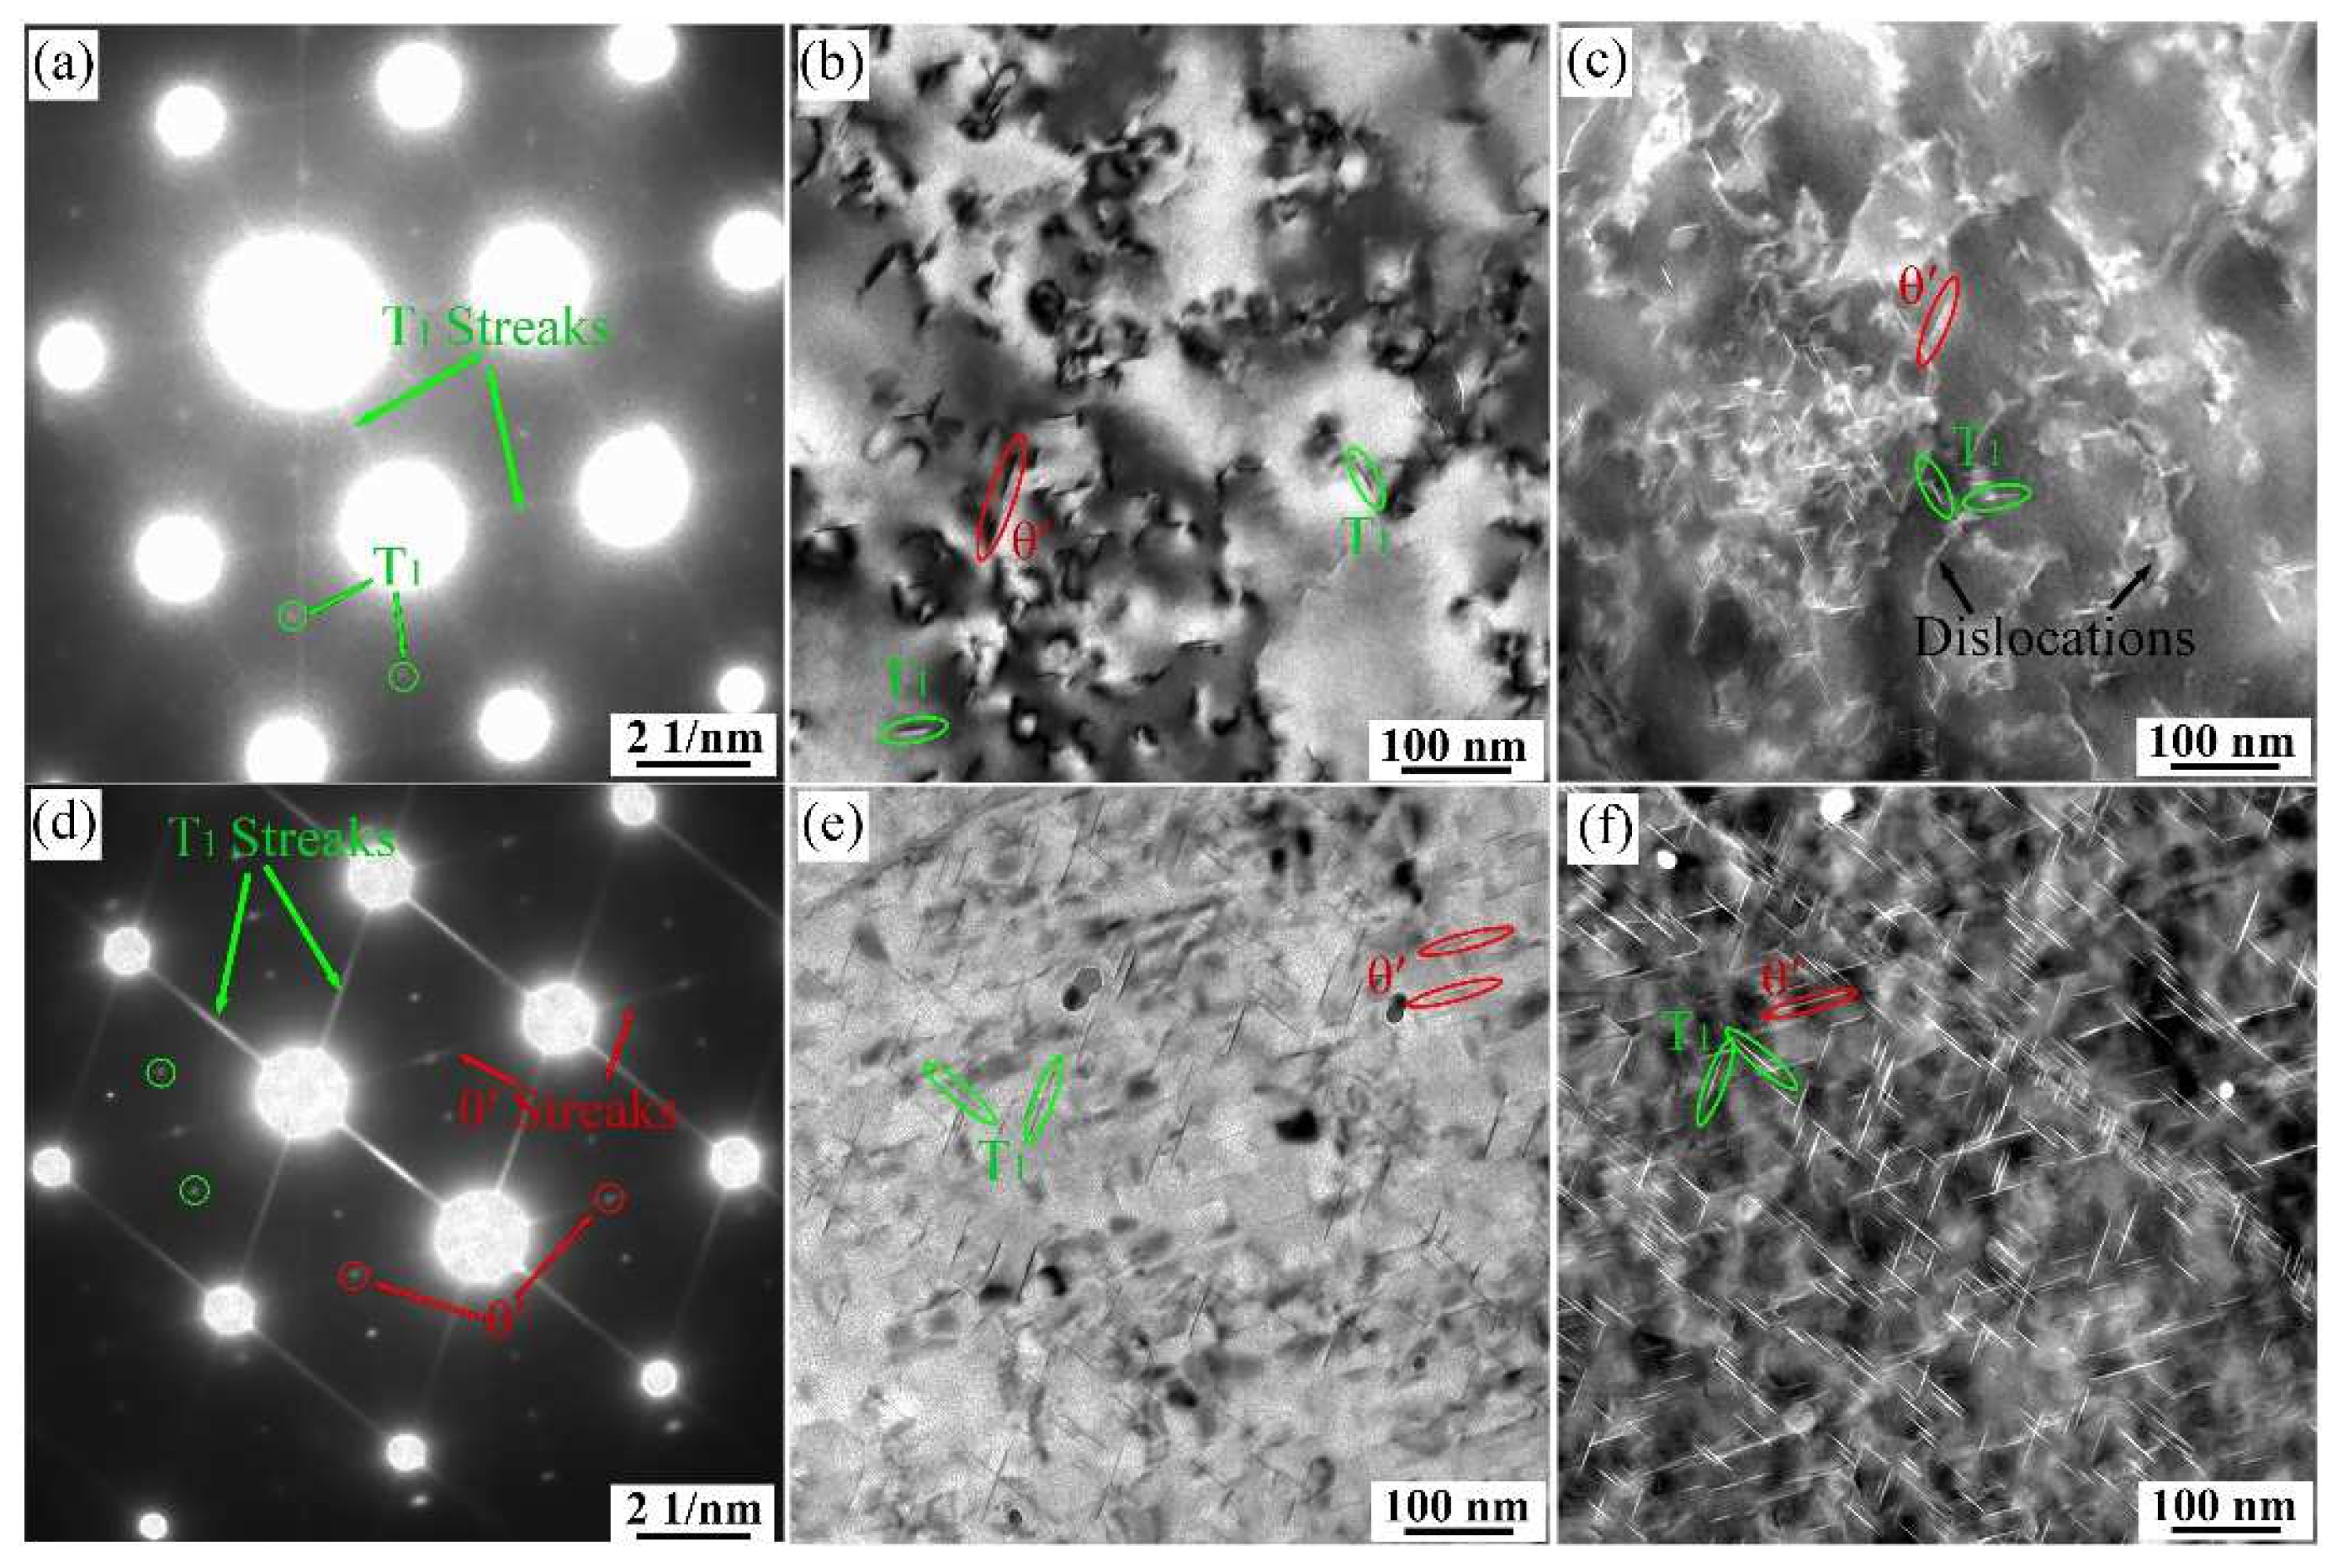
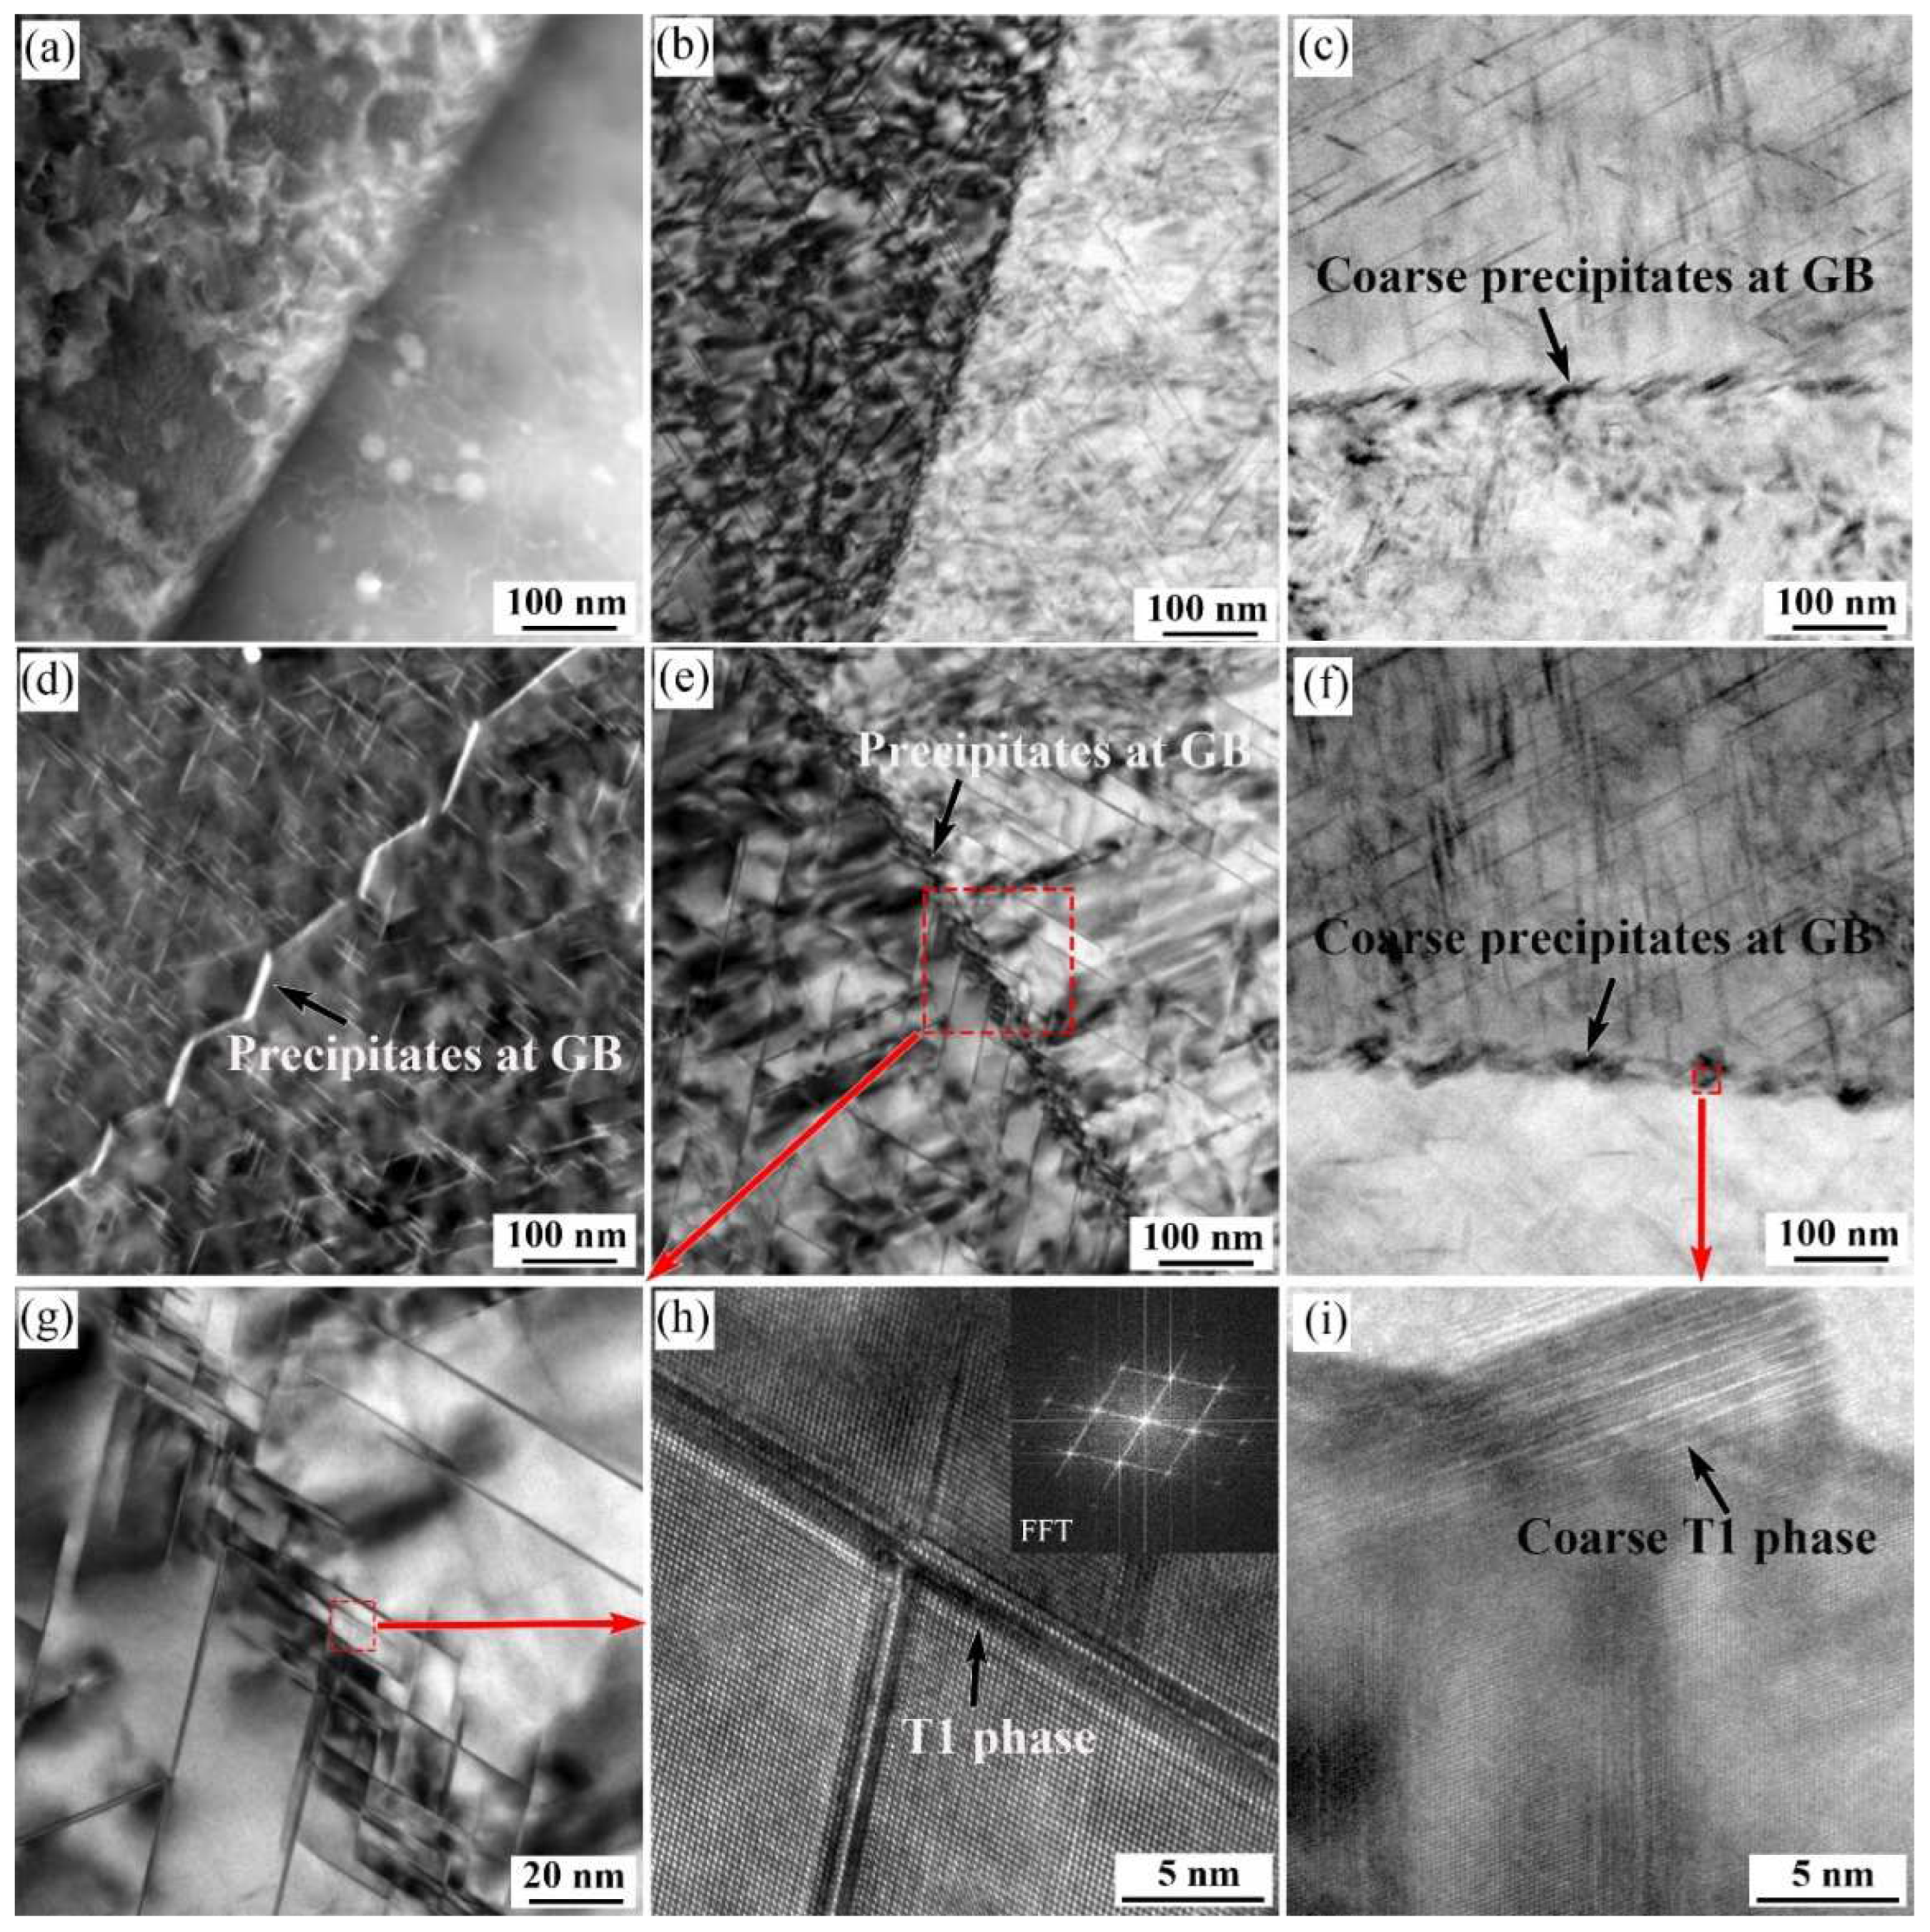
3.4. TEM Observation
4. Discussion
4.1. Influence of Ag Contents on Aging Precipitation
4.2. Effect of Ag Contents on Mechanical Properties
4.3. The Role of Ag Contents in the Corrosion Behavior
5. Conclusions
Author Contributions
Funding
Institutional Review Board Statement
Informed Consent Statement
Data Availability Statement
Conflicts of Interest
References
- Gupta, R.K.; Nayan, N.; Nagasireesha, G.; Sharma, S.C. Development and characterization of Al-Li alloys. Mater. Sci. Eng. A 2006, 420, 228–234. [Google Scholar] [CrossRef]
- Rioja, R.J.; Liu, J. The evolution of Al-Li base products for aerospace and space applications. Metall. Mater. Trans. A 2012, 43, 3325–3337. [Google Scholar] [CrossRef]
- Lavernia, E.J.; Srivatsan, T.S.; Mohamed, F.A. Strength, deformation, fracture behaviour and ductility of aluminium-lithium alloys. J. Mater. Sci. 1990, 25, 1137–1158. [Google Scholar] [CrossRef]
- Abd El-Aty, A.; Xu, Y.; Guo, X.; Zhang, S.H.; Ma, Y.; Chen, D. Strengthening mechanisms, deformation behavior, and anisotropic mechanical properties of Al-Li alloys: A review. J. Adv. Res. 2018, 10, 49–67. [Google Scholar] [CrossRef] [PubMed]
- Dursun, T.; Soutis, C. Recent developments in advanced aircraft aluminium alloys. Mater. Des. 2014, 56, 862–871. [Google Scholar] [CrossRef]
- Yoshimura, R.; Konno, T.J.; Abe, E.; Hiraga, K. Transmission electron microscopy study of the evolution of precipitates in aged Al-Li-Cu alloys: The θ′ and T1 phases. Acta Mater. 2003, 51, 4251–4266. [Google Scholar] [CrossRef]
- Jiang, B.; Wang, H.S.; Yi, D.Q.; Tian, Y.; Shen, F.H.; Wang, B.; Liu, H.Q.; Hu, Z. Effect of Ag addition on the age hardening and precipitation behavior in an Al-Cu-Li-Mg-Zn-Mn-Zr alloy. Mater. Charact. 2020, 162, 110184. [Google Scholar] [CrossRef]
- Cui, S.; Zhang, C.S.; Liu, M.F.; Chen, L.; Zhao, G.Q. Precipitation behavior of an Al-Cu-Li-X alloy and competing relationships among precipitates at different aging temperatures. Mater. Sci. Eng. A 2021, 814, 141125. [Google Scholar] [CrossRef]
- Goswami, R.; Bernstein, N. Effect of interfaces of grain boundary Al2CuLi plates on fracture behavior of Al-3Cu-2Li. Acta Mater. 2015, 87, 399–410. [Google Scholar] [CrossRef]
- Cassada, W.A.; Shiflet, G.J.; Starke, E.A. The effect of plastic deformation on T1 precipitation. Metall. Mater. Trans. A 1991, 22A, 299–306. [Google Scholar] [CrossRef]
- Rodgers, B.I.; Prangnell, P.B. Quantification of the influence of increased pre-stretching on microstructure-strength relationships in the Al-Cu-Li alloy AA2195. Acta Mater. 2016, 108, 55–67. [Google Scholar] [CrossRef]
- Gumbmann, E.; Geuser, F.D.; Sigli, C.; Deschamps, A. Influence of Mg, Ag and Zn minor solute additions on the precipitation kinetics and strengthening of an Al-Cu-Li alloy. Acta Mater. 2017, 133, 172–185. [Google Scholar] [CrossRef] [Green Version]
- Gumbmann, E.; Lefebvre, W.; Geuser, F.D.; Sigli, C.; Deschamps, A. The effect of minor solute additions on the precipitation path of an Al-Cu-Li alloy. Acta Mater. 2016, 115, 104–114. [Google Scholar] [CrossRef]
- Decreus, B.; Deschamps, A.; Geuser, F.D.; Donnadieu, P.; Sigli, C.; Weyland, M. The influence of Cu/Li ratio on precipitation in Al-Cu-Li-x alloys. Acta Mater. 2013, 61, 2207–2218. [Google Scholar] [CrossRef]
- Huang, B.P.; Zheng, Z.Q. Independent and combined roles of trace Mg and Ag additions in properties precipitation process and precipitation kinetics of Al-Cu-Li-(Mg)-(Ag)-Zr-Ti alloys. Acta Mater. 1998, 46, 4381–4393. [Google Scholar] [CrossRef]
- Cassada, W.A.; Shiflet, G.J.; Starke, E.A. Mechanism of Al2CuLi (T1) Nucleation and Growth. Mater. Trans. A 1991, 22, 287–297. [Google Scholar] [CrossRef]
- Itoh, G.; Cui, Q.; Kanno, M. Effects of a small addition of magnesium and silver on the precipitation of T1 phase in an A1-4%Cu-l.l%Li-0.2%Zr alloy. Mater. Sci. Eng. A 1996, 211, 128–137. [Google Scholar] [CrossRef]
- Araullo-Peters, V.; Gault, B.; Geuser, F.d.; Deschamps, A.; Cairney, J.M. Microstructural evolution during ageing of Al-Cu-Li-x alloys. Acta Mater. 2014, 66, 199–208. [Google Scholar] [CrossRef] [Green Version]
- Boukos, N.; Flouda, E.; Papastaikoudis, C. The effect of Ag additions on the microstructure of aluminium-lithium alloys. J. Mater. Sci. 1998, 33, 3213–3218. [Google Scholar] [CrossRef]
- Murayama, M.; Hono, K. Role of Ag and Mg on precipitation of T1 phase in an Al-Cu-Li-Mg-Ag alloy. Scr. Mater. 2001, 44, 701–706. [Google Scholar] [CrossRef]
- Dorin, T.; Deschamps, A.; Geuser, F.D.; Sigli, C. Quantification and modelling of the microstructure/strength relationship by tailoring the morphological parameters of the T1 phase in an Al-Cu-Li alloy. Acta Mater. 2014, 75, 134–146. [Google Scholar] [CrossRef]
- Liu, D.Y.; Wang, J.X.; Li, J.F.; Ma, Y.L.; Zhang, K.; Zhang, R.F. The effect of Ag element on the microstructure characteristic evolution of an Al-Cu-Li-Mg alloy. J. Mater. Res. Technol. 2020, 9, 11121–11134. [Google Scholar] [CrossRef]
- Deschamps, A.; Garcia, M.; Chevy, J.; Davo, B.; De Geuser, F. Influence of Mg and Li content on the microstructure evolution of Al-Cu-Li alloys during long-term ageing. Acta Mater. 2017, 122, 32–46. [Google Scholar] [CrossRef] [Green Version]
- Deng, Y.J.; Bai, J.H.; Wu, X.D.; Huang, G.J.; Cao, L.F.; Huang, L. Investigation on formation mechanism of T1 precipitate in an Al-Cu-Li alloy. J. Alloys Compd. 2017, 723, 661–666. [Google Scholar] [CrossRef]
- Gao, Z.; Liu, J.Z.; Chen, J.H.; Duan, S.Y.; Liu, Z.R.; Ming, W.Q.; Wu, C.L. Formation mechanism of precipitate T1 in Al-Cu-Li alloys. J. Alloy. Compd. 2015, 624, 22–26. [Google Scholar] [CrossRef]
- Ringer, S.P.; Hono, K.; Polmear, I.J.; Sakurai, T. Nucleation of precipitates in aged Al-Cu-Mg-(Ag) alloys with high Cu:Mg ratios. Acta Mater. 1996, 44, 1883–1898. [Google Scholar] [CrossRef]
- Gault, B.; De Geuser, F.; Bourgeois, L.; Gabble, B.M.; Ringer, S.P.; Muddle, B.C. Atom probe tomography and transmission electron microscopy characterisation of precipitation in an Al-Cu-Li-Mg-Ag alloy. Ultramicroscopy 2011, 111, 683–689. [Google Scholar] [CrossRef]
- Dorin, T.; De Geuser, F.; Lefebvre, W.; Sigli, C.; Deschamps, A. Strengthening mechanisms of T1 precipitates and their influence on the plasticity of an Al-Cu-Li alloy. Mater. Sci. Eng. A 2014, 605, 119–126. [Google Scholar] [CrossRef]
- Zhang, S.F.; Zeng, W.D.; Yang, W.H.; Shi, C.L.; Wang, H.J. Ageing response of a Al-Cu-Li 2198 alloy. Mater. Des. 2014, 63, 368–374. [Google Scholar] [CrossRef]
- Xu, J.J.; Deng, Y.L.; Chen, J.Q.; Xie, Y.K.; Guo, X.B. Effect of ageing treatments on the precipitation behavior and mechanical properties of Al-Cu-Li alloys. Mater. Sci. Eng. A 2020, 773, 138885. [Google Scholar] [CrossRef]
- Gür, C.H.; Yildiz, I. Utilization of non-destructive methods for determining the effect of age-hardening on impact toughness of 2024 Al-Cu-Mg Alloy. J. Nondestruct. Eval. 2008, 27, 99–104. [Google Scholar] [CrossRef]
- Yu, T.F.; Li, B.C.; Medjahed, A.; Hou, L.G.; Wu, R.Z.; Zhang, J.H.; Sun, J.F.; Zhang, M.L. Impeding effect of the Al3(Er,Zr,Li) particles on planar slip and intergranular fracture mechanism of Al-3Li-1Cu-0.1Zr-X alloys. Mater. Charact. 2019, 147, 146–154. [Google Scholar] [CrossRef]
- Grilli, R.; Baker, M.A.; Castle, J.E.; Dunn, B.; Watts, J.F. Localized corrosion of a 2219 aluminium alloy exposed to a 3.5% NaCl solution. Corros. Sci. 2010, 52, 2855–2866. [Google Scholar] [CrossRef] [Green Version]
- Li, J.F.; Li, C.X.; Peng, Z.W.; Chen, W.J.; Zheng, Z.Q. Corrosion mechanism associated with T1 and T2 precipitates of Al-Cu-Li alloys in NaCl solution. J. Alloy. Compd. 2008, 460, 688–693. [Google Scholar] [CrossRef]
- Wang, Z.X.; Chen, P.; Li, H.; Fang, B.J.; Song, R.G.; Zheng, Z.Q. The intergranular corrosion susceptibility of 2024 Al alloy during re-ageing after solution treating and cold-rolling. Corros. Sci. 2017, 114, 156–168. [Google Scholar] [CrossRef]
- Proton, V.; Alexis, J.; Andrieu, E.; Delfosse, J.; Deschamps, A.; De Geuser, F.; Lafont, M.C.; Blanc, C. The influence of artificial ageing on the corrosion behaviour of a 2050 aluminium-copper-lithium alloy. Corros. Sci. 2014, 80, 494–502. [Google Scholar] [CrossRef] [Green Version]
- Lin, Y.; Lu, C.G.; Wei, C.Y.; Zheng, Z.Q. Effect of aging treatment on microstructures, tensile properties and intergranular corrosion behavior of Al-Cu-Li alloy. Mater. Charact. 2018, 141, 163–168. [Google Scholar] [CrossRef]


| Alloys | Cu | Li | Mg | Ag | Mn | Zr | Al | |
|---|---|---|---|---|---|---|---|---|
| 0.4 Ag | Nominal | 4.0 | 1.1 | 0.5 | 0.4 | 0.2 | 0.2 | Bal. |
| Actual | 3.99 | 1.12 | 0.42 | 0.33 | 0.25 | 0.16 | Bal. | |
| 0.9 Ag | Nominal | 4.0 | 1.1 | 0.5 | 0.9 | 0.2 | 0.2 | Bal. |
| Actual | 3.98 | 1.13 | 0.45 | 0.88 | 0.21 | 0.20 | Bal. | |
| Aging Condition | 0.4 Ag Alloy | 0.9 Ag Alloy | ||
|---|---|---|---|---|
| Ecorr (VSCE) | Icorr (A/cm2) | Ecorr (VSCE) | Icorr (A/cm2) | |
| 130 °C/36 h | −0.601 | 4.139 × 10⁻⁶ | −0.633 | 2.578 × 10⁻⁶ |
| 160 °C/36 h | −0.682 | 3.251 × 10⁻⁶ | −0.699 | 1.732 × 10⁻⁶ |
| 185 °C/36 h | −0.680 | 2.244 × 10⁻⁶ | −0.672 | 1.411 × 10⁻⁶ |
Publisher’s Note: MDPI stays neutral with regard to jurisdictional claims in published maps and institutional affiliations. |
© 2022 by the authors. Licensee MDPI, Basel, Switzerland. This article is an open access article distributed under the terms and conditions of the Creative Commons Attribution (CC BY) license (https://creativecommons.org/licenses/by/4.0/).
Share and Cite
Wu, M.; Xiao, D.; Liu, W.; Huang, L. Microstructure, Mechanical Properties, and Corrosion Behavior of Al-4.0Cu-1.1Li-0.5Mg-xAg Alloys. Metals 2022, 12, 374. https://doi.org/10.3390/met12030374
Wu M, Xiao D, Liu W, Huang L. Microstructure, Mechanical Properties, and Corrosion Behavior of Al-4.0Cu-1.1Li-0.5Mg-xAg Alloys. Metals. 2022; 12(3):374. https://doi.org/10.3390/met12030374
Chicago/Turabian StyleWu, Mingdong, Daihong Xiao, Wensheng Liu, and Lanping Huang. 2022. "Microstructure, Mechanical Properties, and Corrosion Behavior of Al-4.0Cu-1.1Li-0.5Mg-xAg Alloys" Metals 12, no. 3: 374. https://doi.org/10.3390/met12030374
APA StyleWu, M., Xiao, D., Liu, W., & Huang, L. (2022). Microstructure, Mechanical Properties, and Corrosion Behavior of Al-4.0Cu-1.1Li-0.5Mg-xAg Alloys. Metals, 12(3), 374. https://doi.org/10.3390/met12030374