Abstract
Solidification under a supergravity field is an effective method to control the solidified microstructure, which can be used to prepare materials with excellent comprehensive properties. In order to explore the influence of supergravity on the solidification behavior, a phase-field crystal model for the solidification under supergravity fields is developed and utilized to study the supergravity-controlled solidification behaviors. The results show that the grains in the solidification structures are refined in a supergravity field. The grain size in a zero-gravity field is uniformly distributed in the sample, but gradually decreases along the direction of the supergravity, showing a graded microstructure. The simulations show real-time images of the nucleation and growth of grains during solidification. In a supergravity field, solidification occurs preferentially in the liquid subject to greater gravity and advances in the opposite direction of supergravity with the time evolution. In addition, the driving force of crystallization in liquid is calculated to explain the effect of the supergravity field on the solidification structure from a thermodynamic point of view. Our findings are expected to provide a new approach and insight for understanding the solidification behaviors under supergravity.
1. Introduction
Solidification is an important method of material production, especially for metallic materials [1,2,3]. Most of the metallic materials used in engineering need to be prepared by solidification. Solidification structure determines the performance of the material and is closely related to the crystallization and solidification of the undercooled liquid. Therefore, controlling the solidification process to form a reasonable microstructure has great significance for improving the performance of engineering materials and exerting the potential of materials [4,5]. Casting in a special external force field (such as centrifugal casting) is a typical example of controlling the solidification process, effectively regulating the microstructure, and improving the performance of the material [6]. Recently, solidification in a supergravity field has attracted a lot of attention [7,8,9]. In a solidification experiment under supergravity field, the melt moves in a high-speed circular motion around a rotating axis in the centrifugal device and bears huge centrifugal force. The pressure of each unit volume of the melt can be approximately calculated as [10]:
where ρ is the density of melt, n is the rotational speed, and r is the distance between the melt and centrifugal axis. It can be seen from Equation (1) that the pressure of the melt is proportional to the distance between the location of the sample and the center of rotation. Song et al. [11] used a numerical method to calculate the pressure distribution of the melt in a supergravity field, and the results showed that the pressure of the molten metal gradually increased along the direction of supergravity. In addition, as the strength of the supergravity field increases, the pressure at the same location in the molten sample also increases. Experimental results show that solidification in a supergravity field can obtain an excellent solidified structure and improve the performance of the material. By adjusting the magnitude of supergravity, Gan et al. [12] controlled the size and distribution of eutectic Si in the solidification structure of Al–Si alloys, and successfully produced a fine and uniformly distributed eutectic Si structure, which increased the Vickers hardness of the material by about 52%. Li et al. [10] utilized a supergravity field to treat Al–Li–Mg–Zn–Cu high-entropy alloy melt and obtained graded microstructures (grain size) after solidification, which improved the overall performance of the high-entropy alloy. Yang et al. [13] solidified the melt of Al–Cu alloy in a supergravity field and observed a substantially refined solidification structure compared to the normal-gravity circumstance. In addition, the supergravity solidification can also be utilized to purify metals or recover valuable metal resources [14].
Although it has been experimentally confirmed that the supergravity field can effectively control the solidification structure, produce significantly refined grains, and even the gradient microstructure distribution in the material, the evolution of the microstructure during the solidification is not clear. As a result, mechanisms of the grain refinement and factors that lead to gradient microstructure formations are not fully understood. Computational simulation at the atomic scale is a promising means to understand the microstructure evolution during solidification. Commonly used simulations include molecular dynamics (MD) simulation and phase-field crystal (PFC) model. At present, MD simulations could be used to study the solidification behaviors happening at a timescale of picosecond, and thus is not appropriate for the investigations of the solidification phenomenon dominated by diffusions, which typically takes place at a timescale of microsecond to millisecond. The PFC model is rooted on the classical density functional theory and can simulate the solidification processes at the diffusion timescale with an accessible computational efficiency [15,16]. So far, substantial progress has been made in understanding the solidification behaviors of various crystals using the PFC method, such as dendrites of two-dimensional hexagon structure [17,18,19] or three-dimensional FCC and BCC structures [20], eutectics of binary alloy [21], homogeneous/heterogeneous nucleation in undercooled liquid [22,23,24], and epitaxial growth of multilayer thin film [25].
Regarding the solidification under supergravity fields, few theoretical simulation works have been carried out so far. In this work, we use the PFC model to investigate the solidification of the undercooled liquid under the supergravity field. In practical engineering applications, there are dozens of factors that affect the casting microstructures during the supergravity solidification, including pressure gradient, heterogeneous nucleation, and turbulent flow, among others. Particularly, the solid and liquid phases should move under the influence of centrifugal force in practice. Unfortunately, these movements are hardly grasped within the present PFC model framework, which needs to improve in the future. Nevertheless, as the first attempt towards this issue, we focus our attentions on the influence of pressure gradient distribution, arising from the supergravity field, on the resulting solidification structure through the homogeneous nucleation in the present work. We set a constant dimensionless temperature parameter below the melting point to provide a subcooled temperature, so that the solidification structure will be affected by only a single factor of pressure. The resulting solidification structures, especially the gradient-distributed grains, obtained in this work agree well with those of experiments. Further, the roles of the supergravity on the grain refinement and the gradient distribution of the grain sizes are uncovered. Specially, the real-time evolutions of microstructures during the solidification processes are tracked and explained from the perspective of thermodynamics. The results of the present work could be expected to provide a new approach and insight for studying the solidification under supergravity.
2. Simulation Method
2.1. Phase-Field Crystal Model
The PFC model can simulate the evolution behaviors of crystals with atomic level resolution at the diffusion timescale. It takes a dimensionless long-time-averaged atomic number density ϕ as the order parameter, which is defined as:
where is long-time-averaged atomic number density at position and is the average number density in a solid–liquid coexistent system [15]. In order to describe the arrangement of atoms in the solid and the liquid phases, ϕ takes a periodic form and constant, respectively. Hereafter, we refer to ϕ as density for short. In the original PFC model for the single-component systems, the classical Swift–Hohenberg (SH) free-energy functional is adopted, namely:
where ε represents a reduced temperature parameter, which is proportional to the difference between temperature and melting point. ∇2 is the Laplace operator. controls the lattice constant of the equilibrium state (taken as 1.0 in this work). In two-dimensional systems, minimizing the free energy functional in Equation (3), three equilibrium phases may be obtained, i.e., the density fields of liquid phase, hexagonal phase, or striped phase, depending on the combinations of ε and (represents the average value of ϕ) [26]. Particularly, the thermodynamic properties of the equilibrium phase are determined by ε and the . In this work, the supergravity field is introduced by appending an additional energy penalty term Fext, namely:
to the free energy density in Equation (3), where G is an adjustable parameter controlling the magnitude of the supergravity gradient. is a position-dependent function, which correlates how much the sample is subjected to the gravity. In order to apply a symmetric supergravity along a certain direction, say Y direction in this work, and meet the periodic boundary condition, a choice of the function is:
where Ly is the length of the sample along the Y direction and y is the Y component of the current position. n is an adjustable parameter, which controls the weight of the penalty term in the total free energy. One advantage of the energy penalty term in Equation (4) is that it introduces the supergravity field without modifying the phase diagram of the SH model. Thus, the free energy functional of the system with the supergravity field is:
Since ϕ is a conserved quantity, the evolution of the density field of the system over time obeys the Cahn–Hilliard equation, namely:
where ζ is the thermal fluctuations of the system. Assuming that the thermal fluctuations are completely uncorrelated at a short temporal and spatial scale, ζ is a Gaussian white noise variable satisfying:
where α measures the amplitude of the noise. If the noise term is omitted, the undercooled liquid will always be trapped in a metastable state [27]. Therefore, when performing a solidification simulation, the noise term needs to be applied to push the undercooled liquid phase out of the metastable state and provide conditions for nucleation.
2.2. Numerical Implementation
The evolution equation of the density field in Equation (7) is a sixth-order partial differential equation, which can be solved by using the finite difference method [28], finite element method [29], or Fourier spectrum method [30]. In this work, the solidifications under the supergravity field require large-scale PFC simulations, which are performed by solving Equation (7) with an efficient semi-implicit Fourier spectrum method combined with a parallel computing framework. Specially, Equation (7) is spatially discretized:
where , , , , and correspond to the Fourier transform of , , , and ζ, respectively. is the wave vector in Fourier space and satisfies . The semi-implicit time discretization of Equation (9) can be written as:
Rearranging Equation (10), we then have:
2.3. Model Parameter Settings
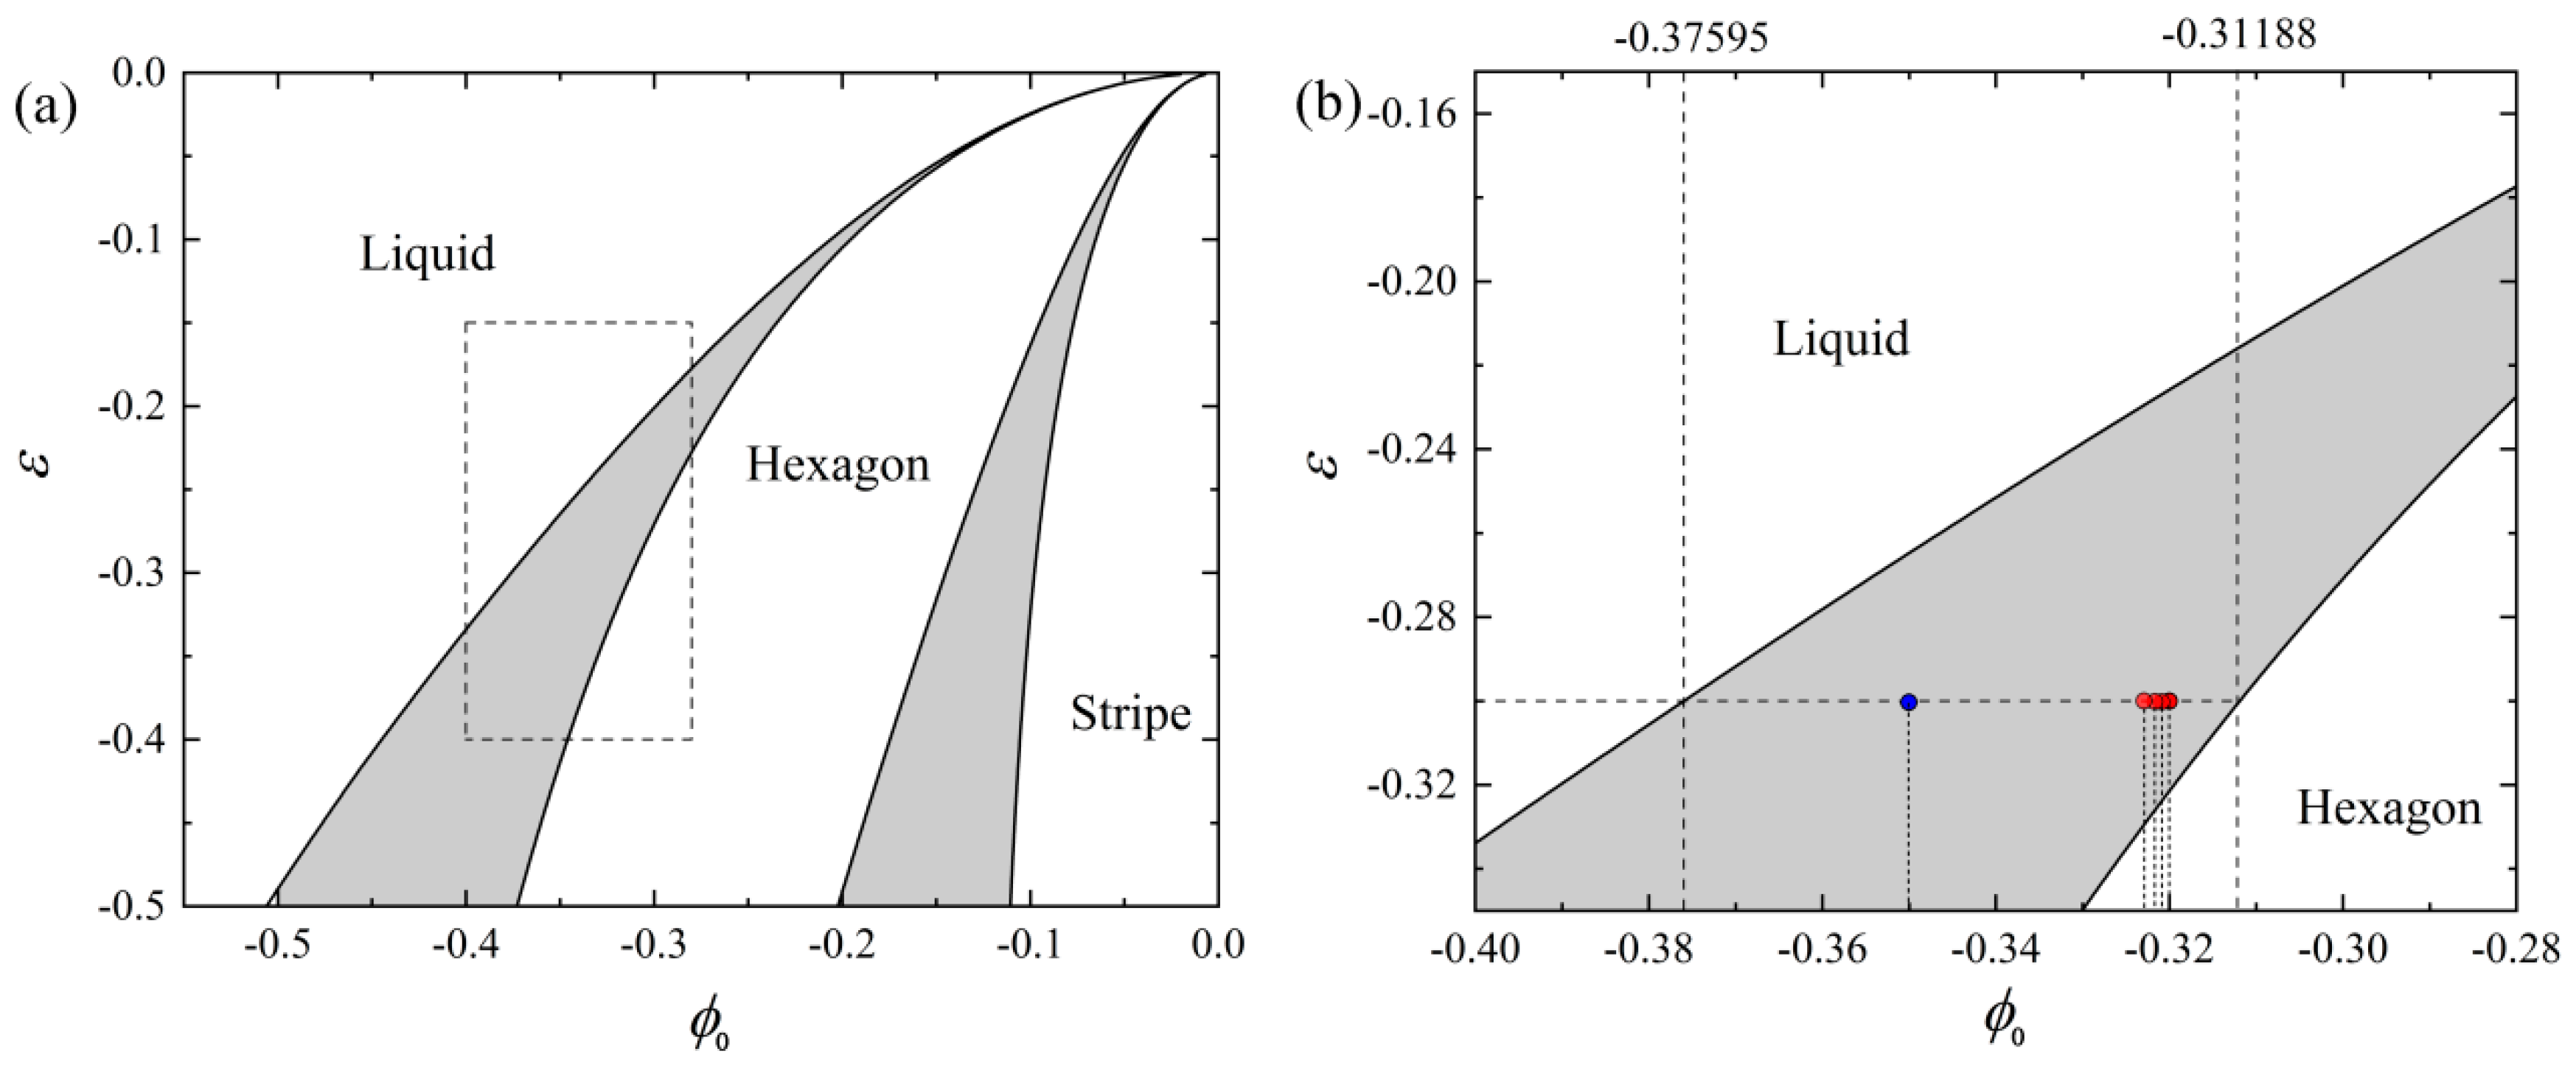
Figure 1a is a two-dimensional phase diagram derived from Equation (3) under the one-mode approximation, and the dotted box area is amplified in Figure 1b, which includes the model parameters, i.e., ε and , used in this work. The model parameters for the undercooled liquids are marked by red and blue dots on the phase diagram in Figure 1b. The temperature parameter ε is set to be −0.3 and remains unchanged, while the average density () of the undercooled liquid changes within (−0.37595, −0.31188). Specially, the blue dot corresponds to near the middle of the liquid–solid phase boundary, and the parameter is used to test the equilibrium properties of the undercooled liquid under a supergravity field. The average density corresponding to the red dots from left to right are −0.3229, −0.32166, −0.32085, and −0.32, respectively. They locate at the liquid–solid coexistent region and are closer to the solid phase boundary. Such model parameters could make the crystallization more complete with a reasonable solidification rate. We construct two samples with different sizes, i.e., and , where Δx and Δy are set as π/3, corresponding to the grid size along the X and Y direction, respectively. Small size samples will be used to study the equilibrium properties of the undercooled liquid in the supergravity field with . The large size sample contains about 1.6 million atoms, which is large enough to reveal the microstructure evolutions of the solidifications under the supergravity field. Time step Δt for solving the motion equation is set to be 0.2. Periodic boundary conditions are applied in both X and Y directions. Simulations are performed by a parallel code developed by us and a typical running task using 48 CUP cores needs about five days.
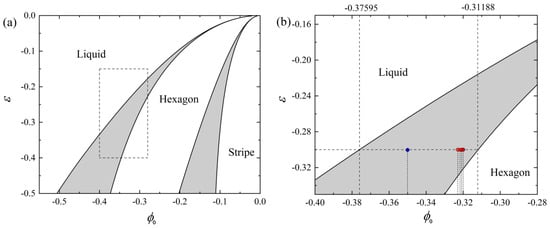
Figure 1.
(a) The two-dimensional phase diagram of the PFC model derived from Equation (3), where the gray parts are coexistence regions of two adjacent phases; (b) the amplified image corresponds to the dashed box area marked in (a), and the blue and red dots represent the used parameters.
3. Result and Discussion
3.1. The Equilibrium Properties of the Undercooled Liquid in the Supergravity Field
Under the supergravity field, the stable pressure distribution in the undercooled liquid is a key property for the solidifications. Firstly, we investigate the relationship between the pressure and density ϕ for a homogeneous undercooled liquid phase. The pressure defined from thermodynamic relationships is given by [31]:
where is the free energy of the liquid phase, u is the chemical potential, and is the Helmholtz free energy of the reference liquid phase. Based on Equation (12), we calculated the relationship between the pressure difference ΔP and ϕ at the fixed undercooling, i.e., ε = −0.3, where ΔP is defined as:
The result is shown in Figure 2. As ϕ increases, the pressure difference of the liquid keeps increasing linearly, which is in contrast to the nonlinear nature described by the relationship (12). This is because that density ϕ in the system could only vary within the liquid–solid coexistence region, which is too narrow to observe the nonlinear behavior described by Equation (12). This drawback should be overcome to study the nonlinear effects in the future. Below, we only restrict our discussions within the linear region.
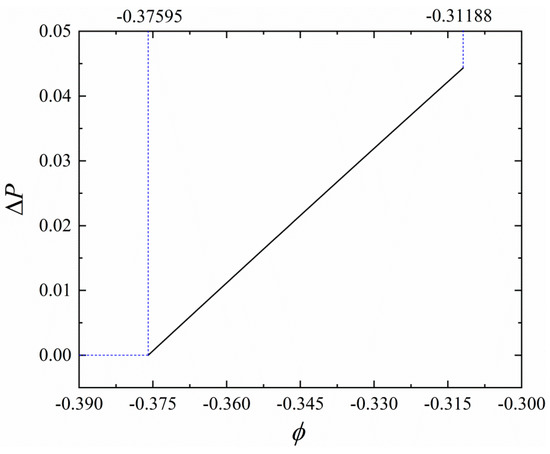
Figure 2.
The relationship between the pressure difference ΔP (defined in Equation (13)) and ϕ at ε = −0.3, where the density ϕ ranges from −0.37595 to −0.31188 corresponds and to the parameters of the undercooled liquid phase.
Next, we investigate the pressure distribution under various supergravity fields. Imaging a sample comprising of a homogeneous liquid, the pressure will be redistributed along the direction (i.e., Y) of the supergravity field defined by certain coefficient G. The size of the sample is , and the other simulation parameters are ε = −0.3, = −0.35, n = −5. Figure 3 shows the change in free energy in samples during the relaxations of the liquid under the supergravity fields with G = 3, 6, and 9. It can be seen that the samples reach an equilibrium state after running for a simulation time of t = 105. The equilibrium density distributions of the sample under the three supergravity fields are shown in Figure 4. The density gradually increases along the direction of the supergravity, changing from a homogeneous liquid to a heterogeneous liquid with a density gradient distribution. According to Equations (12) and (13), we calculated the distribution of ΔP at different G (as shown in Figure 5a) and the relationship between the gradient of ΔP (absolute value) and G (as shown in Figure 5b). It can be seen from Figure 5 that the gradient distribution of pressure in liquid phase is naturally created, and the pressure gradient relates to G by a linear relationship, which provides the guidance for creating the supergravity fields with specific strengths. It is worth noting that the parameter G does not represent the real strength of the supergravity field, but mimics the effects of the latter. In other words, the parameter G provides a way to control the magnitude of the density/pressure gradient. As the strength of the supergravity field changes, the average density of the liquid should be slightly changed for the sake of particle number conservation. Next, with proper combinations of and G, the effect of the supergravity field with different strengths on the solidifications could be investigated. Since the pressure distribution in the upper and lower parts of the sample is completely symmetrical, we only report the results of the lower half of the samples in the remainder of this part.
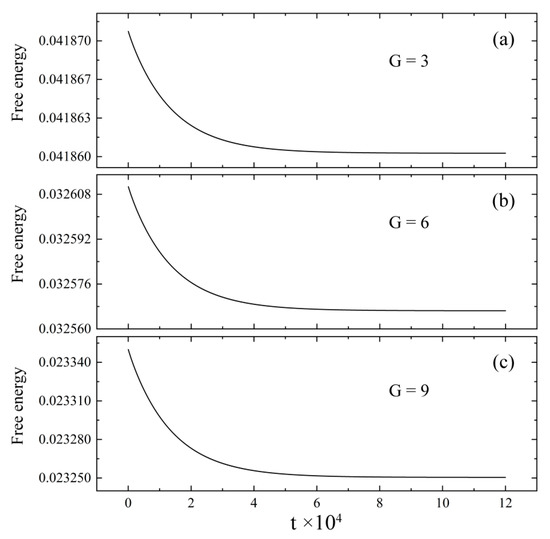
Figure 3.
Change in the free energy in samples during the homogeneous liquid is equilibrated under a supergravity field with (a) G = 3, (b) G = 6, and (c) G = 9.
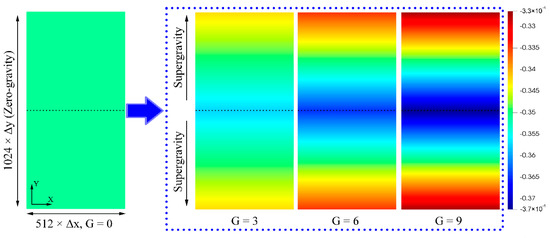
Figure 4.
The density ϕ distribution of the samples in their equilibrium states. The equilibrium state under the zero-gravity field (G = 0) is a homogeneous liquid phase, and the density of the liquid phase under the supergravity field (G = 3, 6, and 9) is distributed in a gradient along the direction of supergravity.
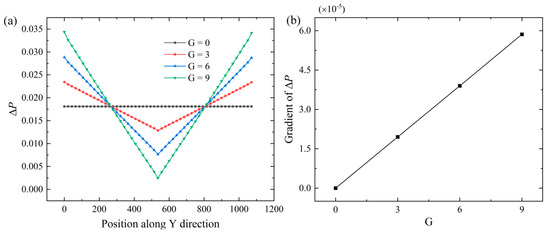
Figure 5.
(a) Distribution of ΔP along the direction of the supergravity (the Y direction) with G = 0, 3, 6, and 9; (b) relationship between the gradient of ΔP (absolute value) and G, showing a good linear correlation.
3.2. Sample Preparation for Solidification in a Supergravity Field
According to the relationship between the gradient of ΔP and G in Figure 5b, we conduct large-scale PFC simulations to investigate the solidification behaviors of the large sample under the supergravity fields with four different strengths. For representation conveniences, the sample under the four supergravity fields is termed sample I, II, III, and IV, respectively. The detailed parameters of these samples are shown in Table 1. After the homogeneous liquid evolves for a sufficiently long time under the supergravity fields, a heterogeneous liquid with a pressure/density gradient distribution can be obtained. It is worth noting that the time required for the sample to reach an equilibrium state grows sharply as the length of the sample along the supergravity direction increases. The large sample employed in this work requires up to t = 107 to equilibrate, which needs tremendous computational resources that are unbearable. We find that the density/pressure exhibits a linear gradient distribution along the gravity direction, while the gradient along the X direction is zero. Therefore, the spatial dimension of the sample during the equilibrating process can be degraded from two to one without modifying the gradient distribution along the gravity direction, which greatly reduces the required computational resources. After the one-dimensional sample reaches the equilibrium state, we artificially expand the sample in the X direction to obtain a two-dimensional equilibrium sample. Sample I is a homogeneous liquid (G = 0) and does not need to be equilibrated under the supergravity field. Figure 6 shows the free energy change of the sample II–IV during the equilibrium process under the supergravity field, and the samples reach their equilibrium state after a simulation time of t = 2 × 10⁷. Figure 7 and Figure 8 show the distribution of ϕ and ΔP in the liquid phase at the equilibrium state under the four supergravity fields. Obviously, the results indicate that the supergravity field strength corresponding to the four samples increases according to the sequence of sample I, II, III, and IV. In the remainder of this work, sample I severs as the initial condition for solidification under the zero-gravity field, while samples II–IV for the solidifications under the supergravity field with G = 3, 5, and 7, respectively.

Table 1.
Detailed parameters for the solidifications under zero-gravity (sample I) and supergravity (sample II–IV) fields.
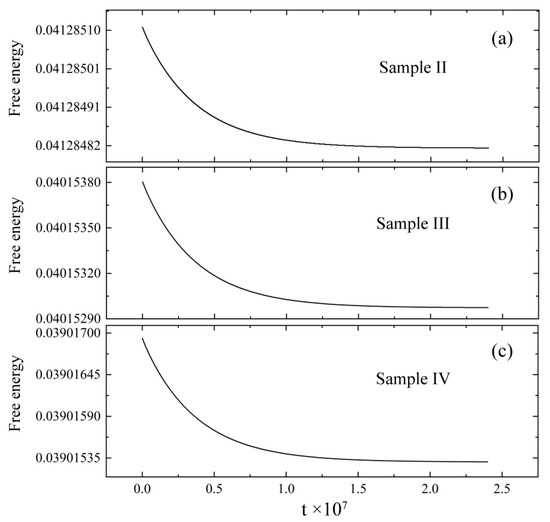
Figure 6.
Free energy of sample II–IV versus simulation time during relaxations under a supergravity field with (a) G = 3, (b) G = 5, and (c) G = 7, respectively.
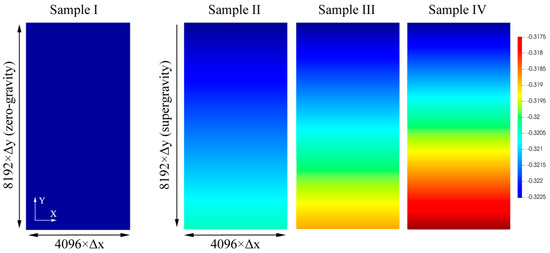
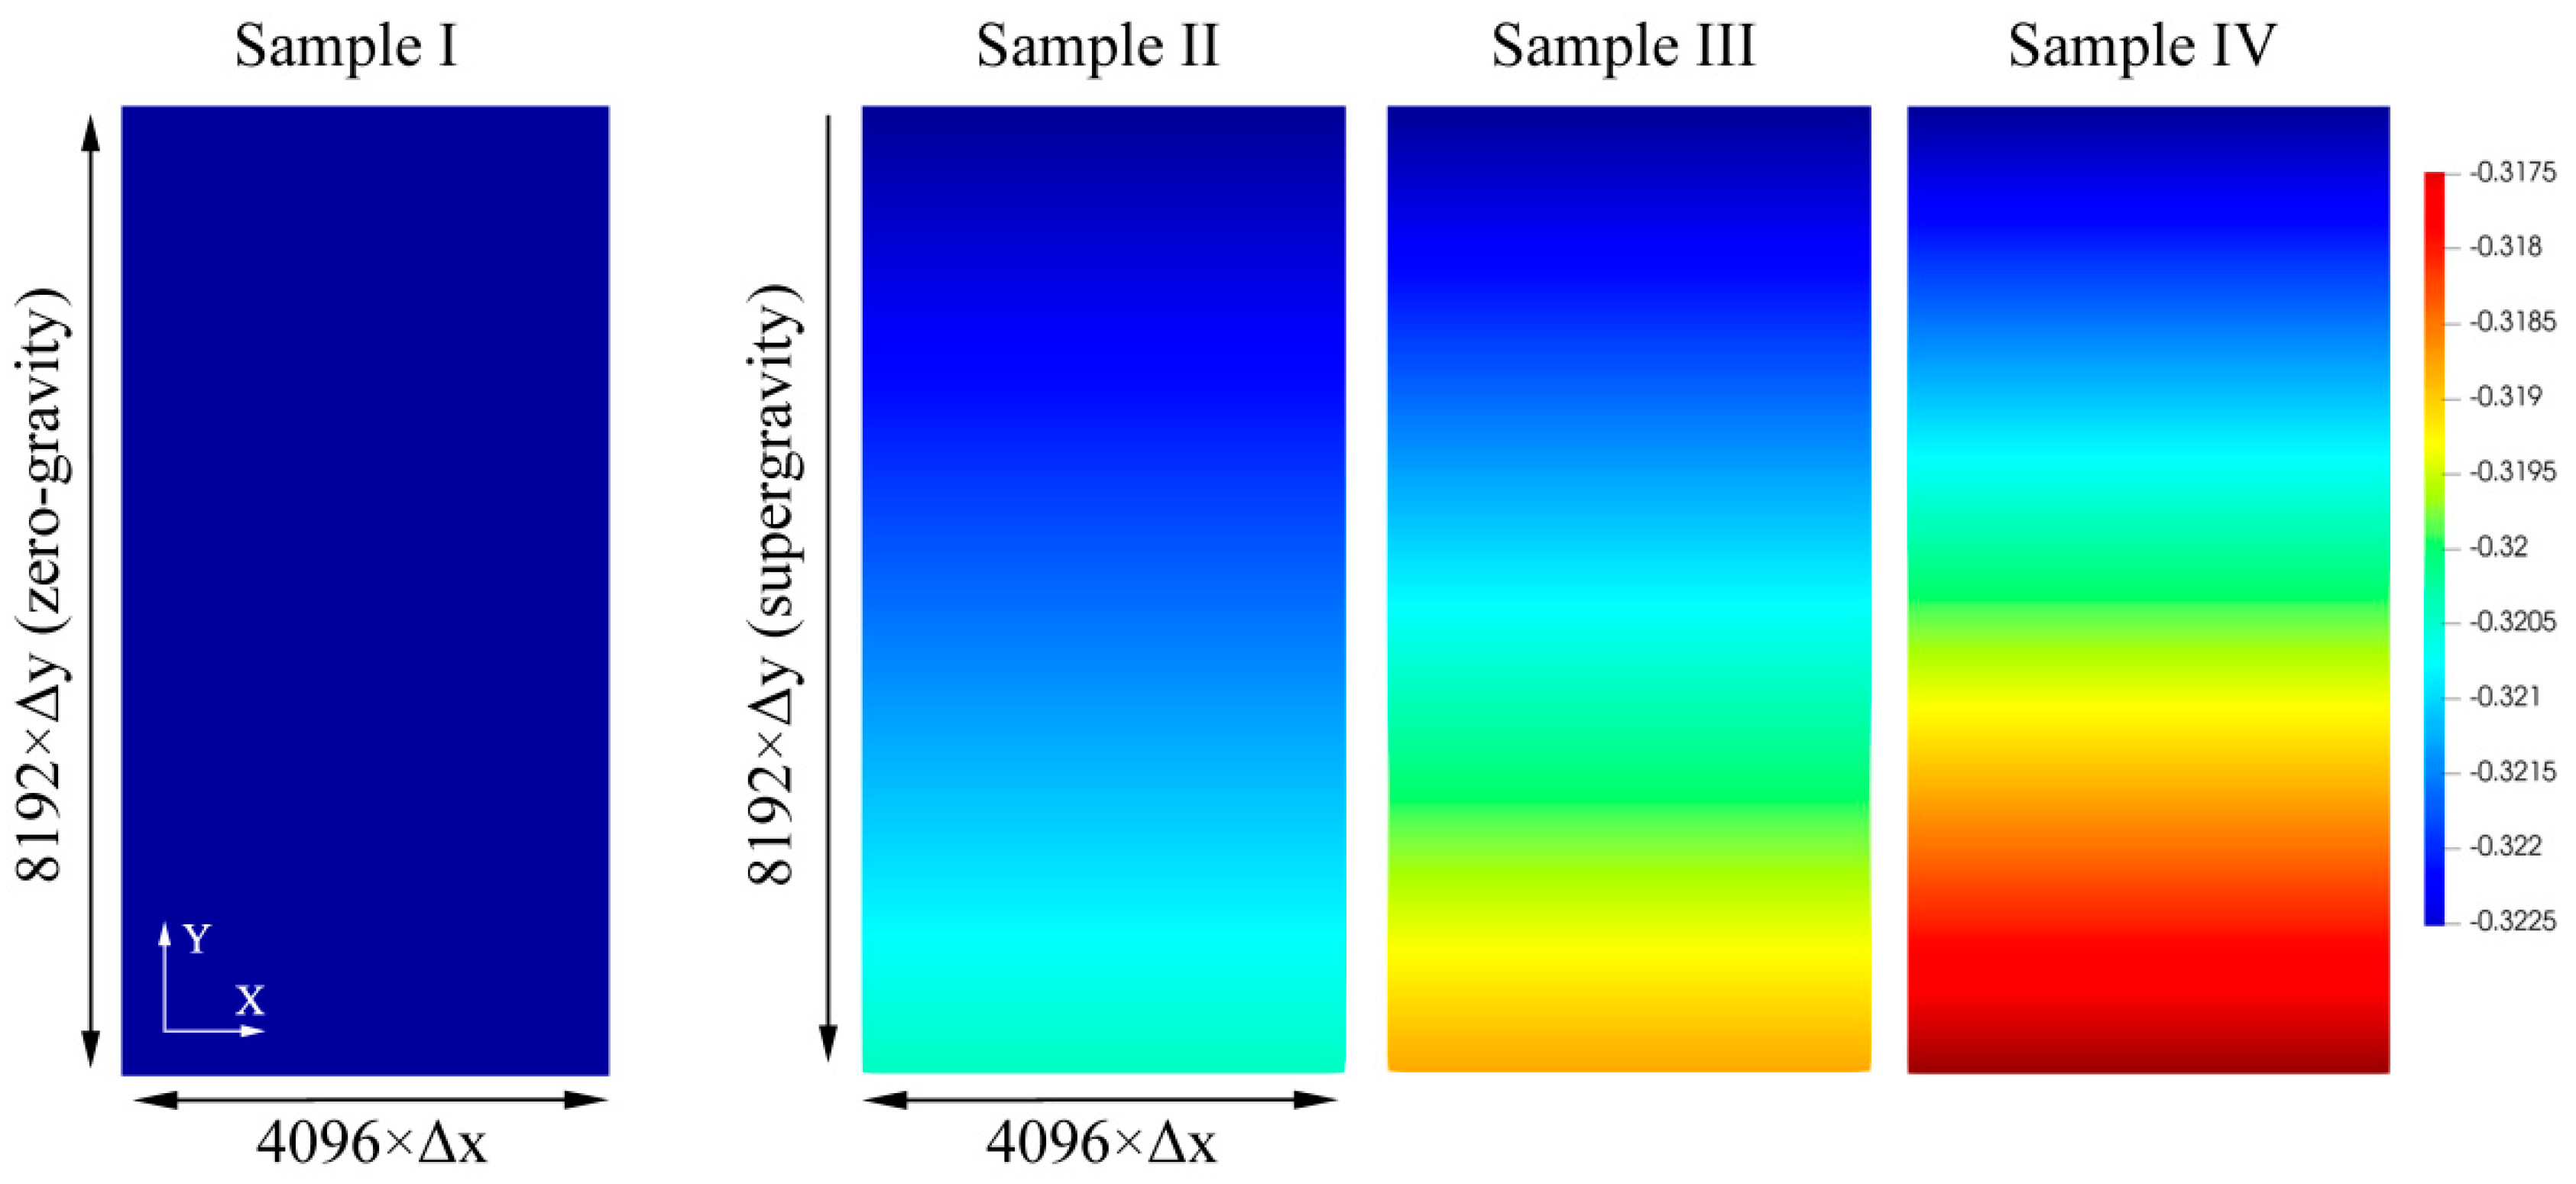
Figure 7.
The density ϕ distribution of sample I–IV in their equilibrium states. The equilibrium state in the zero-gravity field (sample I) is a homogeneous liquid phase, and the density of the liquid phase in the supergravity field (sample II–IV) is distributed on a gradient along the direction of supergravity.

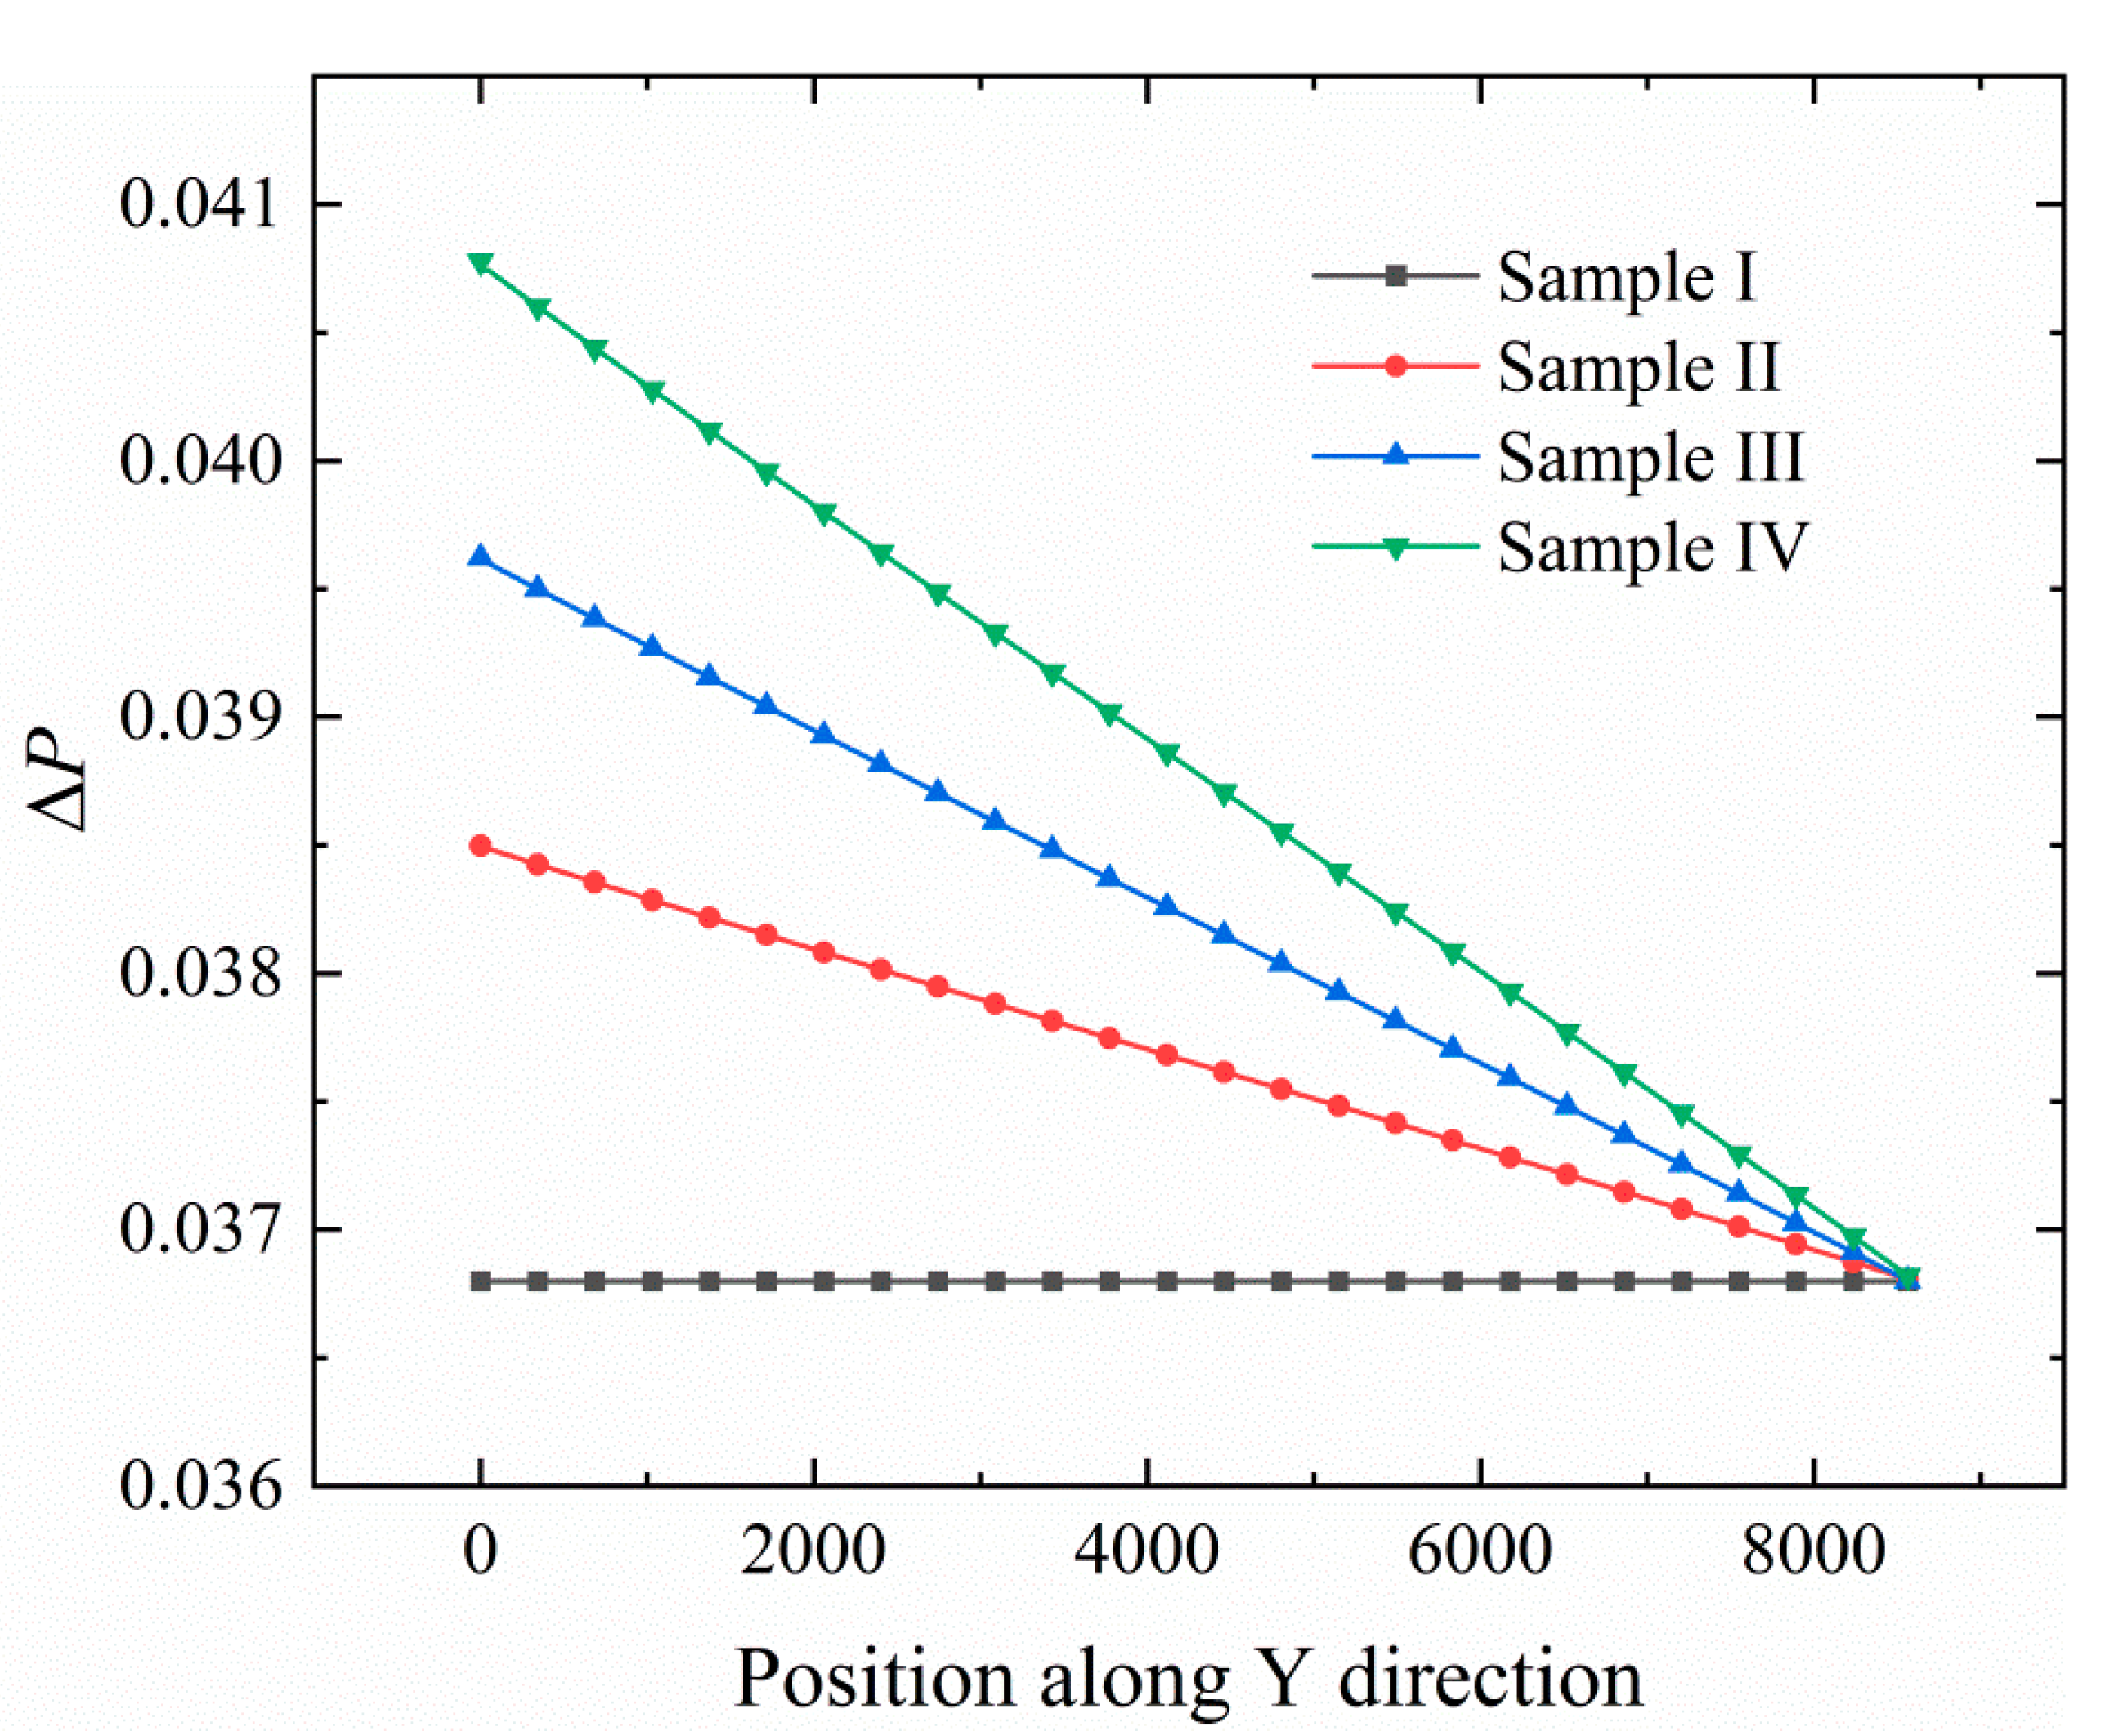
Figure 8.
Distribution of ΔP in equilibrated sample I–IV along the direction of supergravity (the Y direction). Gradient distribution of the pressure in undercooled liquid can be clearly observed, and the supergravity field strength is arranged in the order of sample IV > sample III > sample II > sample I.
3.3. Effects of the Supergravity Field on the Solidification Microstructures
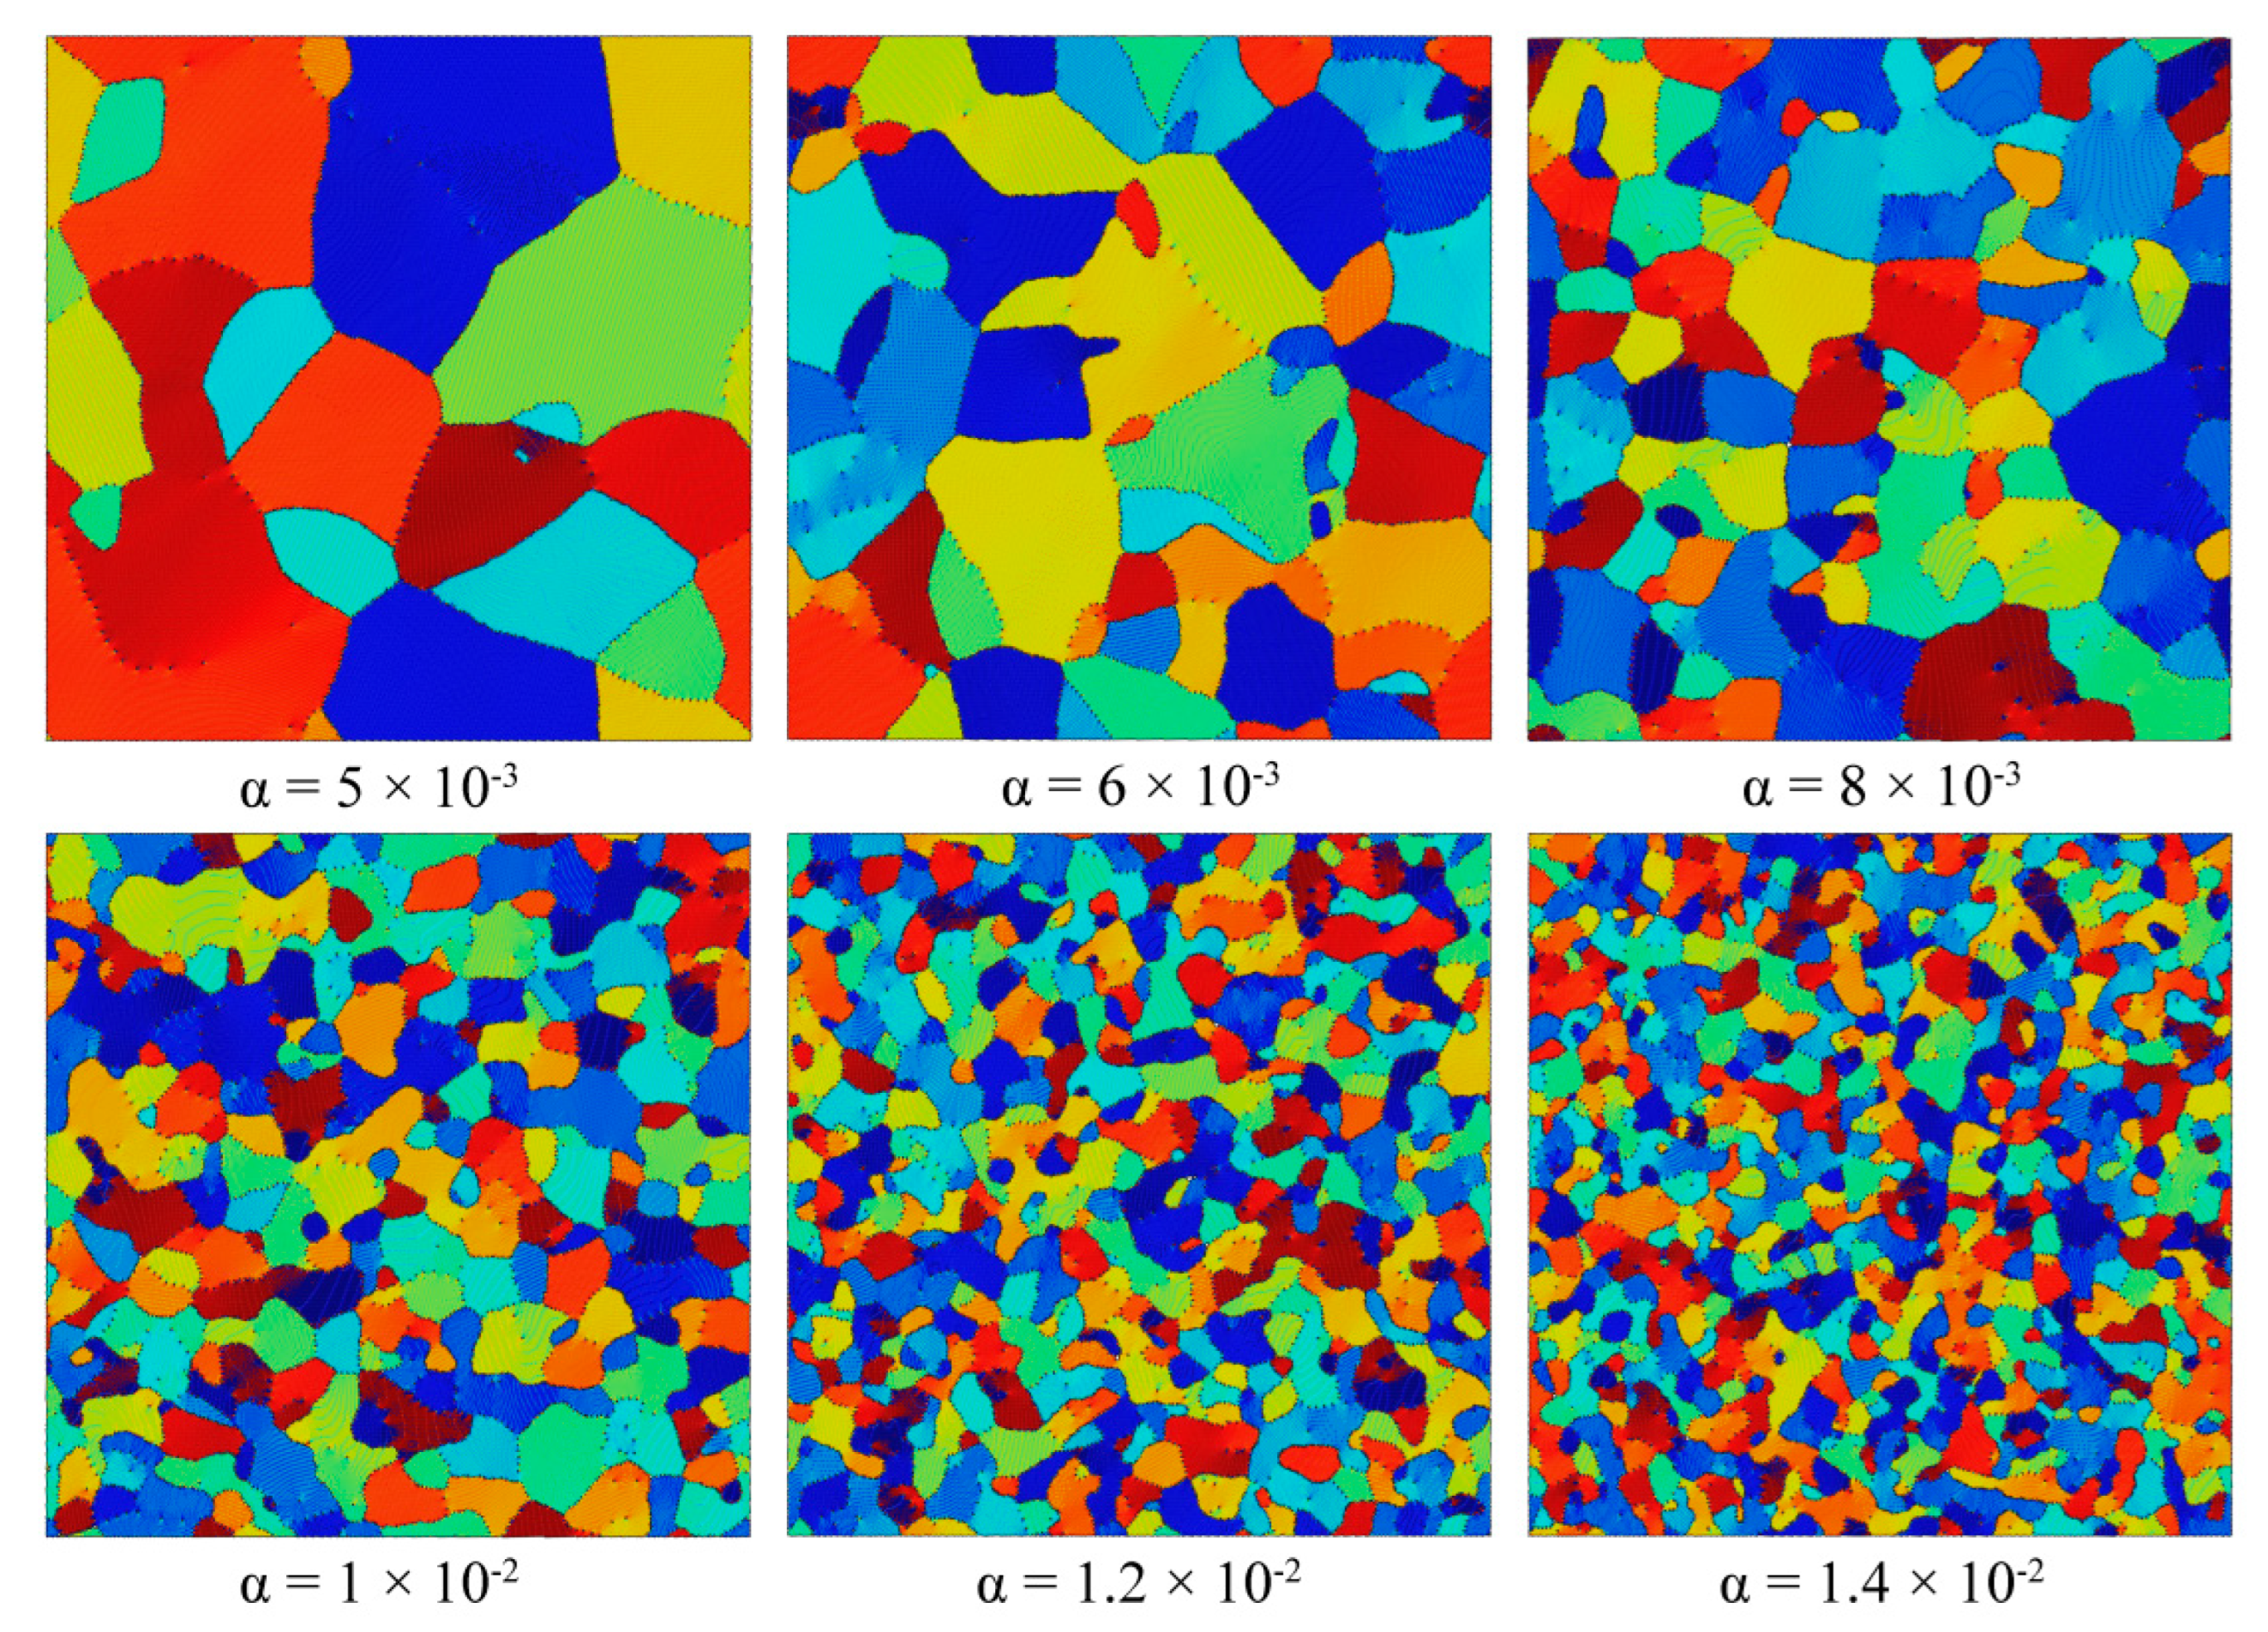
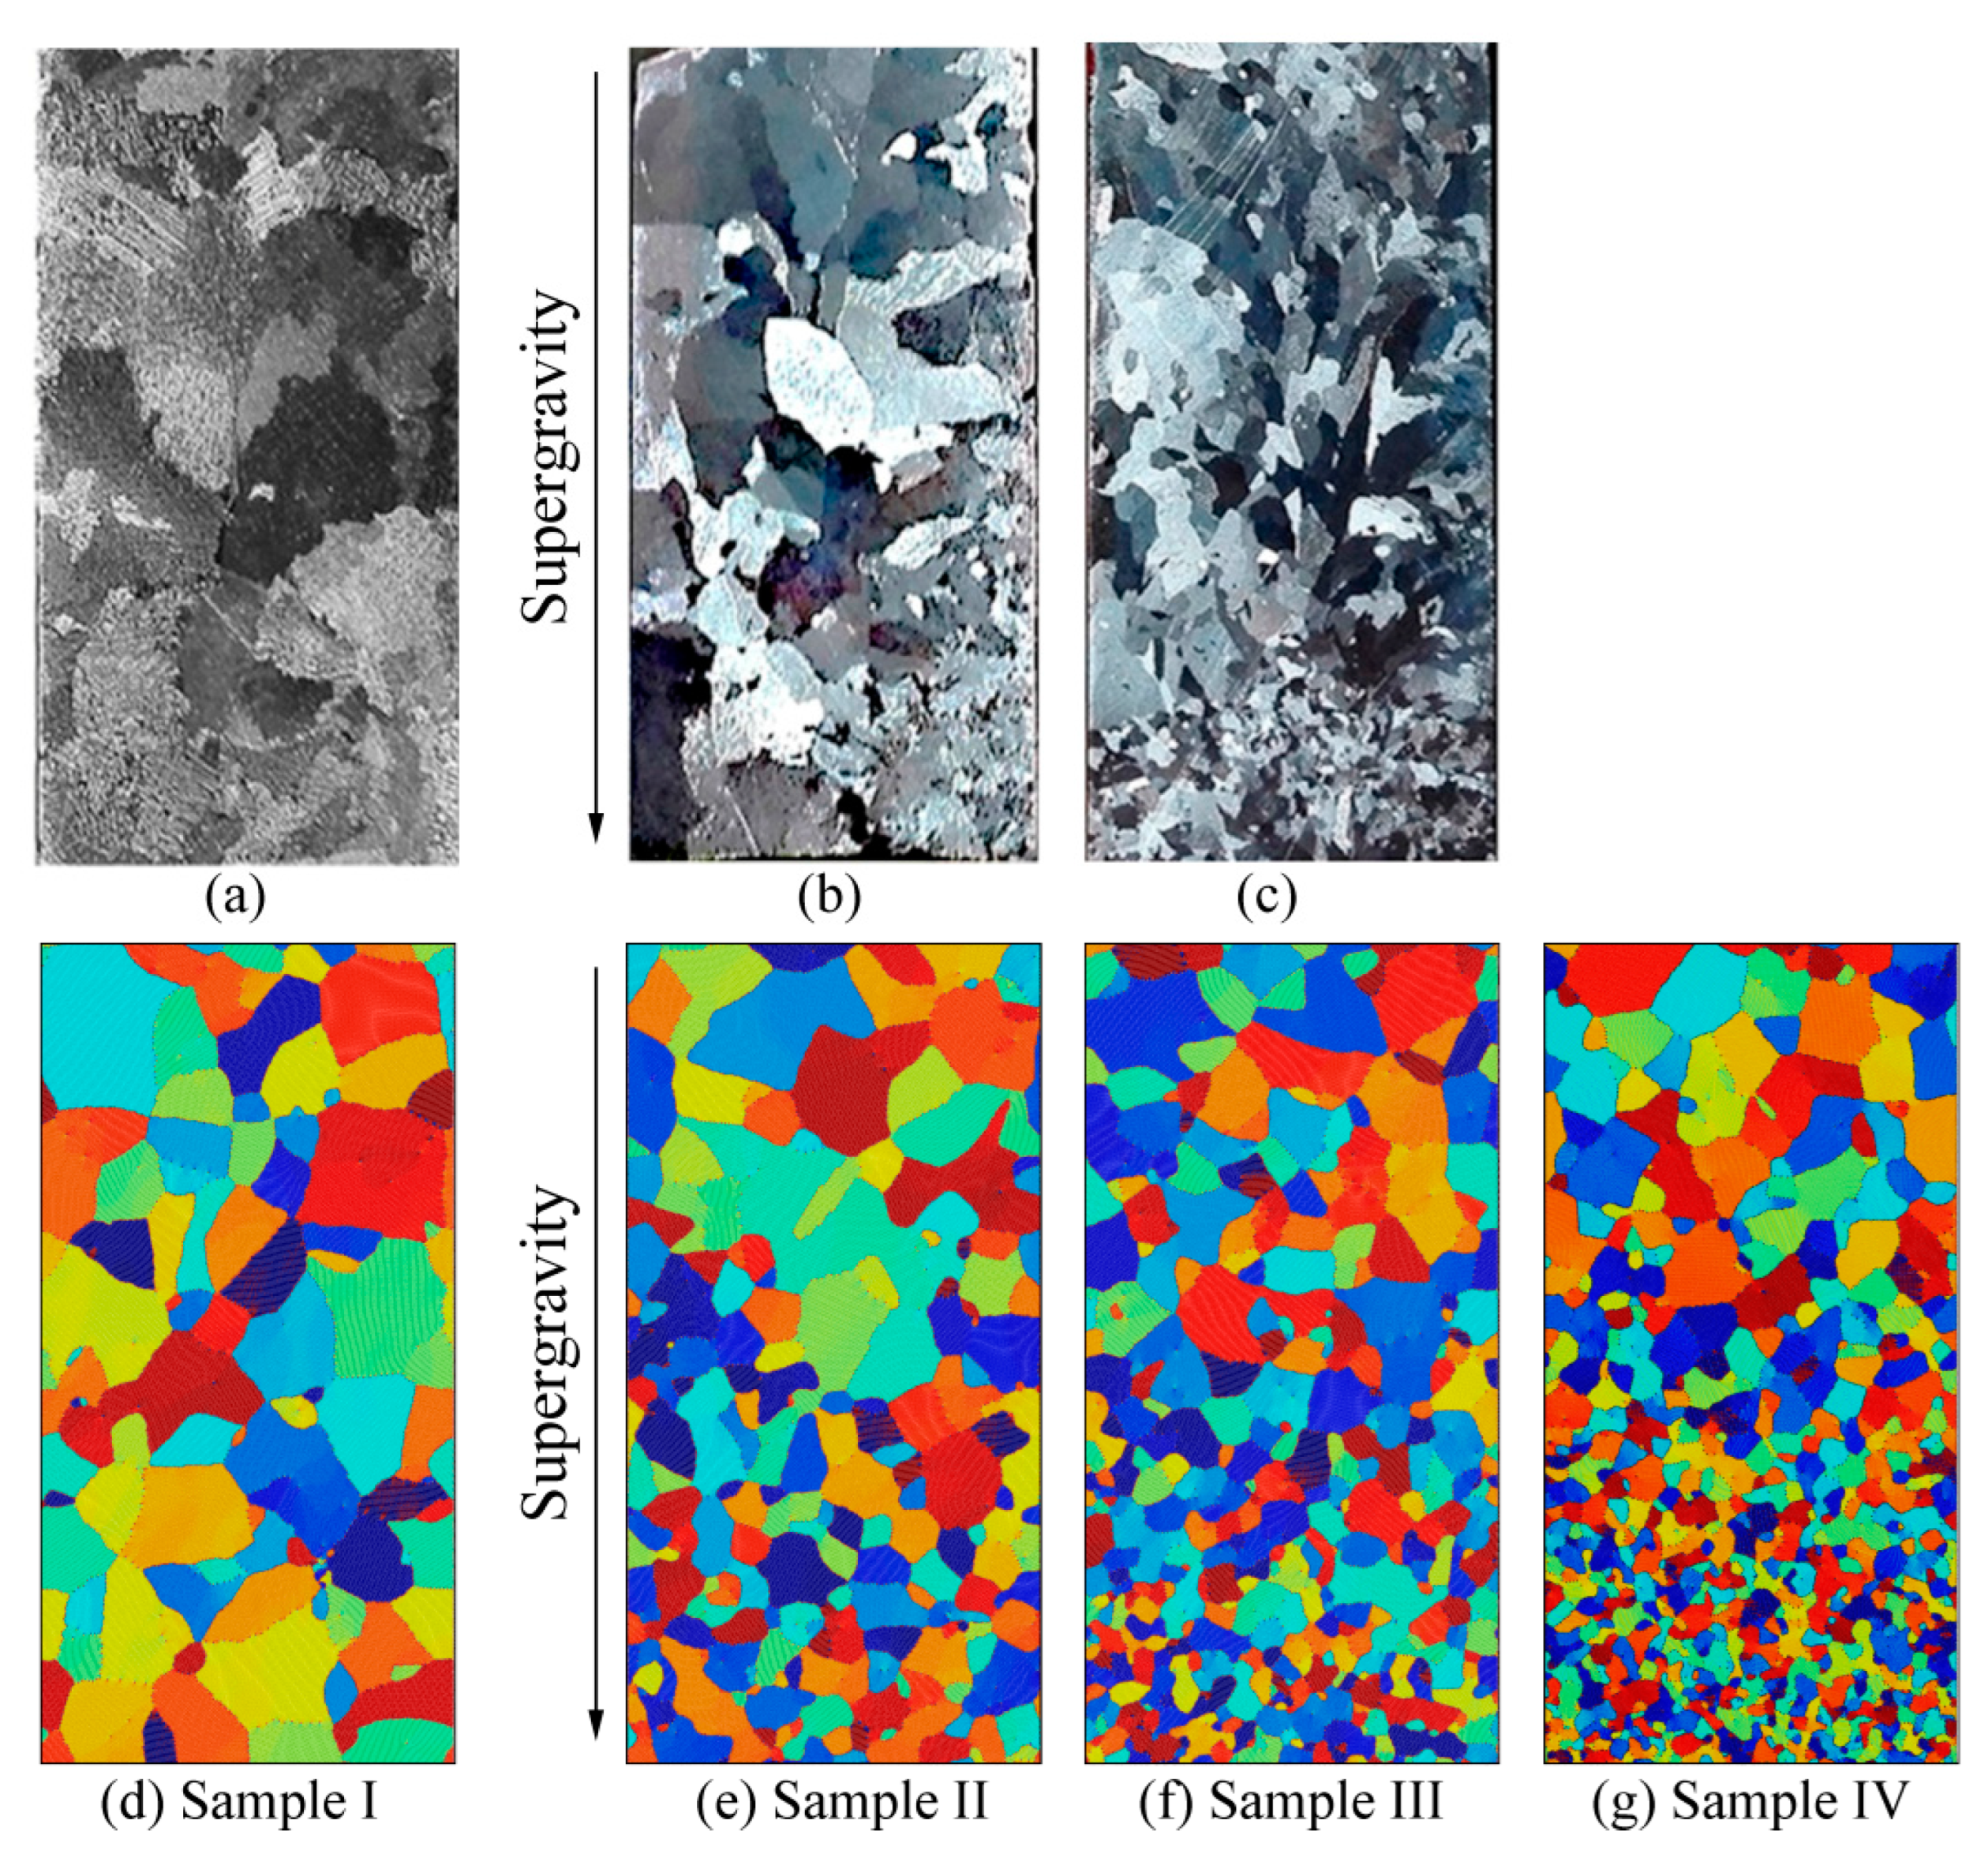
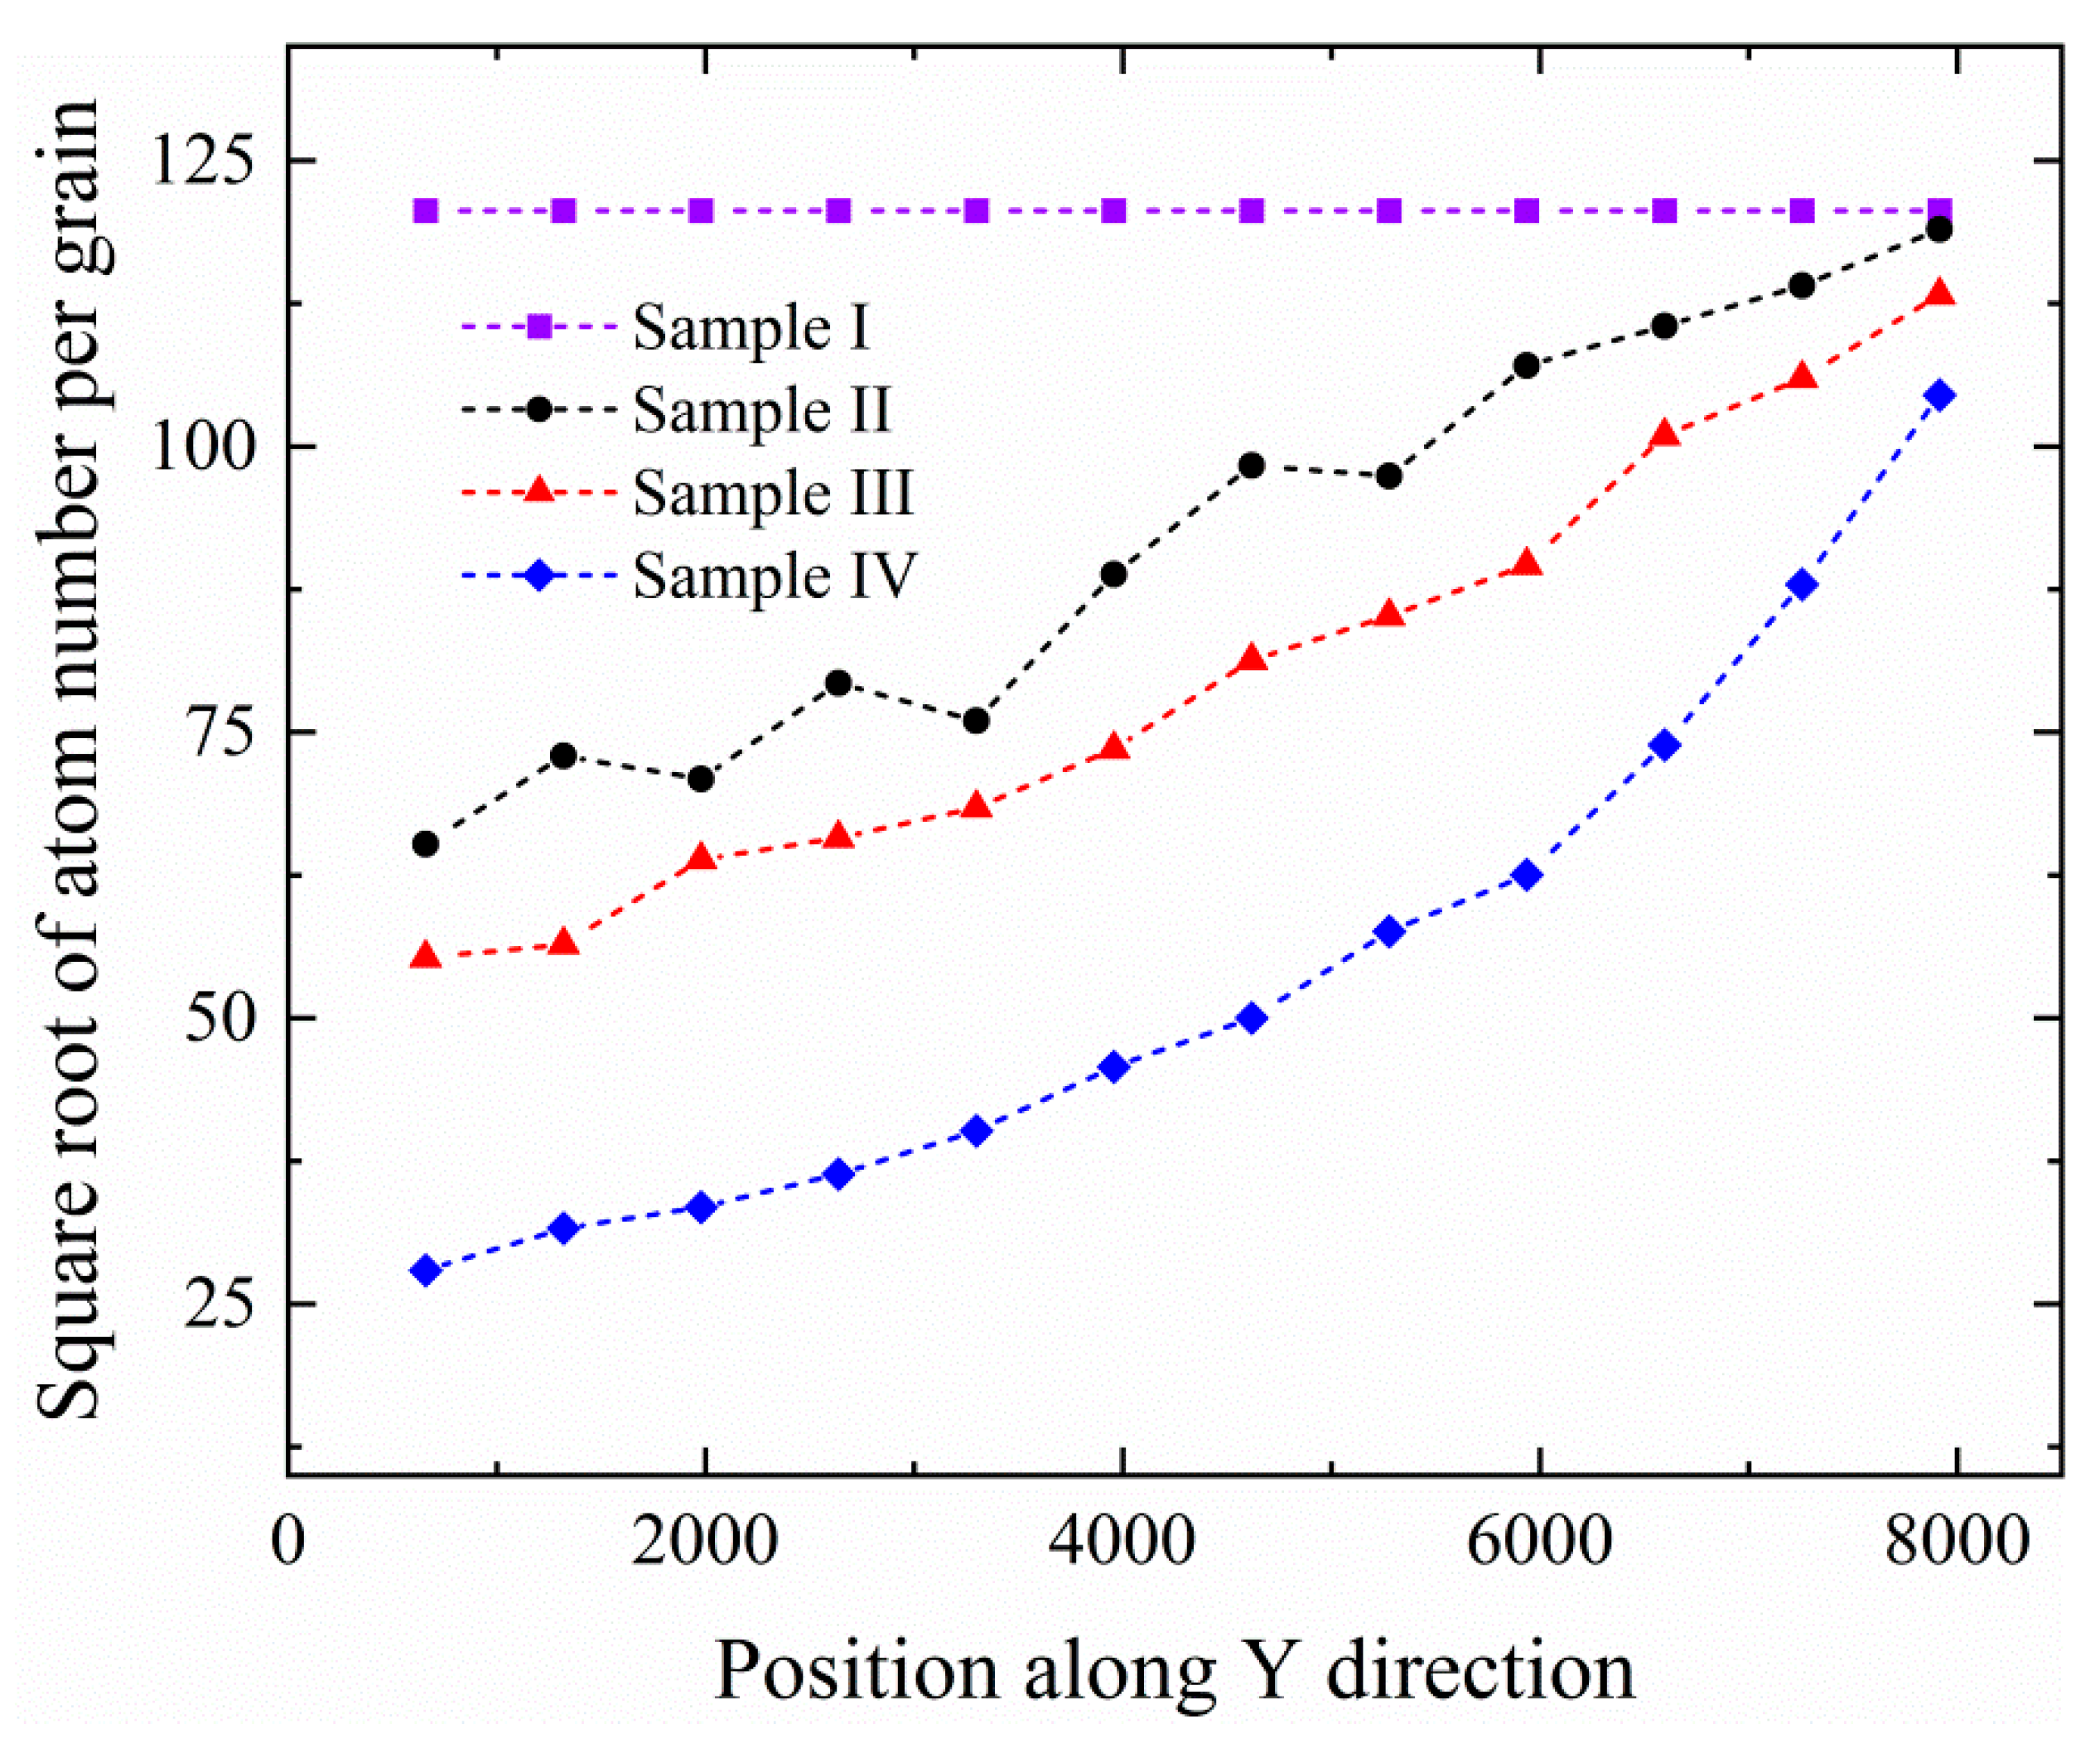
Homogeneous nucleation in the undercooled liquid is simulated in aid of the Gaussian noise. Noise amplitude α has a significant impact on the nucleation rate of the homogeneous liquid phase [32], which means the grain size of solidification structure would be controlled by changing noise amplitude [24]. In order to phenomenally reveal the effect of the supergravity field on the solidification structure, the appropriate noise amplitude should be selected. Figure 9 shows the solidification structures of the homogeneous liquid phase corresponding to six sets of noise amplitude from small to large. It can be clearly observed that the grain size decreases with the increase in the noise amplitude. Small noise amplitude produces too coarse grains, which is not conducive to revealing the characteristic of solidification structure under the supergravity field. On the other hand, excessive noise amplitude generally produces a large number of grain “fragments” instead of standard grains with distinguishable hexagonal patterns. Therefore, we set the amplitude of noise to be α = 1.2 × 10⁻² after testing. The evolution time during the solidification for each sample is t = 6000, and then the temperature parameter ε is set to be −0.35 to eliminate a small amount of residual liquid phase. Figure 10a–c respectively shows the experimental microstructure of the Al-4.5 wt % Cu melt solidified under normal-gravity, 100-times normal-gravity, and 500-times normal-gravity fields [13], and the solidification structures of the four samples simulated in this work are shown in Figure 10d–g. The areas with different colors in Figure 10d–g represent grains with different orientations. It can be clearly observed from Figure 10 that the solidification structure simulated by the PFC model is consistent with the results of the supergravity experiment. The grain refinement and graded microstructure caused by the supergravity field are reproduced in our simulation results. Figure 11 shows the distribution of the grain size along the direction of supergravity after the solidification is completed. In order to eliminate the randomness arising from the nucleation, we conduct three repeated simulations and take the average value of grain size. Since sample I is a homogeneous liquid, the grain size is spatially uniform with no graded structure. Thus, sample I shown in Figure 11 serves as a reference for the average grain size without the influence of supergravity. According to the results in Figure 10 and Figure 11, we can conclude that the grain size gradually decreases along the direction of supergravity, and, with the increase in the strength of the supergravity field, the gradient distribution of grain size becomes more significant. Besides, the grain refinement becomes more noteworthy with the increment in the strength of the supergravity field as well.

Figure 9.
The solidification structure formed by applying different noise amplitudes in the undercooled homogeneous liquid phase. The other parameters of the simulations are ε = −0.3, = −0.32, Δt = 0.2, . Blocks of different colors correspond to grains with different orientations.
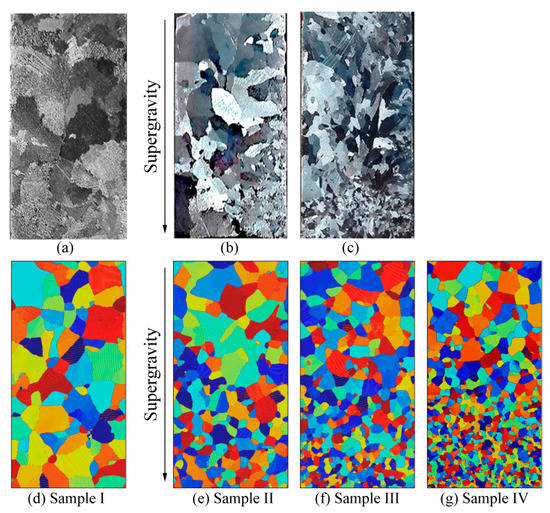
Figure 10.
The experimental microstructure of the Al-4.5 wt % Cu melt solidified under normal-gravity (a), 100-times normal-gravity (b), and 500-times normal-gravity fields (c) [13]. The solidification structures of the four samples simulated in this work are shown in (d–g), where (d) is the solidification structure in the zero-gravity field, and (e–g) are the solidification structures in the increasing strength of the supergravity field. Different colors correspond to grains with different orientations.
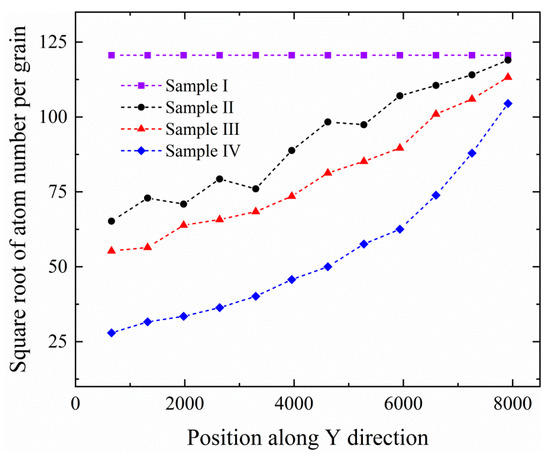
Figure 11.
The square root of atomic number per grain as the measure of grain size along the supergravity direction after the solidification in sample I–IV. The grain size is spatially uniform with no graded structure in sample I, so that the global average grain size is calculated as a reference.
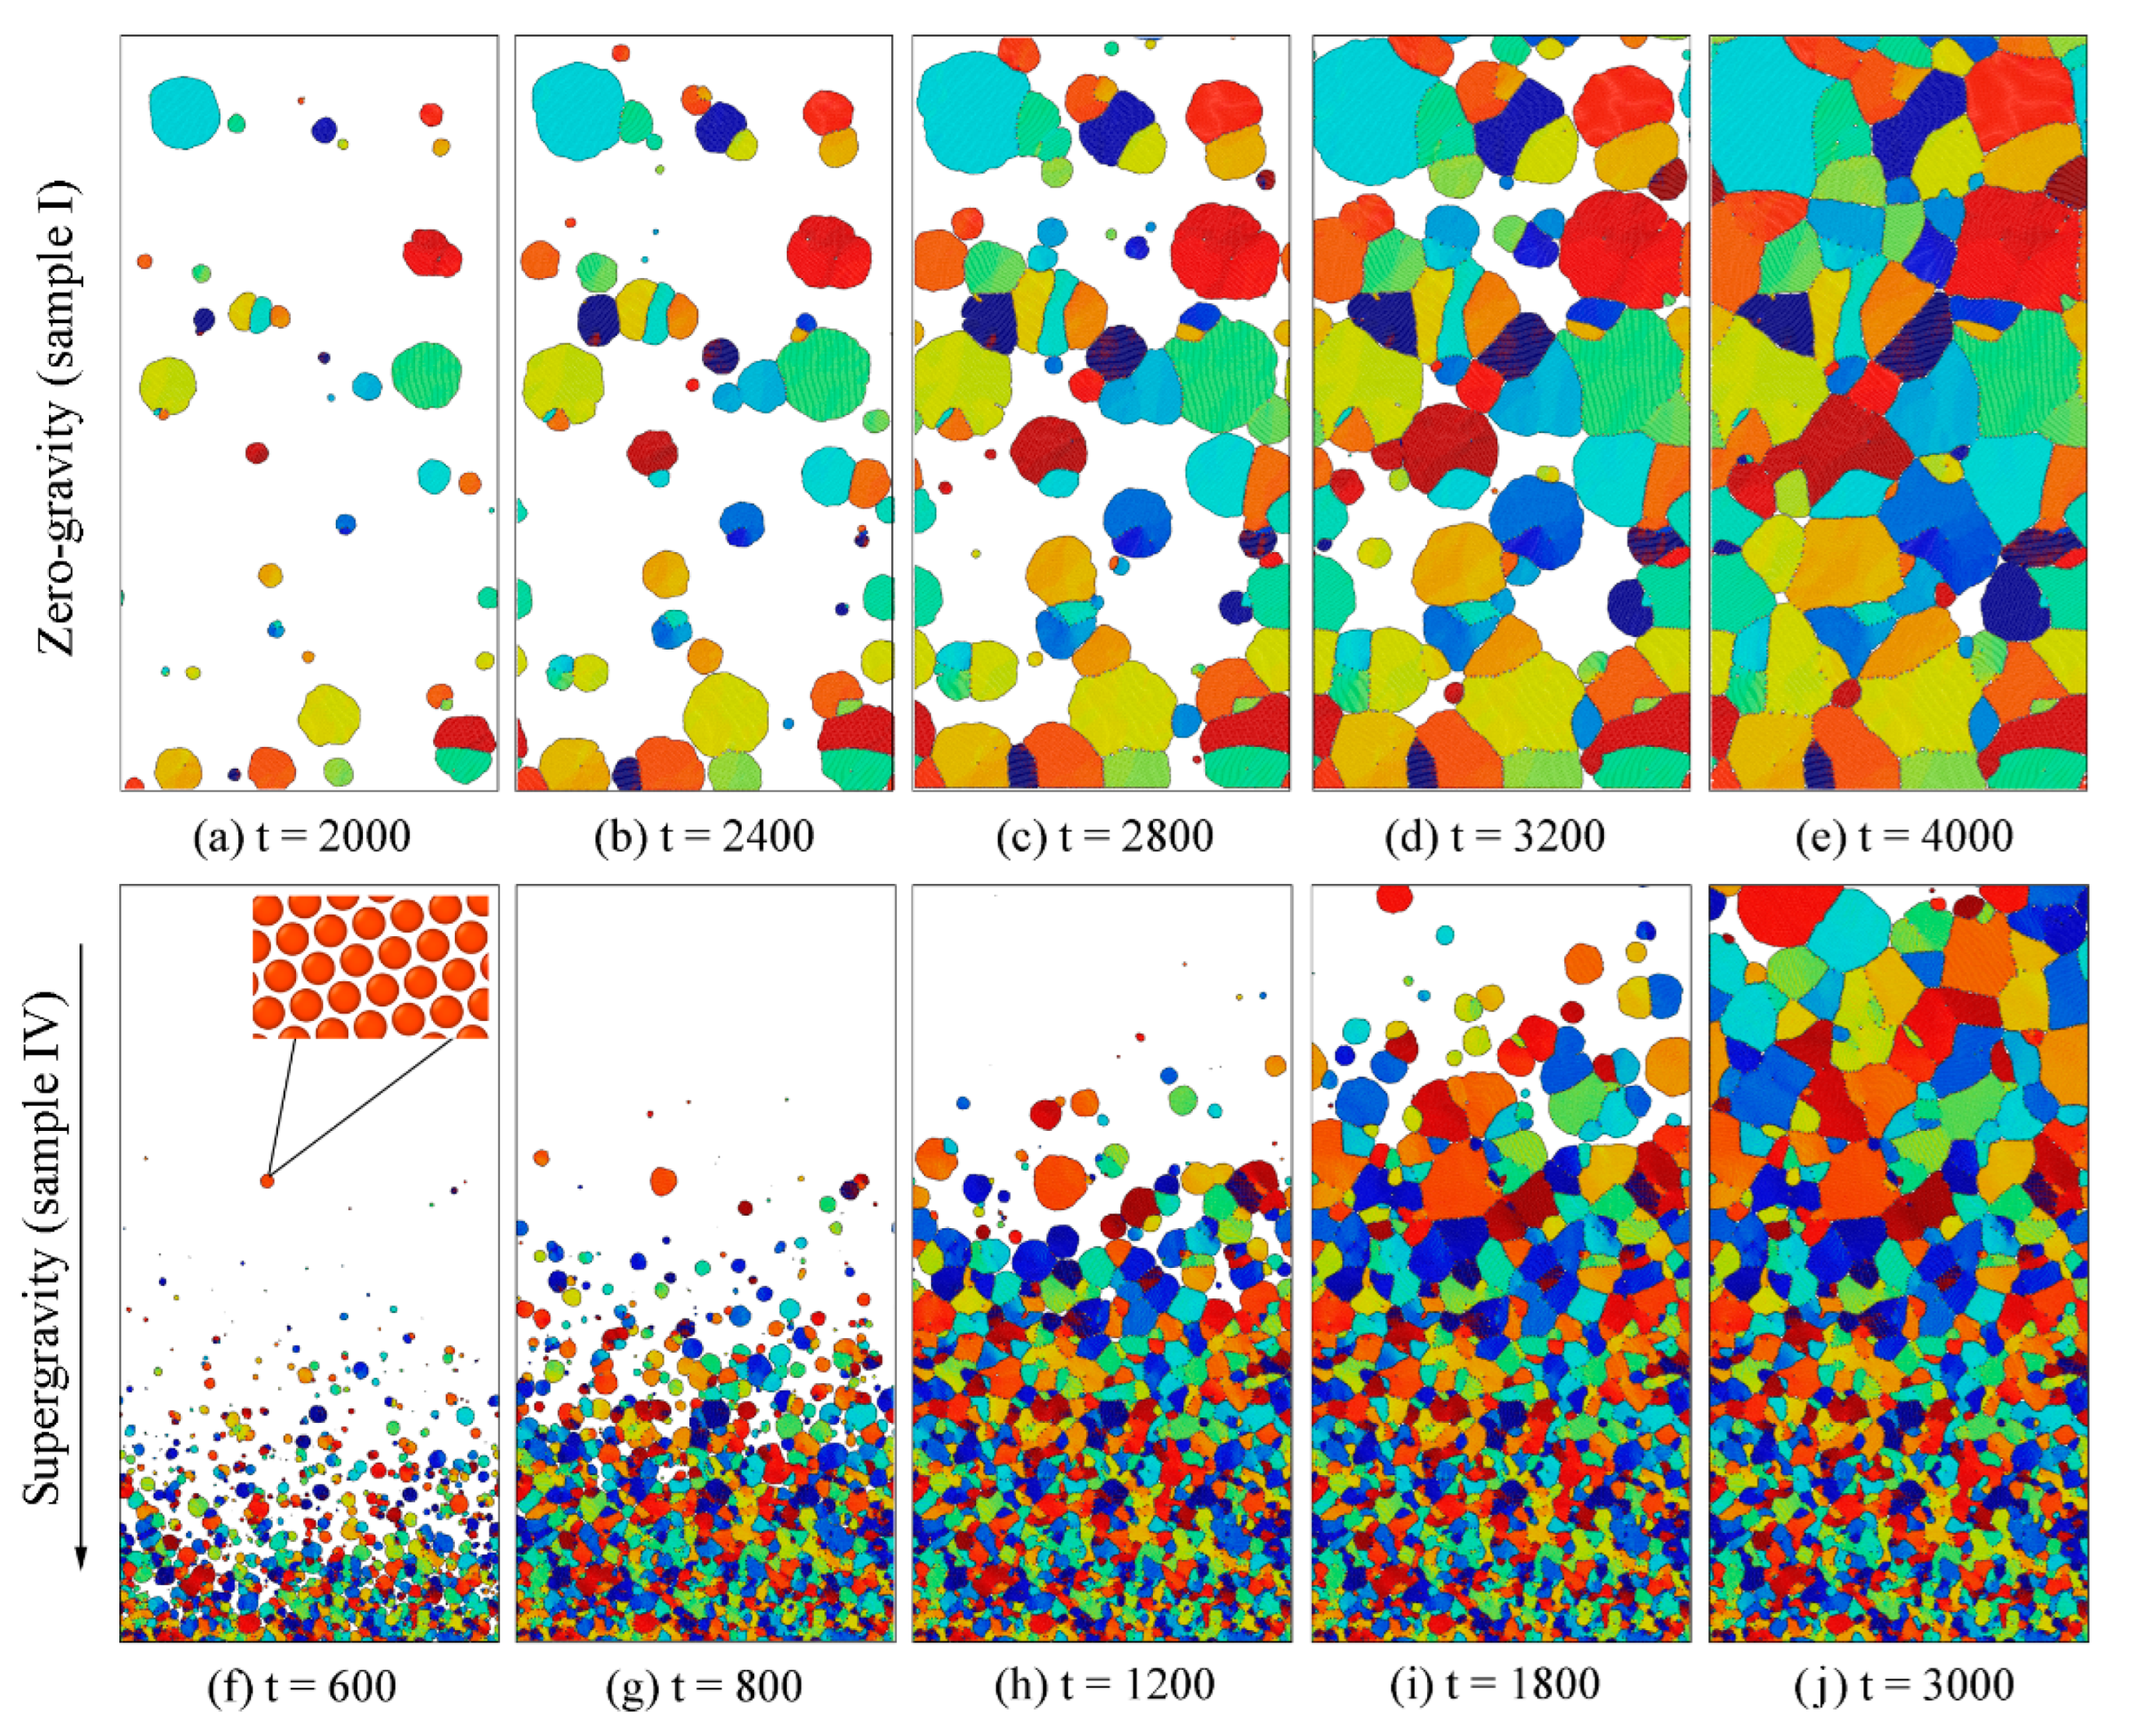
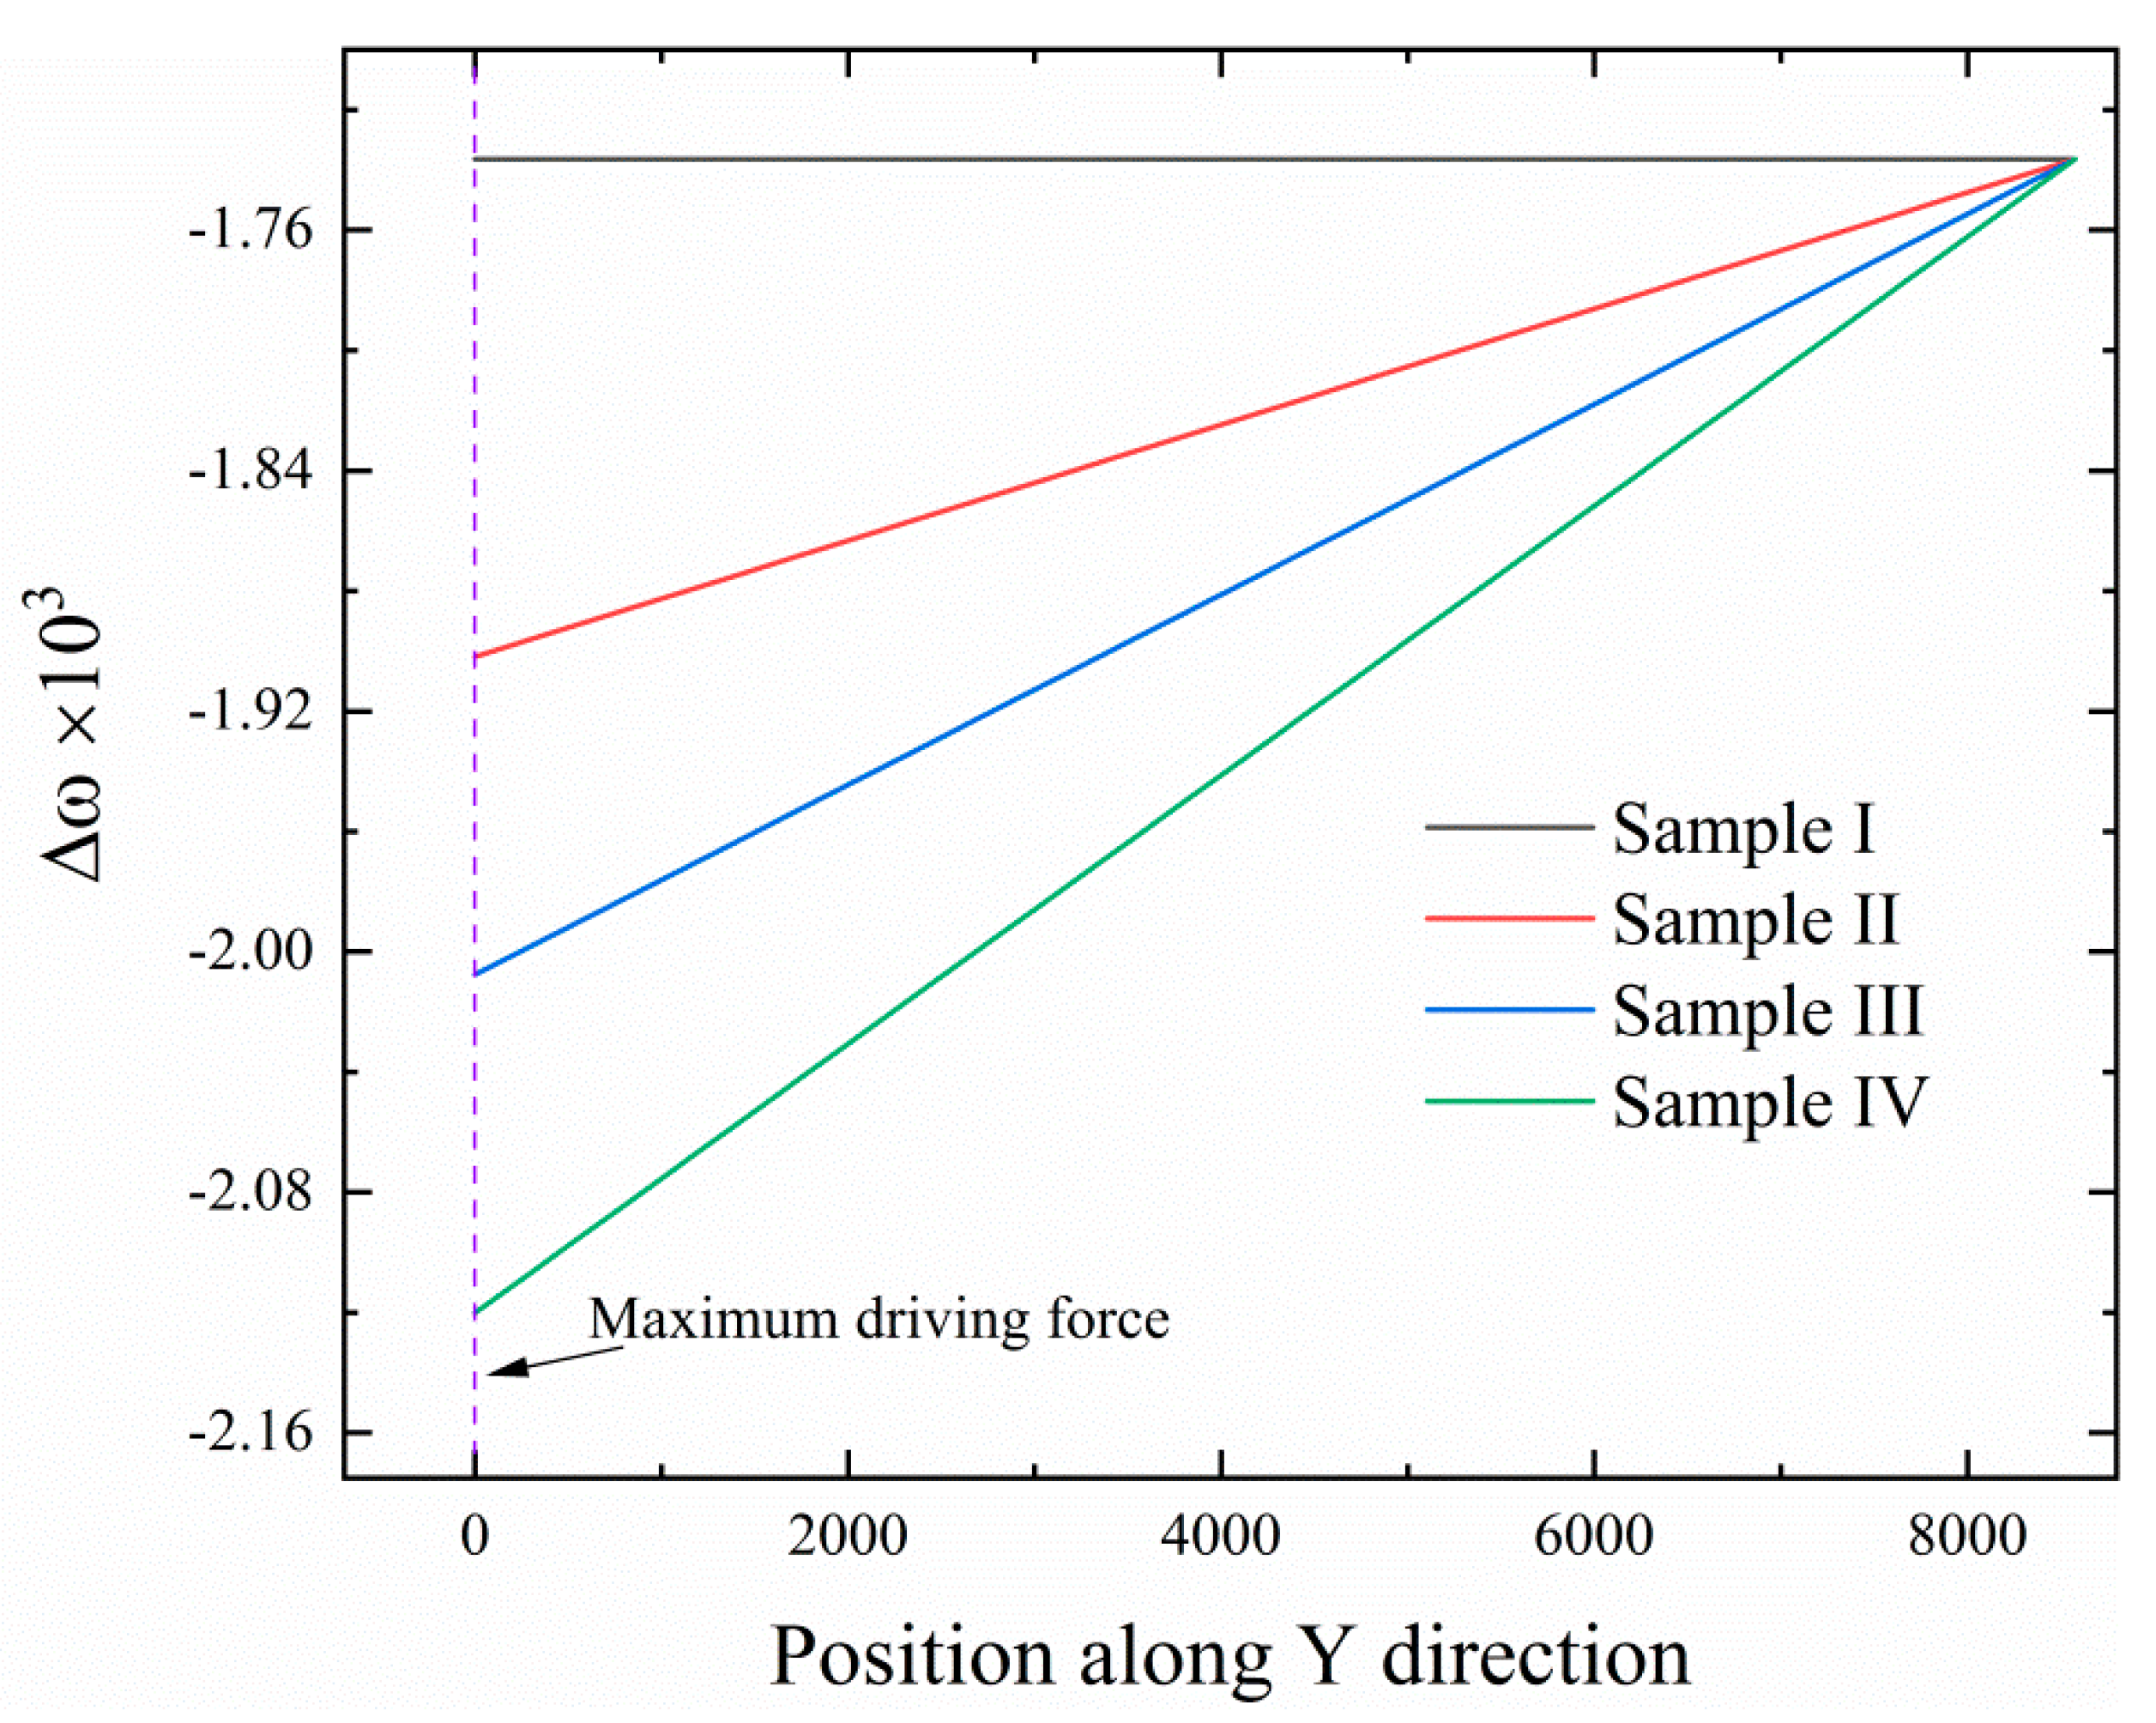
Evolutions of the solidification structure under the zero-gravity field (sample I) and supergravity field (sample IV) are shown in Figure 12. The colored area represents the solid phase (or grains) and the blank area is the liquid phase. Different grains are discriminated by their orientations using different colors. The inset in Figure 12f shows the atomic structure of the grain. Obviously, the crystal nuclei in sample I are randomly generated in space and then gradually grow up. However, in sample IV, the solidification prefers to nucleate at the positions where the supergravity is the strongest, and then gradually advances towards the undercooled liquid along the direction of the decreasing supergravity, which is in line with the experimental observation reported by Zimmermann et al. [33]. In sample IV, the nucleation rate increased significantly along the supergravity direction, which directly leads to the grain refinement and graded microstructure. To explain the effect of the supergravity field on the solidification structure from the perspective of thermodynamics, we calculate the driving force for the crystallization in the four samples. The driving force Δω for the crystallization is defined as [34]:
where and are the free energy of hexagonal phase (or solid phase) and liquid phase, respectively. The calculated Δω as a function of Y co-ordinate for the four samples is shown in Figure 13, where the purple dotted line marks the location of the maximum driving force. It can be seen from Figure 13 that the driving force for the crystallization linearly decreases along the direction of the decreasing supergravity. Consequently, the nucleation rate becomes smaller and smaller as the solid–liquid interface advances toward the undercooled liquid where the supergravity is weak. In other words, a stronger supergravity field produces a greater driving force for the nucleation. Thus, the solidification prefers to happen in the undercooled liquid with the highest supergravity, and eventually results in the formations of the graded solidification structure with finer grains.
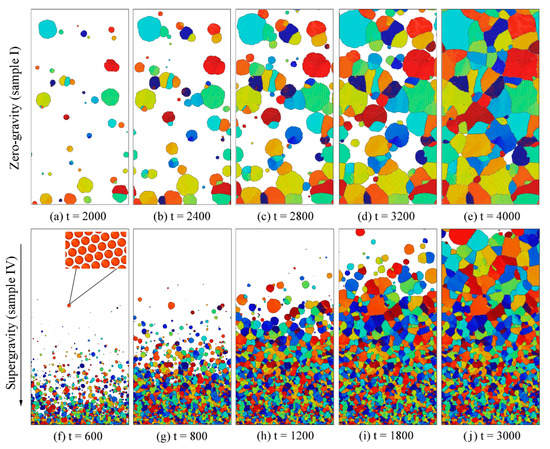
Figure 12.
Grain nucleation and growth under (a–e) the zero-gravity field (sample I) and (f–j) supergravity field (sample IV). The colored area represents the solid phase and the blank area is the liquid phase. Different colors represent the grains with different orientation. The atomic structure of the solid phase is shown in the inset in (f).
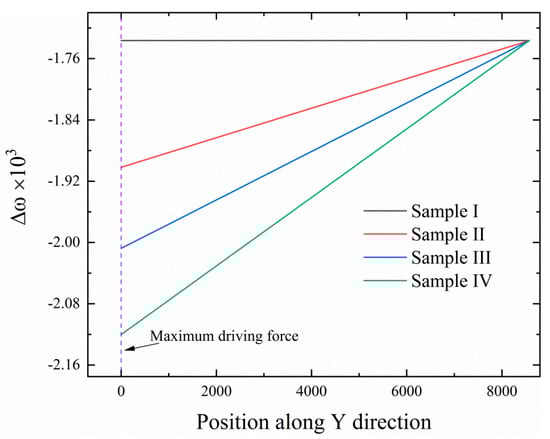
Figure 13.
The driving force for the crystallization in sample I–IV under different supergravity strengths. The purple dotted line marks the location of the maximum driving force.
4. Conclusions
In this work, a PFC model for the solidification of the undercooled liquid under supergravity fields is developed and utilized to study the roles of the supergravity on the solidification microstructures, as well as crystallite nucleation and growth. The solidification microstructures obtained by us are qualitatively consistent with the counterpart of experimental observations. Our main results are summarized as follows.
The energy penalty term is added to the free-energy functional to simulate the equilibrium characteristics of the undercooled liquid under supergravity field. The pressure in the liquid presents a gradient distribution along the supergravity direction, and the pressure gradient linearly correlates to the parameter G in the penalty term due to limited range of the allowed average density in present PFC model framework.
Four samples (I–IV) are specially designed for solidifications under four different supergravity fields, respectively. After the equilibrium state is achieved under the supergravity field, the pressure of the liquid in samples II–IV gradually increases along the supergravity direction, which coincides with the pressure distributions in experiments. The results indicate that supergravity fields with different strengths have been successfully created in the samples. Sample I corresponds to a zero-gravity environment, samples II–IV correspond to a supergravity field, and the strength of the supergravity field decreases according to a sequence of sample IV > sample III > sample II.
Homogenous nucleation during the solidification of the undercooled liquid under the zero-gravity field and supergravity field is simulated by imposing Gaussian noise during the evolutions of the order parameter. The grain refinement and gradient distribution of grain size caused by the supergravity field are clearly observed in the solidification structure. With the growing strength of the supergravity field, grains can be further refined, and the graded microstructure is more significant as well. The real-time evolutions of the microstructure during solidification are obtained. It is found that crystallites are randomly nucleated in space under a zero-gravity field, but prefer to nucleate at the location with the highest supergravity strength. The nucleation rate increases with the growth of the supergravity strength, which directly gives rise to the formation of the graded microstructure in the solidification structure. The driving force for crystallization in the undercooled liquid is calculated, and the results show that the driving force grows with the increment in the supergravity strength. This explains the reason for the grain refinement and graded microstructure caused by the supergravity field from the perspective of thermodynamics.
Finally, as the first application of the PFC model in the field of centrifugal casting, we have made several approximations and simplifications to the actual engineering application from the perspective of model and simulation, and firmly grasped the typical feature of the gradient distribution of pressure during solidification. Solidification structure images consistent with the experimental results were obtained. However, the current PFC model needs to be further developed in future work, which enables the model to take into account more realistic influencing factors’ effect on solidification structure, such as subcooled temperature, heterogeneous nucleation, turbulent flow, etc.
Author Contributions
N.H.: Writing—original draft, Writing. Y.H.: Software, Visualization, review & editing. K.W.: Supervision, Conceptualization, Methodology, Writing—review & editing. W.H.: Conceptualization, Methodology. J.C.: Conceptualization, Methodology. H.D.: Funding acquisition, Supervision, Conceptualization, Methodology. All authors have read and agreed to the published version of the manuscript.
Funding
This research was funded by the National Key Research and Development Program of China (No. 2018YFB0704000), National Natural Science Foundation of China (NSFC-NSAF U1830138, 12072044), the Fundamental Research Funds for the Central Universities and National Defense Science and Technology Key Laboratory Foundation (No. 6142A05200102).
Institutional Review Board Statement
Not applicable.
Informed Consent Statement
Not applicable.
Data Availability Statement
Data sharing is not applicable.
Conflicts of Interest
The authors declare no conflict of interest.
References
- Favez, D.; Wagnière, J.D.; Rappaz, M. Au–Fe alloy solidification and solid-state transformations. Acta Mater. 2010, 58, 1016–1025. [Google Scholar] [CrossRef] [Green Version]
- Frazier, W.E. Metal Additive Manufacturing: A Review. J. Mater. Eng. Perform. 2014, 23, 1917–1928. [Google Scholar] [CrossRef]
- Vajd, A.; Samadi, A. Optimization of Centrifugal Casting Parameters to Produce the Functionally Graded Al–15wt%Mg2Si Composites with Higher Tensile Properties. Int. J. Met. 2019, 14, 937–948. [Google Scholar] [CrossRef]
- Li, J.; Ma, J.; Gao, Y.; Zhai, Q. Research on solidification structure refinement of pure aluminum by electric current pulse with parallel electrodes. Mater. Sci. Eng. A 2008, 490, 452–456. [Google Scholar] [CrossRef]
- Li, X.; Gagnoud, A.; Ren, Z.; Fautrelle, Y.; Moreau, R. Investigation of thermoelectric magnetic convection and its effect on solidification structure during directional solidification under a low axial magnetic field. Acta Mater. 2009, 57, 2180–2197. [Google Scholar] [CrossRef]
- Saleh, B.; Jiang, J.; Ma, A.; Song, D.; Yang, D. Effect of Main Parameters on the Mechanical and Wear Behaviour of Functionally Graded Materials by Centrifugal Casting: A Review. Met. Mater. Int. 2019, 25, 1395–1409. [Google Scholar] [CrossRef]
- Li, S.-Y.; Qin, S.-Y.; Xi, X.-J.; Sun, G.-Y.; Yang, W.-S.; Guo, J.; Guo, H.-J. Solidified Structure Refinement of H13 Tool Steel under a Multi-Rotational Speed Super Gravity Field. Metals 2020, 10, 1428. [Google Scholar] [CrossRef]
- Gan, Z.; Wu, H.; Sun, Y.; Su, Y.; Wang, Y.; Wu, C.; Liu, J. Influence of Co contents and super-gravity field on refinement of in-situ ultra-fined fibers in Al-2.5Ni eutectic alloys. J. Alloys Compd. 2020, 822, 153607. [Google Scholar] [CrossRef]
- Nelson, T.; Cai, B.; Warnken, N.; Lee, P.D.; Boller, E.; Magdysyuk, O.V.; Green, N.R. Gravity effect on thermal-solutal convection during solidification revealed by four-dimensional synchrotron imaging with compositional mapping. Scripta Mater. 2020, 180, 29–33. [Google Scholar] [CrossRef]
- Li, R.; Wang, Z.; Guo, Z.; Liaw, P.K.; Zhang, T.; Li, L.; Zhang, Y. Graded microstructures of Al-Li-Mg-Zn-Cu entropic alloys under supergravity. Sci. China Mater. 2018, 62, 736–744. [Google Scholar] [CrossRef] [Green Version]
- Song, G.; Song, B.; Guo, Z.; Yang, Y.; Song, M. Separation of Non-metallic Inclusions from a Fe-Al-O Melt Using a Super-Gravity Field. Metall. Mater. Trans. B 2017, 49, 34–44. [Google Scholar] [CrossRef]
- Gan, Z.; Wu, H.; Sun, Y.; Jiang, P.; Su, Y.; Wu, C.; Liu, J. Super-gravity field assisted homogeneous distribution of sub-micron eutectic Si in Al–Si alloy. J. Alloys Compd. 2020, 817, 152701. [Google Scholar] [CrossRef]
- Yang, Y.; Song, B.; Yang, Z.; Song, G.; Cai, Z.; Guo, Z. The Refining Mechanism of Super Gravity on the Solidification Structure of Al-Cu Alloys. Materials 2016, 9, 1001. [Google Scholar] [CrossRef] [PubMed] [Green Version]
- Wen, X.; Bao, Q.; Guo, L.; Guo, Z. The introduction of super-gravity into optimization separation of bismuth and zinc from crude bismuth melt. Chem. Eng. Process. 2021, 160, 108266. [Google Scholar] [CrossRef]
- Elder, K.R.; Provatas, N.; Berry, J.; Stefanovic, P.; Grant, M. Phase-field crystal modeling and classical density functional theory of freezing. Phys. Rev. B 2007, 75, 064107. [Google Scholar] [CrossRef] [Green Version]
- Elder, K.R.; Katakowski, M.; Haataja, M.; Grant, M. Modeling elasticity in crystal growth. Phys. Rev. Lett. 2002, 88, 245701. [Google Scholar] [CrossRef] [Green Version]
- Toth, G.I.; Tegze, G.; Pusztai, T.; Toth, G.; Granasy, L. Polymorphism, crystal nucleation and growth in the phase-field crystal model in 2D and 3D. J. Phys. Condens. Matter 2010, 22, 364101. [Google Scholar] [CrossRef]
- Chen, Z.; Wang, Z.; Gu, X.; Chen, Y.; Hao, L.; de Wit, J.; Jin, K. Phase-field crystal simulation facet and branch crystal growth. Appl. Phys. A 2018, 124, 1–8. [Google Scholar] [CrossRef]
- Muhammad, S.; Li, Y.; Yan, Z.; Maqbool, S.; Shi, S.; Muhammad, I. Phase-field crystal modeling of crystal growth patterns with competition of undercooling and atomic density. Phys. Chem. Chem. Phys. 2020, 22, 21858–21871. [Google Scholar] [CrossRef]
- Tang, S.; Backofen, R.; Wang, J.; Zhou, Y.; Voigt, A.; Yu, Y.-M. Three-dimensional phase-field crystal modeling of fcc and bcc dendritic crystal growth. J. Cryst. Growth 2011, 334, 146–152. [Google Scholar] [CrossRef]
- Elder, K.R.; Huang, Z.F.; Provatas, N. Amplitude expansion of the binary phase-field-crystal model. Phys. Rev. E Stat. Nonlin. Soft Matter Phys. 2010, 81, 011602. [Google Scholar] [CrossRef] [PubMed] [Green Version]
- Gránásy, L.; Tegze, G.; Tóth, G.I.; Pusztai, T. Phase-field crystal modelling of crystal nucleation, heteroepitaxy and patterning. Philos. Mag. 2011, 91, 123–149. [Google Scholar] [CrossRef] [Green Version]
- Toth, G.I.; Pusztai, T.; Tegze, G.; Toth, G.; Granasy, L. Amorphous nucleation precursor in highly nonequilibrium fluids. Phys. Rev. Lett. 2011, 107, 175702. [Google Scholar] [CrossRef] [PubMed] [Green Version]
- Hubert, J.; Cheng, M.; Emmerich, H. Effect of noise-induced nucleation on grain size distribution studied via the phase-field crystal method. J. Phys. Condens. Matter 2009, 21, 464108. [Google Scholar] [CrossRef]
- Muralidharan, S.; Khodadad, R.; Sullivan, E.; Haataja, M. Multilayer thin film growth on crystalline and quasicrystalline surfaces: A phase-field crystal study. Phys. Rev. B 2012, 85, 245428. [Google Scholar] [CrossRef] [Green Version]
- Wang, K.; Zhang, F.; He, A.; Wang, P. Plasticity and phase transition of crystals under continuous deformations by phase field crystal approach. Int. J. Plast. 2019, 122, 225–243. [Google Scholar] [CrossRef]
- Emmerich, H.; Löwen, H.; Wittkowski, R.; Gruhn, T.; Tóth, G.I.; Tegze, G.; Gránásy, L. Phase-field-crystal models for condensed matter dynamics on atomic length and diffusive time scales: An overview. Adv. Phys. 2012, 61, 665–743. [Google Scholar] [CrossRef] [Green Version]
- Hirouchi, T.; Takaki, T.; Tomita, Y. Development of numerical scheme for phase field crystal deformation simulation. Comput. Mater. Sci. 2009, 44, 1192–1197. [Google Scholar] [CrossRef]
- Li, J.; Ni, B.; Zhang, T.; Gao, H. Phase field crystal modeling of grain boundary structures and growth in polycrystalline graphene. J. Mech. Phys. Solids 2018, 120, 36–48. [Google Scholar] [CrossRef]
- Gao, Y.; Huang, L.; Deng, Q.; Zhou, W.; Luo, Z.; Lin, K. Phase field crystal simulation of dislocation configuration evolution in dynamic recovery in two dimensions. Acta Mater. 2016, 117, 238–251. [Google Scholar] [CrossRef]
- Chan, V.W.L.; Pisutha-Arnond, N.; Thornton, K. Thermodynamic relationships for homogeneous crystalline and liquid phases in the phase-field crystal model. Comput. Mater. Sci. 2017, 135, 205–213. [Google Scholar] [CrossRef]
- Jreidini, P.; Kocher, G.; Provatas, N. Classical nucleation theory in the phase-field crystal model. Phys. Rev. E 2018, 97, 042802. [Google Scholar] [CrossRef] [PubMed] [Green Version]
- Zimmermann, G.; Hamacher, M.; Sturz, L. Effect of zero, normal and hyper-gravity on columnar dendritic solidification and the columnar-to-equiaxed transition in Neopentylglycol-(D)Camphor alloy. J. Cryst. Growth 2019, 512, 47–60. [Google Scholar] [CrossRef]
- Tegze, G.; Granasy, L.; Toth, G.I.; Podmaniczky, F.; Jaatinen, A.; Ala-Nissila, T.; Pusztai, T. Diffusion-controlled anisotropic growth of stable and metastable crystal polymorphs in the phase-field crystal model. Phys. Rev. Lett. 2009, 103, 035702. [Google Scholar] [CrossRef] [PubMed] [Green Version]

Publisher’s Note: MDPI stays neutral with regard to jurisdictional claims in published maps and institutional affiliations. |
© 2022 by the authors. Licensee MDPI, Basel, Switzerland. This article is an open access article distributed under the terms and conditions of the Creative Commons Attribution (CC BY) license (https://creativecommons.org/licenses/by/4.0/).