
Effect of Cavitation Intensity on the Cavitation Erosion Behavior of 316L Stainless Steel in 3.5 wt.% NaCl Solution


Abstract
:1. Introduction
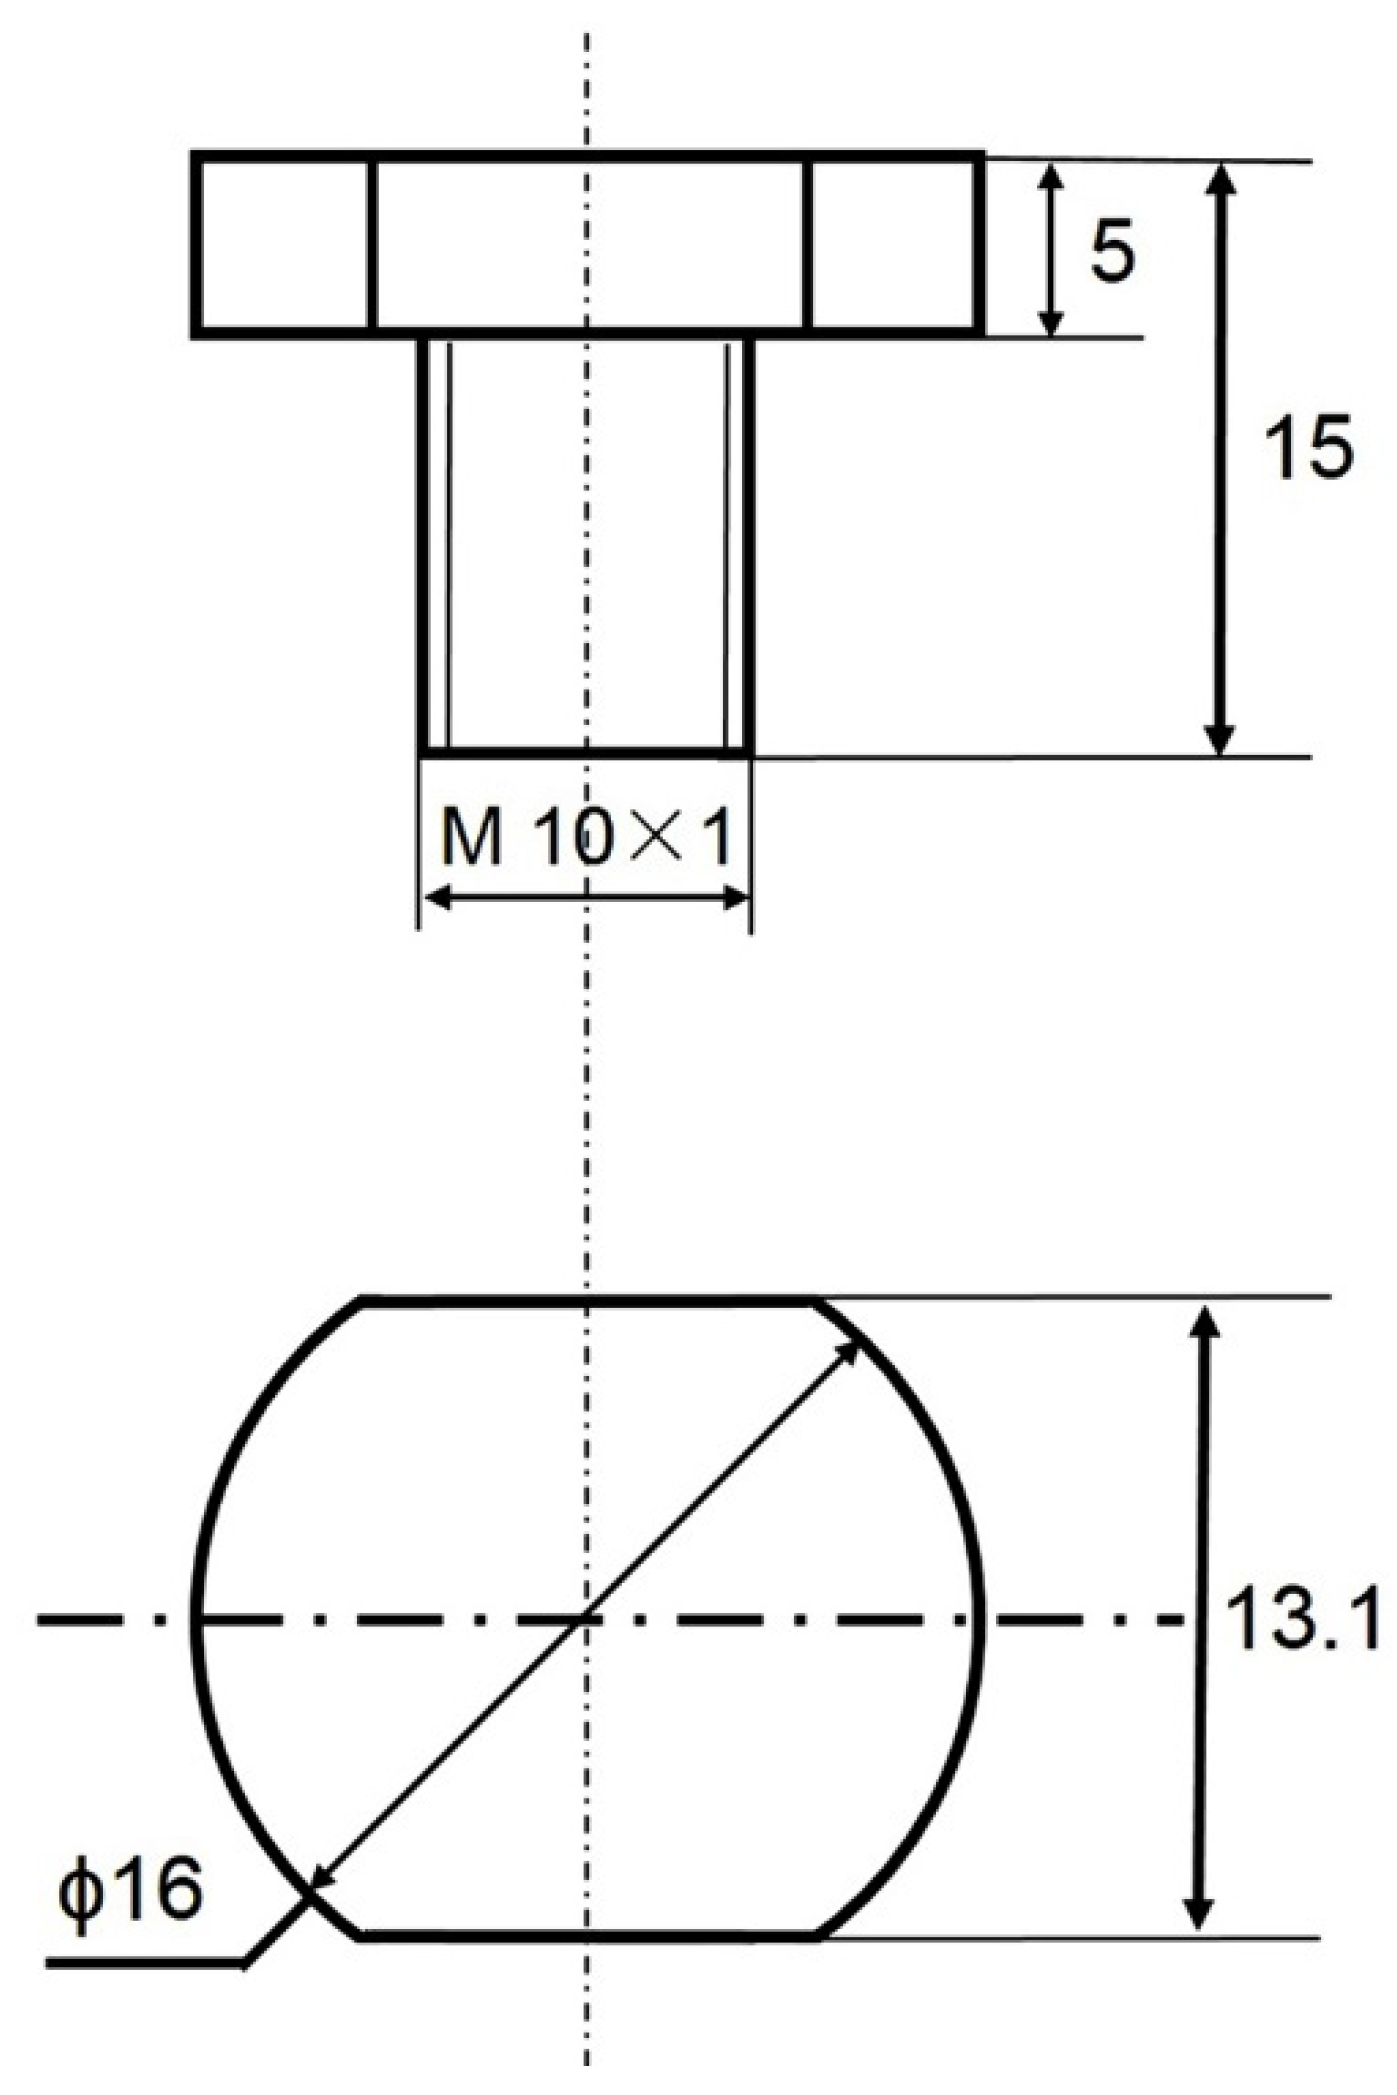
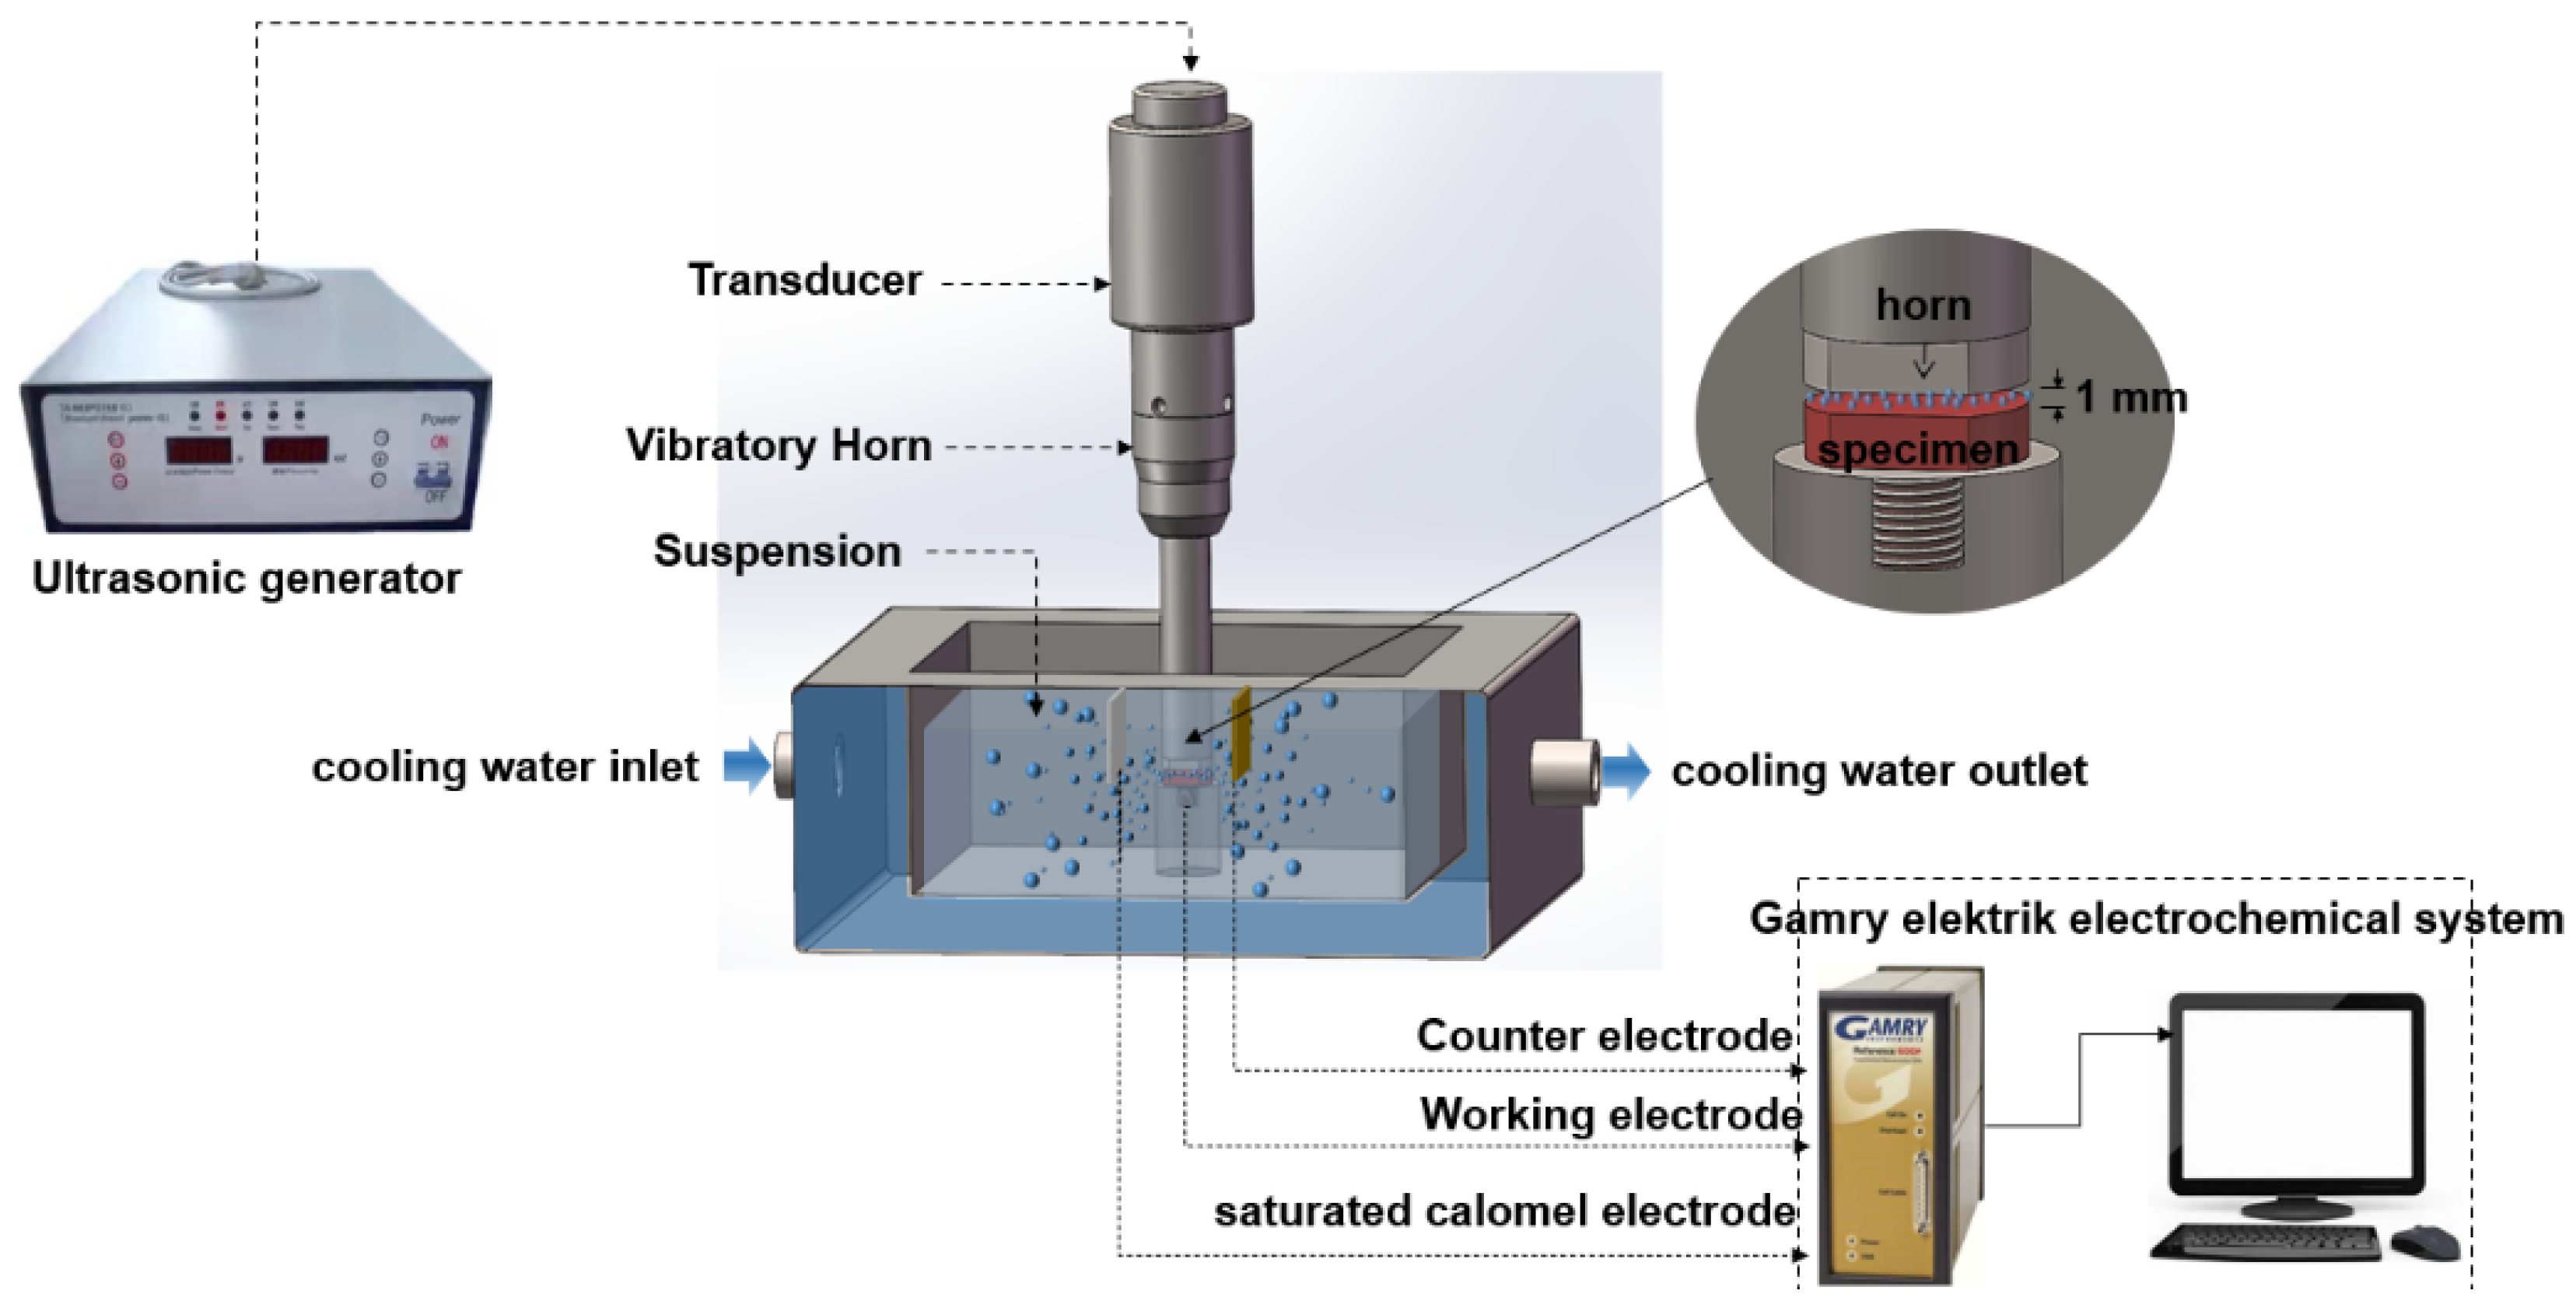
2. Experiment
3. Results and Discussion
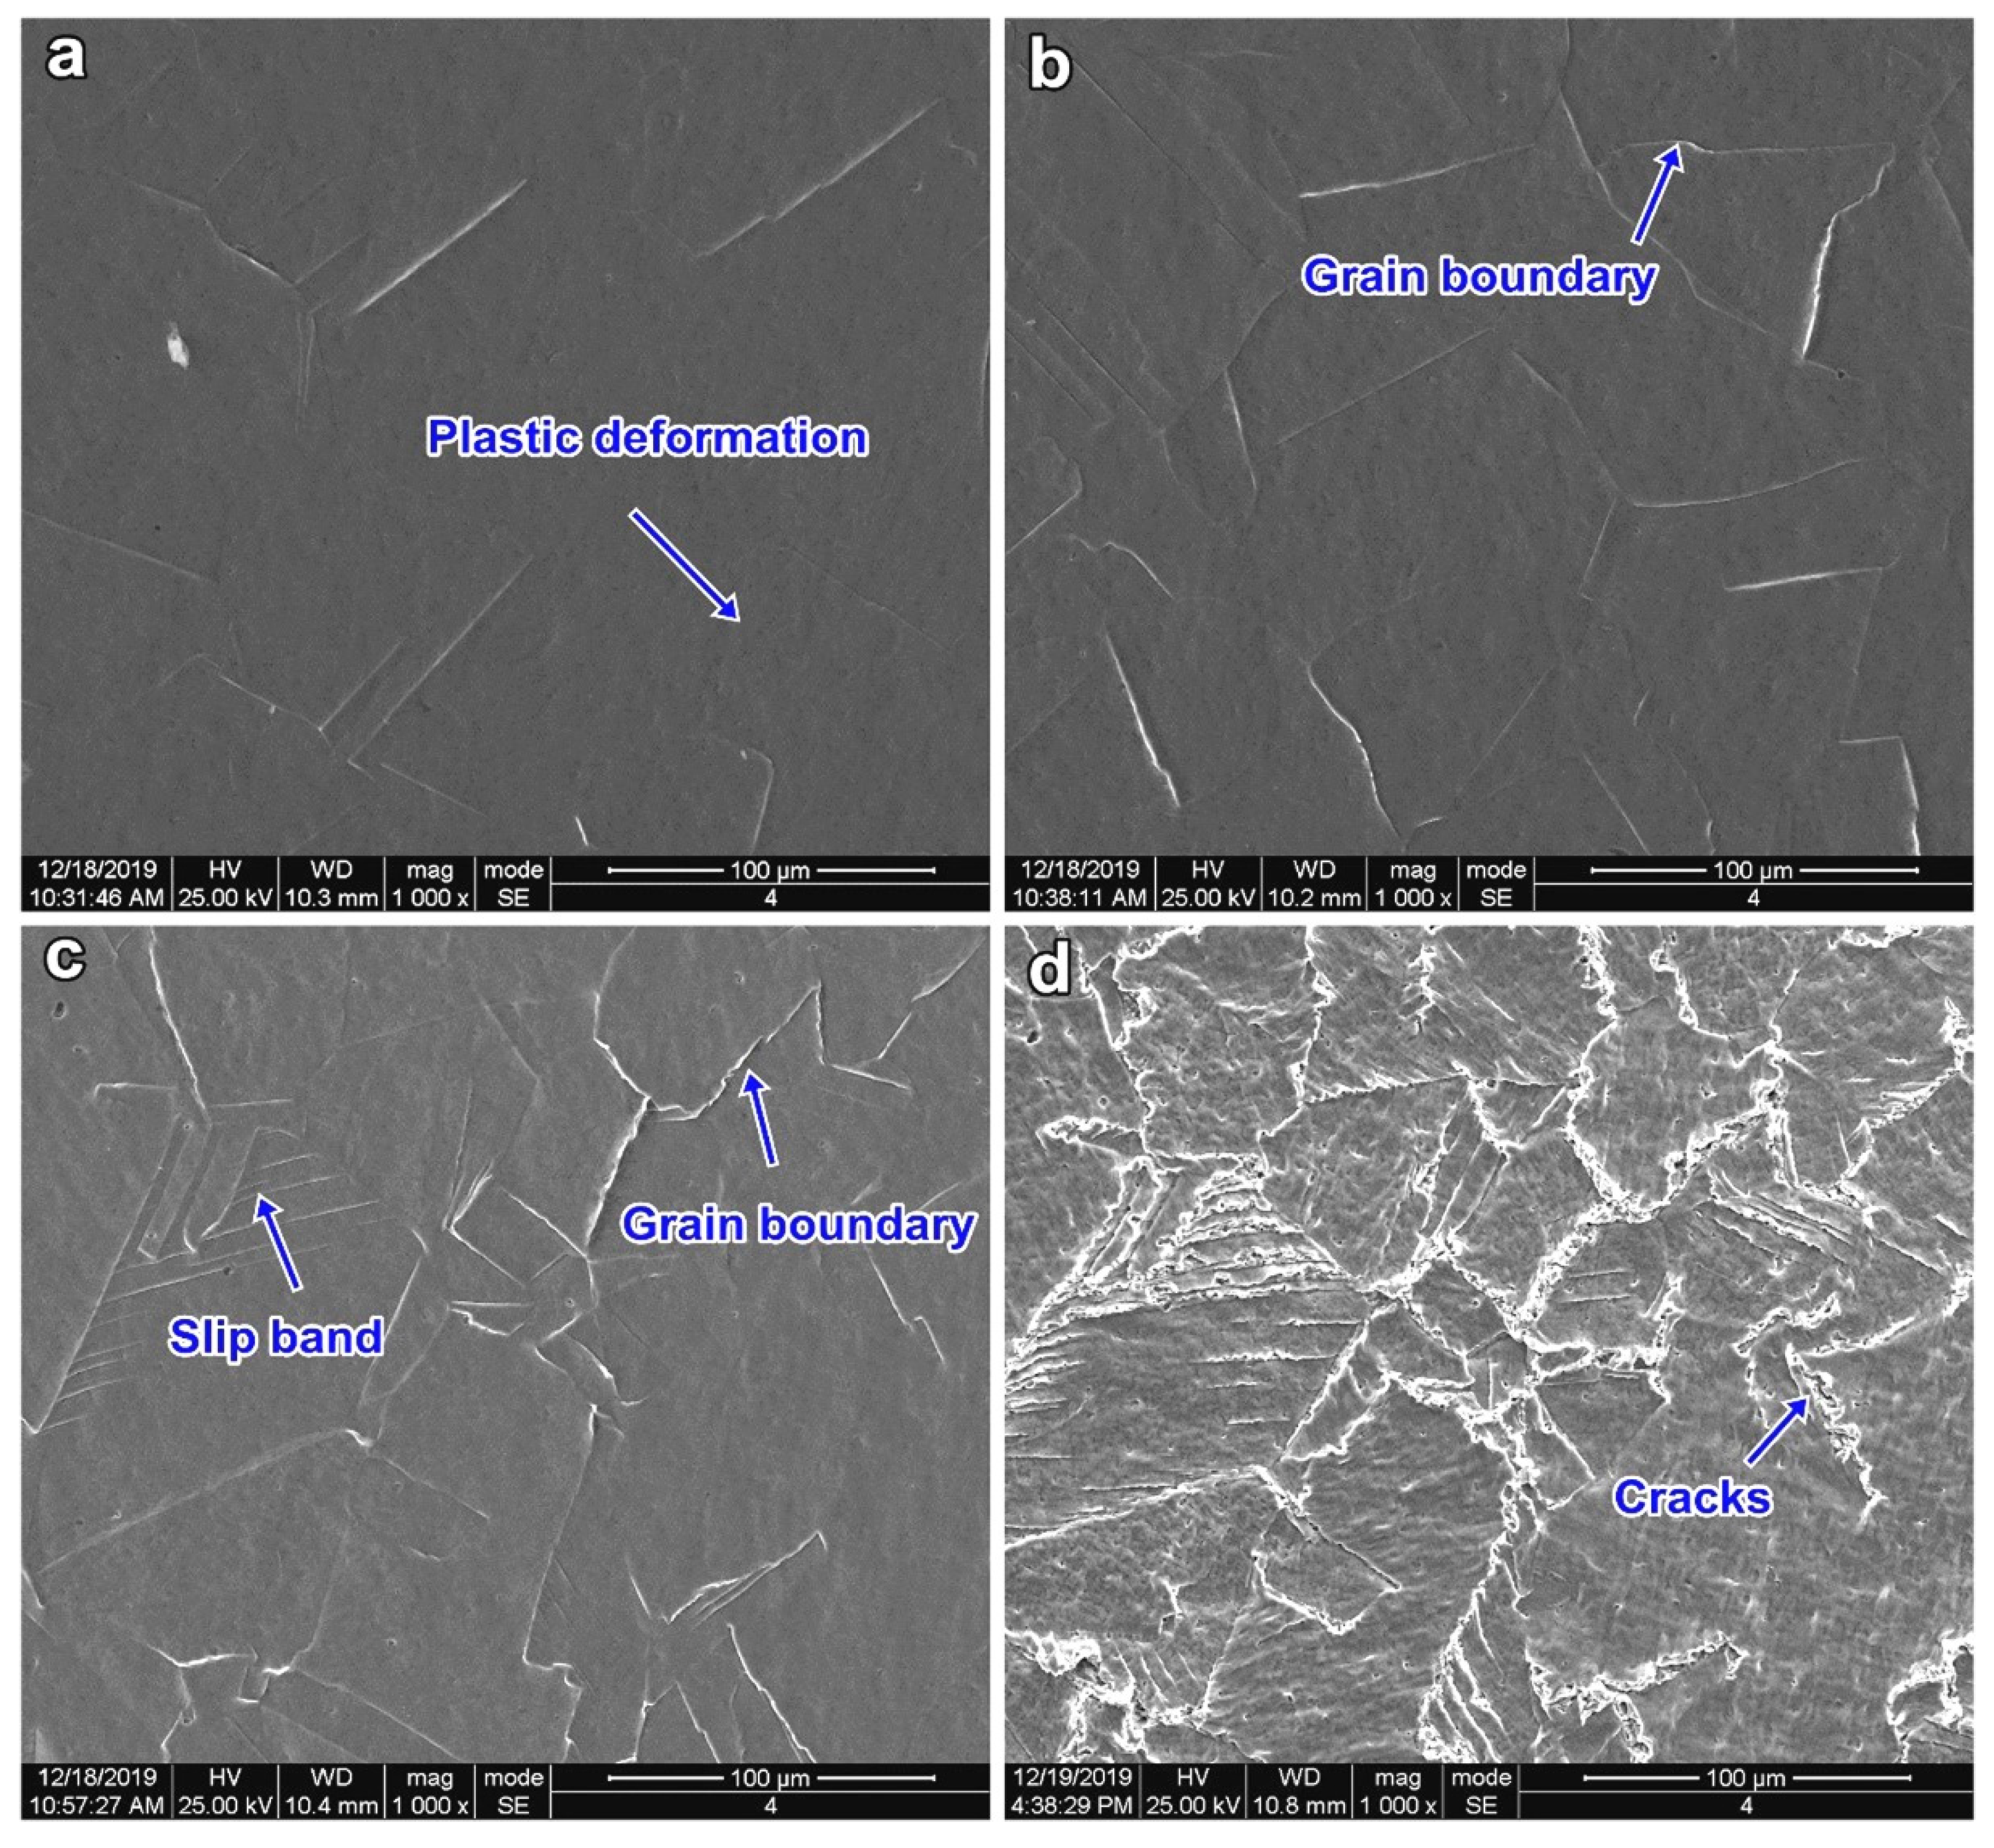
3.1. CE Damage Morphologies with Different Cavitation Intensities
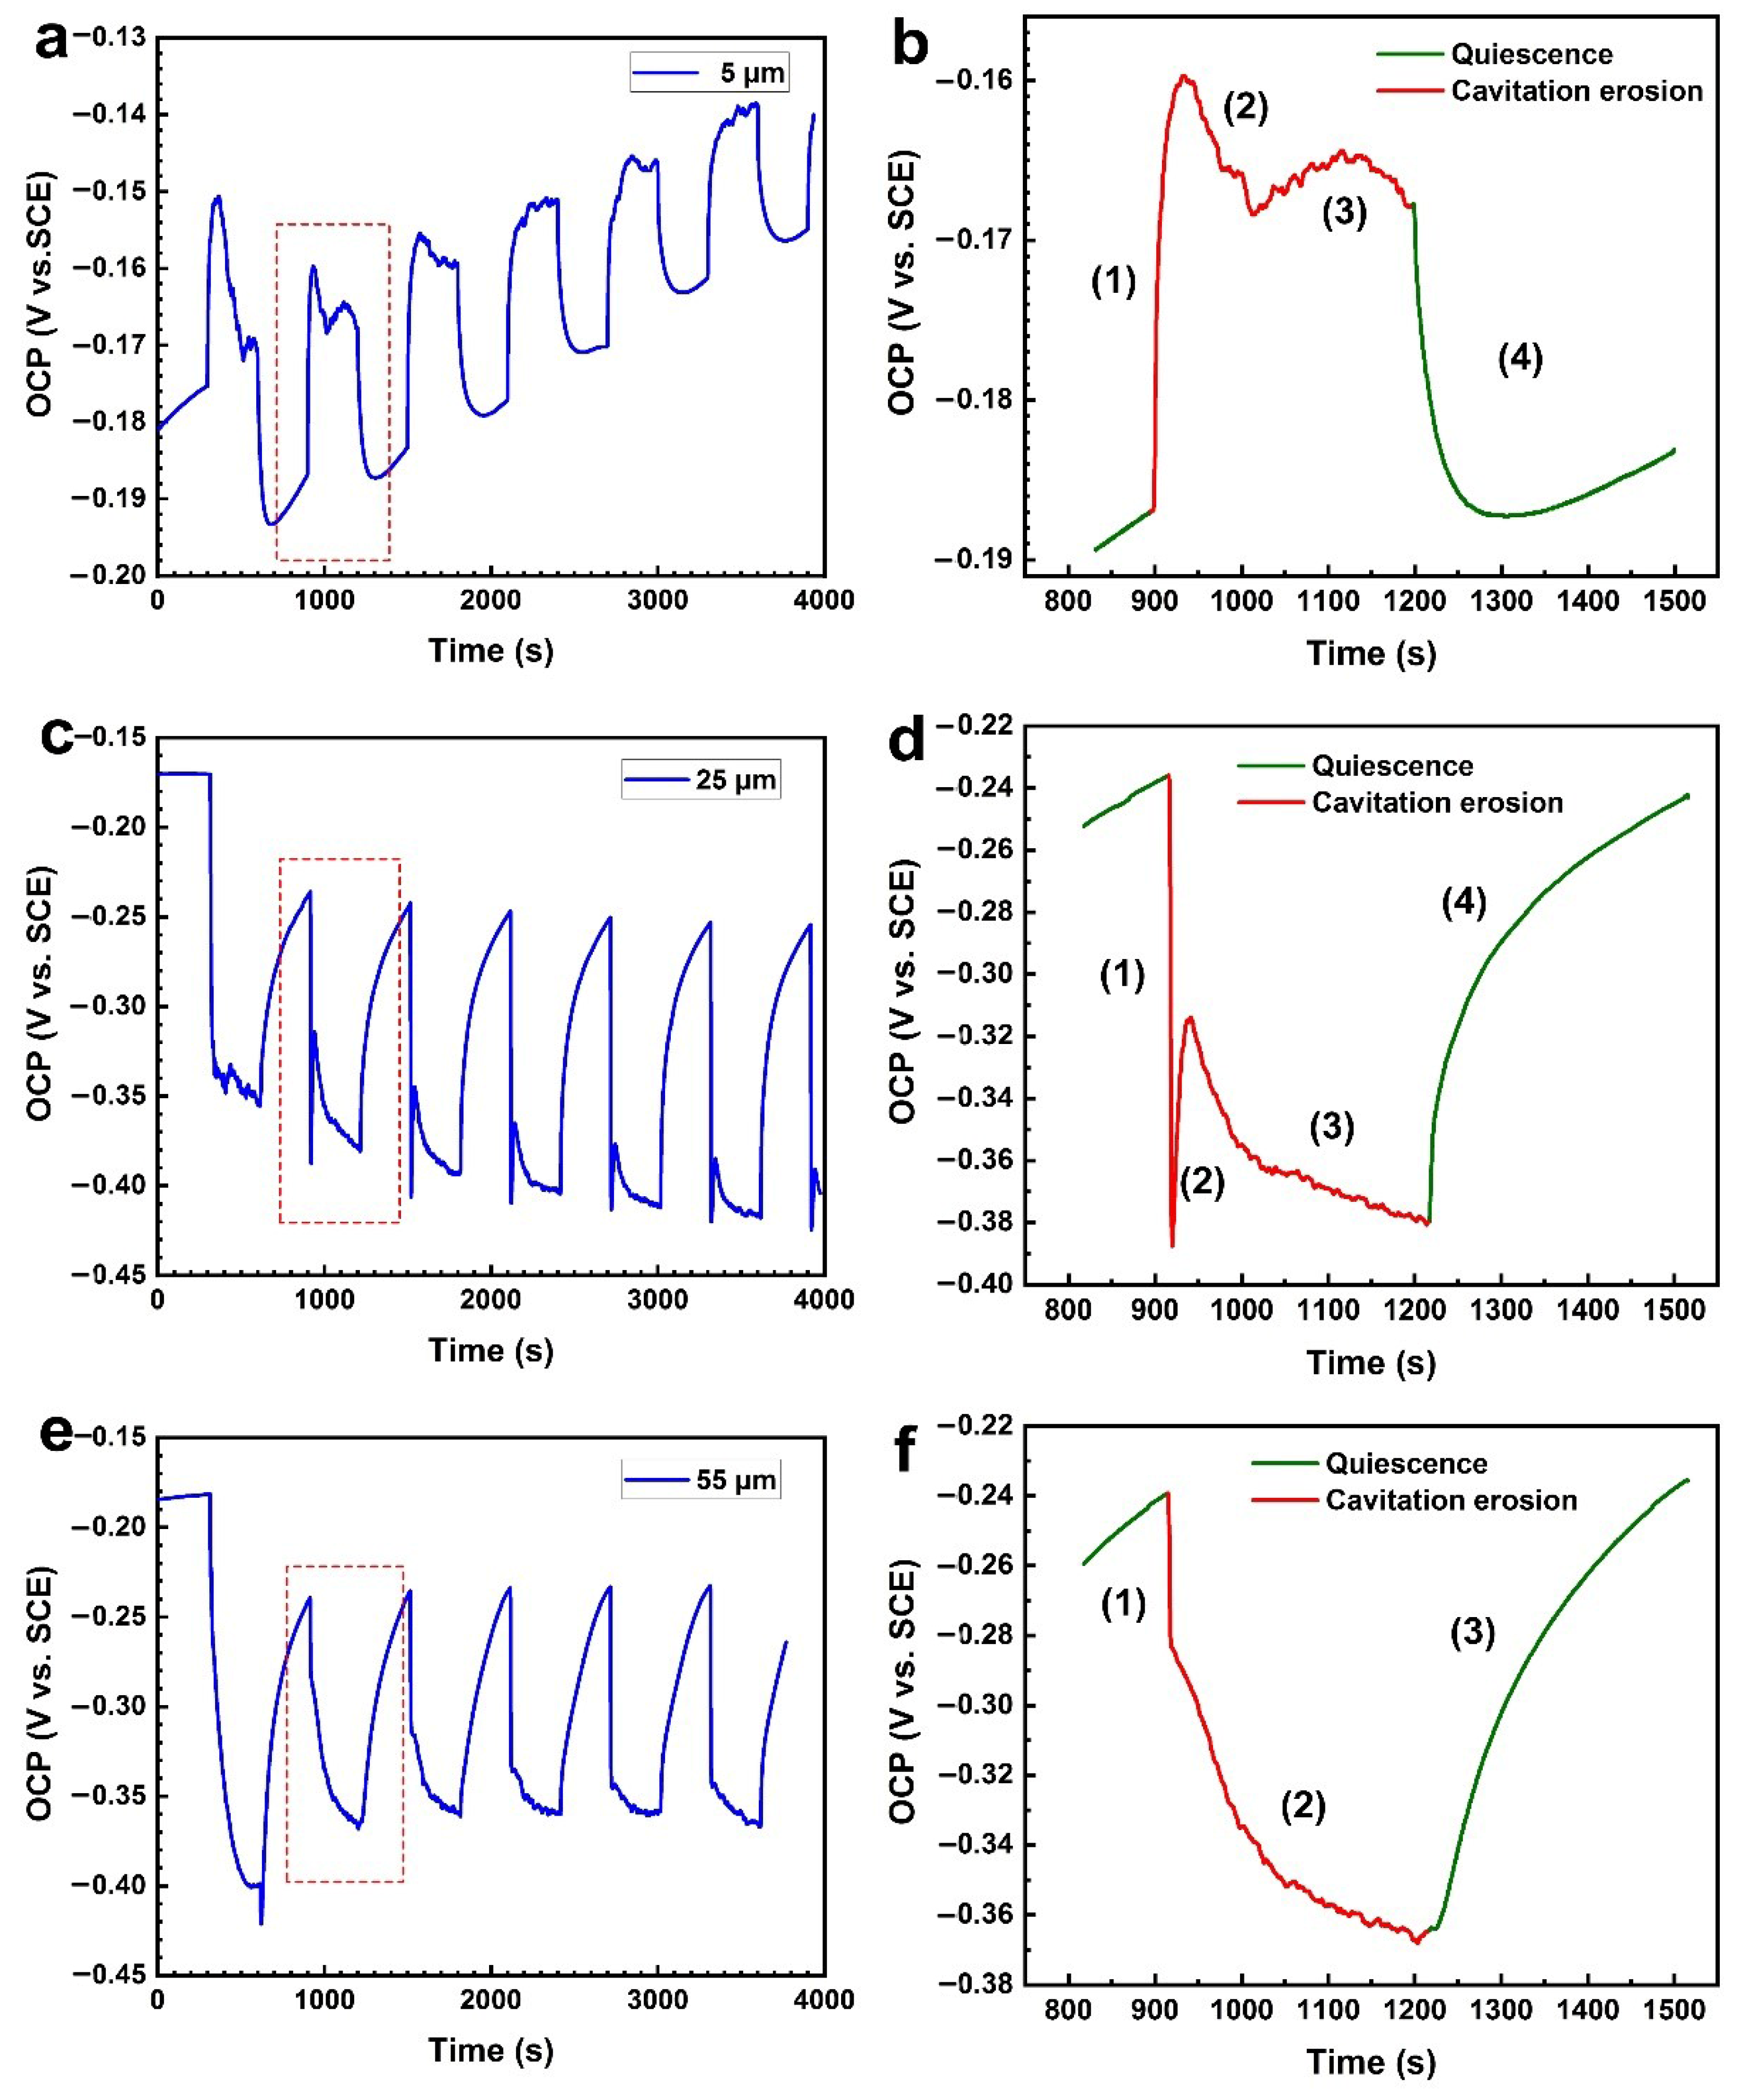
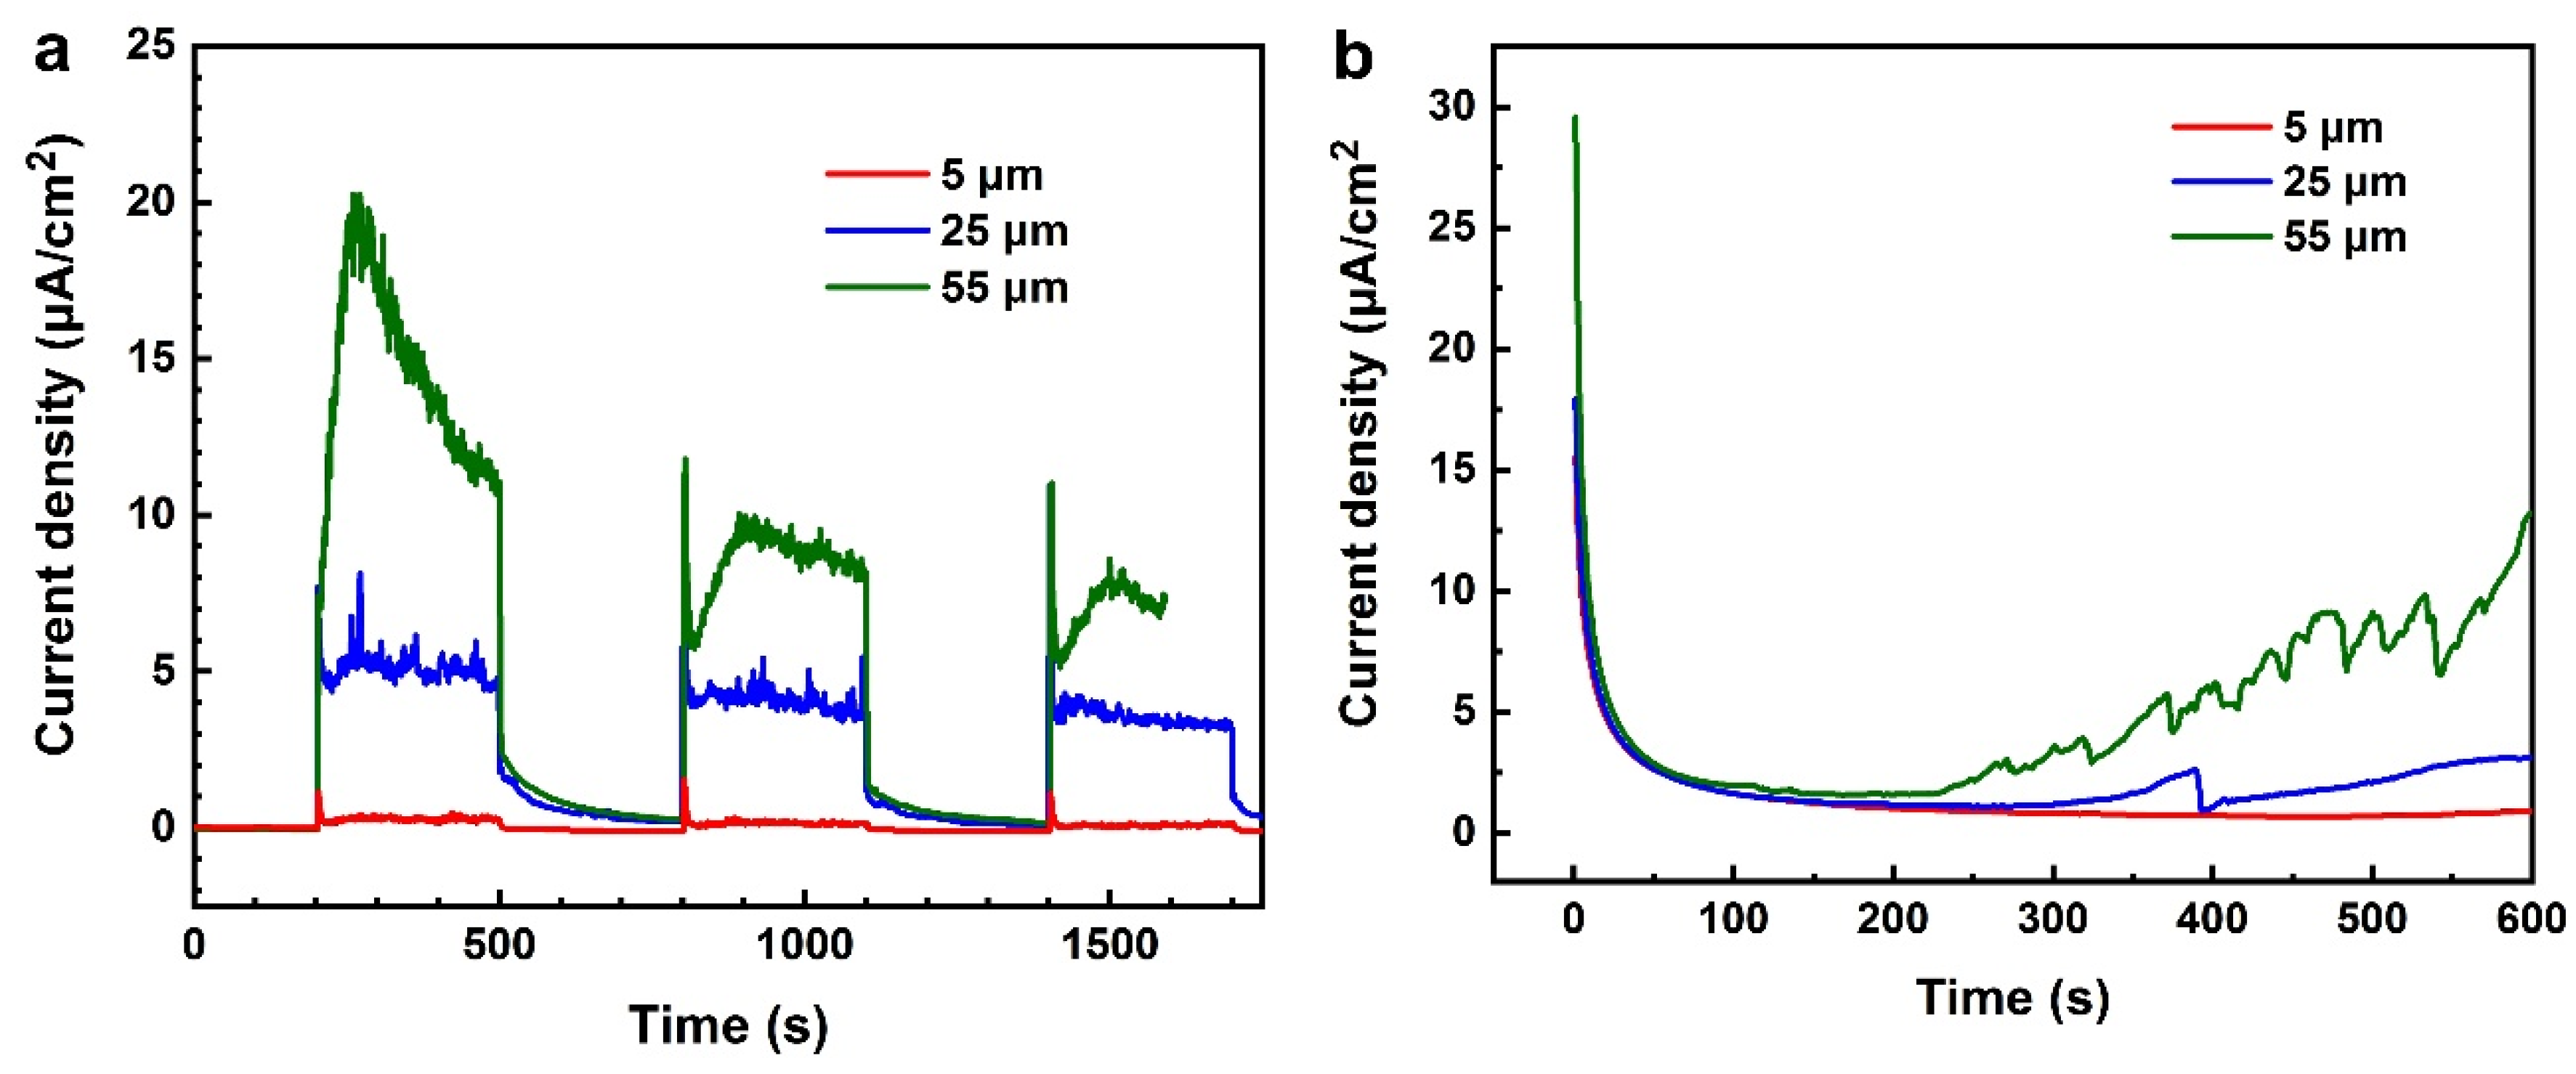
3.2. OCP Measurements under Alternating CE and CE States
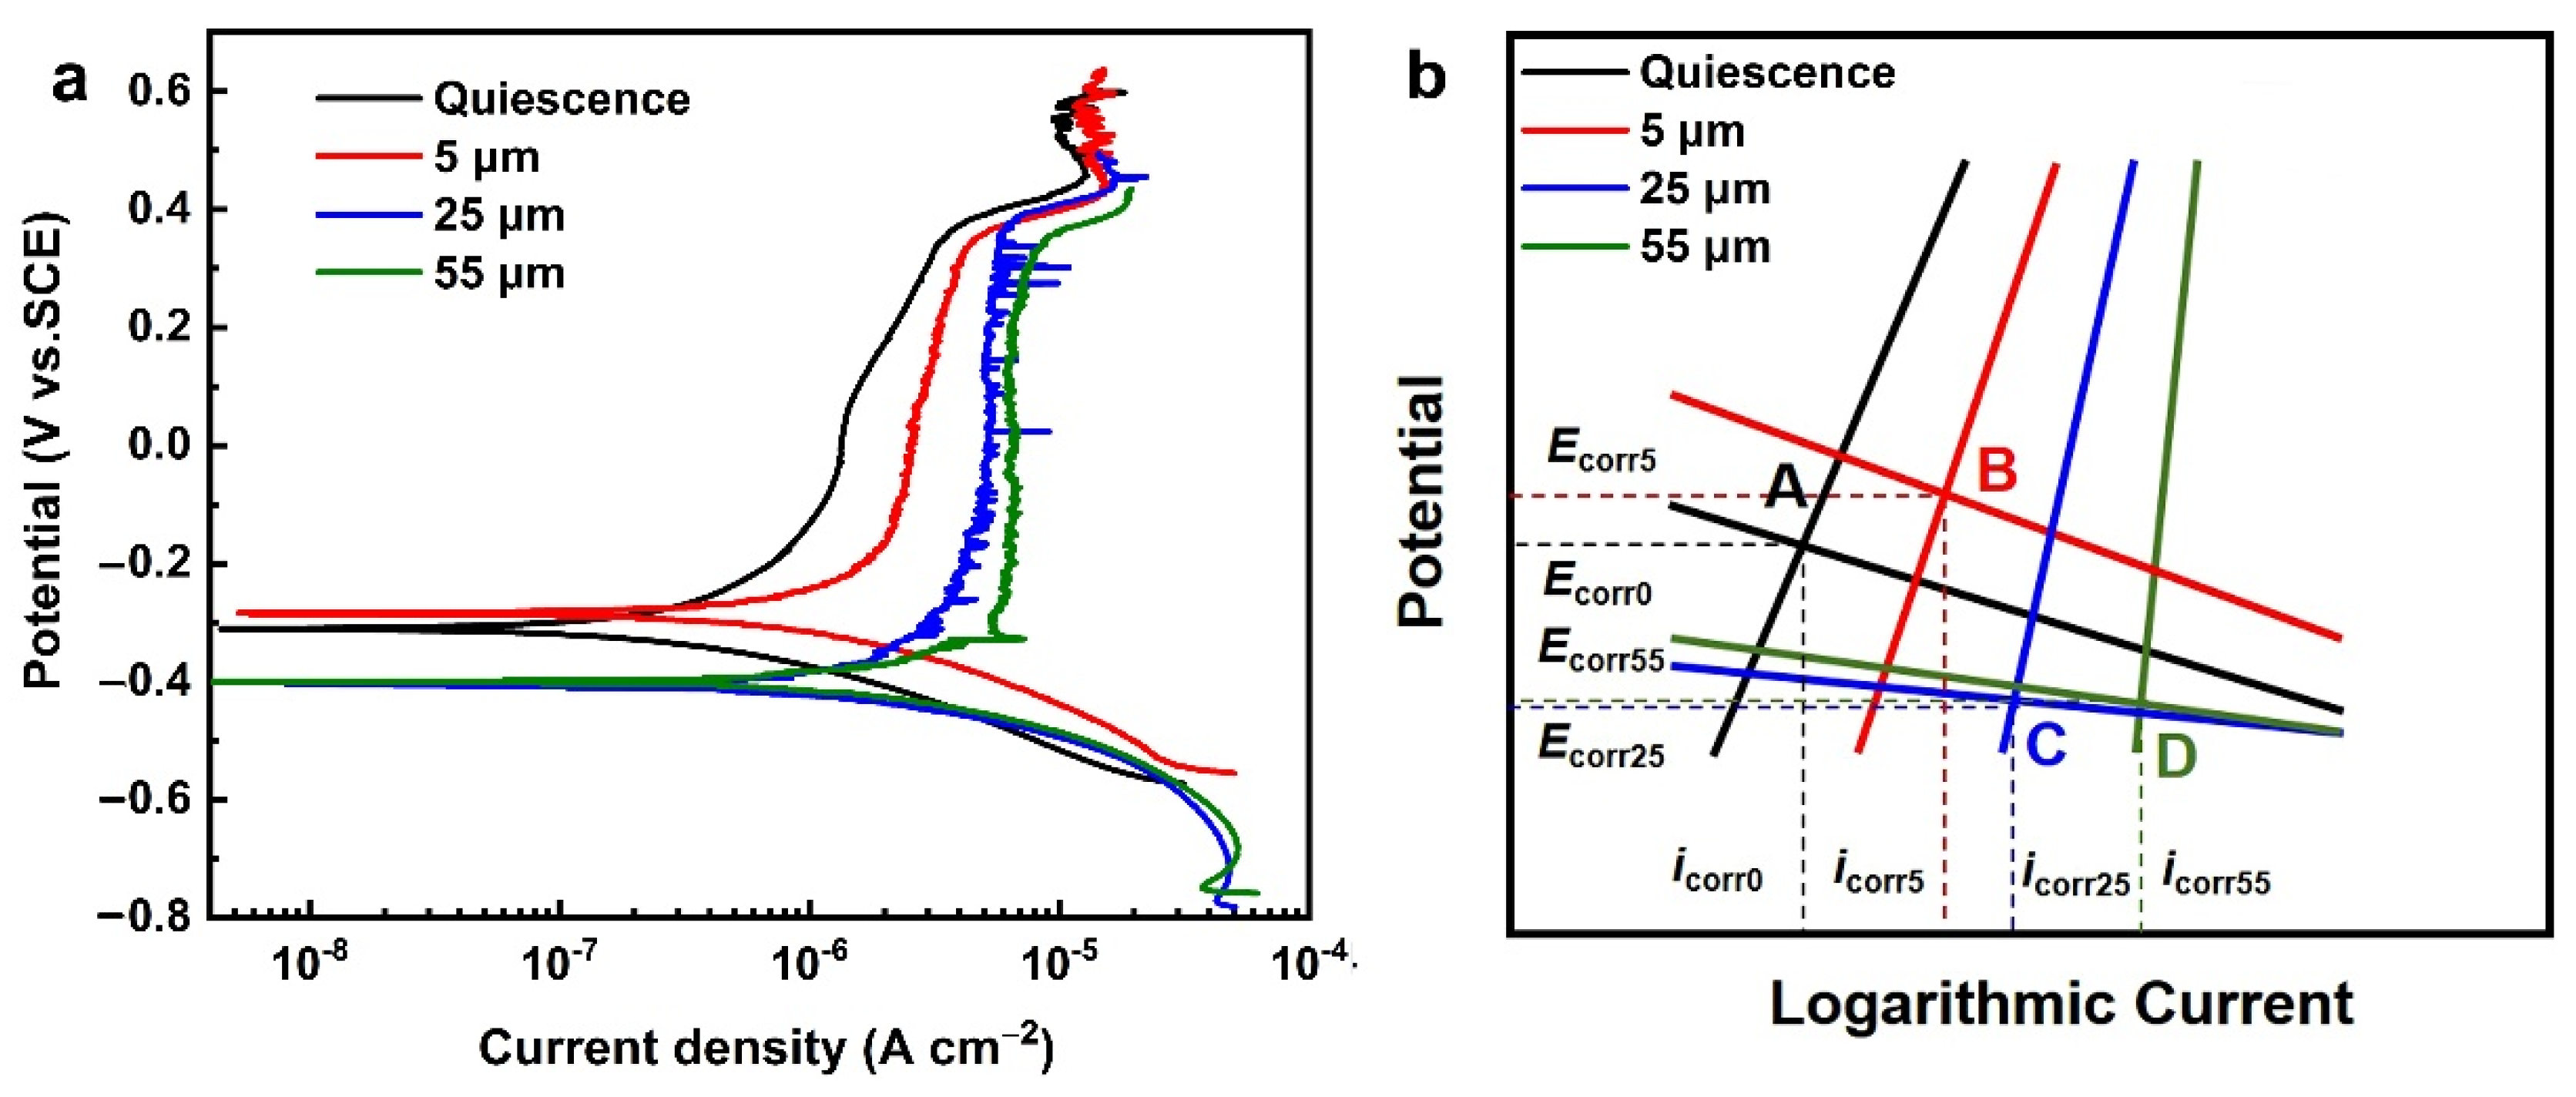
3.3. Potentiodynamic Polarization Tests under Different Cavitation Intensities
3.4. Potentiostatic Polarization Curves under Different Cavitation Intensities
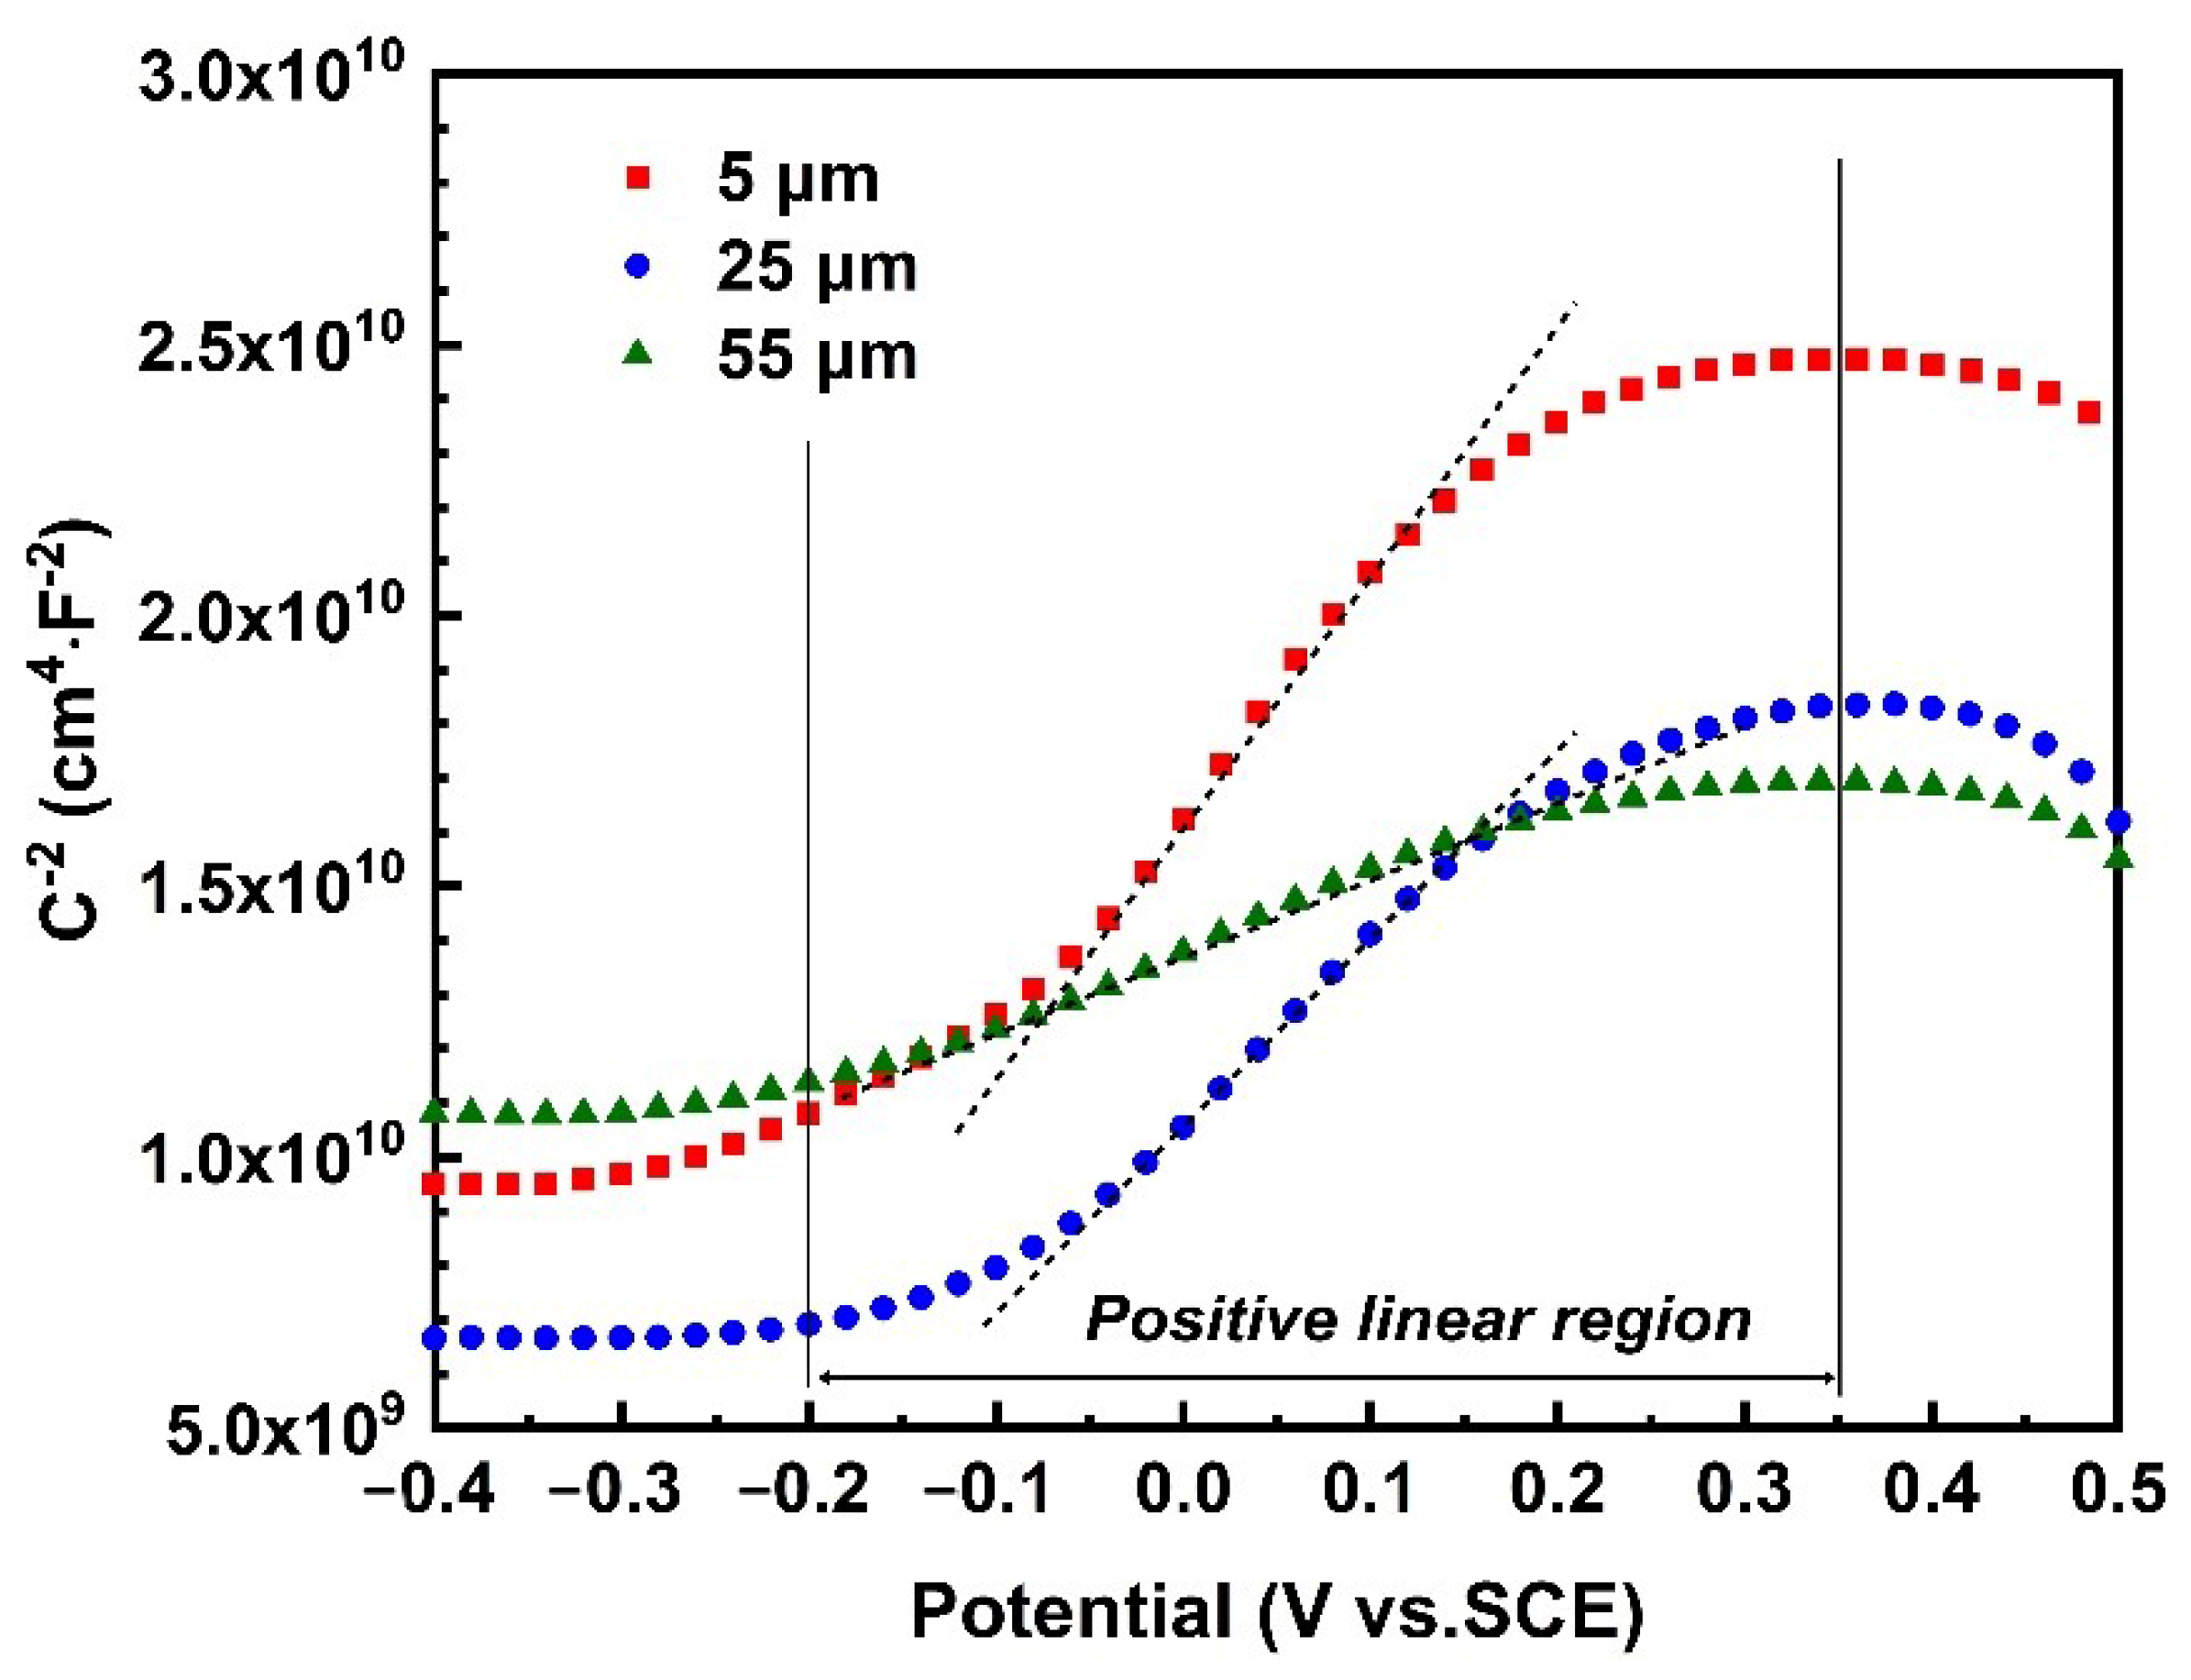
3.5. Passive Film Stability of 316L SS after CE with Different Amplitudes
4. Conclusions
Author Contributions
Funding
Data Availability Statement
Conflicts of Interest
References
- Hanke, S.; Fischer, A.; Beyer, M.; dos Santos, J. Cavitation erosion of NiAl-bronze layers generated by friction surfacing. Wear 2011, 273, 32–37. [Google Scholar] [CrossRef]
- Lavigne, S.; Pougoum, F.; Savoie, S.; Martinu, L.; Klemberg-Sapieha, J.E.; Schulz, R. Cavitation erosion behavior of HVOF CaviTec coatings. Wear 2017, 386–387, 90–98. [Google Scholar] [CrossRef]
- Zhang, H.; Chen, X.; Gong, Y.; Tian, Y.; McDonald, A.; Li, H. In-situ SEM observations of ultrasonic cavitation erosion behavior of HVOF-sprayed coatings. Ultrason. Sonochem. 2019, 60, 104760. [Google Scholar] [CrossRef] [PubMed]
- Nair, R.B.; Arora, H.S.; Grewal, H.S. Microwave synthesized complex concentrated alloy coatings: Plausible solution to cavitation induced erosion-corrosion. Ultrason. Sonochem. 2019, 50, 114–125. [Google Scholar] [CrossRef] [PubMed]
- Qiao, L.; Wu, Y.; Hong, S.; Zhang, J.; Shi, W.; Zheng, Y. Relationships between spray parameters, microstructures and ultrasonic cavitation erosion behavior of HVOF sprayed Fe-based amorphous/nanocrystalline coatings. Ultrason. Sonochem. 2017, 39, 39–46. [Google Scholar] [CrossRef] [PubMed]
- Zheng, W.; Wu, Y.; Hong, S.; Cheng, J.; Qiao, L.; Cheng, J.; Zhu, S. Electrochemical properties and cavitation erosion behaviors of HVOF sprayed (AlCoCrFeNi)1-X(WC-10Co)X composite coatings in NaCl medium. Ceram. Int. 2021, 47, 29410–29422. [Google Scholar] [CrossRef]
- Amann, T.; Waidele, M.; Kailer, A. Analysis of mechanical and chemical mechanisms on cavitation erosion-corrosion of steels in salt water using electrochemical methods. Tribol. Int. 2018, 124, 238–246. [Google Scholar] [CrossRef]
- Yong, X.; Li, D.; Shen, H. Electrochemical reponses to degradation of the surface layer nano-mechanical properties of stainless steels under cavitation. Mater. Chem. Phys. 2013, 139, 290–297. [Google Scholar] [CrossRef]
- Keswani, M.; Raghavan, S.; Deymier, P. A novel way of detecting transient cavitation near a solid surface during megasonic cleaning using electrochemical impedance spectroscopy. Microelectron. Eng. 2013, 108, 11–15. [Google Scholar] [CrossRef]
- Ren, X.D.; He, H.; Tong, Y.Q.; Ren, Y.P.; Yuan, S.Q.; Liu, R.; Zuo, C.Y.; Wu, K.; Sui, S.; Wang, D.S. Experimental investigation on dynamic characteristics and strengthening mechanism of laser-induced cavitation bubbles. Ultrason. Sonochem. 2016, 32, 218–223. [Google Scholar] [CrossRef]
- Ma, X.; Huang, B.; Zhao, X.; Wang, Y.; Chang, Q.; Qiu, S.; Fu, X.; Wang, G. Comparisons of spark-charge bubble dynamics near the elastic and rigid boundaries. Ultrason. Sonochem. 2018, 43, 80–90. [Google Scholar] [CrossRef]
- Li, D.G.; Wang, J.D.; Chen, D.R.; Liang, P. Influence of passive potential on the electronic property of the passive film formed on Ti in 0.1 M HCl solution during ultrasonic caitation. Ultrason. Sonochem. 2016, 29, 48–54. [Google Scholar] [CrossRef]
- Peng, S.; Xu, J.; Jiang, S.; Xie, Z.-H.; Munroe, P. Unlocking the cavitation erosion-corrosion resistance of a TiCN nanocrystalline coating with an equiaxed grain structure. Corros. Sci. 2022, 195, 109978. [Google Scholar] [CrossRef]
- Wang, Y.; Hao, E.; Zhao, X.; Xue, Y.; An, Y.; Zhou, H. Effect of microstructure evolution of Ti6Al4V alloy on its cavitation erosion and corrosion resistance in artificial seawater. J. Mater. Sci. Technol. 2022, 100, 169–181. [Google Scholar] [CrossRef]
- García-García, D.M.; García-Antón, J.; Igual-Muñoz, A. Influence of cavitation on the passive behavior of duplex stainless steels in aqueous LiBr solutions. Corros. Sci. 2008, 50, 2560–2571. [Google Scholar] [CrossRef]
- Li, C.; Zhu, R.; Zhang, X.; Huang, P.; Wang, X.; Wang, X. Impact of surface ultrasonic rolling on cavitation erosion behavior of 304 stainless steel. Surf. Coat. Technol. 2020, 383, 125280. [Google Scholar] [CrossRef]
- Fernández-Domene, R.M.; Blasco-Tamarit, E.; García-García, D.M.; García-Antón, J. Cavitation corrosion and repassivation kinetics of titanium in a heavy brine LiBr solution evaluated by using electrochemical techniques and Confocal Laser Scanning Microscopy. Electrochim. Acta 2011, 58, 264–275. [Google Scholar] [CrossRef]
- Fernández-Domene, R.M.; Blasco-Tamarit, E.; García-García, D.M.; García-Antón, J. Repassivation of the damage generated by cavitation on UNS N08031 in a LiBr solution by means of electrochemical techniques and confocal laser scanning microscopy. Corros. Sci. 2010, 52, 3453–3464. [Google Scholar] [CrossRef]
- Kwok, C.T.; Cheng, F.T.; Man, H.C.; Ding, W.H. Corrosion characteristics of nanostructures layer on 316L stainless steel fabricated by cavitation-annealing. Mater. Lett. 2006, 60, 2419–2422. [Google Scholar] [CrossRef]
- Li, D.G.; Wang, J.D.; Chen, D.R.; Liang, P. The role of passive potential in ultrasonic cavitation erosion of titanium in 1 M HCl solution. Ultrason. Sonochem. 2016, 29, 279–287. [Google Scholar] [CrossRef]
- Zhao, G.; Cao, L.; Che, B.; Wu, R.; Yang, S.; Wu, D. Towards the control of blade cavitation in a waterjet pump with inlet guide vanes: Passive control by obstacles. Ocean Eng. 2021, 231, 108820. [Google Scholar] [CrossRef]
- Paolantonio, M.; Hanke, S. Damage mechaniasms in cavitation erosion of nitrogen-containing austenitic steels in 3.5% NaCl solution. Wear 2021, 464–465, 203526. [Google Scholar] [CrossRef]
- Zheng, Y.; Luo, S.; Ke, W. Effect of passivity on electrochemical corrosion behavior of alloys during cavitation in aqueous solutions. Wear 2007, 262, 1308–1314. [Google Scholar] [CrossRef]
- Niederhofer, P.; Huth, S. Cavitation erosion resistance of high interstitial CrMnCN austenitic stainless steels. Wear 2013, 301, 457–466. [Google Scholar] [CrossRef]
- Wang, K.Y.; Lo, K.H.; Kwok, C.T.; Wong, M.M.; Iong, I.W.; Ai, W. The influences of martensitic transformations on cavitation-erosion damage initiation and pitting resistance of a lean austenitic stainless steel. Mater. Res. 2016, 19, 1366–1371. [Google Scholar] [CrossRef] [Green Version]
- Zhang, R.; Shen, H.; Zhang, Y.; Li, D.; Li, Y.; Yong, X. Surface layer nano-mechanical responses to interaction between cavitation and electrochemical corrosion. Acta Metall. Sin. 2013, 49, 614–620. [Google Scholar] [CrossRef]
- Luo, S.Z.; Zheng, Y.G.; Li, M.C.; Yao, Z.M.; Ke, W. Effect of cavitation on corrosion behavior of 20SiMn low-alloy steel in 3% sodium chloride solution. Corrosion 2003, 59, 597–605. [Google Scholar] [CrossRef]
- Kwok, C.T.; Cheng, F.; Man, H. Synergistic effect of cavitation erosion and corrosion of various engineering alloys in 3.5% NaCl solution. Mater. Sci. Eng. A 2000, 290, 145–154. [Google Scholar] [CrossRef]
- Kim, S.-J.; Lee, S.-J.; Chong, S.-O. Electrochemical characteristics under cavitation-erosion for STS 316L in seawater. Mater. Res. Bull. 2014, 58, 244–247. [Google Scholar] [CrossRef]
- Bahrami, A.; Mousavi Anijdan, S.H.; Golozar, M.A.; Shamanian, M.; Varahram, N. Effects of conventional heat treatment on wear resistance of AISI H13 tool steel. Wear 2005, 258, 846–851. [Google Scholar] [CrossRef]
- Nair, R.B.; Arora, H.S.; Mukherjee, S.; Singh, S.; Singh, H.; Grewal, H.S. Exceptionally high cavitation erosion and corrosion resistance of a high entropy alloy. Ultrason. Sonochem. 2018, 41, 252–260. [Google Scholar] [CrossRef]
- G32-10 A.; Standard Test Method for Cavitation Erosion Using Vibratory Apparatus. ASTM Int.: West Conshohocken, PA, USA, 2010.
- Li, Z.X.; Zhang, L.M.; Ma, A.L.; Hu, J.X.; Zhang, S.; Daniel, E.F.; Zheng, Y.G. Comparative study on the cavitation erosion behavior of two different rolling surfaces on 304 stainless steel. Tribol. Int. 2021, 159, 106994. [Google Scholar] [CrossRef]
- Zheng, Z.-B.; Long, J.; Guo, Y.; Li, H.; Zheng, K.-H.; Qiao, Y.-X. Corrosion and impact–abrasion–corrosion behaviors of quenching–tempering martensitic Fe–Cr alloy steels. J. Iron Steel Res. Int. 2022. [Google Scholar] [CrossRef]
- Song, Q.N.; Tong, Y.; Li, H.L.; Zhang, H.N.; Xu, N.; Zhang, G.Y.; Bao, Y.F.; Liu, W.; Liu, Z.G.; Qiao, Y.X. Corrosion and cavitation erosion resistance enhancement of cast Ni–Al bronze by laser surface melting. J. Iron Steel Res. Int. 2021. [Google Scholar] [CrossRef]
- Chen, Z.X.; Hu, H.X.; Zheng, Y.G.; Guo, X.M. Effect of groove microstructure on slurry erosion in the liquid-solid two-phase flow. Wear 2021, 466, 203561. [Google Scholar] [CrossRef]
- Qiao, Y.; Wang, X.; Yang, L.; Wang, X.; Chen, J.; Wang, Z.; Zhou, H.; Zou, J.; Wang, F. Effect of aging treatment on microstructure and corrosion behavior of a Fe–18Cr–15Mn–0.66N stainless steel. J. Mater. Sci. Technol. 2022, 107, 197–206. [Google Scholar] [CrossRef]
- Li, Z.X.; Zhang, L.M.; Udoh, I.I.; Ma, A.L.; Zheng, Y.G. Deformation-induced martensite in 304 stainless steel during cavitation erosion: Effect on passive film stability and the interaction between cavitation erosion and corrosion. Tribol. Int. 2022, 167, 107422. [Google Scholar] [CrossRef]
- Zhang, L.M.; Li, Z.X.; Hu, J.X.; Ma, A.L.; Zhang, S.; Daniel, E.F.; Umoh, A.J.; Hu, H.X.; Zheng, Y.G. Understanding the roles of deformation-induced martensite of 304 stainless steel in different stages of cavitation erosion. Tribol. Int. 2021, 155, 106752. [Google Scholar] [CrossRef]
- Wang, Z.B.; Zheng, Y.G. Critical flow velocity phenomenon in erosion-corrosion of pipelines: Determination methods, mechanisms and applications. J. Pipeline Sci. Eng. 2021, 1, 63–73. [Google Scholar] [CrossRef]
- Bakhshandeh, H.R.; Allahkaram, S.R.; Zabihi, A.H. An investigation on cavtation-corrosion behavior of Ni/β-SiC nanocomposite coatings under ultrasonic field. Ultrason. Sonochem. 2019, 56, 229–239. [Google Scholar] [CrossRef]
- Xu, J.; Peng, S.; Li, Z.; Jiang, S.; Xie, Z.-H.; Munroe, P. The influence of semiconducting properties of passive film on the cavitation erosion resistance of a NbN nanoceramic coating. Ultrason. Sonochem. 2021, 71, 105406. [Google Scholar] [CrossRef] [PubMed]
- Zhang, L.M.; Zhang, S.D.; Ma, A.L.; Umoh, A.J.; Hu, H.X.; Zheng, Y.G.; Yang, B.J.; Wang, J.Q. Influence of cerium content on the corrosion behavior of Al-Co-Ce amorphous alloys in 0.6 M NaCl solution. J. Mater. Sci. Technol. 2019, 35, 1378–1387. [Google Scholar] [CrossRef]
- Wang, B.-C.; Zhu, J.-H. Influence of ultrasonic cavitation on passive film of stainless steel. Ultrason. Sonochem. 2008, 15, 239–243. [Google Scholar] [CrossRef] [PubMed]

| Elements | C | Si | Mn | P | S | Ni | Cr | Mo | Ti | Fe |
|---|---|---|---|---|---|---|---|---|---|---|
| wt.% | 0.02 | 0.68 | 1.37 | 0.01 | 0.001 | 12.2 | 17.5 | 2.61 | 0.68 | Bal. |
| Amplitude | Ecorr (mVSCE) | icorr (μA/cm2) |
|---|---|---|
| 0 | −310.7 | 0.406 |
| 5 μm | −283.6 | 1.062 |
| 25 μm | −405.0 | 2.959 |
| 55 μm | −399.8 | 4.045 |
| Amplitude | Kslope (×1010) | ND (×1021 cm−3) | R2 |
|---|---|---|---|
| 5 μm | 1.651 | 0.55 | 0.99 |
| 25 μm | 0.679 | 1.33 | 0.99 |
| 55 μm | 0.324 | 2.80 | 0.99 |
Publisher’s Note: MDPI stays neutral with regard to jurisdictional claims in published maps and institutional affiliations. |
© 2022 by the authors. Licensee MDPI, Basel, Switzerland. This article is an open access article distributed under the terms and conditions of the Creative Commons Attribution (CC BY) license (https://creativecommons.org/licenses/by/4.0/).
Share and Cite
Hu, J.; Zhang, L.; Ma, A.; Mao, P.; Zheng, Y. Effect of Cavitation Intensity on the Cavitation Erosion Behavior of 316L Stainless Steel in 3.5 wt.% NaCl Solution. Metals 2022, 12, 198. https://doi.org/10.3390/met12020198
Hu J, Zhang L, Ma A, Mao P, Zheng Y. Effect of Cavitation Intensity on the Cavitation Erosion Behavior of 316L Stainless Steel in 3.5 wt.% NaCl Solution. Metals. 2022; 12(2):198. https://doi.org/10.3390/met12020198
Chicago/Turabian StyleHu, Jiaxiu, Lianmin Zhang, Aili Ma, Pingli Mao, and Yugui Zheng. 2022. "Effect of Cavitation Intensity on the Cavitation Erosion Behavior of 316L Stainless Steel in 3.5 wt.% NaCl Solution" Metals 12, no. 2: 198. https://doi.org/10.3390/met12020198
APA StyleHu, J., Zhang, L., Ma, A., Mao, P., & Zheng, Y. (2022). Effect of Cavitation Intensity on the Cavitation Erosion Behavior of 316L Stainless Steel in 3.5 wt.% NaCl Solution. Metals, 12(2), 198. https://doi.org/10.3390/met12020198