
Modeling Isothermal Reduction of Iron Ore Pellet Using Finite Element Analysis Method: Experiments & Validation

 , ,
, ,
Abstract
:1. Introduction
2. Materials and Methods
3. Experimental Results
3.1. Influence of Temperature, Pellet Size & Reactant Gas on Reduction Kinetics
3.2. SEM-EDAX and Phase Composition Analysis of Partially Reduced Pellets
3.3. SEM-Greyscale Porosity Analysis of Partially Reduced Pellets
3.4. Changes in Diameter of Reduced Pellets
3.5. Fe3C Phase Detection for Pellets Reduced Using CO-H2 Gas Mixture
4. Numerical Modelling
4.1. Model Description and Assumptions
- Transport of Diluted Species: To calculate the concentration fields of solid reactants and products as well as the gases in the bulk.
- Transport of Diluted Species in Porous Media: To calculate concentration fields of gases and to define the chemical reactions involved.
- Laminar Flow: To obtain the velocity profile of flow of gases in the bulk.
- Brinkman Equations: To obtain the velocity profile of gases inside the porous pellet.
- Multiphysics-Reacting flow: To couple the chemical reactions with the flow profile of the gases inside the porous pellet.
- The pellet is assumed to be a sphere with reduction process taking place isothermally without any changes in pellet diameter and effects of heat of reaction are ignored because of the small scale of the single pellet reduction and external heat source.
- Reactant and product gases follow ideal gas laws, and they diffuse as a single stream.
- Hematite to wüstite conversion is assumed to be a single step reaction and all chemical reactions are assumed to follow first order reaction kinetics [29].
- Density and kinematic viscosity of gas mixture was assumed to be constant and calculated using the data available online on NIST Chemistry Webbook [30].
- The diffusion coefficients of gas mixture was assumed to remain constant with changes in gas concentrations and calculated using the theory of diffusion in gases at low density [31]. N2 (carrier gas) did not undergo any chemical reactions, but it affected the diffusion coefficients of gas mixture.
4.2. Geometry, Domain and Mesh
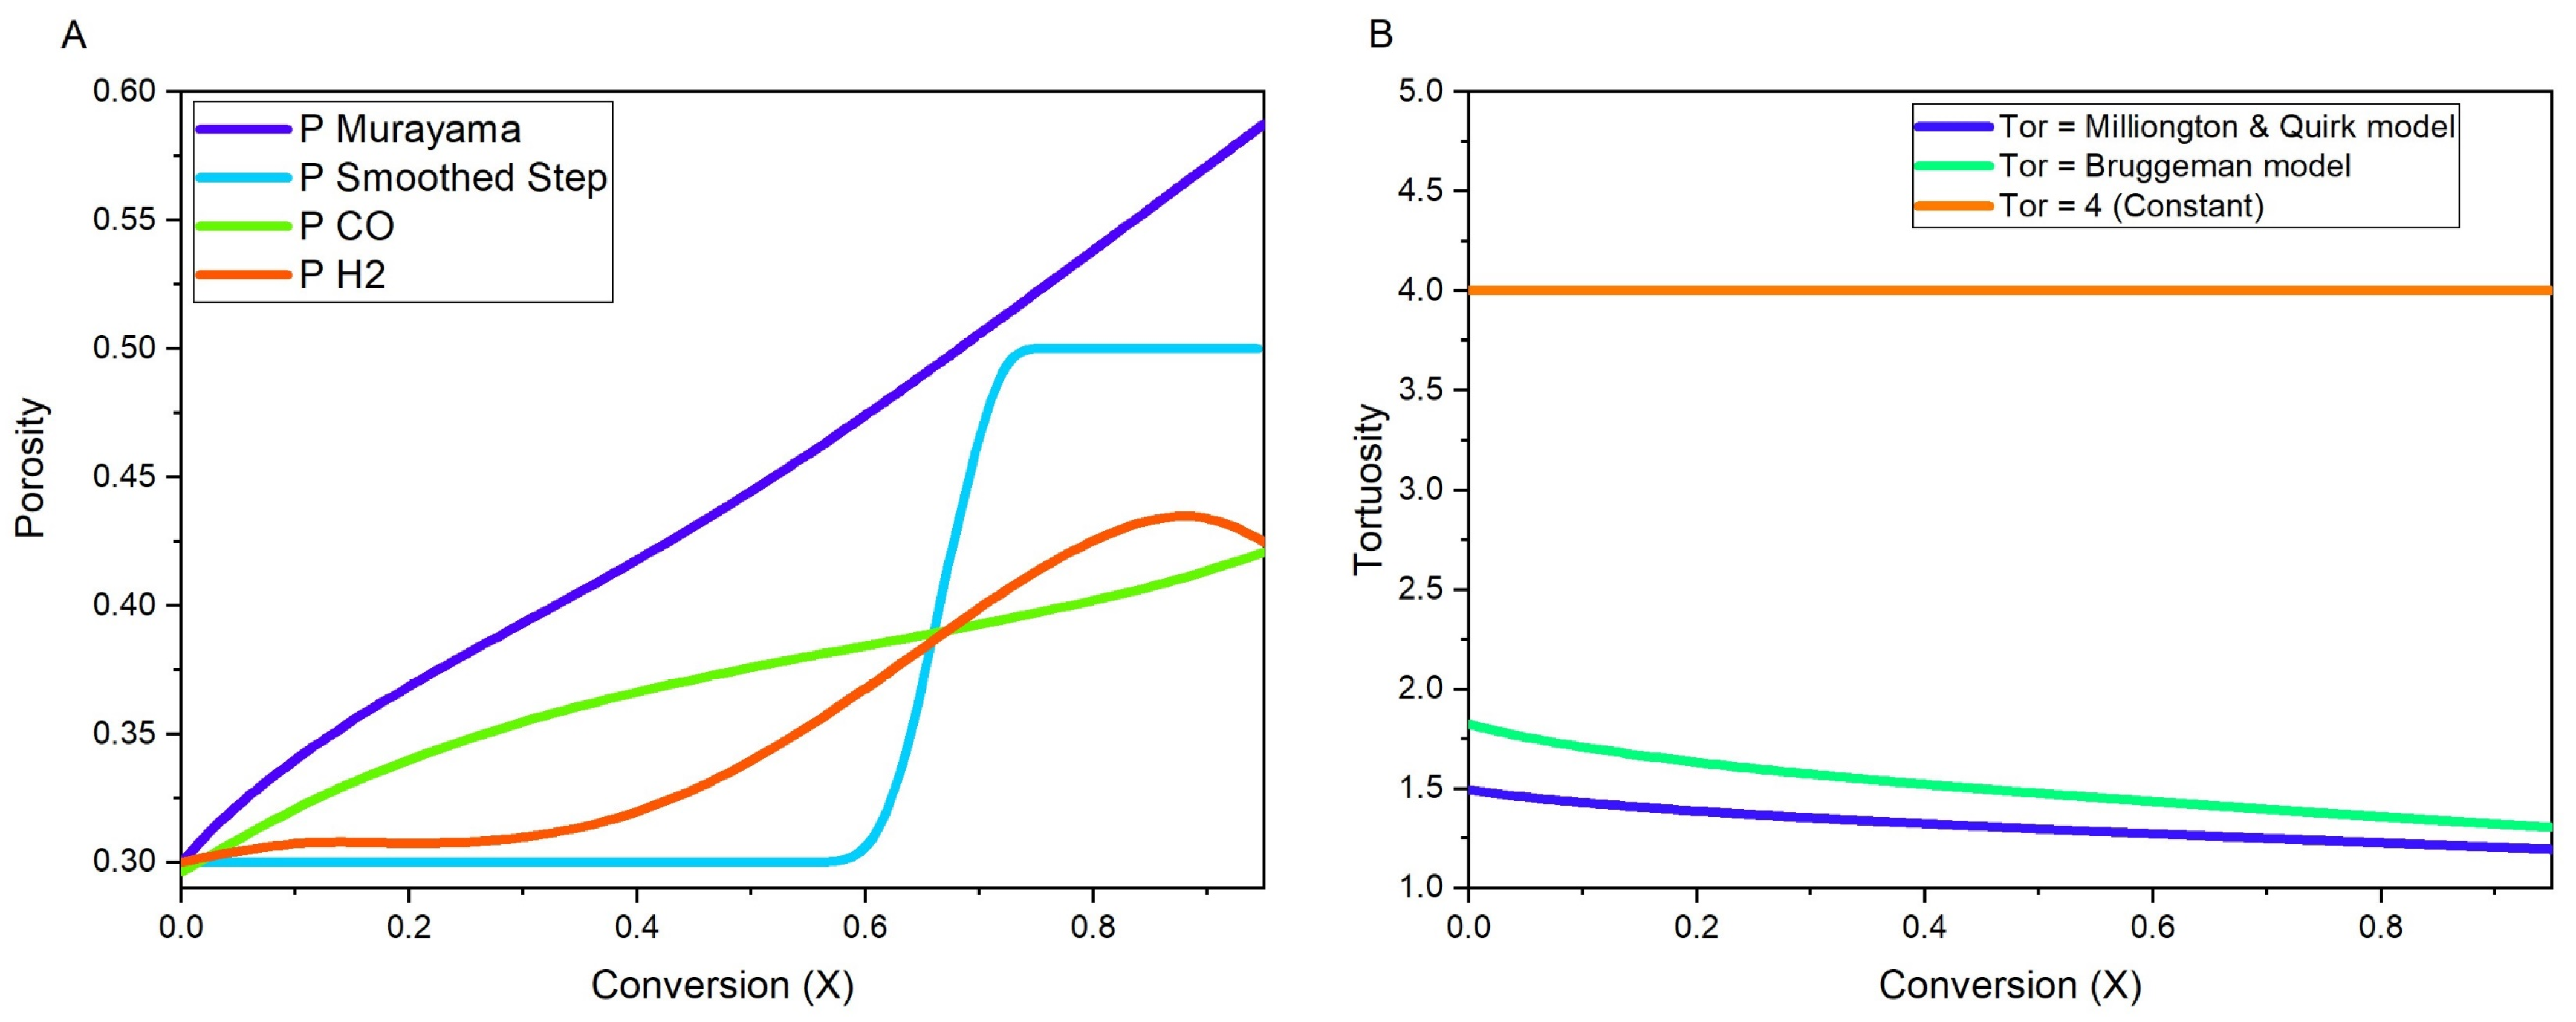
4.3. Diffusion and Transport of Gases
4.4. Reaction Kinetics
4.5. Boundary Conditions and Solvers
5. Modelling Results and Validation
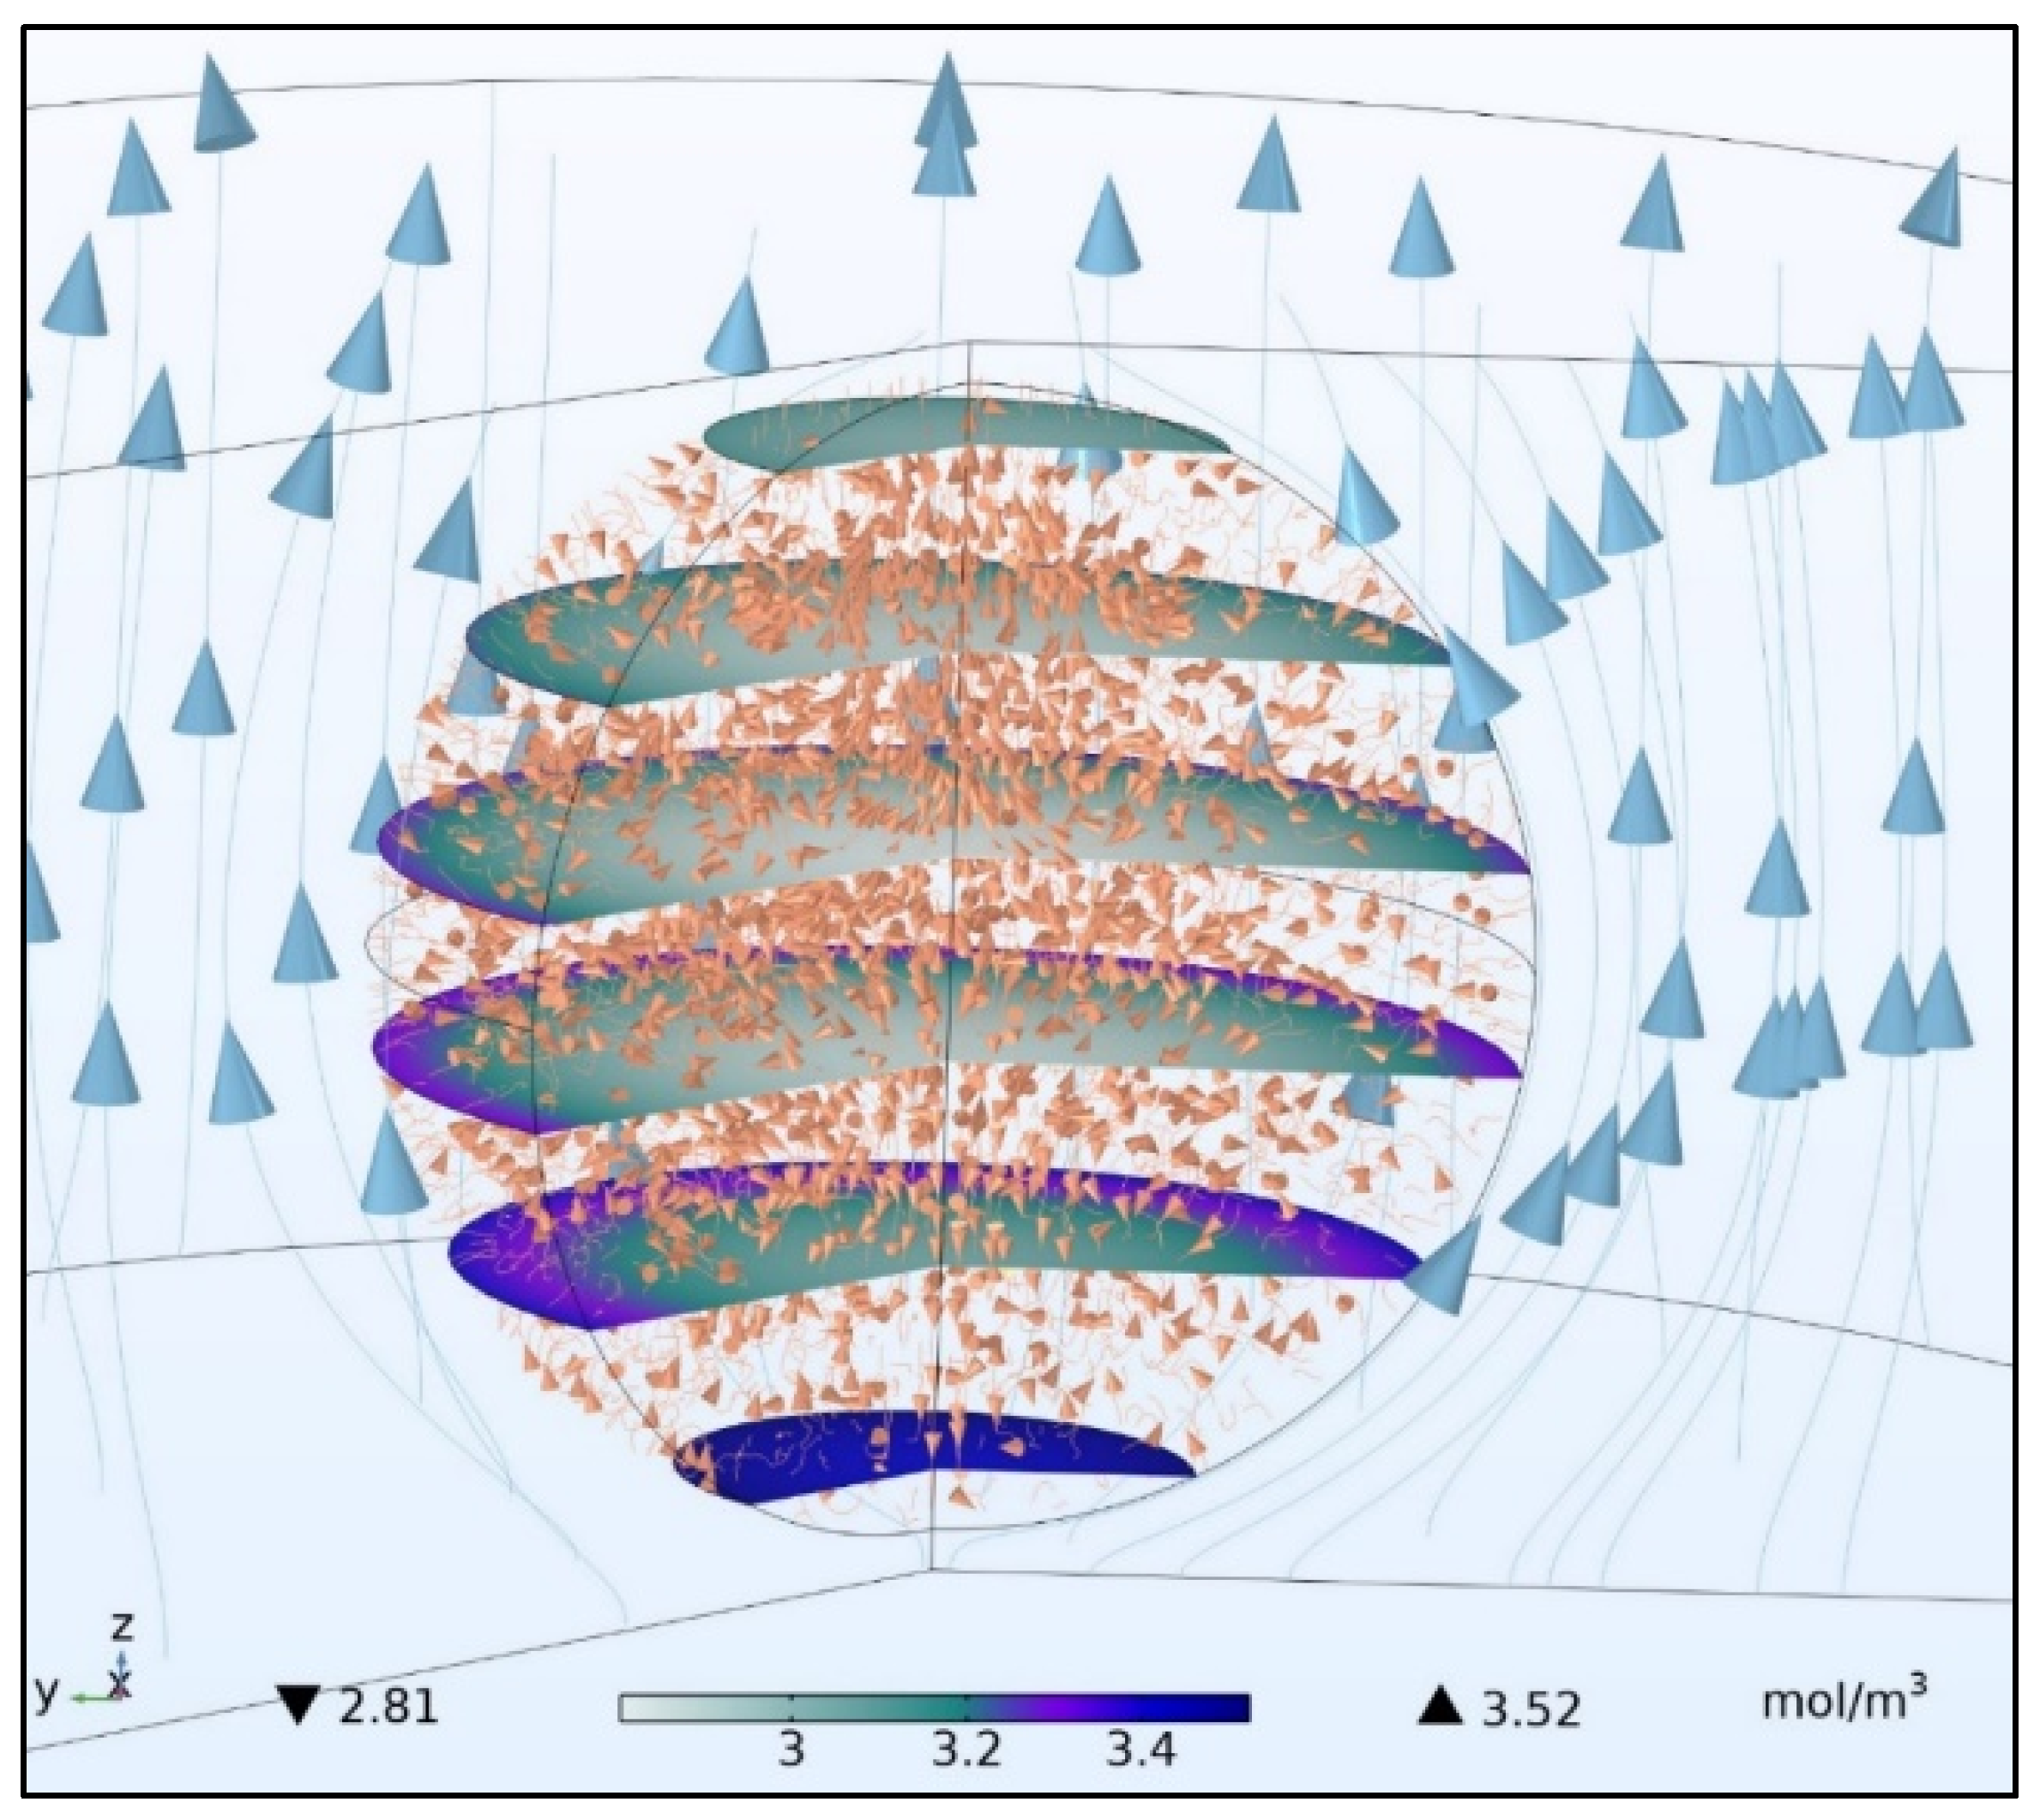
5.1. Mole Fraction of Solid Species and Concentration Profiles of Solid and Gaseous Species
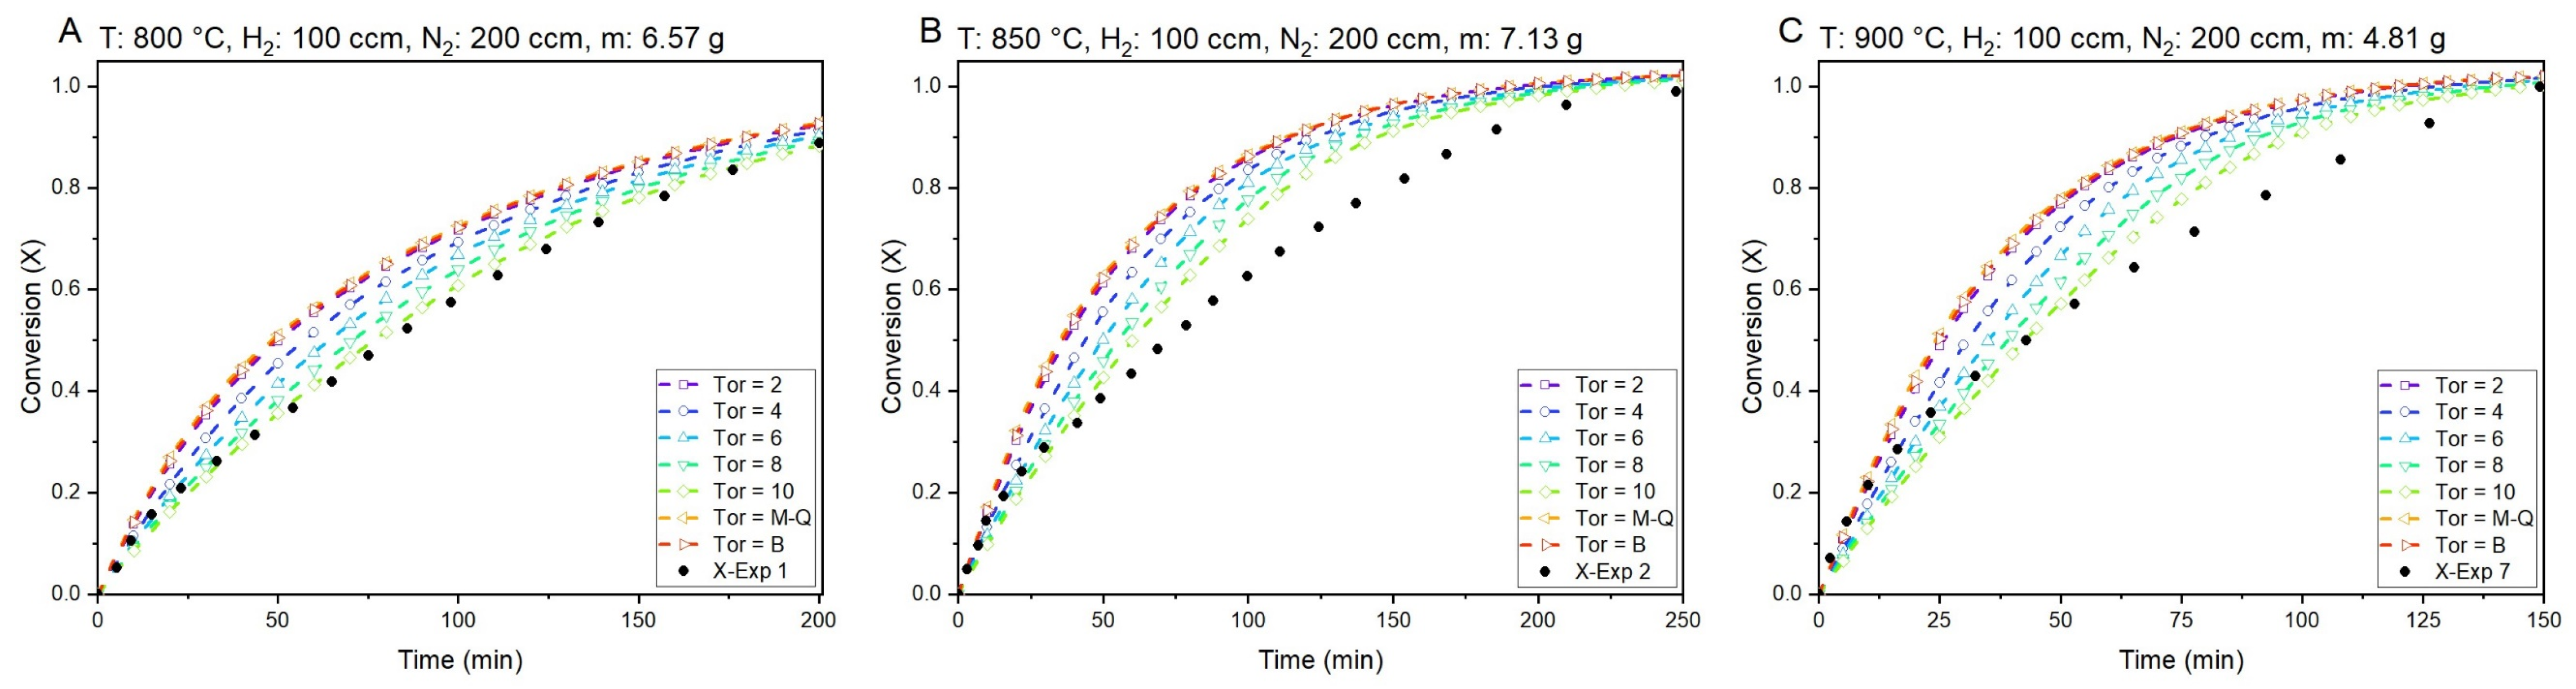
5.2. Conversion (X) vs. Time Curves of Model and Validation with Experimental Data
6. Conclusions
Supplementary Materials
Author Contributions
Funding
Data Availability Statement
Acknowledgments
Conflicts of Interest
Full Legal Disclaimer
Appendix A


Appendix B

| Sample | ImageJ Phase Analysis | EDAX Point Analysis Composition (%) | |||||||
|---|---|---|---|---|---|---|---|---|---|
| Image Spot | Figure # | Phase | Composition (%) | Fe | O | Al | Si | Ca | Mg |
| r/R = ~1 (25% reduced) | 4-A | Iron | 9.92 | 100 | - | - | - | - | - |
| Iron Oxide | 75.47 | 81.2 | 18.8 | - | - | - | - | ||
| Gangue | 14.61 | 15.56 | 39.1 | 1.58 | 20.48 | 23.29 | - | ||
| r/R = ~0.5 (25% reduced) | 4-B | Iron | 0 | - | - | - | - | - | - |
| Iron Oxide | 84.72 | 80.9 | 19.1 | ||||||
| Gangue | 15.28 | 13.74 | 35.89 | 1.67 | 21.32 | 27.37 | - | ||
| r/R = ~0 (25% reduced) | 4-C | Iron | 0 | - | - | - | - | - | - |
| Iron Oxide | 87.24 | 81.09 | 18.91 | - | - | - | - | ||
| Gangue | 12.76 | 11.09 | 38.1 | 2.04 | 23.76 | 25.01 | - | ||
| r/R = ~1 (40% reduced) | 4-D | Iron | 19.37 | 100 | - | - | - | - | - |
| Iron Oxide | 63.56 | 80.23 | 19.77 | - | - | - | - | ||
| Gangue | 17.07 | 28.29 | 31.08 | 1.79 | 17.6 | 20.32 | - | ||
| r/R = ~0.5 (40% reduced) | 4-E | Iron | 0 | - | - | - | - | - | - |
| Iron Oxide | 85.23 | 81.59 | 18.41 | - | - | - | - | ||
| Gangue | 14.77 | 82.3 | 15.66 | - | 0.79 | 1.25 | - | ||
| r/R = ~0 (40% reduced) | 4-F | Iron | 0 | - | - | - | - | - | - |
| Iron Oxide | 82.05 | 79.69 | 20.31 | - | - | - | - | ||
| Gangue | 17.95 | 52.07 | 23.35 | 1.04 | 12.17 | 11.38 | - | ||
| r/R = ~1 (80% reduced) | 4-G | Iron | 58.7 | 100 | - | - | - | - | - |
| Iron Oxide | 21.25 | 98 | 2 | - | - | - | - | ||
| Gangue | 20.05 | 29.9 | 26.6 | 2.51 | 19.18 | 21.8 | - | ||
| r/R = ~0.5 (80% reduced) | 4-H | Iron | 43.57 | 100 | - | - | - | - | - |
| Iron Oxide | 41.89 | 94.34 | 5.66 | - | - | - | - | ||
| Gangue | 14.54 | 32.85 | 22.53 | 2.4 | 20.78 | 20.16 | 1.29 | ||
| r/R = ~0 (80% reduced) | 4-I | Iron | 29.82 | 100 | - | - | - | - | - |
| Iron Oxide | 62.66 | 84.84 | 15.16 | - | - | - | - | ||
| Gangue | 7.52 | 90.12 | 4.97 | 1.53 | 2.17 | 1.22 | - | ||
| r/R = ~1 (>95% reduced) | 4-J | Iron | 56.67 | 100 | - | - | - | - | - |
| Iron Oxide | 19.36 | 88.81 | 11.19 | - | - | - | - | ||
| Gangue | 23.97 | 37.93 | 31.16 | 1.86 | 14.89 | 12.76 | 1.41 | ||
| r/R = ~0.5 (>95% reduced) | 4-K | Iron | 47.93 | 100 | - | - | - | - | - |
| Iron Oxide | 38.43 | 92.42 | 7.58 | - | - | - | - | ||
| Gangue | 13.64 | 42.31 | 24.76 | 1.44 | 15.58 | 14.82 | 1.09 | ||
| r/R = ~0 (>95% reduced) | 4-L | Iron | 41.56 | 100 | - | - | - | - | - |
| Iron Oxide | 45.15 | 78.27 | 20.75 | 0.98 | - | - | - | ||
| Gangue | 13.29 | 48.73 | 23.2 | 1.42 | 15.77 | 10.31 | 0.57 | ||
| Sample | ImageJ Phase Analysis | EDAX Point Analysis Composition (%) | |||||||
|---|---|---|---|---|---|---|---|---|---|
| Image Spot | Figure # | Phase | Composition (%) | Fe | O | Al | Si | Ca | Mg |
| r/R = ~1 (25% reduced) | 5-A | Iron | 2.18 | 100 | - | - | - | - | - |
| Iron Oxide | 75.70 | 73.67 | 24.68 | 0.76 | 0.9 | - | - | ||
| Gangue | 22.12 | 52.55 | 22.46 | 1.62 | 12.26 | 9.8 | 1.3 | ||
| r/R = ~0.5 (25% reduced) | 5-B | Iron | 0.00 | - | - | - | - | - | - |
| Iron Oxide | 87.49 | 81.21 | 18.51 | 0.17 | 0.12 | - | - | ||
| Gangue | 12.51 | 59.11 | 26.28 | 1.06 | 6.71 | 6.83 | - | ||
| r/R = ~0 (25% reduced) | 5-C | Iron | 0.00 | - | - | - | - | - | - |
| Iron Oxide | 100.00 | 79.01 | 20.99 | - | - | - | - | ||
| Gangue | 0.00 | - | - | - | - | - | - | ||
| r/R = ~1 (40% reduced) | 5-D | Iron | 23.19 | 100 | - | - | - | - | - |
| Iron Oxide | 64.65 | 85.63 | 14.37 | - | - | - | - | ||
| Gangue | 12.16 | 37.84 | 24.87 | 1.93 | 16.52 | 18.83 | - | ||
| r/R = ~0.5 (40% reduced) | 5-E | Iron | 22.16 | 100 | - | - | - | - | - |
| Iron Oxide | 66.76 | 80.21 | 19.12 | 0.67 | - | - | - | ||
| Gangue | 11.09 | 34.83 | 26.8 | 0.88 | 14.38 | 23.11 | - | ||
| r/R = ~0 (40% reduced) | 5-F | Iron | 0.00 | - | - | - | - | - | - |
| Iron Oxide | 79.78 | 83.7 | 16.3 | - | - | - | - | ||
| Gangue | 20.22 | 23.28 | 34.21 | 2.44 | 22.87 | 17.2 | - | ||
| r/R = ~1 (80% reduced) | 5-G | Iron | 44.47 | 99.68 | - | 0.32 | - | - | - |
| Iron Oxide | 37.94 | 89.18 | 10.49 | 0.33 | - | - | - | ||
| Gangue | 17.59 | 5.13 | 36.06 | 0.2 | 21.22 | 37.04 | 0.36 | ||
| r/R = ~0.5 (80% reduced) | 5-H | Iron | 26.84 | 100 | - | - | - | - | - |
| Iron Oxide | 60.79 | 91.24 | 8.76 | - | - | - | - | ||
| Gangue | 12.37 | 30.79 | 27.55 | 0.66 | 16.54 | 24.45 | - | ||
| r/R = ~0 (80% reduced) | 5-I | Iron | 32.39 | 100 | - | - | - | - | - |
| Iron Oxide | 46.37 | 81.77 | 17.67 | 0.17 | 0.21 | 0.18 | - | ||
| Gangue | 21.24 | 30.04 | 31.54 | 1.07 | 14.47 | 22.88 | - | ||
| r/R = ~1 (>95% reduced) | 5-J | Iron | 56.35 | 100 | - | - | - | - | - |
| Iron Oxide | 17.40 | 90.66 | 9.34 | - | - | - | - | ||
| Gangue | 26.25 | 50.28 | 19.02 | 2.35 | 14.96 | 13.39 | - | ||
| r/R = ~0.5 (>95% reduced) | 5-K | Iron | 60.34 | 100 | - | - | - | - | - |
| Iron Oxide | 30.78 | 88.1 | 11.24 | 0.66 | - | - | - | ||
| Gangue | 8.88 | 19.8 | 28.92 | 1.71 | 21.07 | 28.5 | - | ||
| r/R = ~0 (>95% reduced) | 5-L | Iron | 41.47 | 100 | - | - | - | - | - |
| Iron Oxide | 45.94 | 87.04 | 12.69 | - | - | - | - | ||
| Gangue | 12.59 | 50.01 | 19.97 | 0.48 | 29.01 | 0.52 | - | ||
Appendix C
| Component | Fe (Total) | FeO | SiO2 | CaO | Al2O3 | Volatiles | Carbides |
|---|---|---|---|---|---|---|---|
| Mass (%) | 67.8 | 0.35 | 1.34 | 0.76 | 0.49 | 0.13 | 0 |
| Experiment # | Experiment Data | Model Data (Pm) | ||
|---|---|---|---|---|
| Conversion (X) | Time (min) | Conversion (X) | Time (min) | |
| 1 | 0.88 | 200.16 | 0.88 | 170.5 |
| 2 | 0.99 | 247.7 | 0.99 | 188 |
| 3 | 0.96 | 155.66 | 0.96 | 141.5 |
| 4 | 0.99 | 138.23 | 0.99 | 138 |
| 5 | 0.95 | 100.8 | 0.95 | 99.5 |
| 6 | 0.93 | 59.96 | 0.93 | 73 |
| 7 | 0.99 | 149.26 | 0.99 | 117.5 |
| 8 | 0.99 | 206.83 | 0.99 | 207 |
| 9 | 0.97 | 145.33 | 0.97 | 165.5 |
| 10 | 0.93 | 154.66 | 0.93 | 154.5 |
| 11 | 0.99 | 152 | 0.99 | 178 |
| 12 | 0.98 | 229.66 | 0.98 | 224.5 |
References
- Bhaskar, A.; Assadi, M.; Somehsaraei, H.N. Decarbonization of the Iron and Steel Industry with Direct Reduction of Iron Ore with Green Hydrogen. Energies 2020, 13, 758. [Google Scholar] [CrossRef] [Green Version]
- Ren, L.; Zhou, S.; Peng, T.; Ou, X. A Review of CO2 Emissions Reduction Technologies and Low-Carbon Development in the Iron and Steel Industry Focusing on China. Renew. Sustain. Energy Rev. 2021, 143, 110846. [Google Scholar] [CrossRef]
- Li, K.; Khanna, R.; Zhang, J.; Liu, Z.; Sahajwalla, V.; Yang, T.; Kong, D. The Evolution of Structural Order, Microstructure and Mineral Matter of Metallurgical Coke in a Blast Furnace: A Review. Fuel 2014, 133, 194–215. [Google Scholar] [CrossRef]
- Jiang, X.; Wang, L.; Shen, F.M. Shaft Furnace Direct Reduction Technology–Midrex and Energiron. Adv. Mater. Res. 2013, 805–806, 654–659. [Google Scholar] [CrossRef]
- Spreitzer, D.; Schenk, J. Reduction of Iron Oxides with Hydrogen—A Review. Steel Res. Int. 2019, 90, 1900108. [Google Scholar] [CrossRef] [Green Version]
- Sarkar, S.; Bhattacharya, R.; Roy, G.G.; Sen, P.K. Modeling MIDREX Based Process Configurations for Energy and Emission Analysis. Steel Res. Int. 2018, 89, 1700248. [Google Scholar] [CrossRef]
- Pei, M.; Petäjäniemi, M.; Regnell, A.; Wijk, O. Toward a Fossil Free Future with HYBRIT: Development of Iron and Steelmaking Technology in Sweden and Finland. Metals 2020, 10, 972. [Google Scholar] [CrossRef]
- Pivovar, B.; Rustagi, N.; Satyapal, S. Hydrogen at Scale (H2@Scale) Key to a Clean, Economic, and Sustainable Energy System. Electrochem. Soc. Interface 2018, 27, 47–52. [Google Scholar] [CrossRef]
- Moreno, A. The United States’ Clean Energy Goals. Available online: https://www.renewable-ei.org/pdfdownload/activities/01_Key_AlejandroMoreno.pdf (accessed on 1 November 2022).
- Pauluzzi, D.; Zugliano, A.; Dalle, D.; Senior, N.; Martinis, A.; Dri, I. CFD Study of an Energiron Reactor Fed With Different Concentrations of Hydrogen. Available online: https://tenova.com/sites/default/files/2021-09/MARCH-2021_AIST-IRON-STEEL-TECHNOLOGY.pdf (accessed on 1 November 2022).
- Zare Ghadi, A.; Valipour, M.S.; Vahedi, S.M.; Sohn, H.Y. A Review on the Modeling of Gaseous Reduction of Iron Oxide Pellets. Steel Res. Int. 2020, 91, 1900270. [Google Scholar] [CrossRef]
- Heidari, A.; Niknahad, N.; Iljana, M.; Fabritius, T. A Review on the Kinetics of Iron Ore Reduction by Hydrogen. Materials 2021, 14, 7540. [Google Scholar] [CrossRef] [PubMed]
- Levenspiel, O. Chemical Reaction Engineering, 3rd ed.; John Wiley & Sons, Inc.: Hoboken, NJ, USA, 1998; ISBN 9780471254249. [Google Scholar]
- Ginstling, A.M.; Brounshtein, B. Concerning the Diffusion Kinetics of Reactions in Spherical Particles. J. Appl. Chem. 1950, 23, 1327–1338. [Google Scholar]
- Jander, W. Reaktionen Im Festen Zustande Bei Hoheren Tempereturen. Z. Anorg. Allgem. Chem. 1927, 163, 1–31. [Google Scholar] [CrossRef]
- Ortega, A. The Kinetics of Solid-State Reactions toward Consensus—Part I: Uncertainties, Failures, and Successes of Conventional Methods. Int. J. Chem. Kinet. 2001, 33, 343–353. [Google Scholar] [CrossRef]
- Zuo, H.b.; Wang, C.; Dong, J.j.; Jiao, K.x.; Xu, R.s. Reduction Kinetics of Iron Oxide Pellets with H2 and CO Mixtures. Int. J. Miner. Metall. Mater. 2015, 22, 688–696. [Google Scholar] [CrossRef]
- Valipour, M.S.; Motamed Hashemi, M.Y.; Saboohi, Y. Mathematical Modeling of the Reaction in an Iron Ore Pellet Using a Mixture of Hydrogen, Water Vapor, Carbon Monoxide and Carbon Dioxide: An Isothermal Study. Adv. Powder Technol. 2006, 17, 277–295. [Google Scholar] [CrossRef]
- Valipour, M.S.; Saboohi, Y. Numerical Investigation of Nonisothermal Reduction of Hematite Using Syngas: The Shaft Scale Study. Model. Simul. Mater. Sci. Eng. 2007, 15, 487. [Google Scholar] [CrossRef]
- Ghadi, A.Z.; Valipour, M.S.; Biglari, M. Mathematical Modelling of Wustite Pellet Reduction: Grain Model in Comparison with USCM. Ironmak. Steelmak. 2016, 43, 418–425. [Google Scholar] [CrossRef]
- Ariyan, Z.G.; Mohammad Sadegh, V.; Mojtaba, B. Numerical Analysis of Complicated Heat and Mass Transfer inside a Wustite Pellet during Reducing to Sponge Iron by H2 and CO Gaseous Mixture. J. Iron Steel Res. Int. 2016, 23, 1142–1150. [Google Scholar] [CrossRef]
- Beheshti, R.; Moosberg-Bustnes, J.; Aune, R.E. Modeling and Simulation of Isothermal Reduction of a Single Hematite Pellet in Gas Mixtures of H2 and CO. In Proceedings of the TMS 2014: 143rd Annual Meeting & Exhibition; Springer: Cham, Switzerland, 2014; pp. 495–502. [Google Scholar] [CrossRef]
- Kazemi, M.; Pour, M.S.; Sichen, D. Experimental and Modeling Study on Reduction of Hematite Pellets by Hydrogen Gas. Metall. Mater. Trans. B Process Metall. Mater. Process. Sci. 2017, 48, 1114–1122. [Google Scholar] [CrossRef] [Green Version]
- Kazemi, M.; Sichen, D. Effect of Experimental Conditions on Cementite Formation During Reduction of Iron Ore Pellets. Metall. Mater. Trans. B Process Metall. Mater. Process. Sci. 2016, 47, 3519–3526. [Google Scholar] [CrossRef]
- Zhao, X.; Jin, H. Correlation for Self-Diffusion Coefficients of H2, CH4, CO, O2 and CO2 in Supercritical Water from Molecular Dynamics Simulation. Appl. Therm. Eng. 2020, 171, 114941. [Google Scholar] [CrossRef]
- Turkdogan, E.T.; Vinters, J.V. Gaseous Reduction of Iron Oxides: Part III. Reduction-Oxidation of Porous and Dense Iron Oxides and Iron. Metall. Trans. 1972, 3, 1561–1574. [Google Scholar] [CrossRef]
- Abdelrahim, A.; Iljana, M.; Omran, M.; Vuolio, T.; Bartusch, H.; Fabritius, T. Influence of H2–H2O Content on the Reduction of Acid Iron Ore Pellets in a CO–CO2–N2 Reducing Atmosphere. ISIJ Int. 2020, 60, ISIJINT-2019-734. [Google Scholar] [CrossRef]
- Yi, L.; Huang, Z.; Jiang, T.; Wang, L.; Qi, T. Swelling Behavior of Iron Ore Pellet Reduced by H2–CO Mixtures. Powder Technol. 2015, 269, 290–295. [Google Scholar] [CrossRef]
- Hara, Y.; Tsuchiya, M.; Kondo, S. Intraparticle Temperature of Iron-Oxide Pellet during the Reduction. Tetsu-to-Hagane 1974, 60, 1261–1270. [Google Scholar] [CrossRef] [Green Version]
- Thermophysical Properties of Fluid Systems. Available online: https://webbook.nist.gov/chemistry/fluid/ (accessed on 18 January 2022).
- Bird, R.B.; Stewart, W.E.; Lightfoot, E.N. Chapter 17: Diffusivity and the Mechanisms of Mass Transport, 2nd ed.; Wiley: Hoboken, NJ, USA, 2014. [Google Scholar]
- Bird, R.B.; Stewart, W.E.; Lightfoot, E.N. Appendix E: Tables for Prediction of Transport Properties, 2nd ed.; Wiley: Hoboken, NJ, USA, 2014. [Google Scholar]
- Murayama, T.; Ono, Y.; Kawai, Y. Step-Wise Reduction of Hematite Pellets with CO-CO2 Gas Mixtures. Trans. Iron Steel Inst. Japan 1978, 18, 579–587. [Google Scholar] [CrossRef] [Green Version]
- Diffusion in Porous Media. Available online: https://doc.comsol.com/5.6/doc/com.comsol.help.battery/battery_ug_chemsptrans.09.139.html (accessed on 22 September 2022).
- Valipour, M.S.; Mokhtari, M.H. Effect of Water Gas Shift Reaction on the Non-Isothermal Reduction of Wustite Porous Pellet Using Syngas. Int. J. Iron Steel Soc. Iran 2011, 8, 9–15. [Google Scholar]
- The Laminar Flow Interface. Available online: https://doc.comsol.com/5.5/doc/com.comsol.help.cfd/cfd_ug_fluidflow_single.06.008.html (accessed on 22 September 2022).
- The Brinkman Equations Interface. Available online: https://doc.comsol.com/5.6/doc/com.comsol.help.cfd/cfd_ug_fluidflow_porous.10.37.html (accessed on 22 September 2022).
- Rouquerol, J.; Avnir, D.; Fairbridge, C.W.; Everett, D.H.; Haynes, J.M.; Pernicone, N.; Ramsay, J.D.F.; Sing, K.S.W.; Unger, K.K. Recommendations for the Characterization of Porous Solids (Technical Report). Pure Appl. Chem. 1994, 66, 1739–1758. [Google Scholar] [CrossRef]
- Shin, S.G.; Min, D.J. A Study on the Reduction Behavior of FeO by Analyzing Pore Characteristics Using the Labyrinth Coefficient at High Temperature. Metals 2021, 11, 414. [Google Scholar] [CrossRef]
- Higuchi, K.; Heerema, R.H. Influence of Artificially Induced Porosity on Strength and Reduction Behavior of Hematite Compacts. ISIJ Int. 2005, 45, 574–581. [Google Scholar] [CrossRef] [Green Version]
- Lau, R.; Peng, W.; Velazquez-Vargas, L.G.; Yang, G.Q.; Fan, L.S. Gas−Liquid Mass Transfer in High-Pressure Bubble Columns. Ind. Eng. Chem. Res. 2004, 43, 1302–1311. [Google Scholar] [CrossRef]


| Temperature | H2 Flow | CO Flow | N2 Flow | ||||
|---|---|---|---|---|---|---|---|
| Variations | Units | Grams | mm | °C | cm3/min | cm3/min | cm3/min |
| Temperature | Experiment 1 | 6.57 | 15.25 | 800 | 100 | 0 | 200 |
| Pellet size | Experiment 2 | 7.13 | 15.90 | 850 | 100 | 0 | 200 |
| Experiment 3 * | 5.36 | 13.85 | 850 | 100 | 0 | 200 | |
| Experiment 4 | 2.95 | 11.50 | 850 | 100 | 0 | 200 | |
| Gas flow rate | Experiment 5 | 4.33 | 13.00 | 850 | 150 | 0 | 200 |
| Experiment 6 | 4.41 | 13.00 | 850 | 200 | 0 | 200 | |
| Temperature | Experiment 7 | 4.81 | 13.25 | 900 | 100 | 0 | 200 |
| Gas composition | Experiment 8 | 6.22 | 15.00 | 850 | 90 | 10 | 200 |
| Experiment 9 | 4.59 | 13.75 | 850 | 80 | 20 | 200 | |
| Experiment 10 | 4.76 | 13.40 | 850 | 75 | 18 | 200 | |
| Experiment 11 | 4.28 | 13.25 | 850 | 70 | 30 | 200 | |
| Experiment 12 | 6.27 | 15.00 | 850 | 56 | 36 | 200 |
| Temperature [°C] | ||
|---|---|---|
| 800 | 0.000274562 | 0.000137686 |
| 850 | 0.000296142 | 0.000148508 |
| 900 | 0.000318367 | 0.000159653 |
| i | Reaction | References | ||
|---|---|---|---|---|
| 1 | Fe2O3 + H2 → 2FeO + H2 | 80 | 66,516 | [29] |
| 2 | FeO + H2 → Fe + H2O | 2858.34 | 117,230 | [22] |
| 3 | Fe2O3 + CO → 2FeO + CO2 | 25 | 73,674 | |
| 4 | FeO + CO → Fe + CO2 | 17 | 69,488 | |
| 5 | CO + H2O → CO2 + H2 | 1400 | 44,895 | |
| 6 | CO + H2O ↔ CO2 + H2 | 93.32 × 10⁶ (Catalyst: Fe) | −128,200 | [35] |
| 18.27 (Catalyst: FeO) | 137.3 |
Publisher’s Note: MDPI stays neutral with regard to jurisdictional claims in published maps and institutional affiliations. |
© 2022 by the authors. Licensee MDPI, Basel, Switzerland. This article is an open access article distributed under the terms and conditions of the Creative Commons Attribution (CC BY) license (https://creativecommons.org/licenses/by/4.0/).
Share and Cite
Meshram, A.; Govro, J.; OMalley, R.J.; Sridhar, S.; Korobeinikov, Y. Modeling Isothermal Reduction of Iron Ore Pellet Using Finite Element Analysis Method: Experiments & Validation. Metals 2022, 12, 2026. https://doi.org/10.3390/met12122026
Meshram A, Govro J, OMalley RJ, Sridhar S, Korobeinikov Y. Modeling Isothermal Reduction of Iron Ore Pellet Using Finite Element Analysis Method: Experiments & Validation. Metals. 2022; 12(12):2026. https://doi.org/10.3390/met12122026
Chicago/Turabian StyleMeshram, Amogh, Joe Govro, Ronald J. OMalley, Seetharaman Sridhar, and Yuri Korobeinikov. 2022. "Modeling Isothermal Reduction of Iron Ore Pellet Using Finite Element Analysis Method: Experiments & Validation" Metals 12, no. 12: 2026. https://doi.org/10.3390/met12122026
APA StyleMeshram, A., Govro, J., OMalley, R. J., Sridhar, S., & Korobeinikov, Y. (2022). Modeling Isothermal Reduction of Iron Ore Pellet Using Finite Element Analysis Method: Experiments & Validation. Metals, 12(12), 2026. https://doi.org/10.3390/met12122026