


Nano Porous Zinc Synthesis on Soft Polyurethane Foam Using Conductive Ink and Electroplating Method

 , ,
, ,
Abstract
1. Introduction
2. Materials and Methods
2.1. Materials
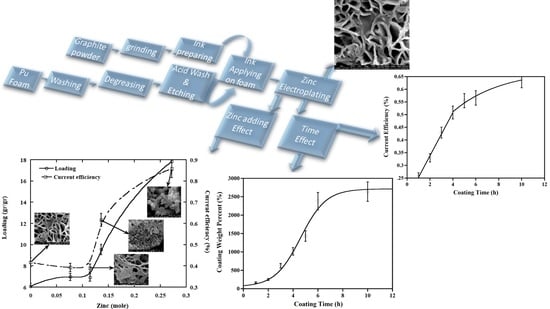
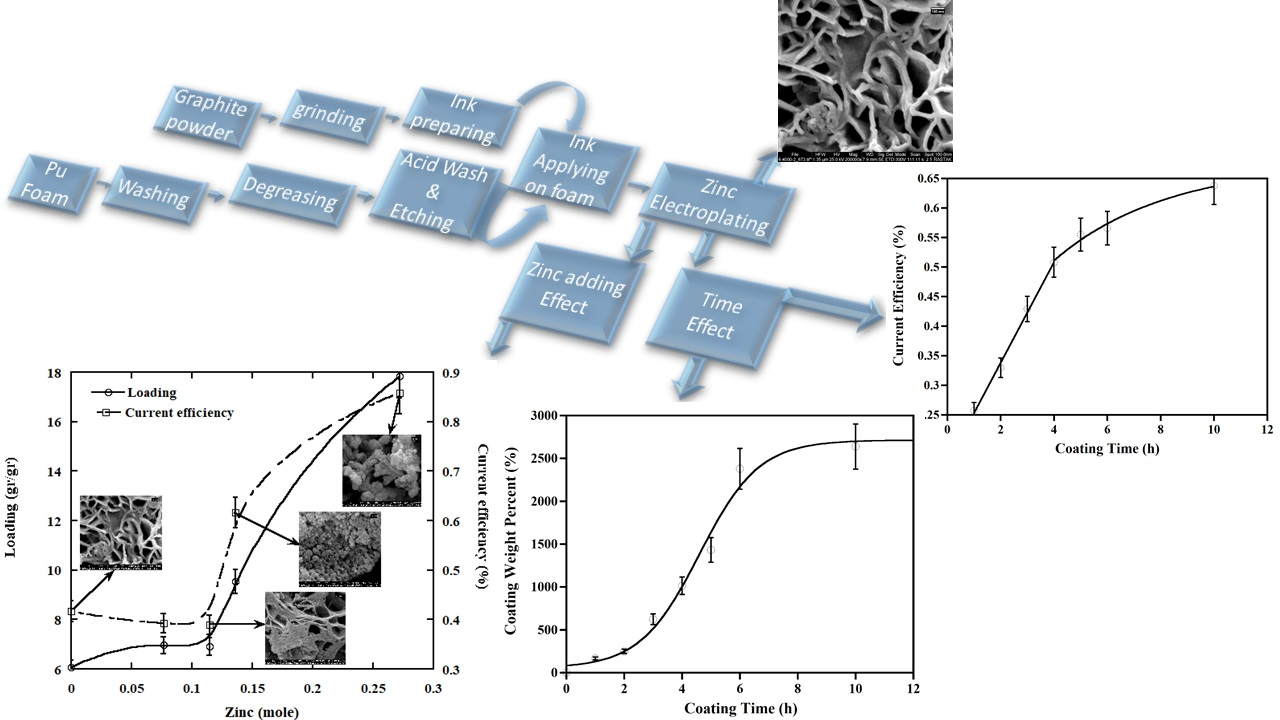
2.2. Methods
3. Results
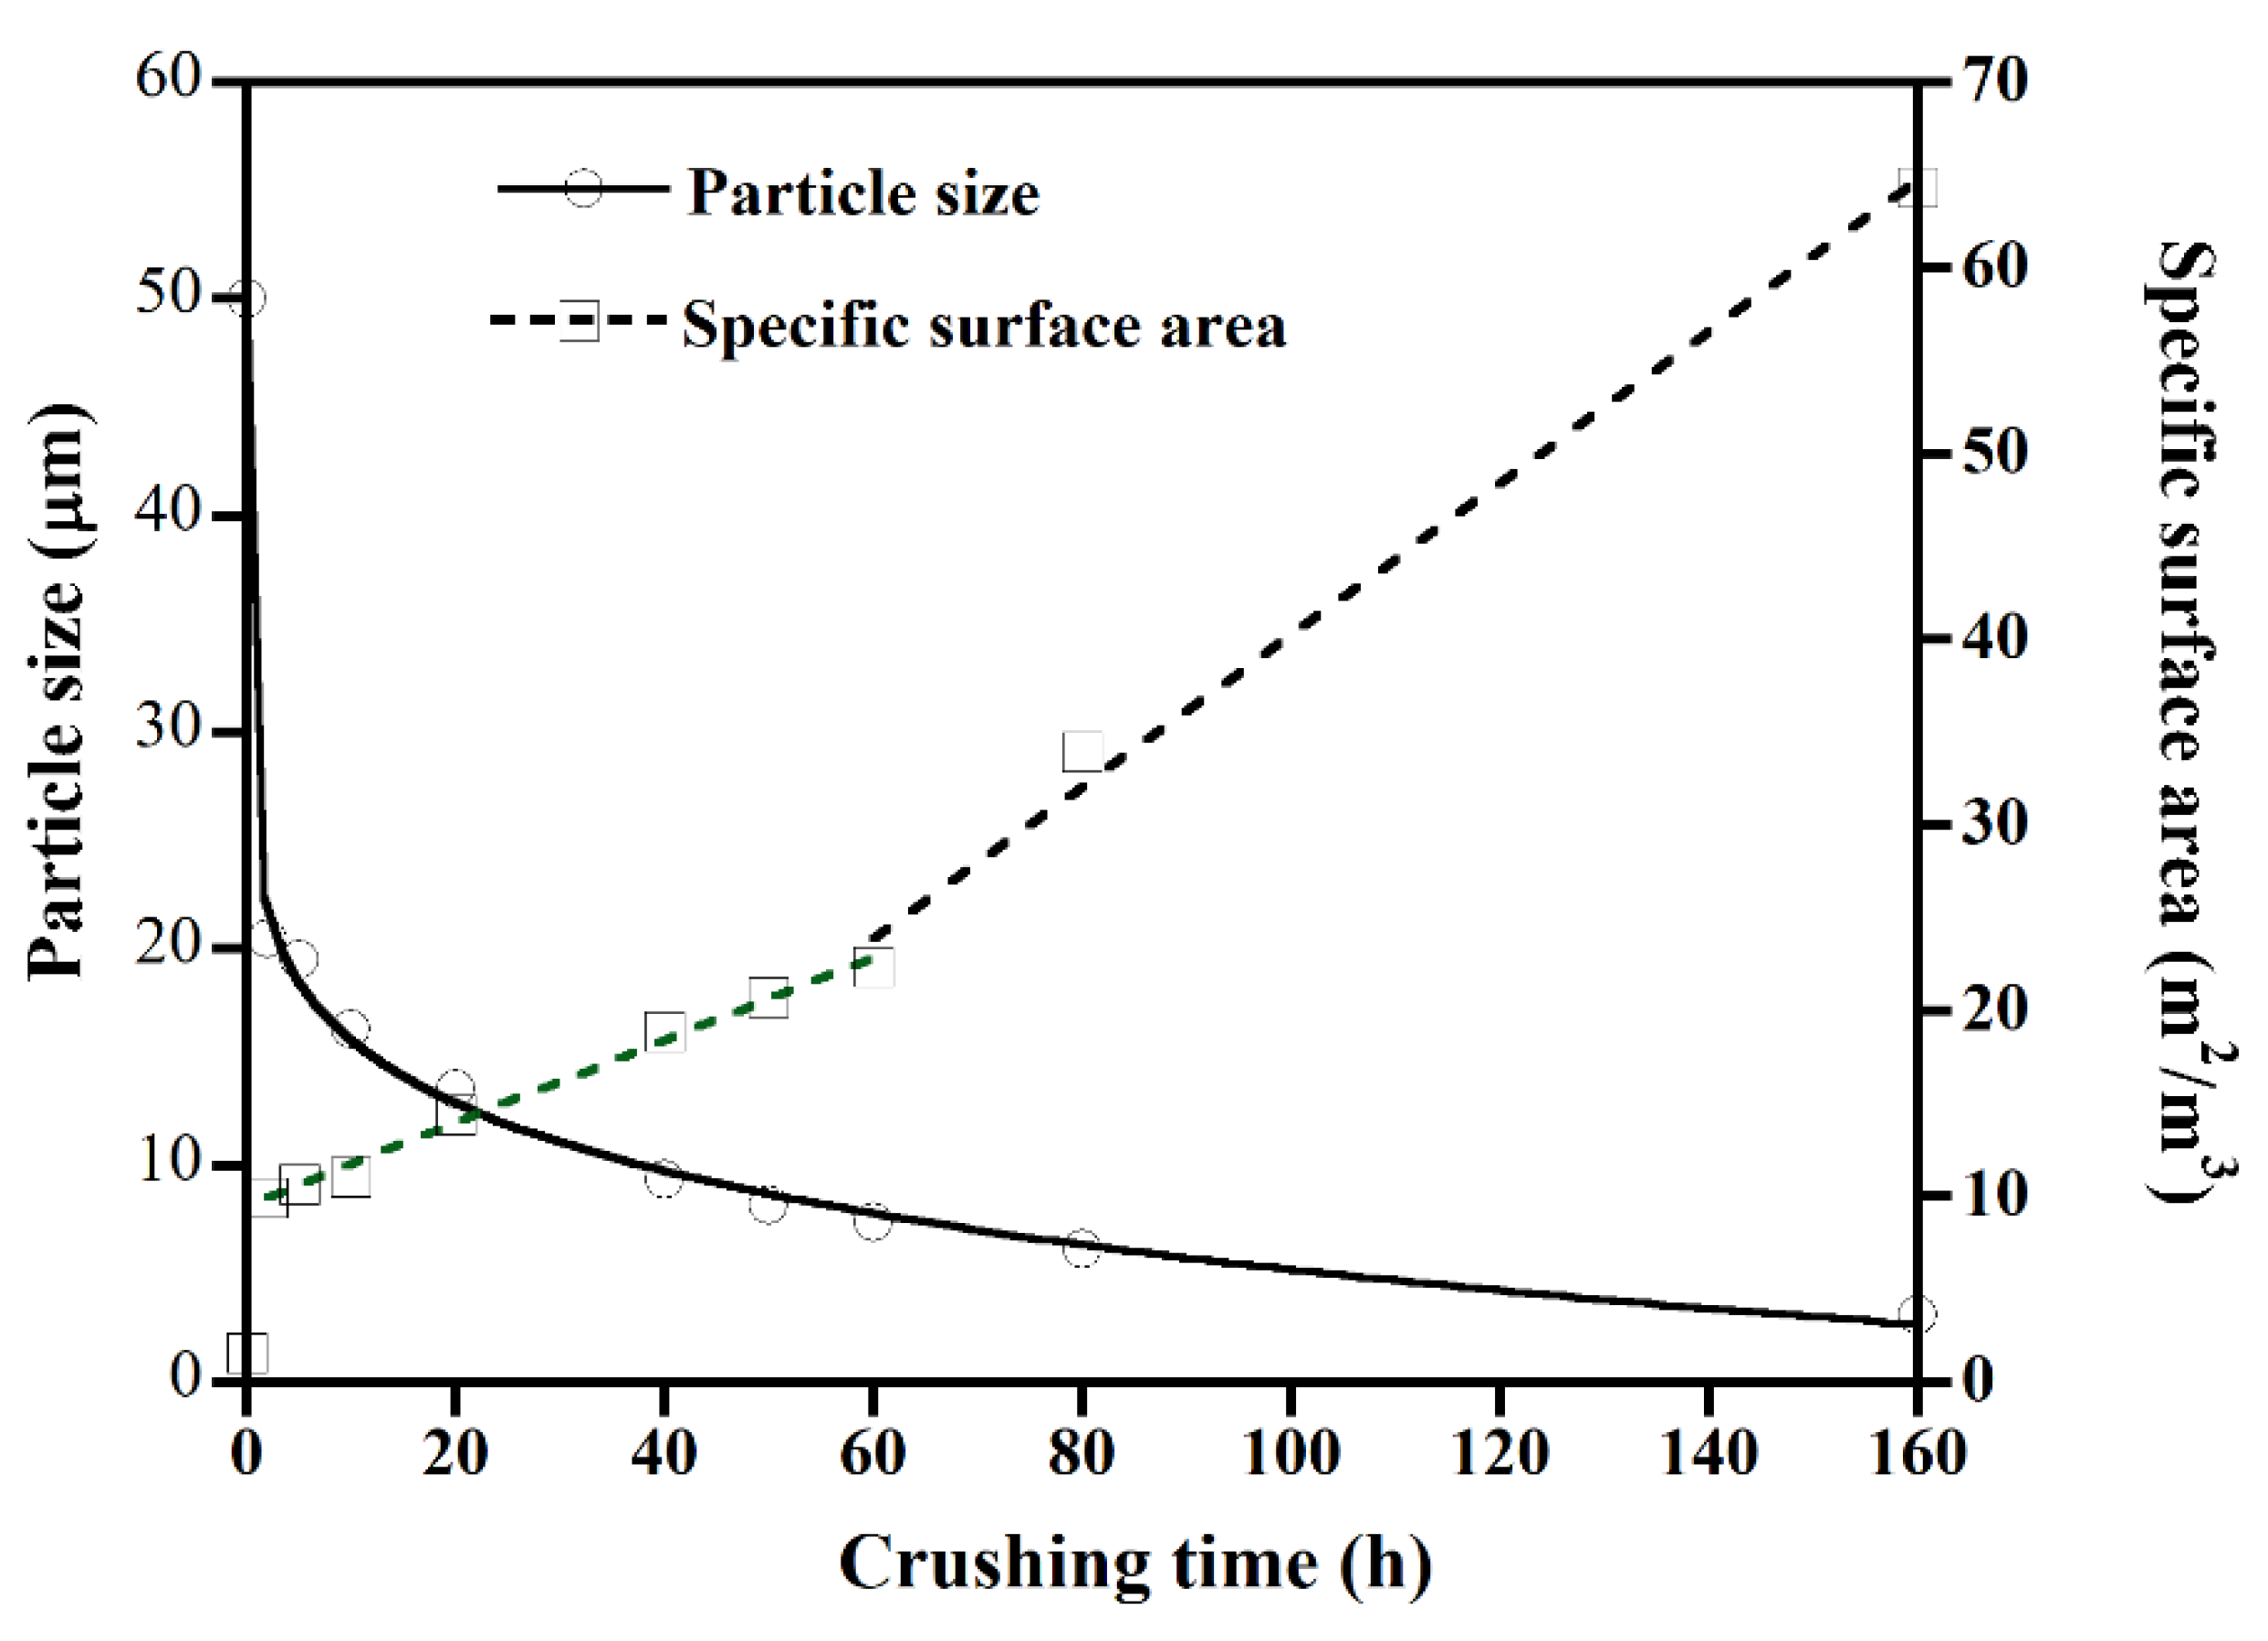
3.1. Graphite Particle Size Effect
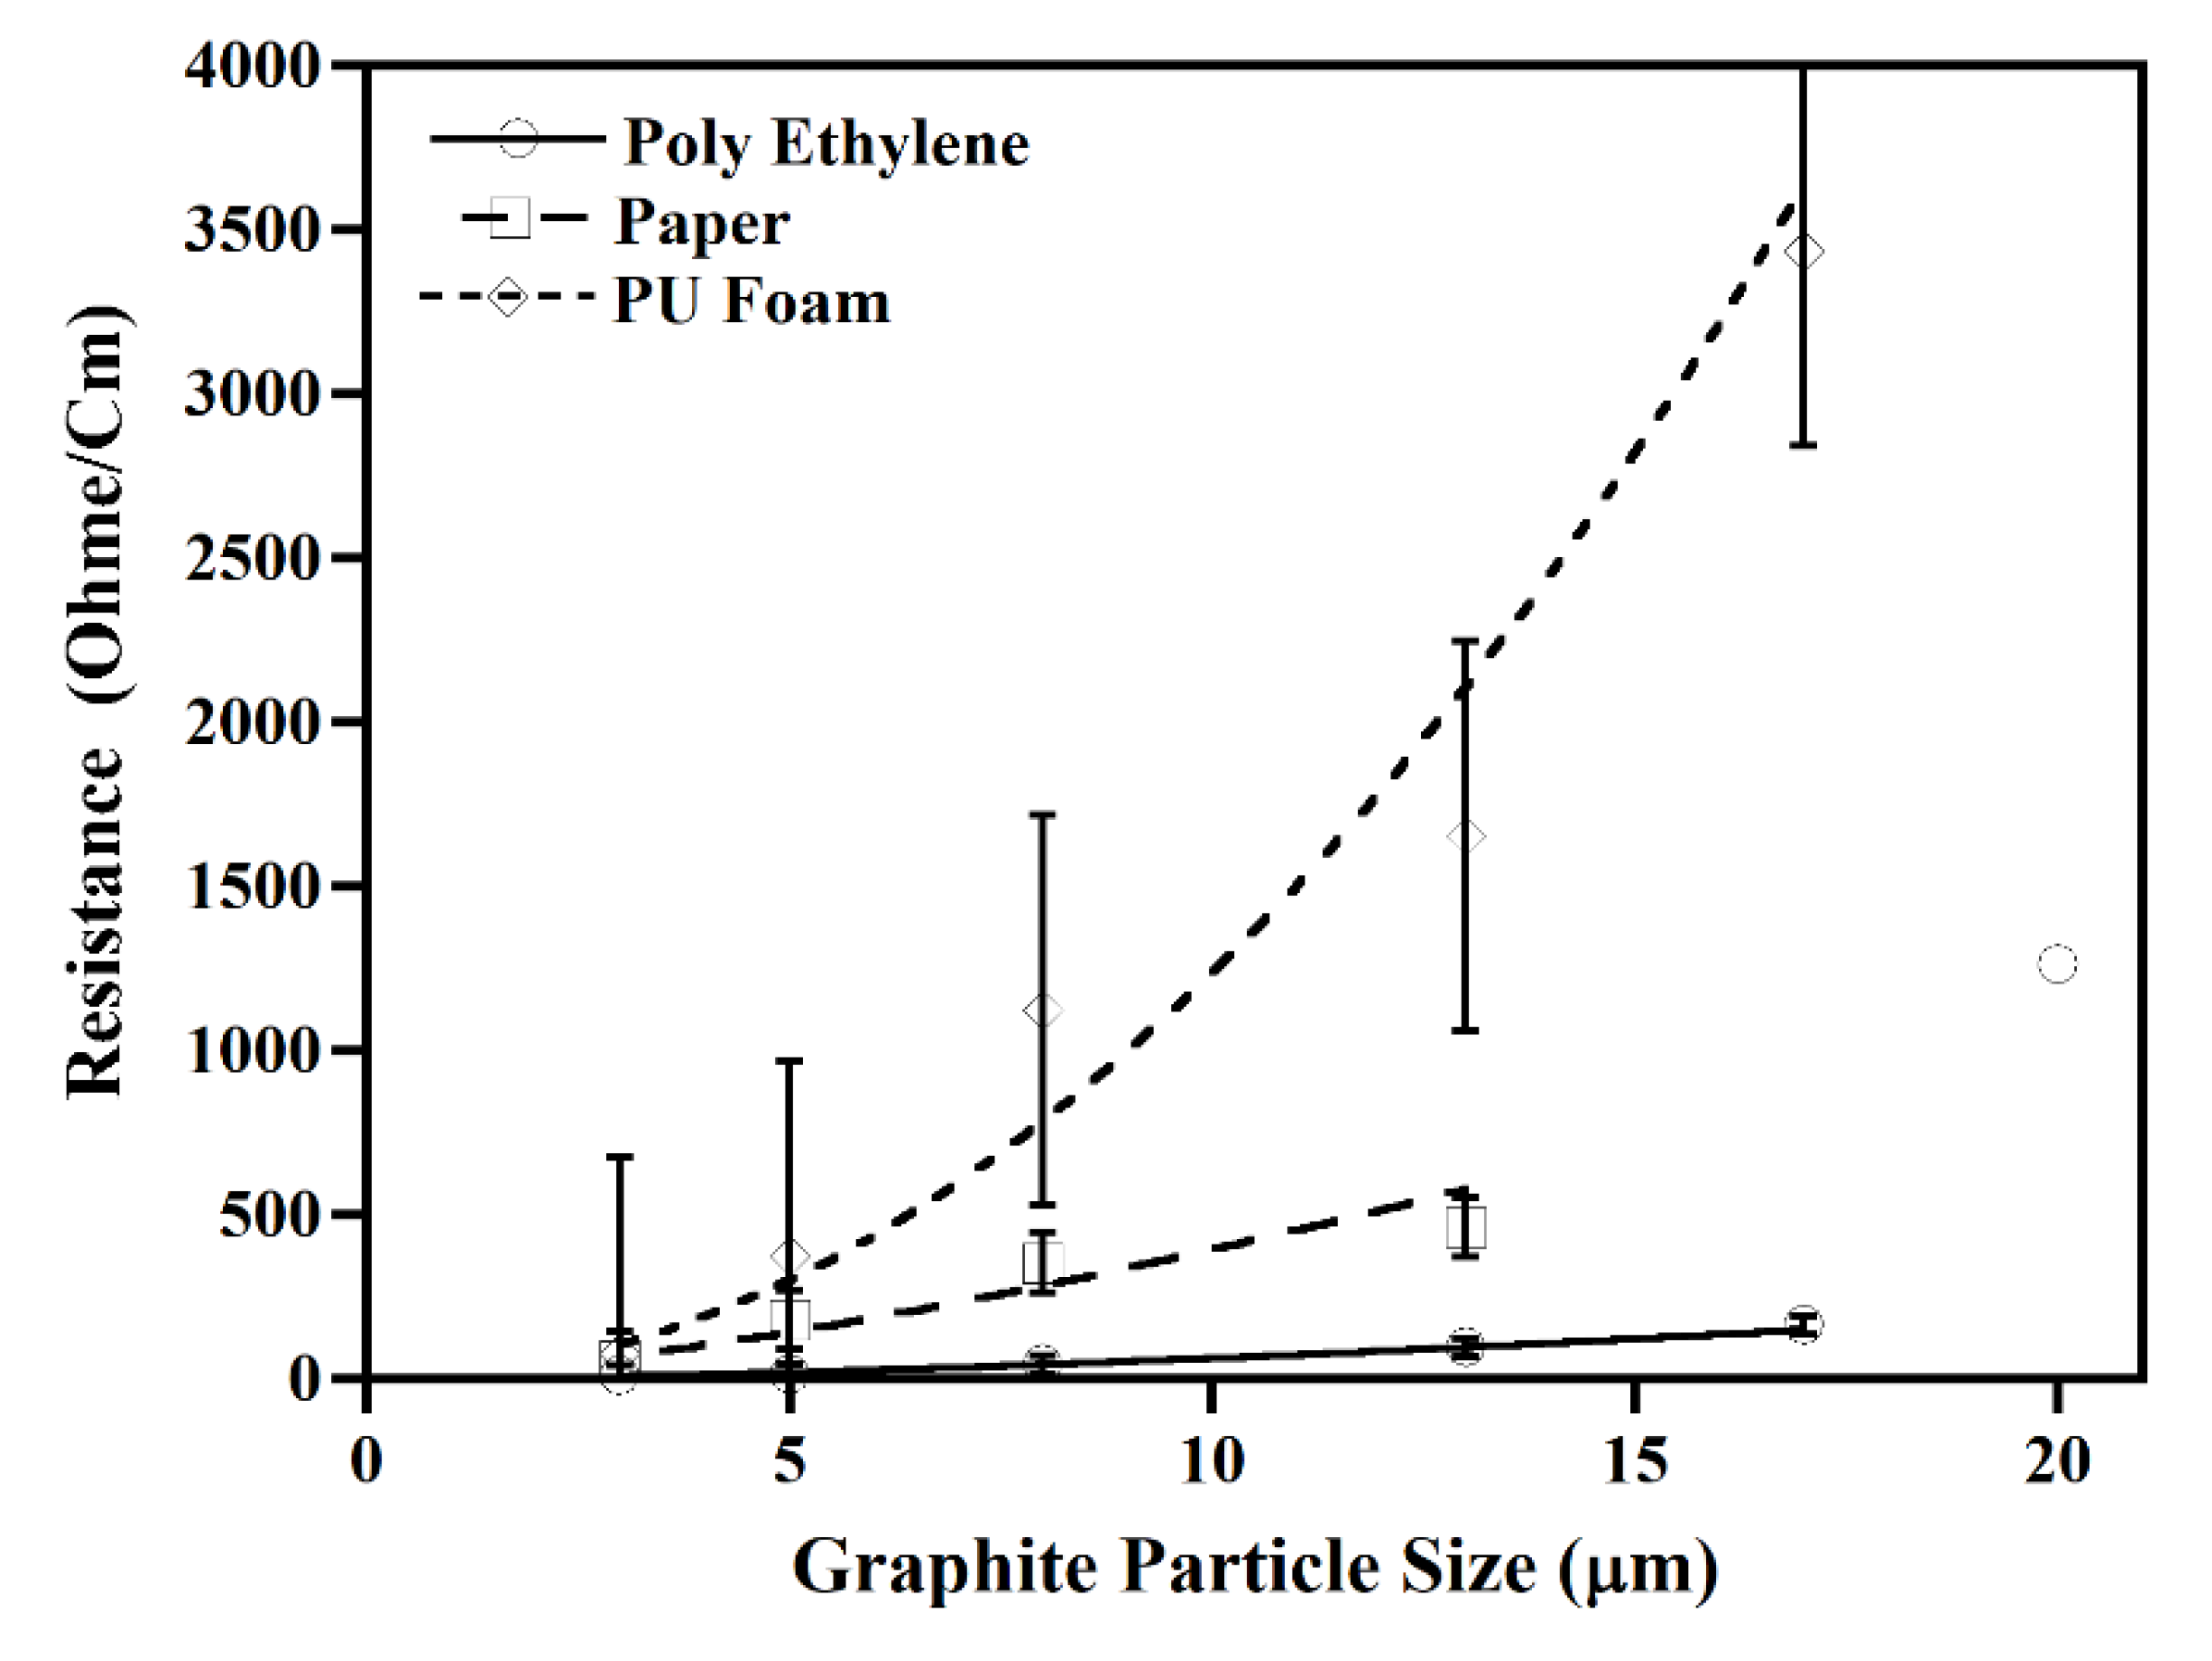
3.2. Effect of Particle Size on Ink Conductivity
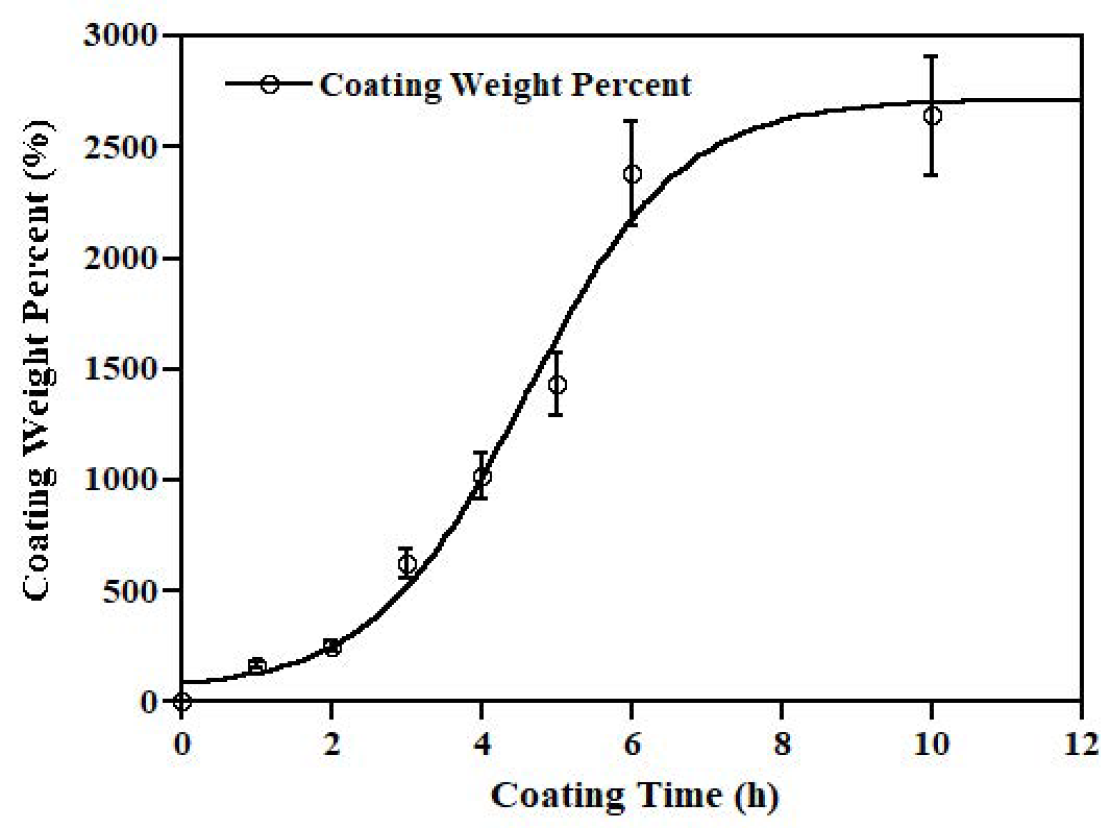
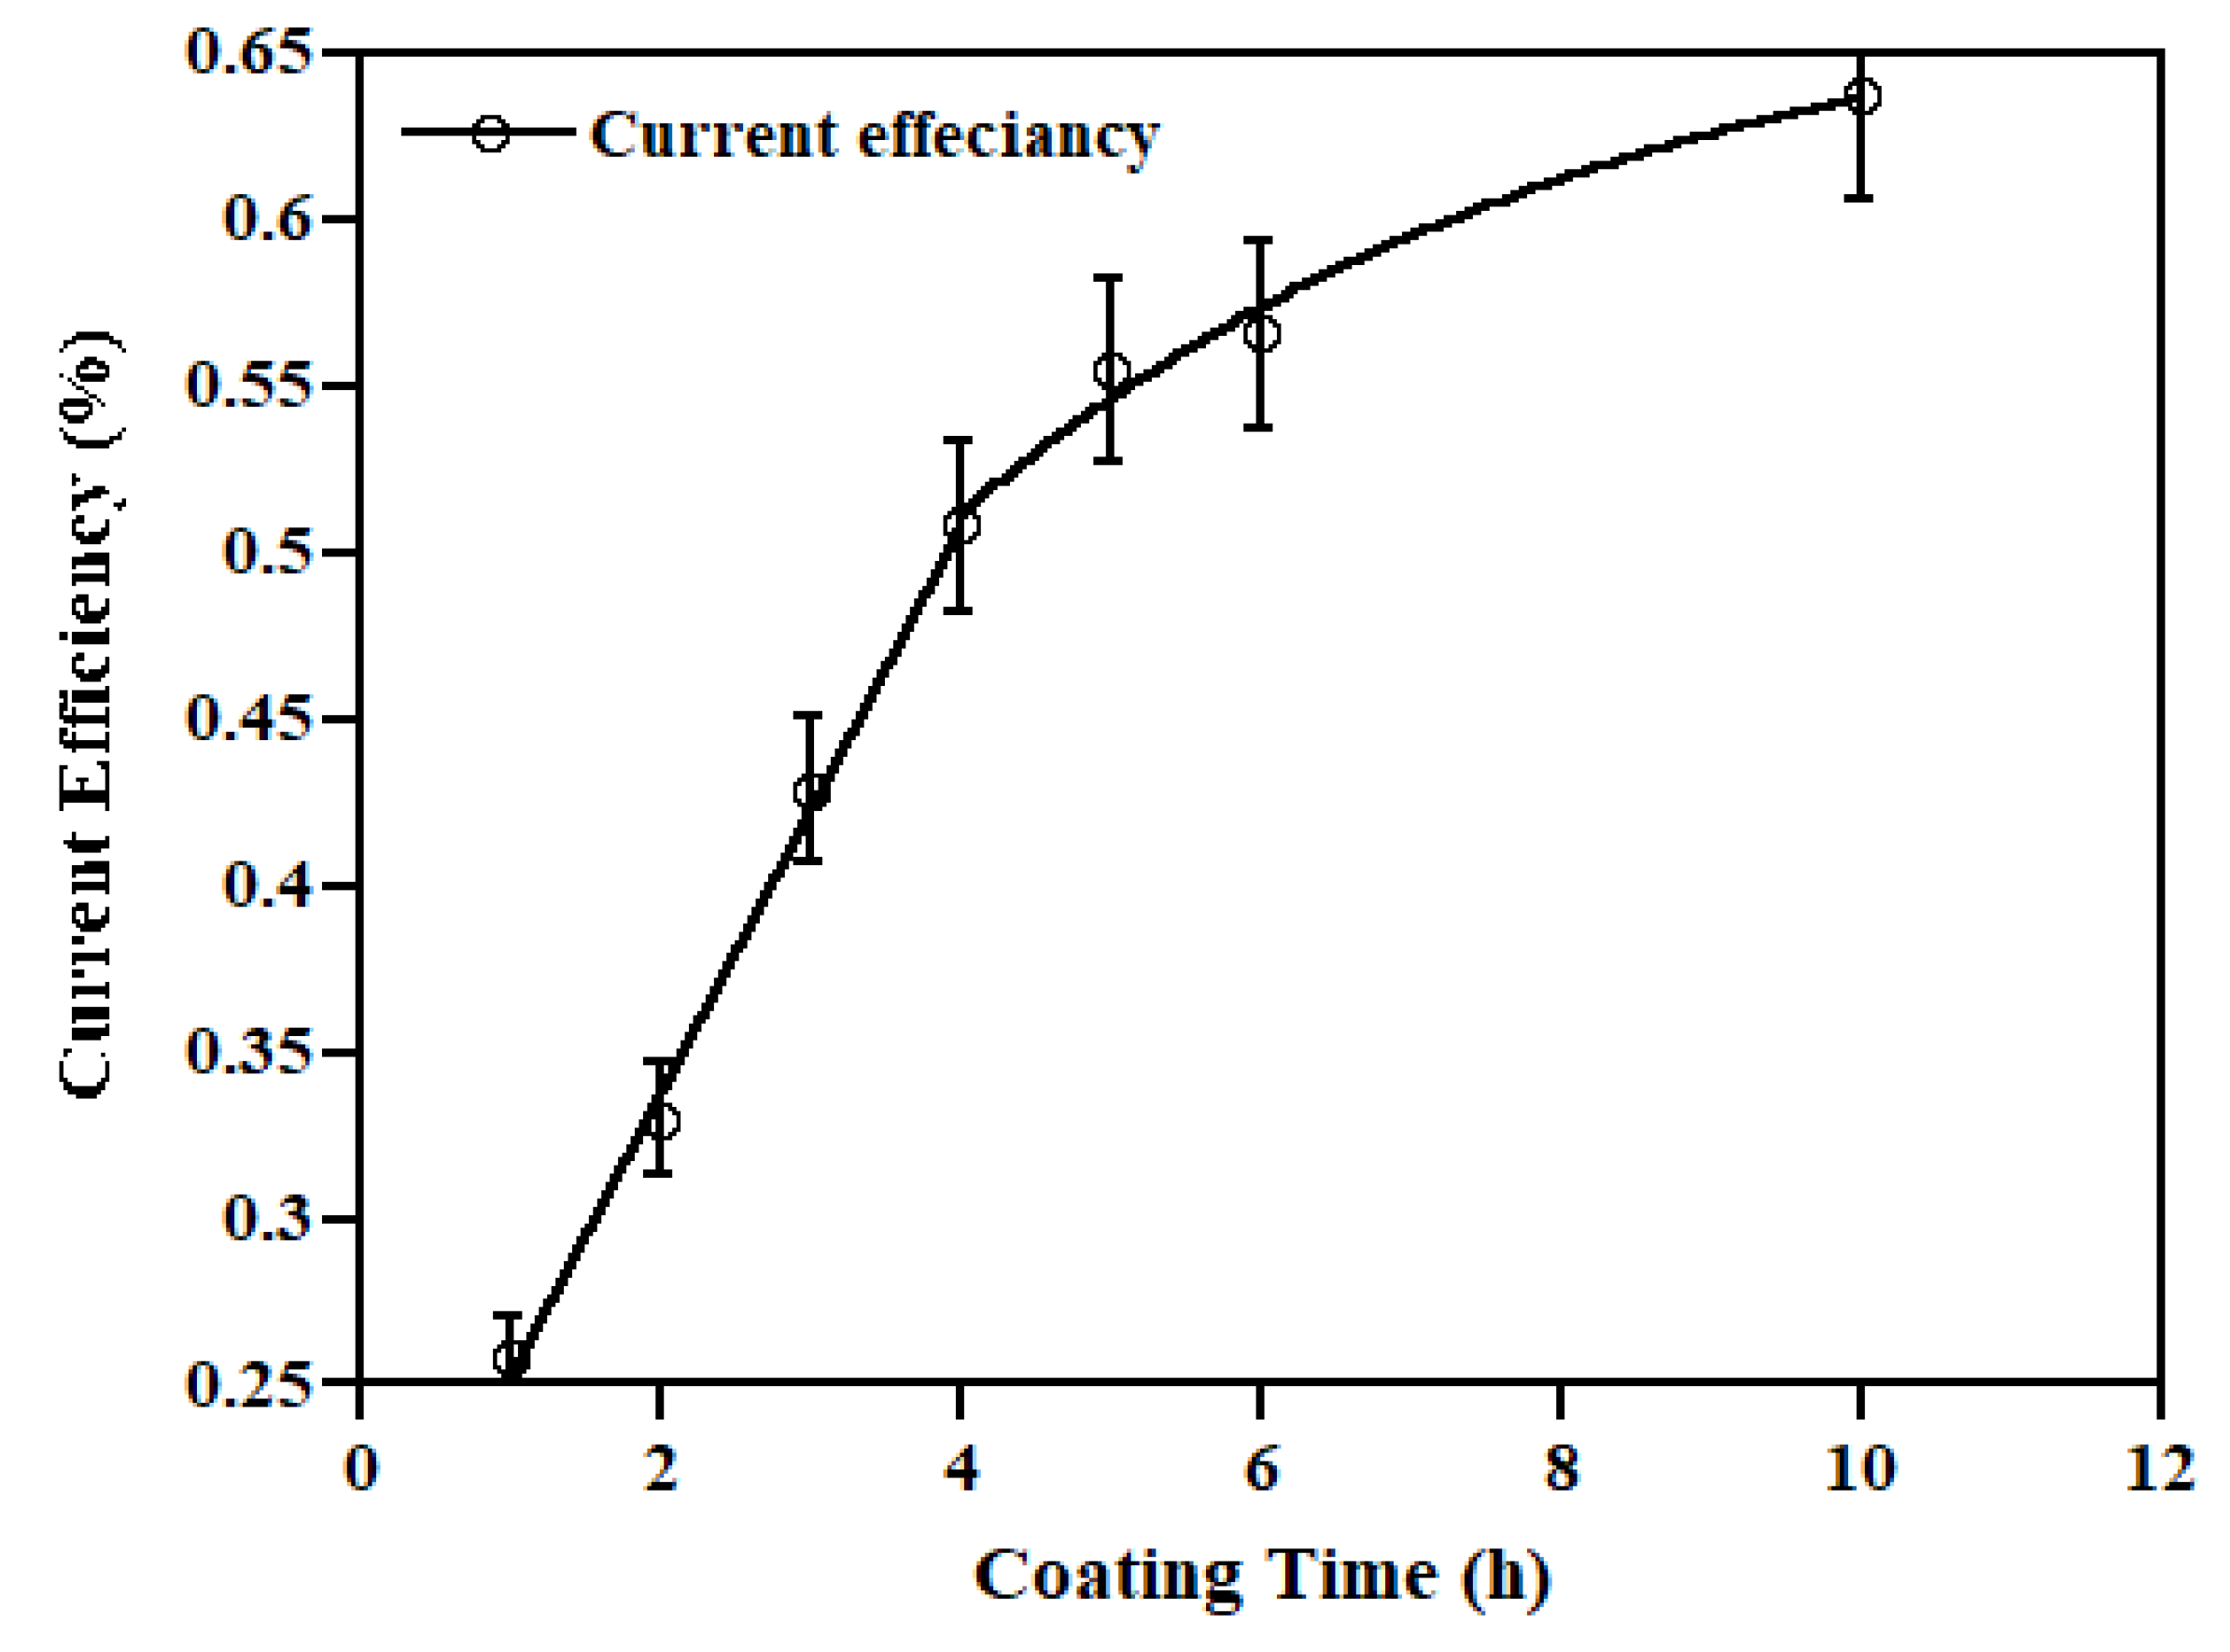
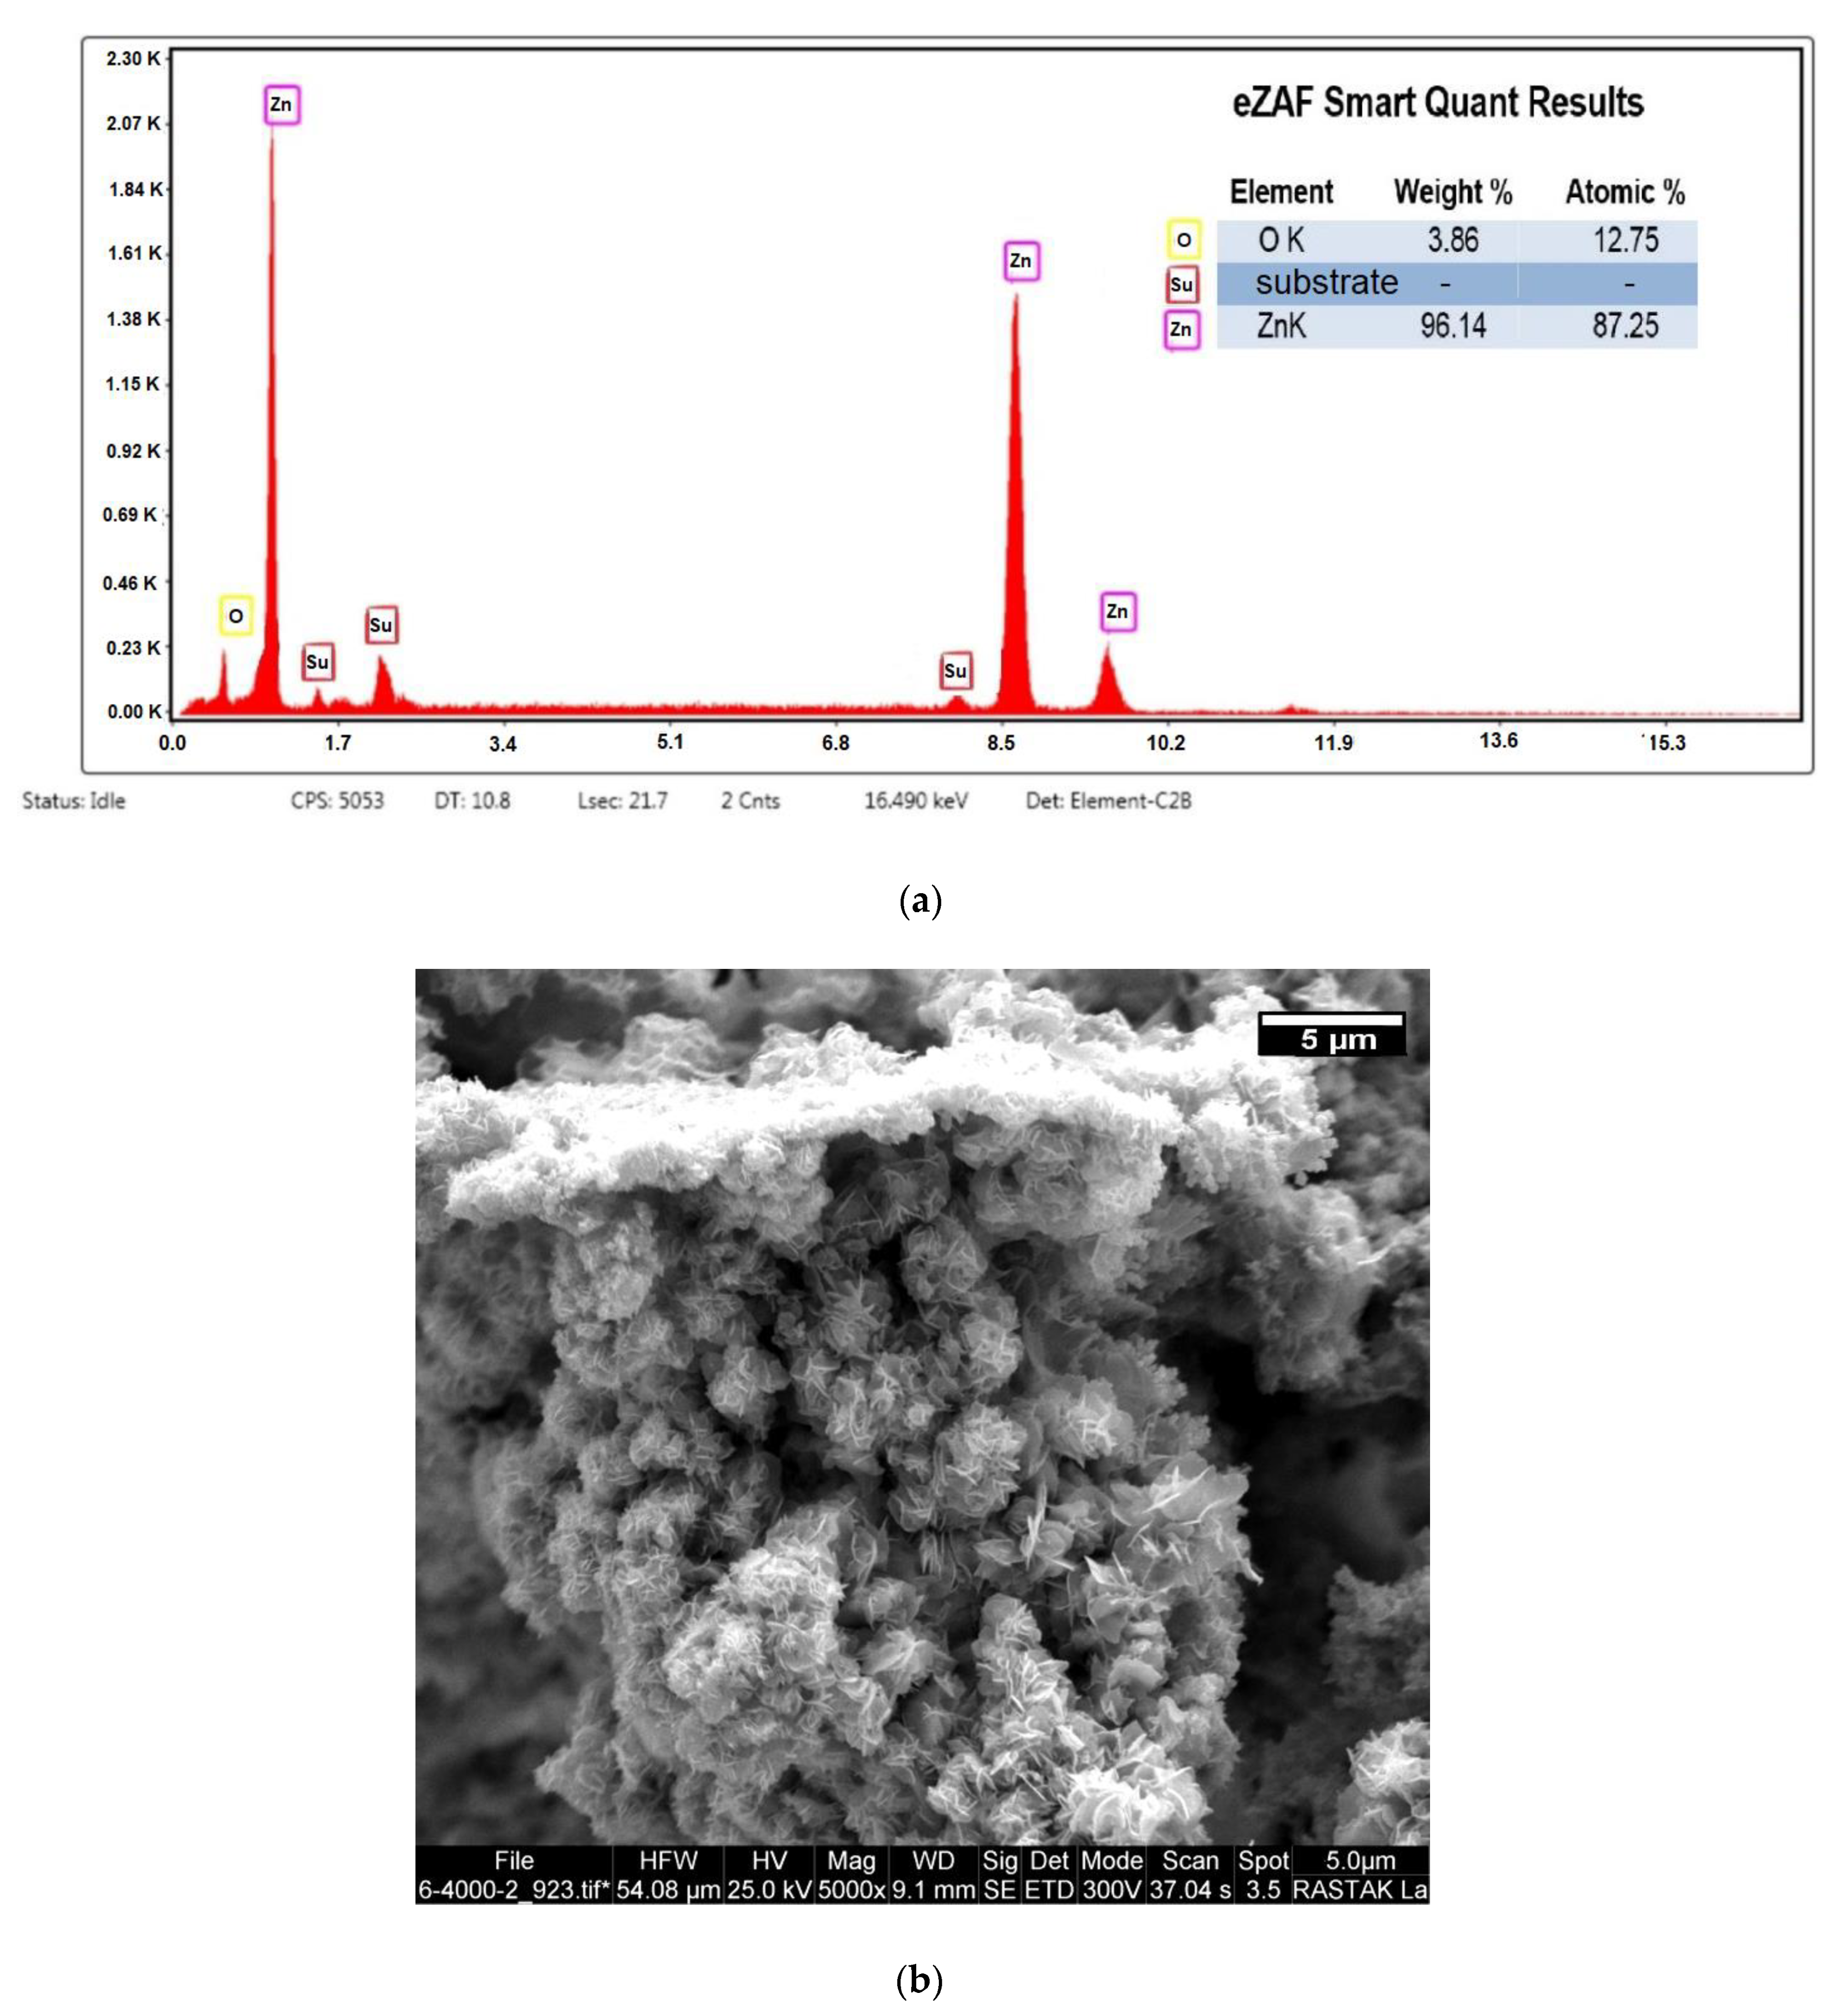
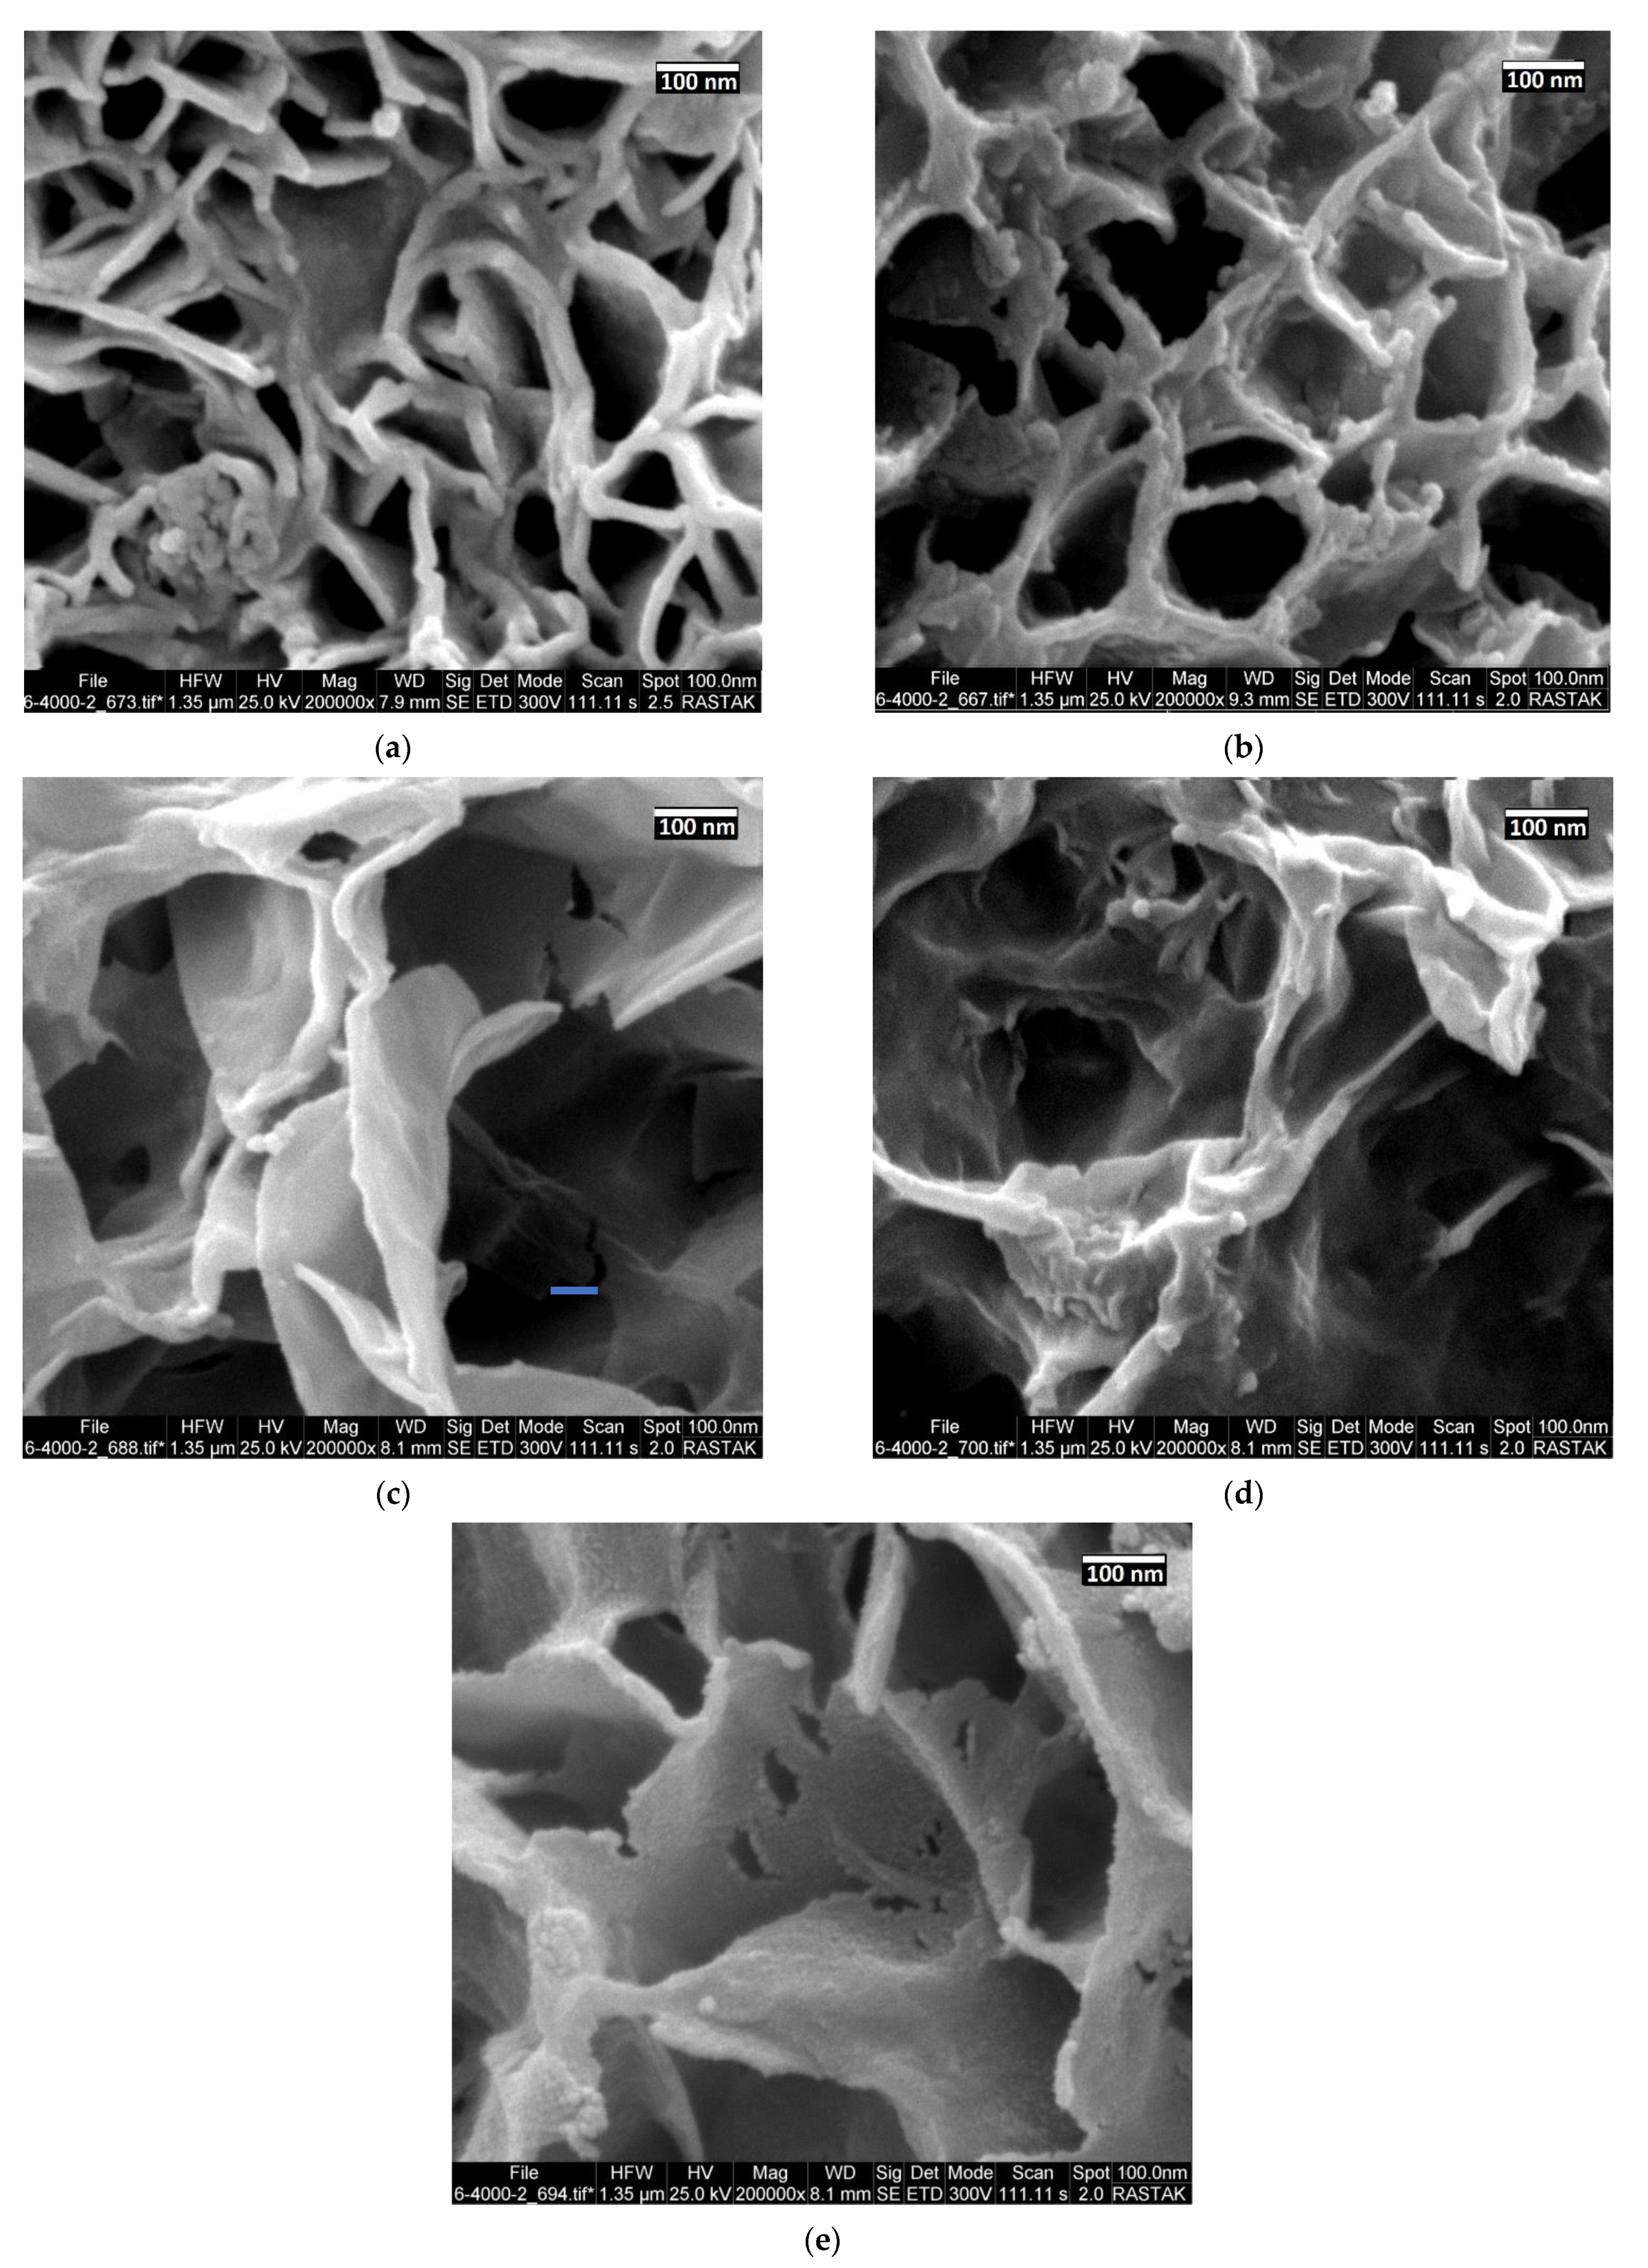
3.3. Zinc Coating Results
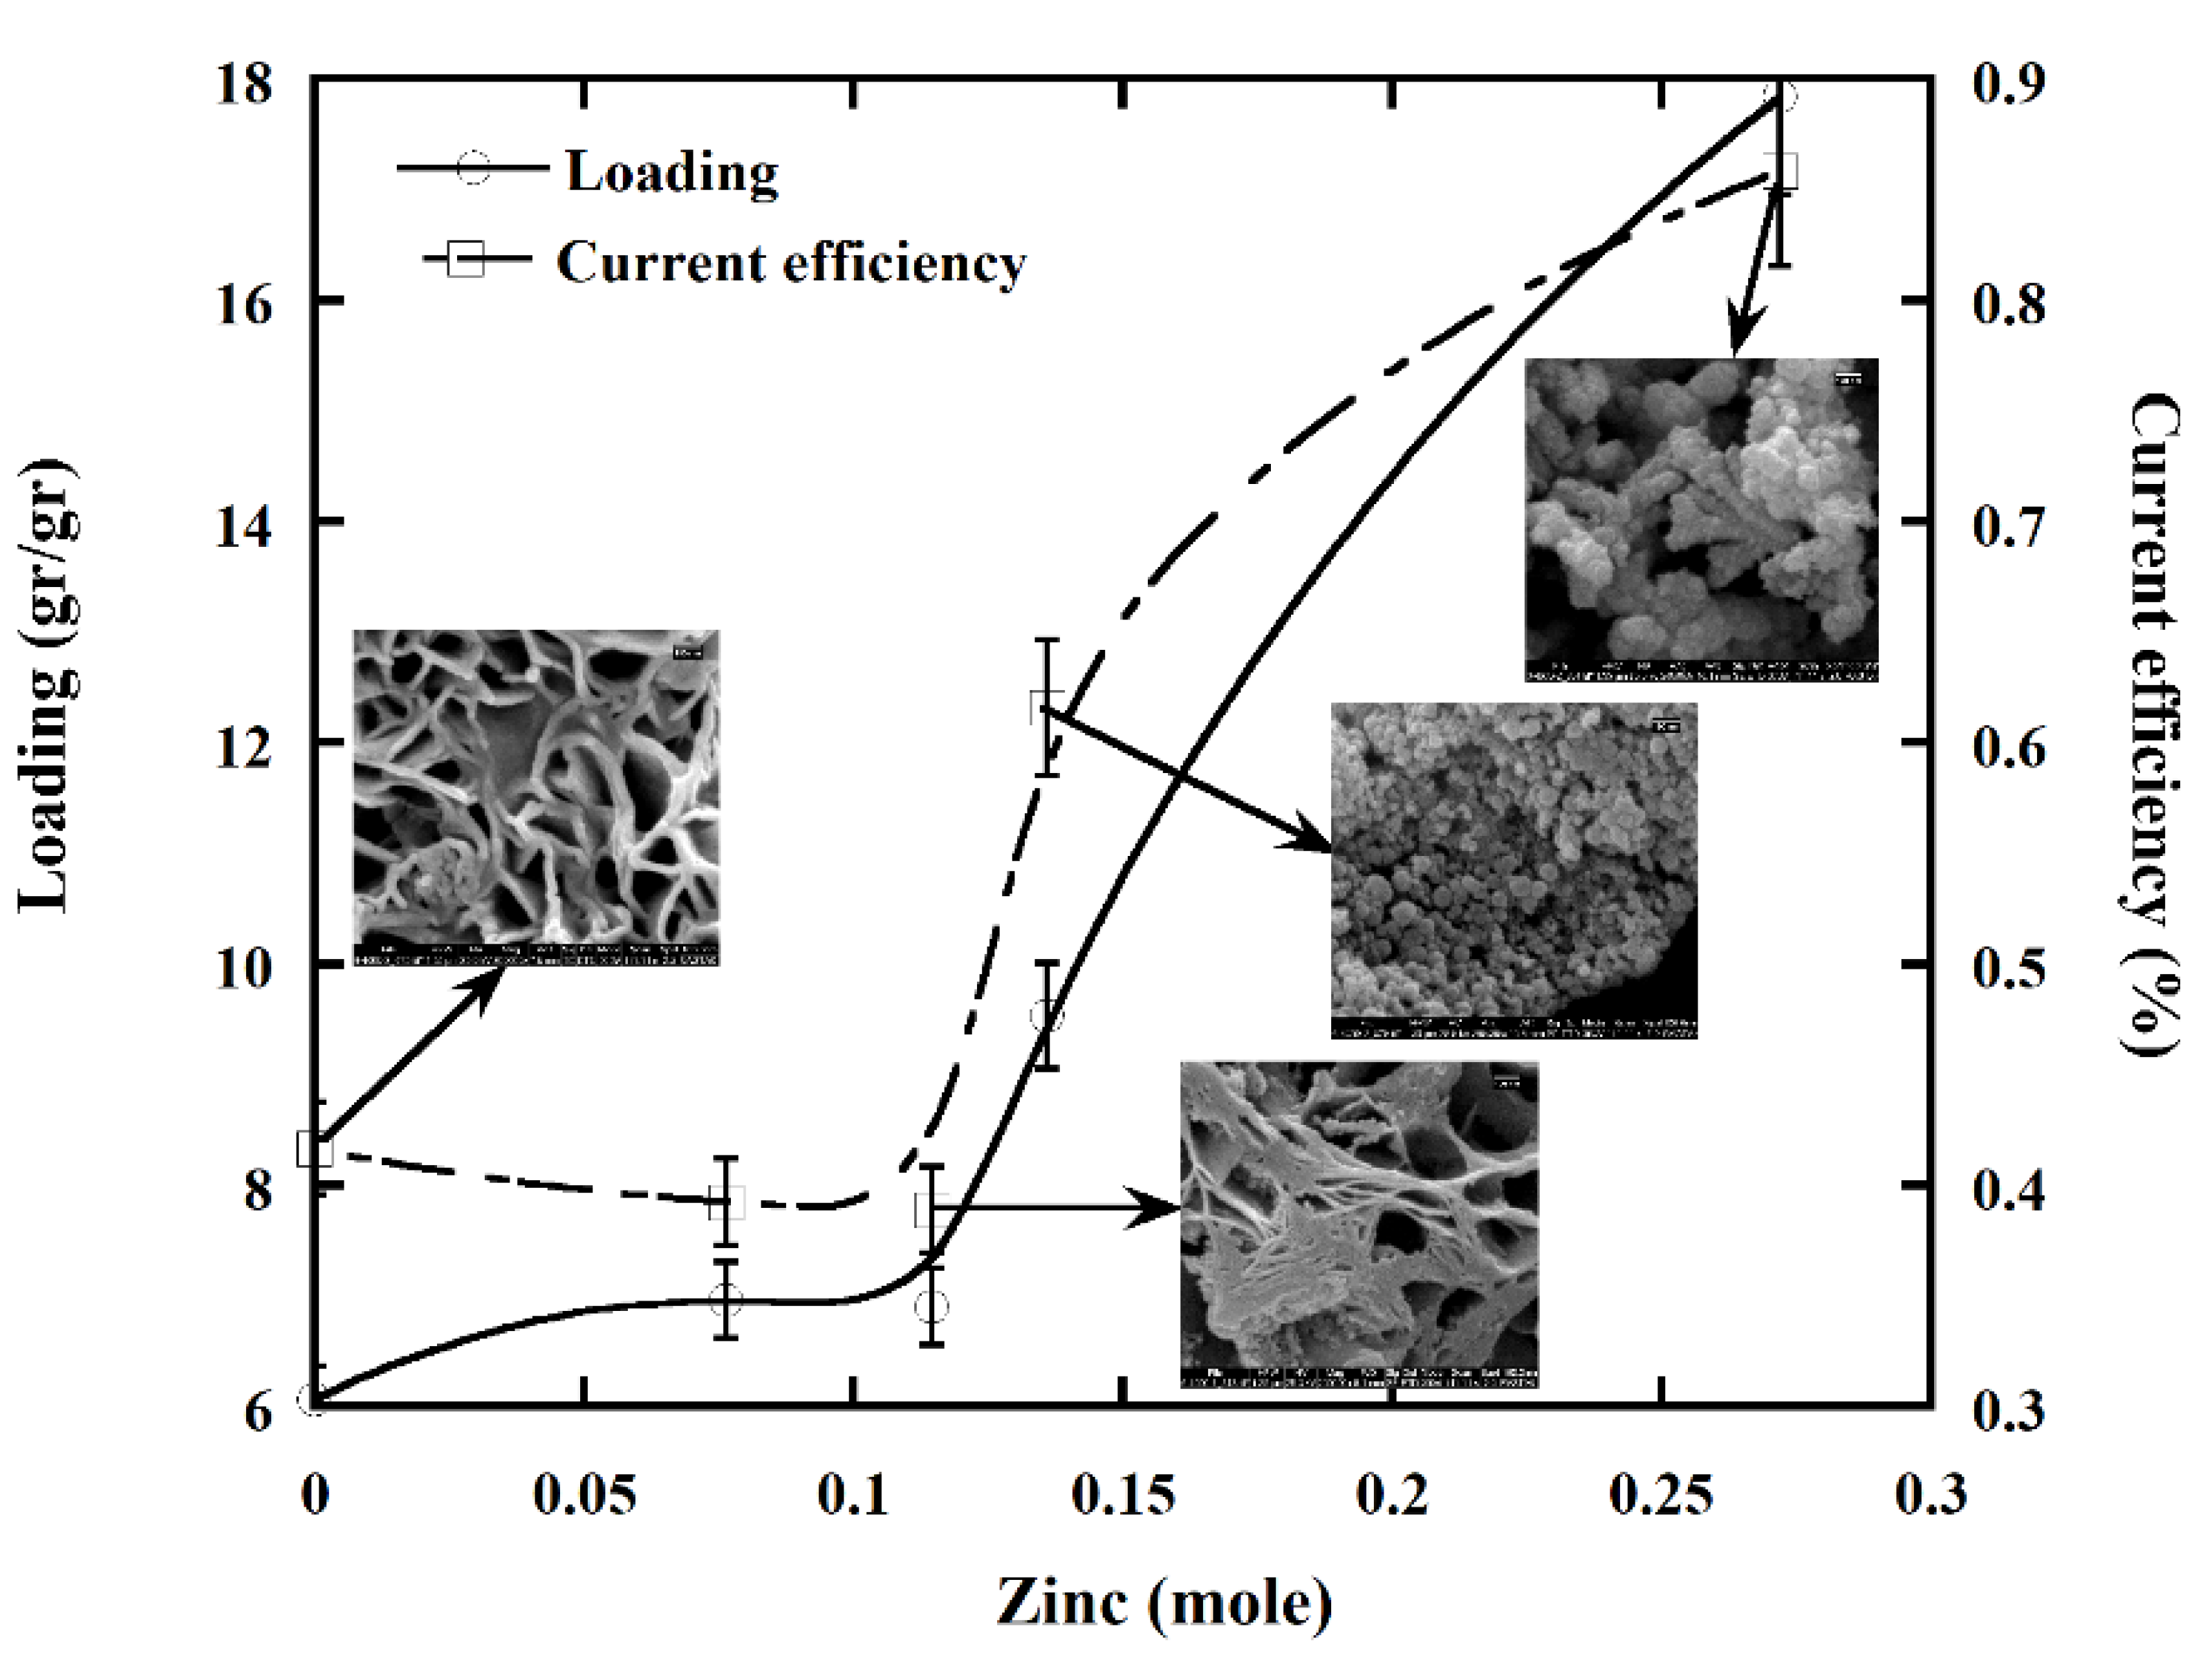
3.4. The Effect of Zinc in the Bath
4. Discussion
4.1. Graphite Particle Size Effect
4.2. Effect of Particle Size on Ink Conductivity
4.3. Zinc Coating Results
4.4. The Effect of Zinc in the Bath
5. Conclusions
Author Contributions
Funding
Data Availability Statement
Conflicts of Interest
References
- Chamoun, M.; Hertzberg, B.J.; Gupta, T.; Davies, D.; Bhadra, S.; Van Tassell, B.; Erdonmez, C.K.; Steingart, A.D. Hyper-dendritic nanoporous zinc foam anodes. NPG Asia Mater. 2015, 7, e178. [Google Scholar] [CrossRef]
- Drieschner, S.; Weber, M.; Wohlketzetter, J.; Vieten, J.; Makrygiannis, E.; Blaschke, B.M.; Morandi, V.; Colombo, L.; Bonaccorso, F.; Garrido, J.A. High surface area graphene foams by chemical vapor deposition. 2D Mater. 2016, 3, 45013. [Google Scholar] [CrossRef]
- Drillet, J.-F.; Adams, M.; Barg, H.A.; Koch, D.; Schmidt, V. Development of a novel Zinc/air fuel cell with a Zn foam anode, a PVA/KOH membrane and a MnO2/SiOC-based air cathode. ECS Trans. 2010, 28, 13. [Google Scholar] [CrossRef]
- Klabunde, K.J. Introduction to nanotechnology. Nanoscale Mater. Chem. 2001, 1–13. [Google Scholar] [CrossRef]
- Banhart, J.; Bellmann, D.; Clemens, H. Investigation of metal foam formation by microscopy and ultra small-angle neutron scattering. Acta Mater. 2001, 49, 3409–3420. [Google Scholar] [CrossRef]
- Queheillalt, D.T.; Hass, D.D.; Sypeck, D.J.; Wadley, H.N.G. Synthesis of open-cell metal foams by templated directed vapor deposition. J. Mater. Res. 2001, 16, 1028–1036. [Google Scholar] [CrossRef]
- Paserin, V.; Marcuson, S.; Shu, J.; Wilkinson, D.S. The chemical vapor deposition technique for Inco nickel foam pro-duction–manufacturing benefits and potential applications. Cell. Met. Met. Foam. Technol. 2003, 31. [Google Scholar]
- Yu, C.-J.; Eifert, H.H.; Banhart, J.; Baumeister, J. Metal foaming by a powder metallurgy method: Production, properties and applications. Mater. Res. Innov. 1998, 2, 181–188. [Google Scholar] [CrossRef]
- Ozan, S.; Bilhan, S. Effect of fabrication parameters on the pore concentration of the aluminum metal foam, manufactured by powder metallurgy process. Int. J. Adv. Manuf. Technol. 2008, 39, 257–260. [Google Scholar] [CrossRef]
- Neville, B.; Rabiei, A. Composite metal foams processed through powder metallurgy. Mater. Des. 2008, 29, 388–396. [Google Scholar] [CrossRef]
- Nagai, K.; Wada, D.; Nakai, M.; Norimatsu, T. Electrochemical Fabrication of Low Density Metal Foam with Mono-Dispersed-Sized Micro- and Submicro-Meter Pore. Fusion Sci. Technol. 2006, 49, 686–690. [Google Scholar] [CrossRef]
- Gibson, L.; Ashby, M. Cellular Solids; Cambridge University Press: Cambridge, UK, 1997. [Google Scholar]
- Banhart, J. Manufacture, characterisation and application of cellular metals and metal foams. Prog. Mater. Sci. 2001, 46, 559–632. [Google Scholar] [CrossRef]
- Kulshreshtha, A.; Dhakad, S. Preparation of metal foam by different methods: A review. Mater. Today Proc. 2020, 26, 1784–1790. [Google Scholar] [CrossRef]
- Kovacik, J.; Simancik, F. Comparison of inc and aluminium foam behaviour. Transl. Ve Riecansky 2004, 42, 79–90. [Google Scholar]
- Liu, P.; Fu, C.; Li, T.; Shi, C. Relationship between tensile strength and porosity for high porosity metals. Sci. China Technol. Sci. 1999, 42, 100–107. [Google Scholar] [CrossRef]
- Liu, P.; Liang, K. Preparation and corresponding structure of nickel foam. Mater. Sci. Technol. 2000, 16, 575–578. [Google Scholar] [CrossRef]
- Liu, P.; Liang, K.; Tu, S.; Gu, S.; Yu, Q.; Li, T.; Fu, C. Relationship between tensile strength and preparation conditions for nickel foam. Mater. Sci. Technol. 2001, 17, 1069–1072. [Google Scholar] [CrossRef]
- Liu, P.S. Effect of preparation conditions on relative elongation of nickel foam. Mater. Sci. Technol. 2004, 20, 669–672. [Google Scholar] [CrossRef]
- Zhang, X.G. Fibrous zinc anodes for high power batteries. J. Power Sources 2006, 163, 591–597. [Google Scholar] [CrossRef]
- Tian, Q.H.; Guo, X.Y.; Xue, P.; Song, Y.; Duan, L. Electro-Deposition for Foamed Zinc Material from Zinc Sulfate Solution. In Materials Science Forum; Trans Tech Publications Ltd.: Bäch, Switzerland, 2007; pp. 1669–1672. [Google Scholar]
- Gupta, T.; Kim, A.; Phadke, S.; Biswas, S.; Luong, T.; Hertzberg, B.J.; Chamoun, M.; Evans-Lutterodt, K.; Steingart, D.A. Improving the cycle life of a high-rate, high-potential aqueous dualion battery using hyper-dendritic Zinc and copper hexacyanoferrate. J. Power Sources 2016, 305, 22–29. [Google Scholar] [CrossRef]
- Wang, L.-P.; Li, N.-W.; Wang, T.-S.; Yin, Y.-X.; Guo, Y.-G.; Wang, C.-R. Conductive graphite fiber as a stable host for Zinc metal anodes. Electrochim. Acta 2017, 244, 172–177. [Google Scholar] [CrossRef]
- Moreno-García, P.; Schlegel, N.; Zanetti, A.; Cedeño López, A.; Gálvez-Vázquez, M.A.D.J.S.; Dutta, A. Selective elec-trochemical reduction of CO2 to CO on Zn-based foams produced by Cu2+ and template-assisted electrodeposition. ACS Appl. Mater. Interfaces 2018, 10, 31355–31365. [Google Scholar] [CrossRef]
- Quan, F.; Zhong, D.; Song, H.; Jia, F.; Zhang, L. A highly efficient zinc catalyst for selective electroreduction of carbon dioxide in aqueous NaCl solution. J. Mater. Chem. A 2015, 3, 16409–16413. [Google Scholar] [CrossRef]
- Low, Q.H.; Loo, N.W.X.; Calle-Vallejo, F.; Yeo, B.S. Enhanced Electroreduction of Carbon Dioxide to Methanol Using Zinc Dendrites Pulse-Deposited on Silver Foam. Angew. Chem. Int. Ed. 2019, 58, 2256–2260. [Google Scholar] [CrossRef] [PubMed]
- Stock, D.; Dongmo, S.; Miyazaki, K.; Abe, T.; Janek, J.; Schröder, D. Towards zinc-oxygen batteries with enhanced cycling stability: The benefit of anion-exchange ionomer for zinc sponge anodes. J. Power Sources 2018, 395, 195–204. [Google Scholar] [CrossRef]
- Li, C.; Shi, X.; Liang, S.; Ma, X.; Han, M.; Wu, X.; Zhou, J. Spatially homogeneous copper foam as surface dendrite-free host for zinc metal anode. Chem. Eng. J. 2019, 379, 122248. [Google Scholar] [CrossRef]
- Grisales, C.; Herrera, N.; Fajardo, F. Preparation of graphite conductive paint and its application to the construction of RC circuits on paper. Phys. Educ. 2016, 51, 055011. [Google Scholar] [CrossRef]
- Phillips, C.; Al-Ahmadi, A.; Potts, S.-J.; Claypole, T.; Deganello, D. The effect of graphite and carbon black ratios on conductive ink performance. J. Mater. Sci. 2017, 52, 9520–9530. [Google Scholar] [CrossRef]
- Ong, T.; Yang, H. Effect of atmosphere on the mechanical milling of natural graphite. Carbon 2000, 38, 2077–2085. [Google Scholar] [CrossRef]
- Caicedo, F.M.C.; López, E.V.; Agarwal, A.; Drozd, V.; Durygin, A.; Hernandez, A.F.; Wang, C. Synthesis of graphene oxide from graphite by ball milling. Diam. Relat. Mater. 2020, 109, 108064. [Google Scholar] [CrossRef]
- Kusumawati, D.H.; Nurhuda, M.; Santjojo, D.D.H.; Masruroh, M. Graphite Particle Reduction Process using High Energy Milling. In Proceedings of the International Conference on Science and Technology (ICST 2018), Bali, Indonesia, 18–19 October 2018. [Google Scholar]
- Chen, C.-N.; Chen, Y.-L.; Tseng, W.J. Surfactant-assisted de-agglomeration of graphite nanoparticles by wet ball mixing. J. Mater. Process. Technol. 2007, 190, 61–64. [Google Scholar] [CrossRef]
- Antisari, M.; Montone, A.; Jovic, N.; Piscopiello, E.; Alvani, C.; Pilloni, L. Low energy pure shear milling: A method for the preparation of graphite nano-sheets. Scr. Mater. 2006, 55, 1047–1050. [Google Scholar] [CrossRef]
- Alofi, A.; Srivastava, G.P. Thermal conductivity of graphene and graphite. Phys. Rev. B 2013, 87. [Google Scholar] [CrossRef]
- Zhao, W.; Fang, M.; Wu, F.; Wu, H.; Wang, L.; Chen, G. Preparation of graphene by exfoliation of graphite using wet ball milling. J. Mater. Chem. 2010, 20, 5817–5819. [Google Scholar] [CrossRef]
- Sun, Y.; Lu, J.; Zhuang, L. Rational determination of exchange current density for hydrogen electrode reactions at car-bon-supported Pt catalysts. Electrochim. Acta 2010, 55, 844–850. [Google Scholar] [CrossRef]
- Gavilán-Arriazu, E.M.; Mercer, M.P.; Pinto, O.A.; Oviedo, O.A.; Barraco, D.E.; Hoster, H.E.; Leiva, E.P.M. Effect of Temperature on The Kinetics of Electrochemical Insertion of Li-Ions into a Graphite Electrode Studied by Kinetic Monte Carlo. J. Electrochem. Soc. 2019, 167, 013533. [Google Scholar] [CrossRef]
- Hosoi, T.; Yonekura, T.; Sunada, K.; Sasaki, K. Exchange Current Density of SOFC Electrodes: Theoretical Relations and Partial Pressure Dependencies Rate-Determined by Electrochemical Reactions. J. Electrochem. Soc. 2014, 162, F136–F152. [Google Scholar] [CrossRef]
- Teeratananon, M. Current Distribution Analysis of Electroplating Reactors and Mathematical Modeling of the Electroplated Zinc-Nickel Alloy. Ph.D. Thesis, National Polytechnic Institute of Toulouse, Toulouse, France, 2004. [Google Scholar]


| Test No. | Current Density A/cm2 | Na2SO4 gr/L | Acetic Acid Vol. Percent | Coating Time H | Zinc Acetate Mol | Bath Vol. L | Description |
|---|---|---|---|---|---|---|---|
| 1 | 0.2 | 25 | 10% | 1 | 0 | 0.4 | Coating time |
| 2 | 0.2 | 25 | 10% | 2 | 0 | 0.4 | Coating time |
| 3 | 0.2 | 25 | 10% | 3 | 0 | 0.4 | Coating time |
| 4 | 0.2 | 25 | 10% | 4 | 0 | 0.4 | Coating time |
| 5 | 0.2 | 25 | 10% | 5 | 0 | 0.4 | Coating time |
| 6 | 0.2 | 25 | 10% | 6 | 0 | 0.4 | Coating time |
| 7 | 0.2 | 25 | 10% | 10 | 0 | 0.4 | Coating time |
| 8 | 0.2 | 25 | 10% | 3 | 0.076 | 0.4 | Zinc effect |
| 9 | 0.2 | 25 | 10% | 3 | 0.115 | 0.4 | Zinc effect |
| 10 | 0.2 | 25 | 10% | 3 | 0.136 | 0.4 | Zinc effect |
| 11 | 0.2 | 25 | 10% | 3 | 0.272 | 0.4 | Zinc effect |
Publisher’s Note: MDPI stays neutral with regard to jurisdictional claims in published maps and institutional affiliations. |
© 2022 by the authors. Licensee MDPI, Basel, Switzerland. This article is an open access article distributed under the terms and conditions of the Creative Commons Attribution (CC BY) license (https://creativecommons.org/licenses/by/4.0/).
Share and Cite
Salimi, M.; Mousavi Khoiee, S.M.; Keshavarz Alamdari, E.; Rezaei, M.; Karbasi, M. Nano Porous Zinc Synthesis on Soft Polyurethane Foam Using Conductive Ink and Electroplating Method. Metals 2022, 12, 1945. https://doi.org/10.3390/met12111945
Salimi M, Mousavi Khoiee SM, Keshavarz Alamdari E, Rezaei M, Karbasi M. Nano Porous Zinc Synthesis on Soft Polyurethane Foam Using Conductive Ink and Electroplating Method. Metals. 2022; 12(11):1945. https://doi.org/10.3390/met12111945
Chicago/Turabian StyleSalimi, Mehdi, Seyed Mohammad Mousavi Khoiee, Eskandar Keshavarz Alamdari, Milad Rezaei, and Maryam Karbasi. 2022. "Nano Porous Zinc Synthesis on Soft Polyurethane Foam Using Conductive Ink and Electroplating Method" Metals 12, no. 11: 1945. https://doi.org/10.3390/met12111945
APA StyleSalimi, M., Mousavi Khoiee, S. M., Keshavarz Alamdari, E., Rezaei, M., & Karbasi, M. (2022). Nano Porous Zinc Synthesis on Soft Polyurethane Foam Using Conductive Ink and Electroplating Method. Metals, 12(11), 1945. https://doi.org/10.3390/met12111945