
The Formation and Disintegration of Rafts from Different Aluminas and Fines


Abstract
:1. Introduction
2. Methods and Materials
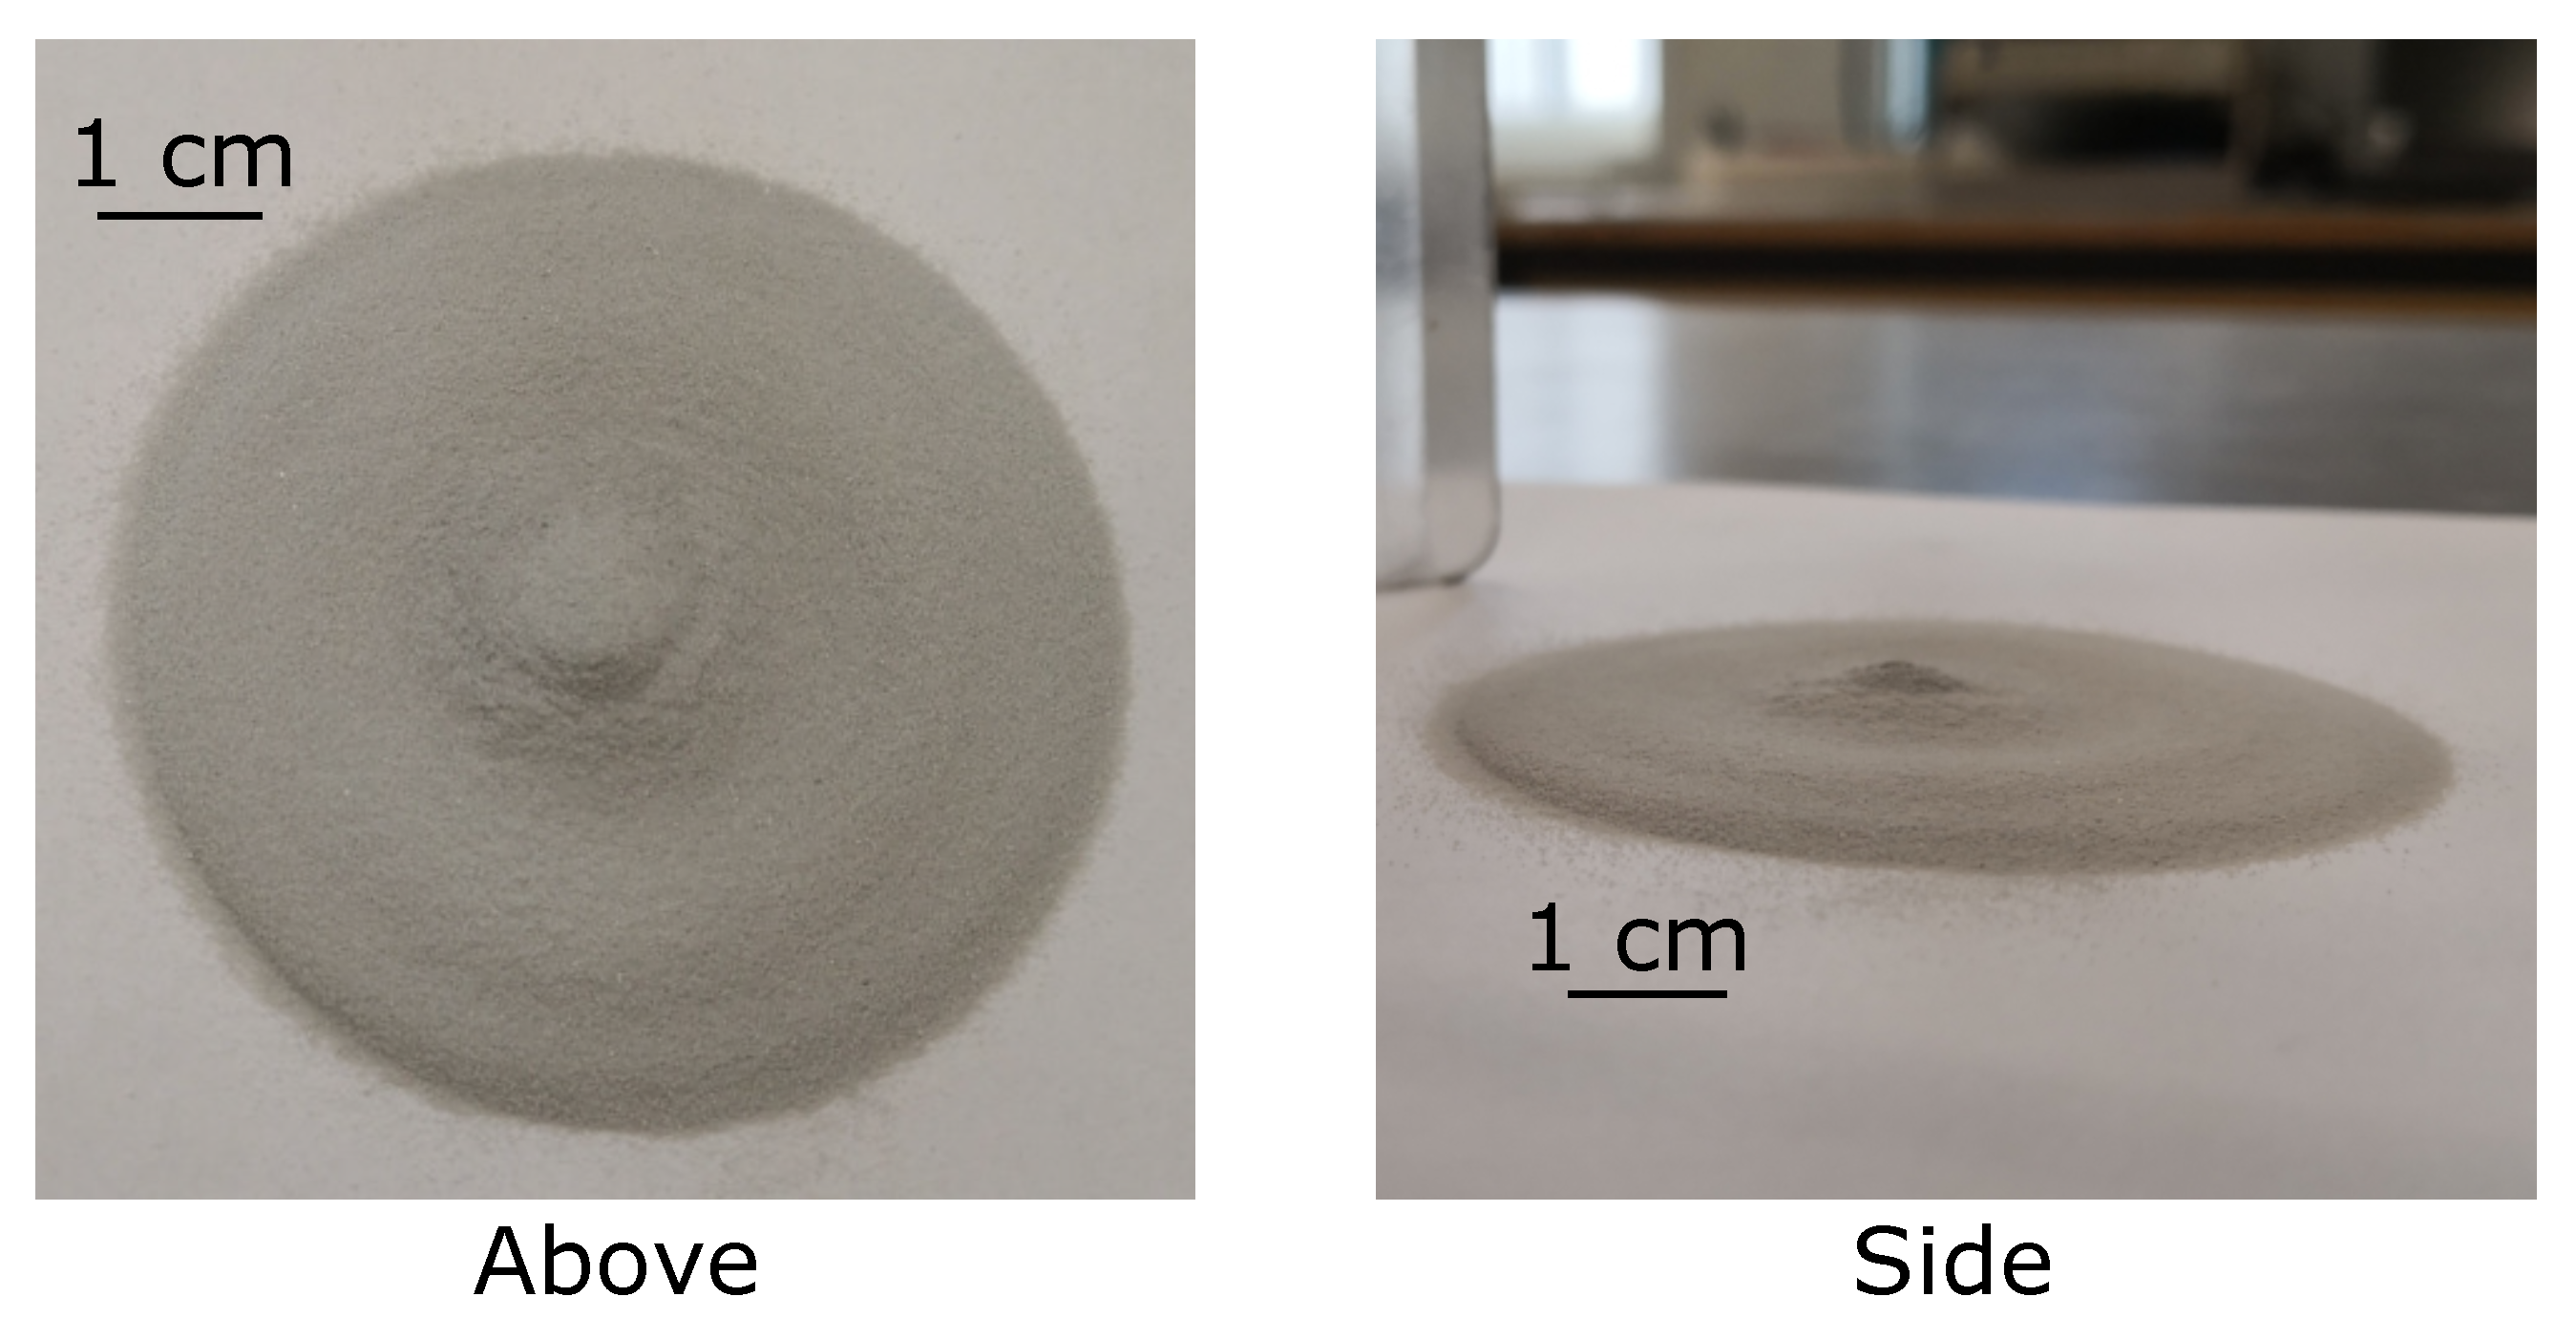
2.1. Materials
2.2. Setup
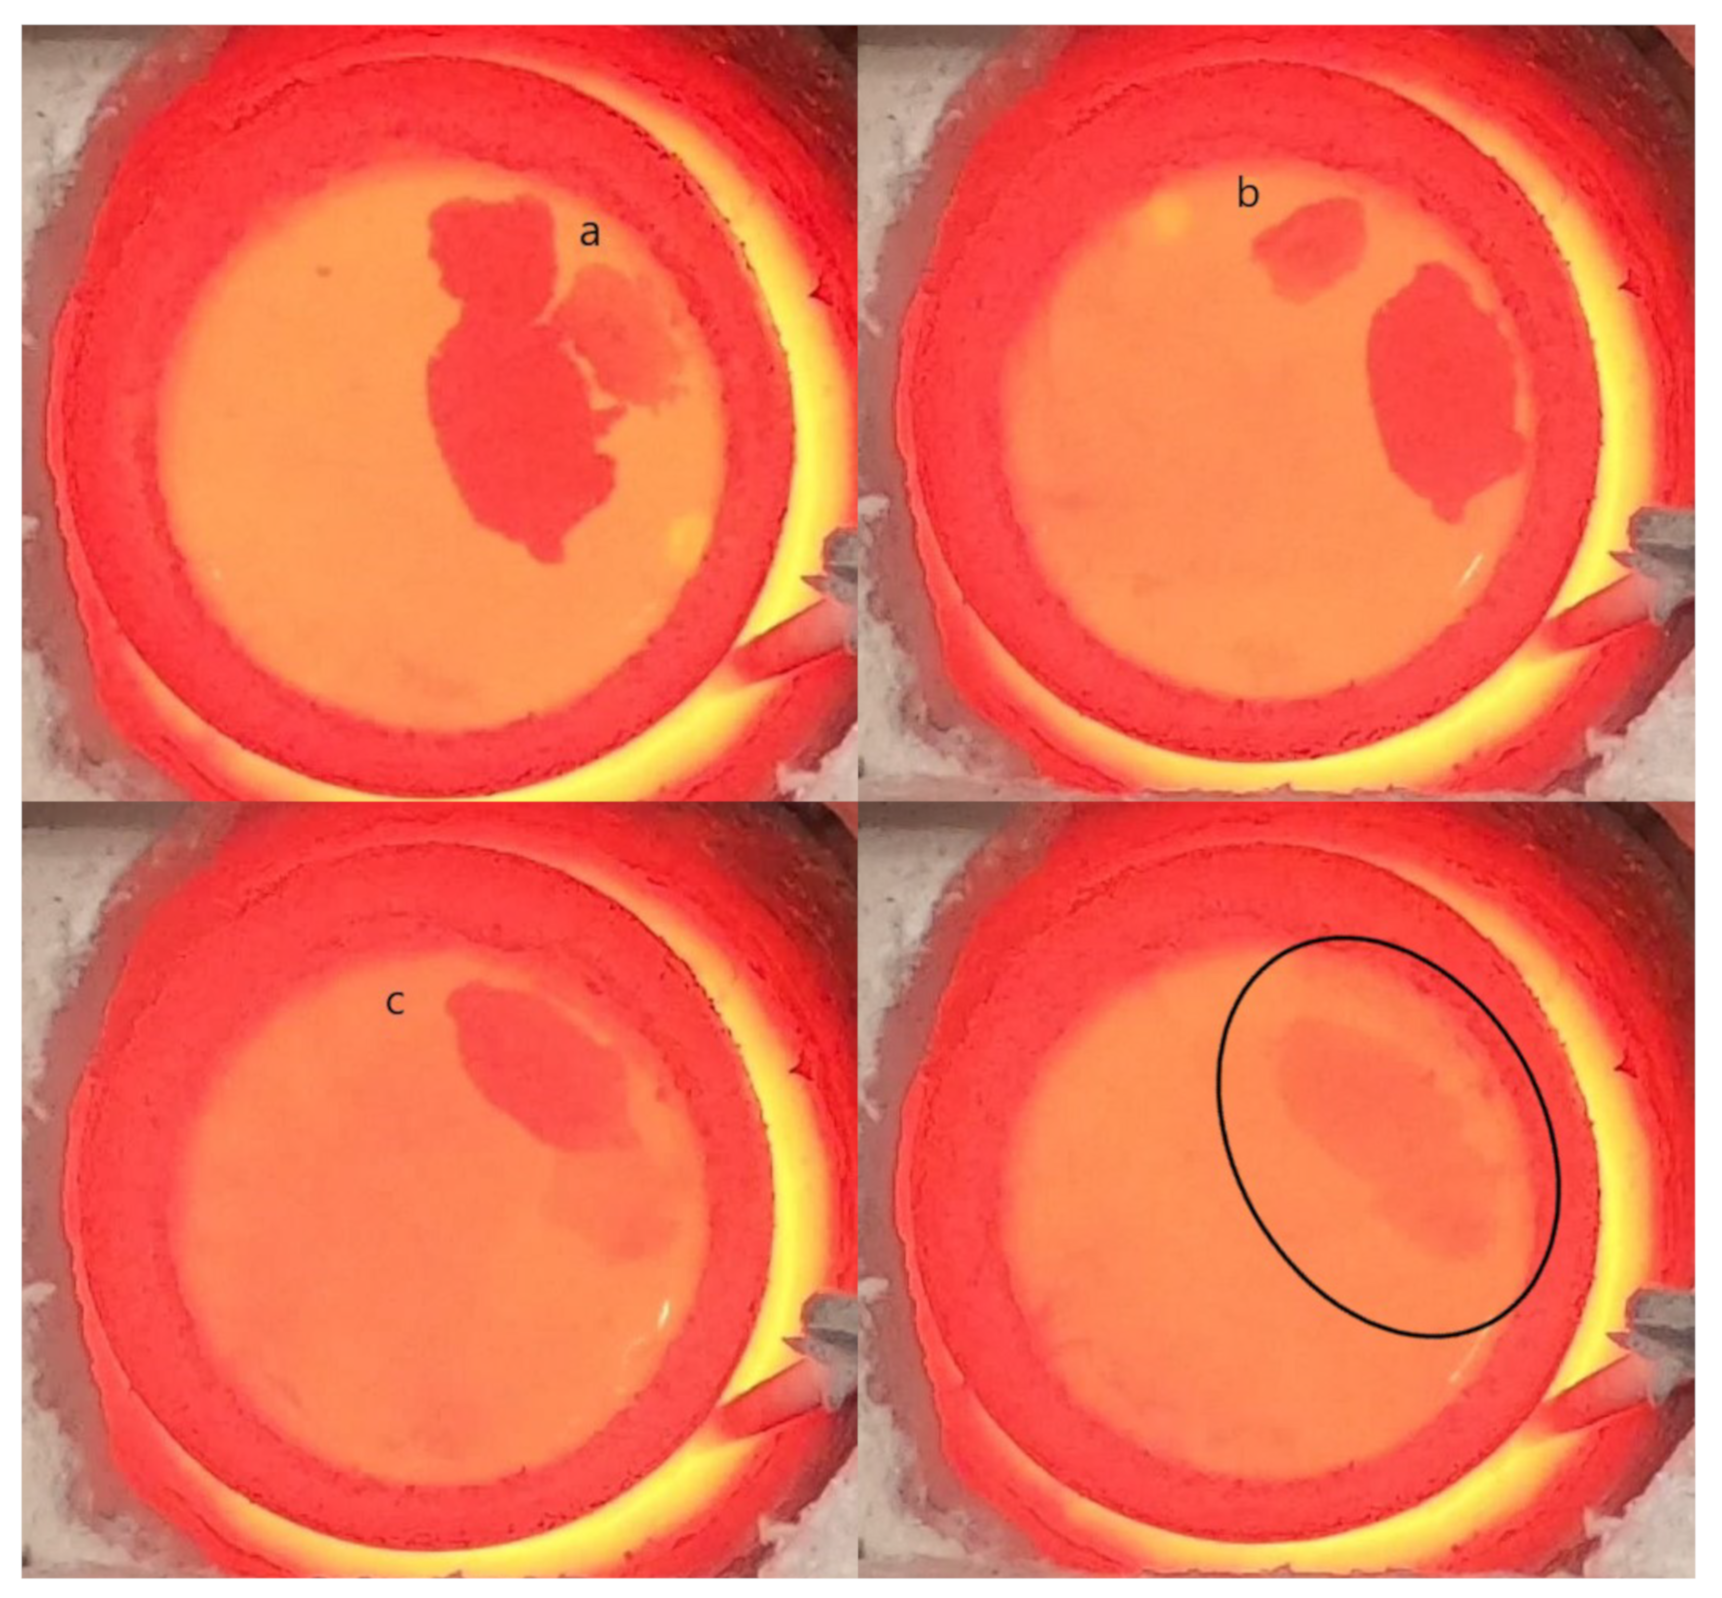
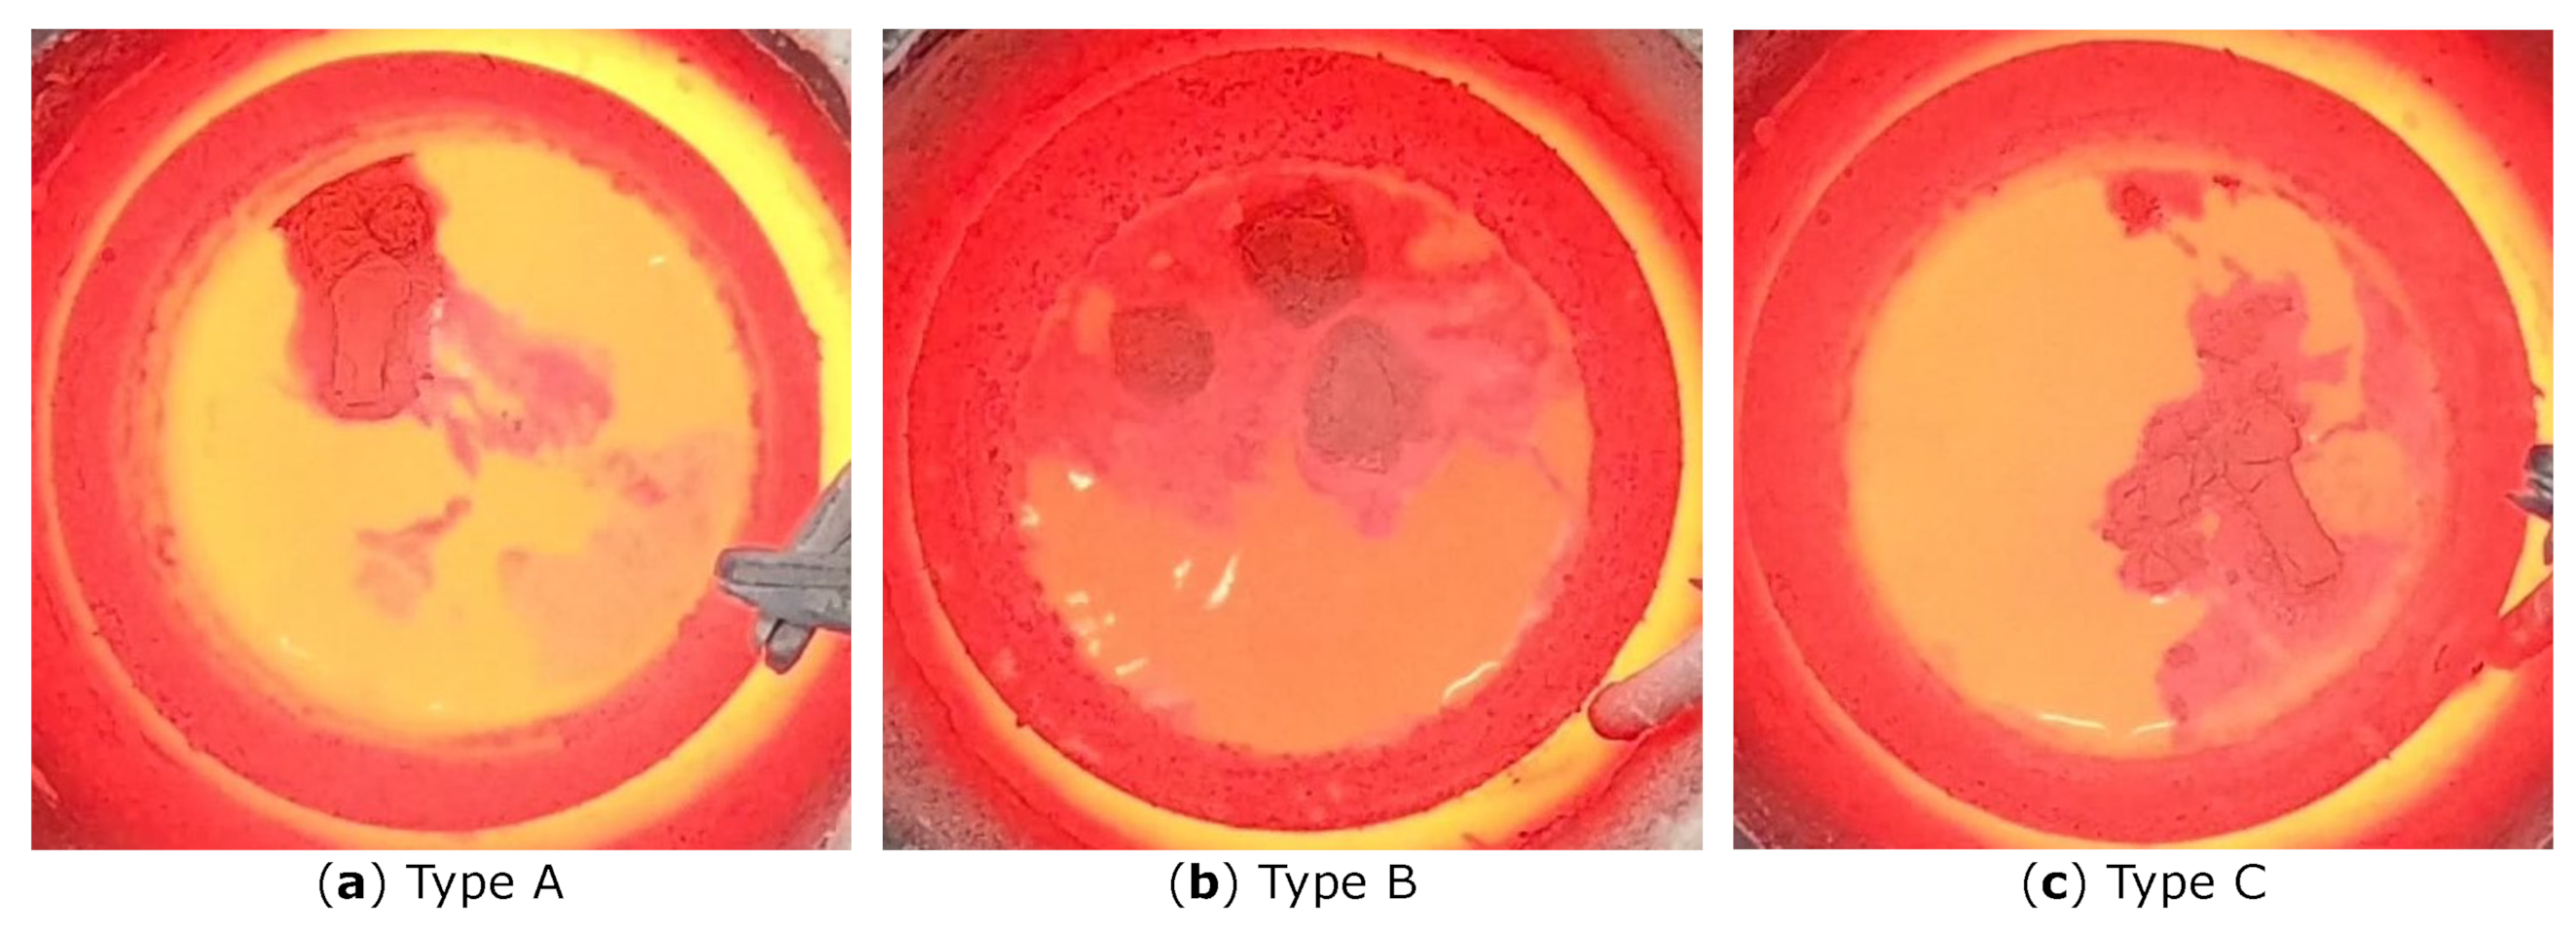
3. Results
4. Discussion
5. Conclusions and Further Work
Author Contributions
Funding
Data Availability Statement
Acknowledgments
Conflicts of Interest
References
- Lavoie, P.; Taylor, M.P.; Metson, J.B. A Review of Alumina Feeding and Dissolution Factors in Aluminum Reduction Cells. Metall. Mater. Trans. 2016, 47, 2690–2696. [Google Scholar] [CrossRef]
- Gylver, S.E.; Omdahl, N.H.; Prytz, A.K.; Meyer, A.J.; Lossius, L.P.; Einarsrud, K.E. Alumina Feeding and Raft Formation: Raft Collection and Process Parameters. In Light Metals 2019; The Minerals Metals & Materials Series; Chesonis, C., Ed.; Springer: Cham, Switzerland, 2019; pp. 659–666. [Google Scholar] [CrossRef]
- Gylver, S.E.; Omdahl, N.H.; Rørvik, S.; Hansen, I.; Nautnes, A.; Neverdal, S.N.; Einarsrud, K.E. The Micro- and Macrostructure of Alumina Rafts. In Light Metals 2019; The Minerals Metals & Materials Series; Chesonis, C., Ed.; Springer: Cham, Switzerland, 2019; pp. 689–696. [Google Scholar] [CrossRef]
- Walker, D.I.; Utigard, T.; Taylor, M.P. Alumina agglomerates in aluminum smelters. In Light Metals 1995; Evans, J.W., Ed.; TMS: Warrendale, PA, USA, 1995; pp. 425–434. [Google Scholar]
- Kuschel, G.I.; Welch, B.J. Further Studies of Alumina Dissolution under Conditions Similar to Cell Operation. In Essential Readings in Light Metals: Volume 2 Aluminum Reduction Technology; Bearne, G., Dupuis, M., Tarcy, G., Eds.; Springer: Cham, Switzerland, 2016; pp. 112–118. [Google Scholar] [CrossRef]
- Kuschel, G.I.; Welch, B.J. Effect of Alumina Properties and Operation of Smelting Cells on the Dissolution Behavior of Alumina. In Proceedings of the Second International Alumina Quality Workshop, Perth, Australia, 14–19 October 1990; pp. 58–70. [Google Scholar]
- Bagshaw, A.N.; Welch, B.J. The Influence of Alumina Properties on its Dissolution in Smelting Electrolyte. In Essential Readings in Light Metals: Volume 1 Alumina and Bauxite; Donaldson, D., Raahauge, B.E., Eds.; Springer: Cham, Switzerland, 2016; pp. 783–787. [Google Scholar] [CrossRef]
- Yang, Y.; Gao, B.; Hu, X.; Wang, Z.; Shi, Z. Influence of LOI on Alumina Dissolution in Molten Aluminum Electrolyte. In Molten Salts Chemistry and Technology; John Wiley & Sons, Ltd.: Hoboken, NJ, USA, 2014; pp. 77–83. [Google Scholar] [CrossRef]
- Lindsay, S.J. Key Physical Properties of Smelter Grade Alumina. In Light Metals 2014; Grandfield, J., Ed.; Wiley: Hoboken, NJ, USA, 2014; pp. 597–601. [Google Scholar] [CrossRef]
- Alarie, J.; Kiss, L.I.; Dion, L.; Truchon, M.; Santerre, R.; Guérard, S.; Bilodeau, J.F. Empirical Prediction of Alumina Dissolution Rate in a Cryolitic Melt: Comparison with the Existing Literature. In Light Metals 2022; The Minerals Metals & Materials Series; Eskin, D., Ed.; Springer: Cham, Switzerland, 2022; pp. 349–356. [Google Scholar] [CrossRef]
- Alarie, J.; Kiss, L.I.; Poncsák, S.; Santerre, R.; Guérard, S.; Bilodeau, J.F. Influence of Additives on Alumina Dissolution in Superheated Cryolite Melts. In Light Metals 2021; The Minerals Metals & Materials Series; Perander, L., Ed.; Springer: Cham, Switzerland, 2021; pp. 533–540. [Google Scholar] [CrossRef]
- Isaeva, L.A.; Braslavskii, A.B.; Polyakov, P.V. Effect of the content of the α-phase and granulometric composition on the dissolution rate of alumina in cryolite-alumina melts. Russ. J. -Non-Ferr. Met. 2009, 50, 600–605. [Google Scholar] [CrossRef]
- Jain, R.K.; Tricklebank, S.; Welch, B.J.; Williams, D.J. Interaction of Aluminas with Aluminum Smelting Electrolytes. In Light Metals 1983; Adkins, E.M., Ed.; The Metallurgical Society of AIME: Wilkes-Barre, PA, USA, 1983; pp. 609–622. [Google Scholar]
- Gerlach, J.; Hennig, U.; Kern, K. The dissolution of aluminum oxide in cryolite melts. Metall. Mater. Trans. 1975, 6, 83–86. [Google Scholar] [CrossRef]
- Gylver, S.E.; Solheim, A.; Gudbrandsen, H.; Follo, Å.H.; Einarsrud, K.E. Lab Scale Experiments on Alumina Raft Formation. In Light Metals 2020; The Minerals Metals & Materials Series; Tomsett, A., Ed.; Springer: Cham, Switzerland, 2020; pp. 659–663. [Google Scholar] [CrossRef]
- Gylver, S.E.; Follo, Å.H.; Aulie, V.; Granlund, H.M.; Sørhuus, A.; Sandnes, E.; Einarsrud, K.E. On Gaseous Emissions During Alumina Feeding. In Light Metals 2021; The Minerals Metals & Materials Series; Perander, L., Ed.; Springer: Cham, Switzerland, 2021; pp. 504–510. [Google Scholar] [CrossRef]
- Kheiri, M.; Hennig, U.; Kammel, R. Krustenbildung und Krustenigenschaften beim Einsatz sekundärer Aluminiumoxide für die Aluminium-Reduktionselektrolyse. Metall 1989, 43, 858–862. [Google Scholar]
- Kaszás, C. Behaviour of Alumina Powder Fed into Molten Electrolytic Bath. Ph.D. Thesis, Université du Québec à Chicoutimi, Chicoutimi, QC, Canada, 2020. [Google Scholar]
- Yang, Y.; Gao, B.; Wang, Z.; Shi, Z.; Hu, X. Mechanism of Dissolution Behavior of the Secondary Alumina. Metall. Mater. Trans. B Process. Metall. Mater. Process. Sci. 2013, 44, 1296–1303. [Google Scholar] [CrossRef]
- Bracamonte, L.; Einarsrud, K.E.; Rosenkilde, C.; Sandnes, E. Oxide Sensor Measurements and Simultaneous Optical Observations During Dissolution of Alumina in Cryolite Melt. In Light Metals 2022; The Minerals Metals & Materials Series; Eskin, D., Ed.; Springer: Cham, Switzerland, 2022; pp. 381–391. [Google Scholar] [CrossRef]
- Yang, Y.; Gao, B.; Wang, Z.; Shi, Z.; Hu, X.; Yu, J. Dispersion Caused by Carbon Dioxide During Secondary Alumina Dissolution: A Lab-Scale Research. Metall. Mater. Trans. B 2014, 45, 1150–1156. [Google Scholar] [CrossRef]
- Kaszás, C.; Kiss, L.; Poncsák, S.; Guérard, S.; Bilodeau, J.F. Spreading of Alumina and Raft Formation on the Surface of Cryolitic Bath. In Light Metals 2017; The Minerals Metals & Materials Series; Ratvik, A.P., Ed.; Springer: Cham, Switzerland, 2017; pp. 473–478. [Google Scholar] [CrossRef]
- Bracamonte, L. Development of an Electrochemical Sensor for Alumina Concentration Measurements and Dissolution Characteristics of Alumina in Cryolite Melt. Ph.D. Thesis, Norwegian University of Science and Technology, Trondheim, Norway, 2022. [Google Scholar]
- Solheim, A.; Rolseth, S.; Skybakmoen, E.; Støen, L.; Sterten, Å.; Støre, T. Liquidus temperatures for primary crystallization of cryolite in molten salt systems of interest for aluminum electrolysis. Metall. Mater. Trans. B 1996, 27, 739–744. [Google Scholar] [CrossRef]
- Skybakmoen, E.; Solheim, A.; Sterten, Å. Alumina solubility in molten salt systems of interest for aluminum electrolysis and related phase diagram data. Metall. Mater. Trans. B 1997, 28, 81–86. [Google Scholar] [CrossRef]
- Schneider, C.A.; Rasband, W.S.; Eliceiri, K.W. NIH Image to ImageJ: 25 years of image analysis. Nat. Methods 2012, 9, 671–675. [Google Scholar] [CrossRef] [PubMed]


| Alumina Type | LOI (1000 °C) [%] | MOI (300 °C) [%] | BET Surface [m2/g] | Alumina [%] | Alumina [%] |
|---|---|---|---|---|---|
| A bulk | 1.86 | 1.5 | 73.9 | 1.2 | 39.7 |
| B bulk | 2.11 | 2.65 | 65 | 2.5 | 37.2 |
| C bulk | 2.33 | 1.7 | 69.8 | 1.8 | 38.1 |
| A fines | 4.54 | 1.84 | 55.2 | 4.5 | 35 |
| B fines | 5.59 | 2.33 | 43.8 | 9.3 | 30.4 |
| C fines | 5.03 | 1.36 | 52.4 | 7.4 | 32 |
| Alumina | F | C | S | Na | P | Ca | Fe |
|---|---|---|---|---|---|---|---|
| A bulk | 1.2 | 0.22 | 0.32 | 0.5634 | 0.0017 | 0.0129 | 0.0127 |
| B bulk | 1.75 | 0.24 | 0.24 | 0.5389 | 0.0021 | 0.018 | 0.0194 |
| C bulk | 1.96 | 0.26 | 0.21 | 0.5089 | 0.0023 | 0.0086 | 0.0123 |
| A fines | 4.69 | 1.74 | 0.23 | 1.6868 | 0.0174 | 0.1105 | 0.1065 |
| B fines | 5.21 | 2.52 | 0.23 | 1.6568 | 0.0125 | 0.0883 | 0.0845 |
| C fines | 4.55 | 2.04 | 0.26 | 1.367 | 0.0107 | 0.0548 | 0.0661 |
| Bath Chemistry | |
|---|---|
| Bath acidity [wt%] | 10.6 |
| CaF [wt%] | 5.34 |
| AlO [wt%] | 3.82 |
| Bath Properties | |
| Superheat | 13.5 |
| Liquidus temperature [°C] [24] | 956.5 |
| Bath temperature [°C] | 970 |
| AlO solubility limit [wt%] [25] | 8.62 |
| Batch | Type | Mass Loss Rate [g/min] | 95% Confidence Interval |
|---|---|---|---|
| Bulk | A | −0.42 | [−2.04, 1.21] |
| B | −1.57 | [−2.64, −0.50] | |
| C | −1.44 | [−2.61, −0.28] | |
| Fines | A | −0.06 | [−1.32, 1.21] |
| B | −0.94 | [−1.41, −0.48] | |
| C | −1.15 | [−2.04, −0.27] |
| Type | Batch | Initial Dissolution Rate [%/s] |
|---|---|---|
| A | Bulk | −0.38 |
| Fines | −0.08 | |
| B | Bulk | −0.54 |
| Fines | −0.13 | |
| C | Bulk | −0.57 |
| Fines | −0.09 |
Publisher’s Note: MDPI stays neutral with regard to jurisdictional claims in published maps and institutional affiliations. |
© 2022 by the authors. Licensee MDPI, Basel, Switzerland. This article is an open access article distributed under the terms and conditions of the Creative Commons Attribution (CC BY) license (https://creativecommons.org/licenses/by/4.0/).
Share and Cite
Gylver, S.E.; Bekkevoll, S.; Rørvik, S.; Einarsrud, K.E. The Formation and Disintegration of Rafts from Different Aluminas and Fines. Metals 2022, 12, 1876. https://doi.org/10.3390/met12111876
Gylver SE, Bekkevoll S, Rørvik S, Einarsrud KE. The Formation and Disintegration of Rafts from Different Aluminas and Fines. Metals. 2022; 12(11):1876. https://doi.org/10.3390/met12111876
Chicago/Turabian StyleGylver, Sindre Engzelius, Simen Bekkevoll, Stein Rørvik, and Kristian Etienne Einarsrud. 2022. "The Formation and Disintegration of Rafts from Different Aluminas and Fines" Metals 12, no. 11: 1876. https://doi.org/10.3390/met12111876
APA StyleGylver, S. E., Bekkevoll, S., Rørvik, S., & Einarsrud, K. E. (2022). The Formation and Disintegration of Rafts from Different Aluminas and Fines. Metals, 12(11), 1876. https://doi.org/10.3390/met12111876