Article

Deformation Mechanism Investigation on Low Density 18Mn Steels under Different Solid Solution Treatments

1
School of Materials Science and Engineering, Shanghai University, Shanghai 200044, China
2
College of International Vocational Education, Shanghai Polytechnic University, Shanghai 201209, China
3
Ansteel Group Co., Anshan 114021, China
4
Ansteel Group Beijing Research Institute, Beijing 102211, China
*
Authors to whom correspondence should be addressed.
Metals 2021, 11(9), 1497; https://doi.org/10.3390/met11091497
Submission received: 24 August 2021 / Revised: 11 September 2021 / Accepted: 16 September 2021 / Published: 21 September 2021
(This article belongs to the Special Issue Strengthening Mechanisms of Metals and Alloys)

Abstract

:
To meet the demand of the 10% weight reduction goal for automotive steel, the microstructure and mechanical properties of Fe-18Mn-Al-C steel with different carbon and aluminum contents were investigated under different solid solution treatments, and the deformation mechanisms of the experimental steels were elucidated. Aided by thermodynamic calculation, transmission electron microscopy (TEM) and in situ scanning electron microscope (SEM) analysis, it was shown that for the 18Mn-1.5Al experimental steel with about 20 mJ/m2 stacking fault energy (SFE), the twinning-induced plasticity (TWIP) effect always dominated in this steel after different solid solution treatments under tensile deformation. With the 7 wt% aluminum addition, the SFE of austenite was affected by temperature and the range of SFE was between 60 and 65 mJ/m2. The existence of δ-ferrite obviously inhibited the TWIP effect. With the increase in the solution treatment temperature, δ-ferrite gradually transformed into the austenite, and the n-value remained low and stable in a large strain range, which were caused by the local hardening during the tensile deformation. Due to the difference in the deformability of the austenite and δ-ferrite structure as well as the inconsistent extension of the slip band, the micro-cracks were easily initiated in the 18Mn-7Al experimental steel; then, it exhibited lower plasticity.

1. Introduction

With the increasing requirements for environmental protection and energy conservation, the global automotive light-weighting process is rapidly accelerating. Advanced high-strength steel (AHSS) is extensively used in automotive manufacturing. Twinning-induced plasticity (TWIP) steel is an ideal steel grade, due to its ultra-high product of strength and elongation (PSE) [1]. However, for some key automotive parts, the required rigidity is not achieved when the structure is thinned. Therefore, recent work has focused on low density high-manganese steel with an aluminum content of above 7 wt%. Compared with the traditional high-strength steel, this could increase the specific PSE by 10–20% [2,3].
Many studies [4,5,6] showed that the effect of aluminum content on the deformation mechanism of the steel is complicated, which might be determined by the stacking fault energy (SFE). Generally, the transformation-induced plasticity (TRIP) effect happens during the tensile deformation for steel with a SFE lower than 20 mJ/m2. When the SFE was between 20 mJ/m2 and 45 mJ/m2, the TWIP effect dominated. The shear band induced plasticity (SBIP) effect and microband induced plasticity (MBIP) effect were found in the steel when the SFE was greater than 45 mJ/m2. For the lightweight, high-manganese steel with a composition of Fe-22Mn-(0,3,6)Al-0.6C [7], the SFE of the steel was found to increase from 21.5 mJ /m2 to 50.7 mJ/m2 with the increase in the aluminum content. Then, the PSE of steel decreased, resulting from the replacement of the twinning induced plasticity effect by the dislocation plane sliding mechanism. For the Fe-20Mn-9Al-0.6C steel with SFE of about 70 mJ/m2 [8], it was shown that, with the solid solution temperature increase from 800 °C to 1100 °C, the lower tensile strength and the higher elongation were still found when the plane slip mechanism dominated. With the increase of alloy element contents, the SFE of steels with compositions Fe-28Mn-9Al-0.8C [9] and Fe-28Mn-10Al-1.2C [10] increased to 85 mJ/m2 and 110 mJ/m2, respectively. Under the effect of SBIP and MBIP, the elongation of these steel could exceed 60%, or even as higher as 100%. However, the steel was not applicable for the manufacture automotive parts because of the insufficient strength and excessive plasticity. Moreover, the excessive addition of manganese, aluminum and carbon caused difficulties in the industrial production. Recently, the Fe-18Mn-0.6C-1.5Al steel with above 900 MPa tensile strength and 50% elongation was developed to be manufactured as automotive anti-collision beams [11,12,13]. However, it was clear that the 1.5 wt% Al content could not meet the demand of the 10% weight reduction goal for the automotive steel.
In the present work, the microstructure and mechanical property of Fe-18Mn-Al-0.7C with different aluminum content under different solution treatment processes were comparatively studied. The microstructure evolution of the steel under different deformation stage was also studied by in situ analysis in order to elucidate the deformation mechanism, which would be in favor to the further study of low density high-manganese automotive steel.

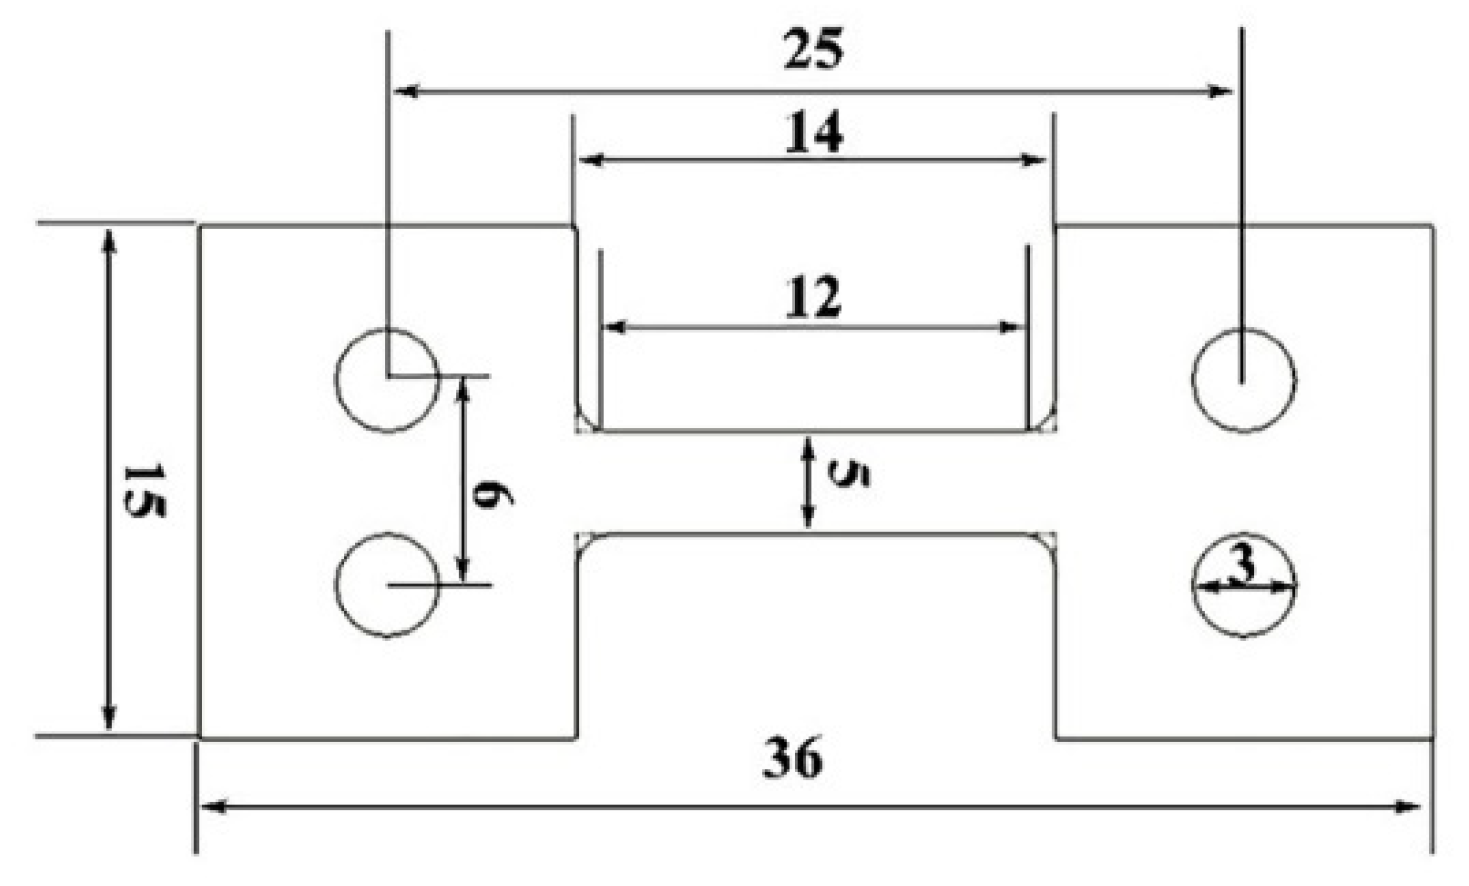
2. Experimental Materials and Methods

The chemical compositions of experimental steels are shown in Table 1. Ingots were prepared by purity raw material and vacuum induction melting at 10−1 Pa vacuum value. Slabs were hot-rolled after reheating at 1150 °C to produce a 3.8 mm-thick sheet. The hot-rolled steel plates were then pickled and cold rolled to a 53 pct reduction. The solid solution treatments for the specimens were processed at the temperatures of 650, 750, 800, 850, 900, and 1050 °C for 6 min, respectively.
The uniaxial tensile test was conducted with the standard specimen (according to the GB/T228.1-2010 standard, gauge length 50 mm, width 12.5 mm, thickness 1.8 mm), of which the tensile direction was parallel to the rolling direction. The tests were performed by the MTS C45.305E electron mechanical universal testing machine (MTS Systems Corp., Eden Prairie, MN, USA) with a strain rate of about 1 × 10⁻³ S−1 at room temperature. An extensometer was used to measure the strain of the gauge length of the samples. The experimental results were determined by the average value of three tensile samples. Microstructures of the samples etched with 10% nitric acid and 90% methanol were observed by means of optical microscope (OM) and scanning electron microscope (SEM) analyses.
The samples for transmission electron microscopy (TEM) were sliced from bulk specimens and mechanically polished to about 50 μm-thick discs with a diameter of 3 mm. Electrolytic polishing was conducted, using 10 vol% perchloric acid in ethanol at −35 °C in a Struers Tenupol-5 twin-jet electrolytic polisher (Struers (Shanghai) Ltd., Shanghai, China). Then, the samples analysis was performed in a JEM-2010F microscope (JEOL Ltd., Tokyo, Japan) with an accelerated voltage of 200 kV. The phase analysis of the experimental steel was performed in a D/max-2550 X-ray diffractometer with Cu–Kα radiation (Rigaku Corp., Tokyo, Japan). Scanning was carried out with a 0.02° step and 3 s stay for each step over a 2θ range from 40° to 100°. A thermal field emission scanning electron microscope (Apollo 300, Obducat CamScan Ltd., Cambridge, UK) equipped with a 2 kN tensile test bench was used for in situ observation analysis. The tensile stress direction was parallel to the original rolling direction of the sample. The accelerated voltage was 20 kV, and the stretching rate was 0.1 mm/min. The dimensions of tensile samples with 0.8 mm thickness are shown in Figure 1.

3. Experimental Results

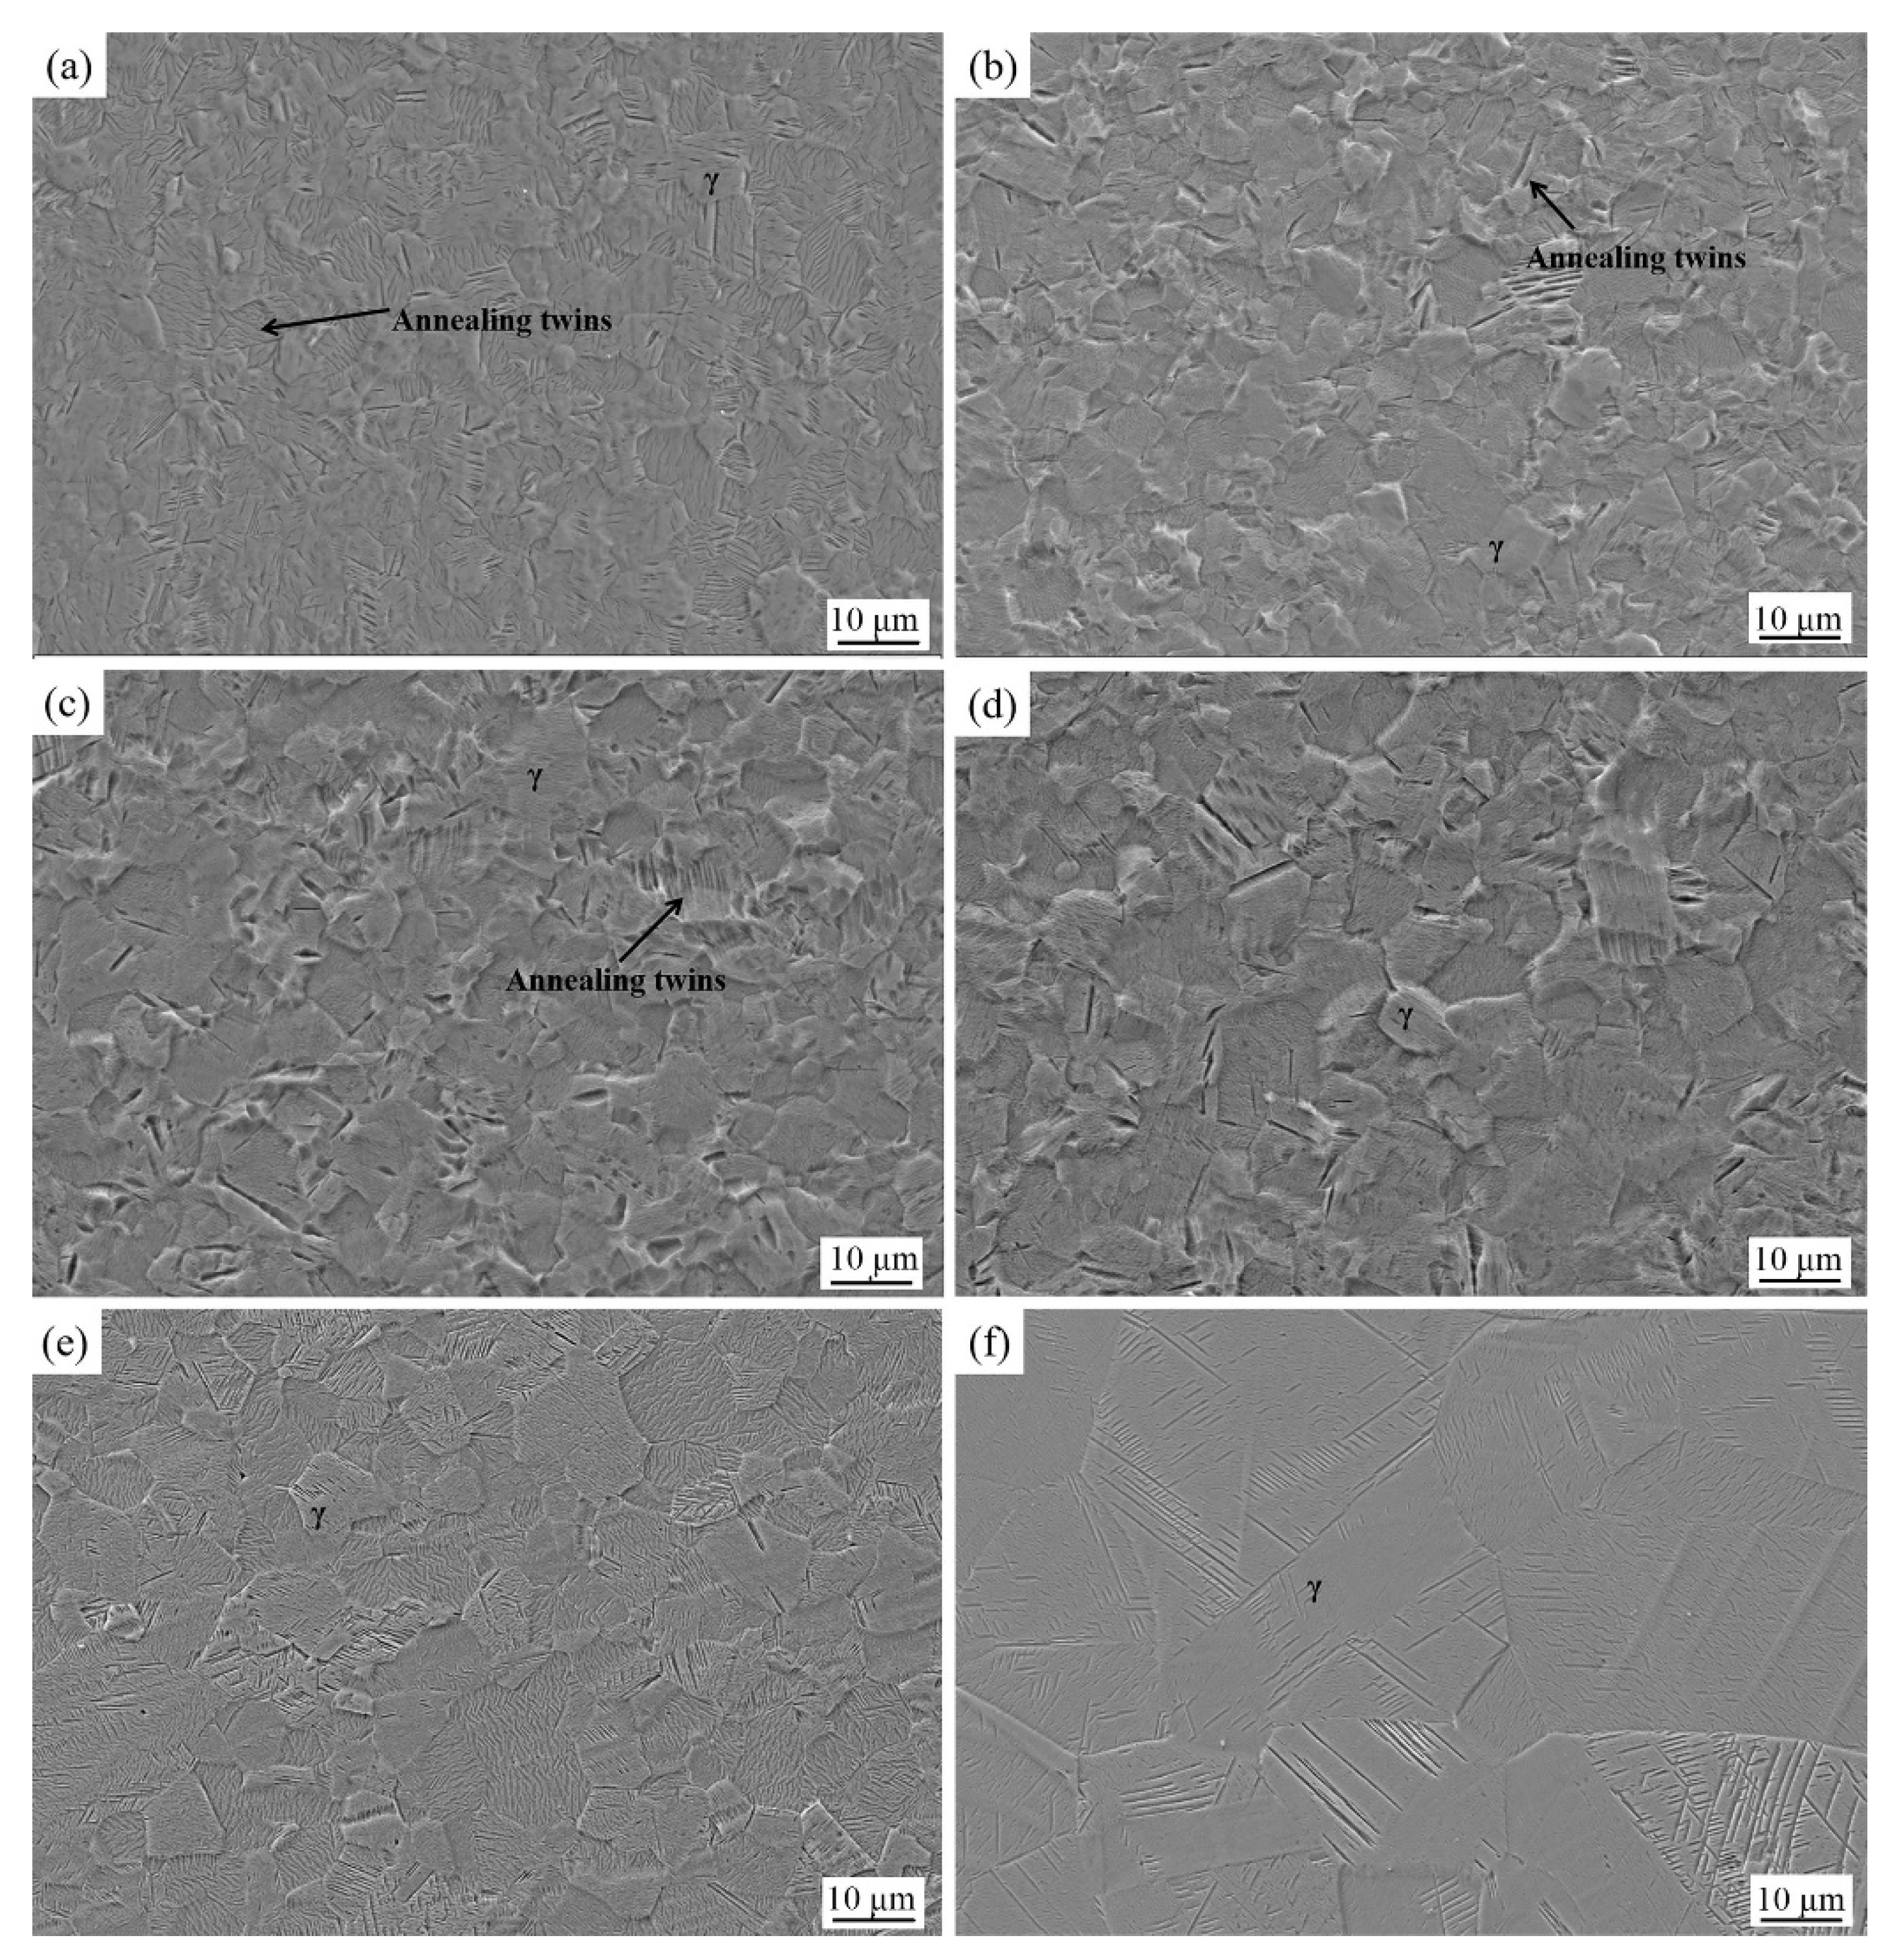
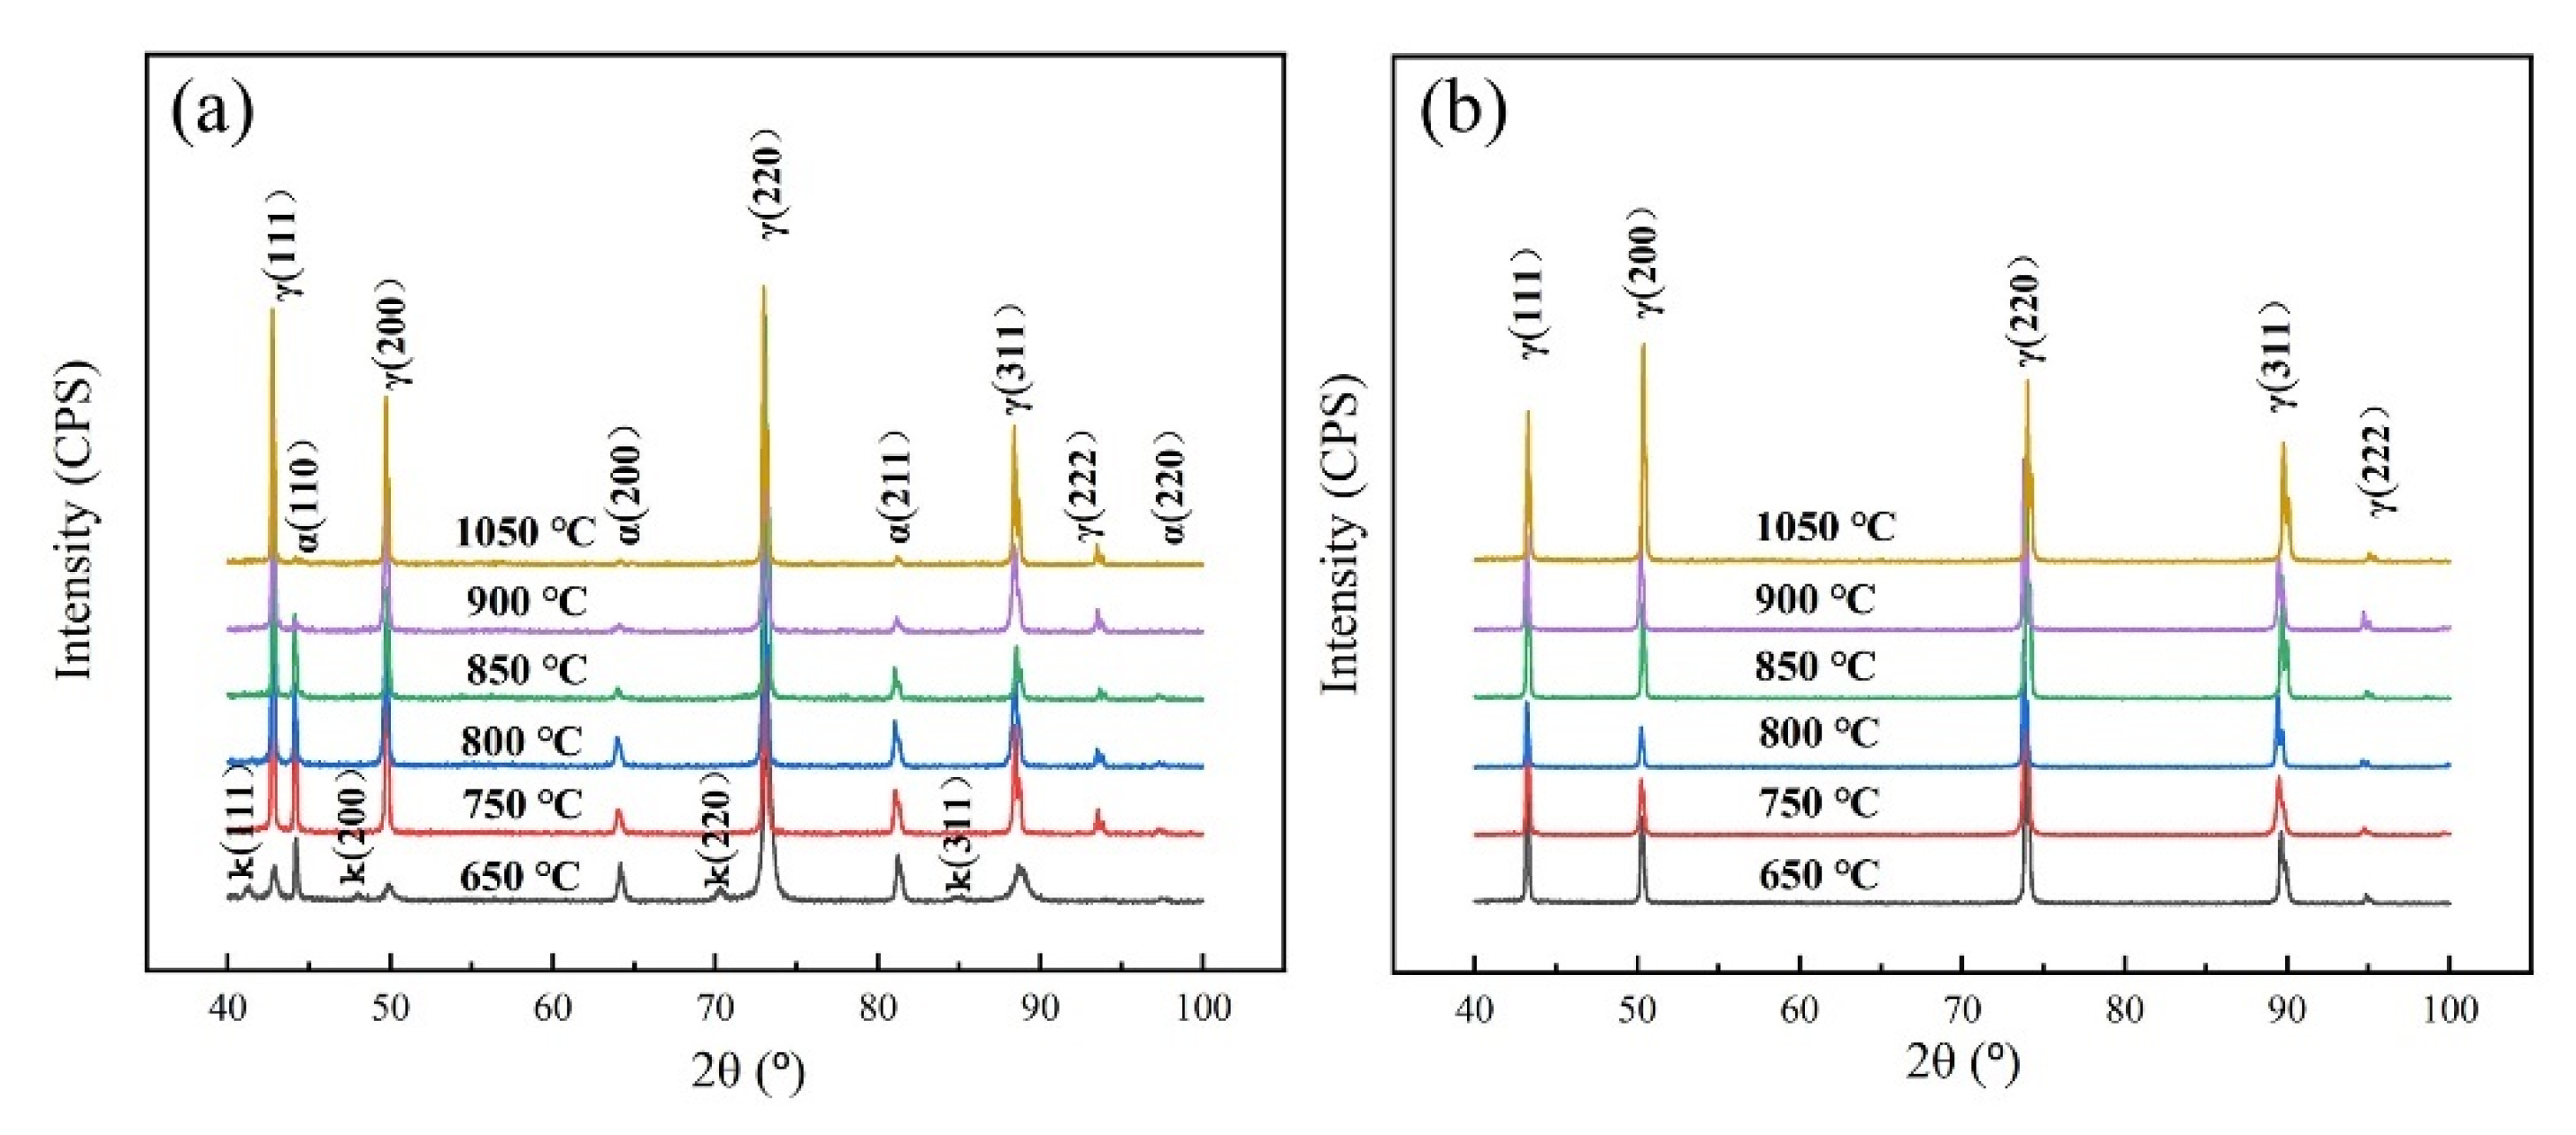
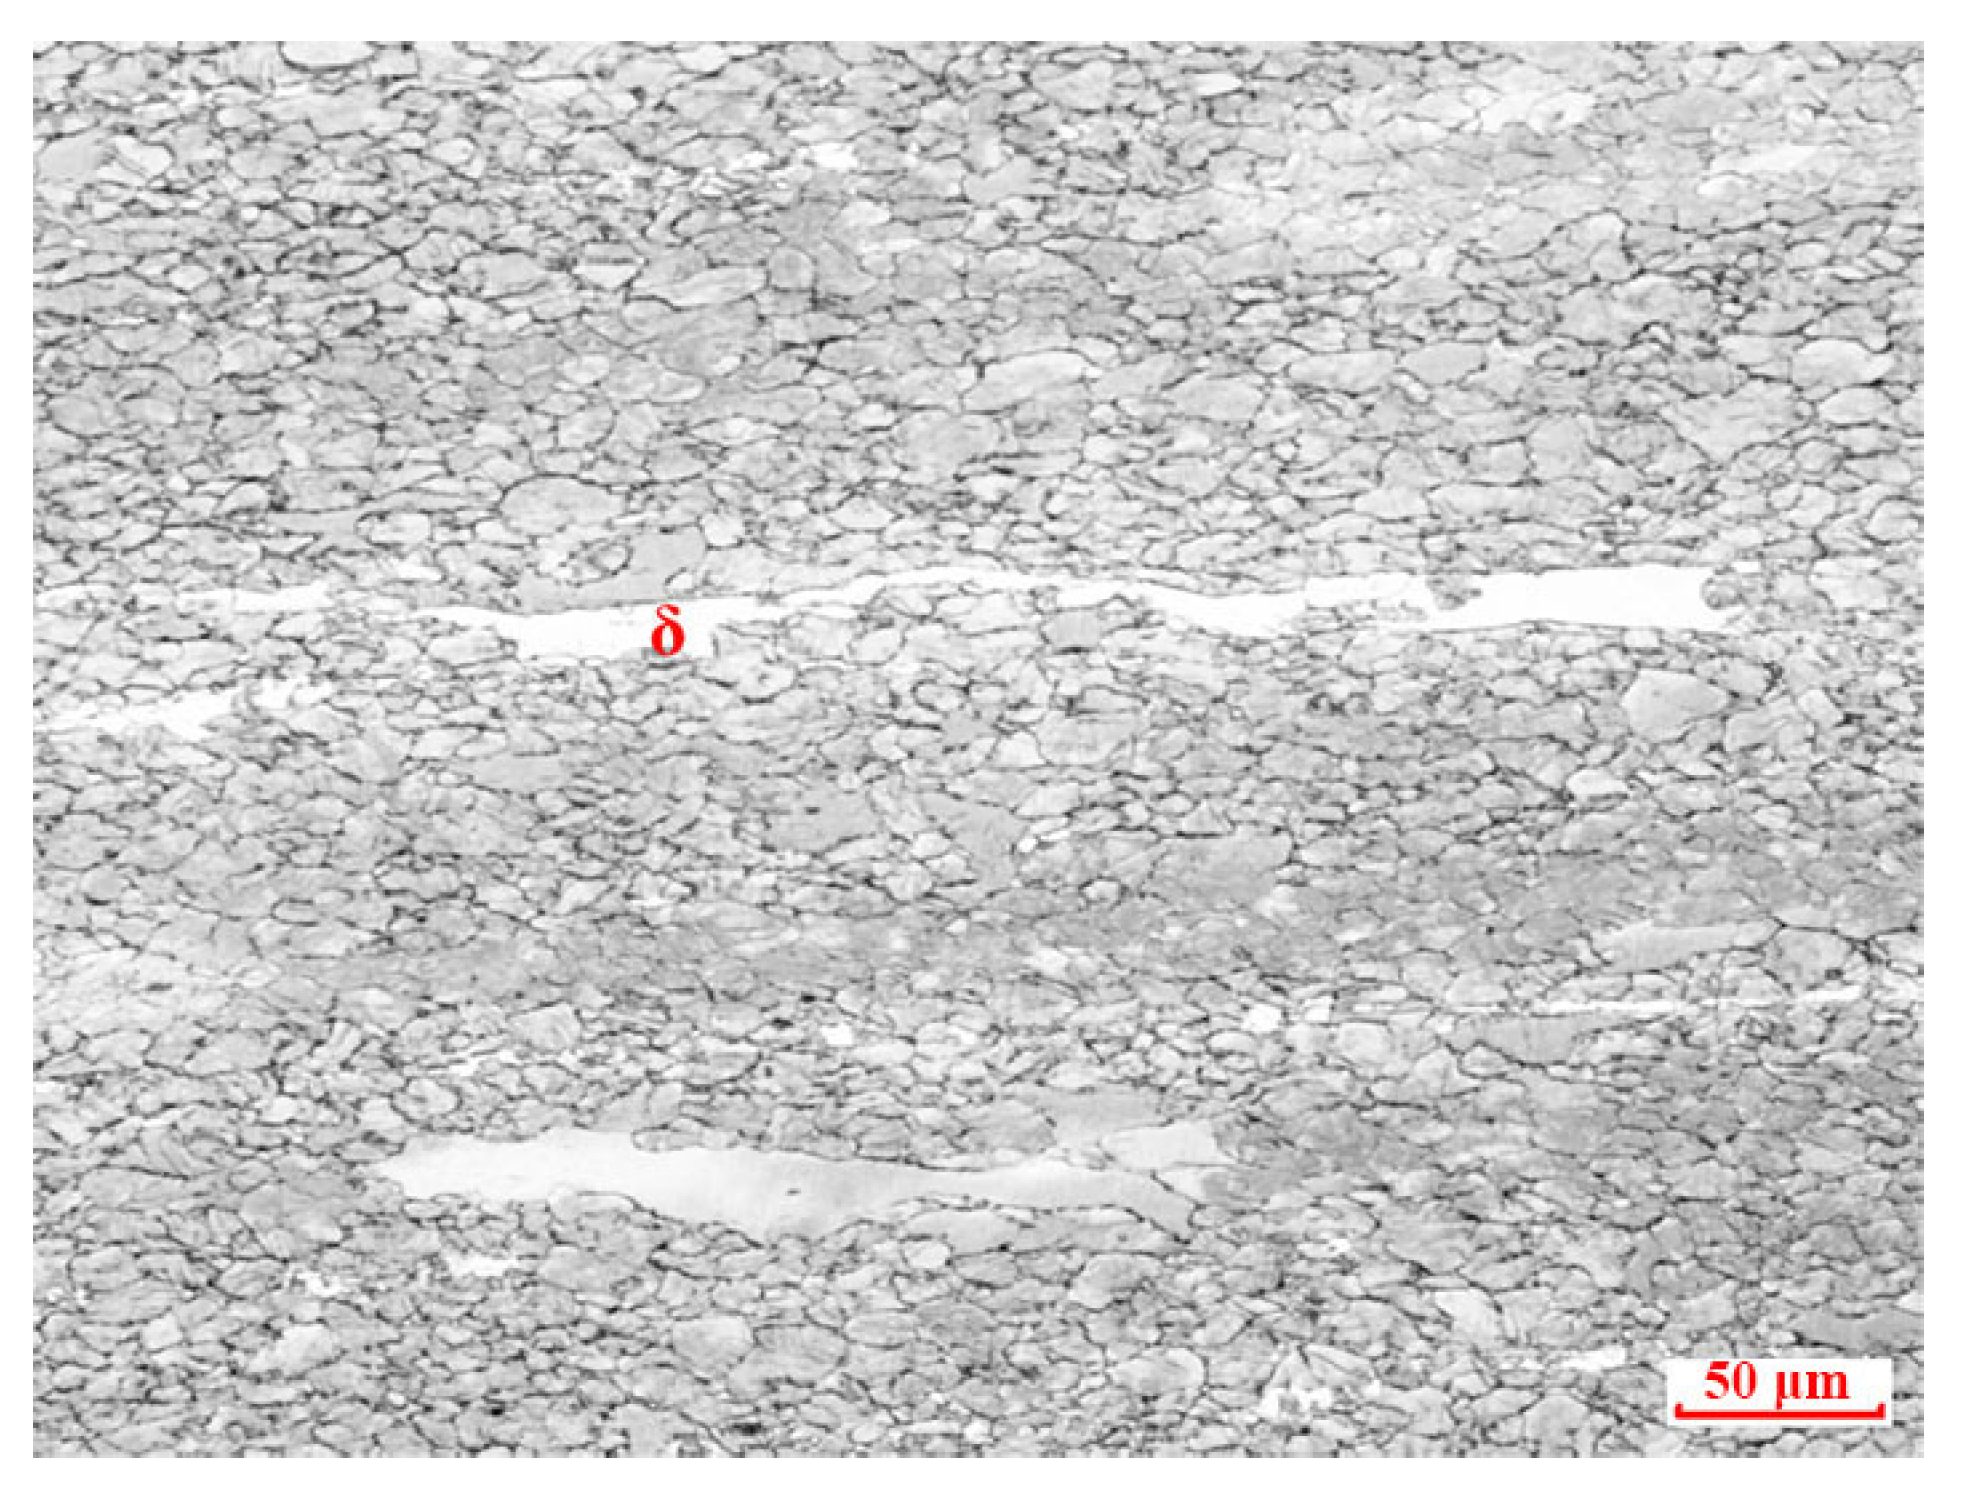
3.1. Microstructure of Experimental Steels after Solid Solution Treatment under Different Temperatures

Combined with the SEM and XRD analyses, as shown in Figure 2, Figure 3 and Figure 4, it could be seen that the microstructure of experimental steel 1# after solid solution treatment was mainly composed of δ-ferrite and austenite. With the increase in the solid solution temperature, the band-like δ-ferrite was gradually broken and decomposed into a bamboo-shaped or discontinuous island-shaped structure. In addition, with the increase in the solid solution temperature, annealing twins could be found in the austenite grains. At the solid solution temperature of 1050 °C, the length and width of the annealing twins apparently increased with the growth in the austenite grain. When the solid solution temperature was 650 °C as shown in Figure 2a, κ carbides were confirmed to precipitate at the austenite grain boundaries by Energy Dispersive Spectrometer (EDS) analysis indicated as EDS1; its diffraction peak can be found as shown in Figure 4a.
The microstructure of experimental steel 2# was composed of the uniform equiaxed austenite grains. With the increase in the solid solution temperature, the austenite grain coarsened, and the annealing twins gradually grew and extended to all the austenite grains.
TEM analysis of the microstructure of annealing twins in the experimental steels under the solid solution temperature of 850 °C is shown in Figure 5. There were a few annealing twins with a big inter-space in the microstructure of steel 1#, while steel 2# showed many tightly arranged annealing twins.

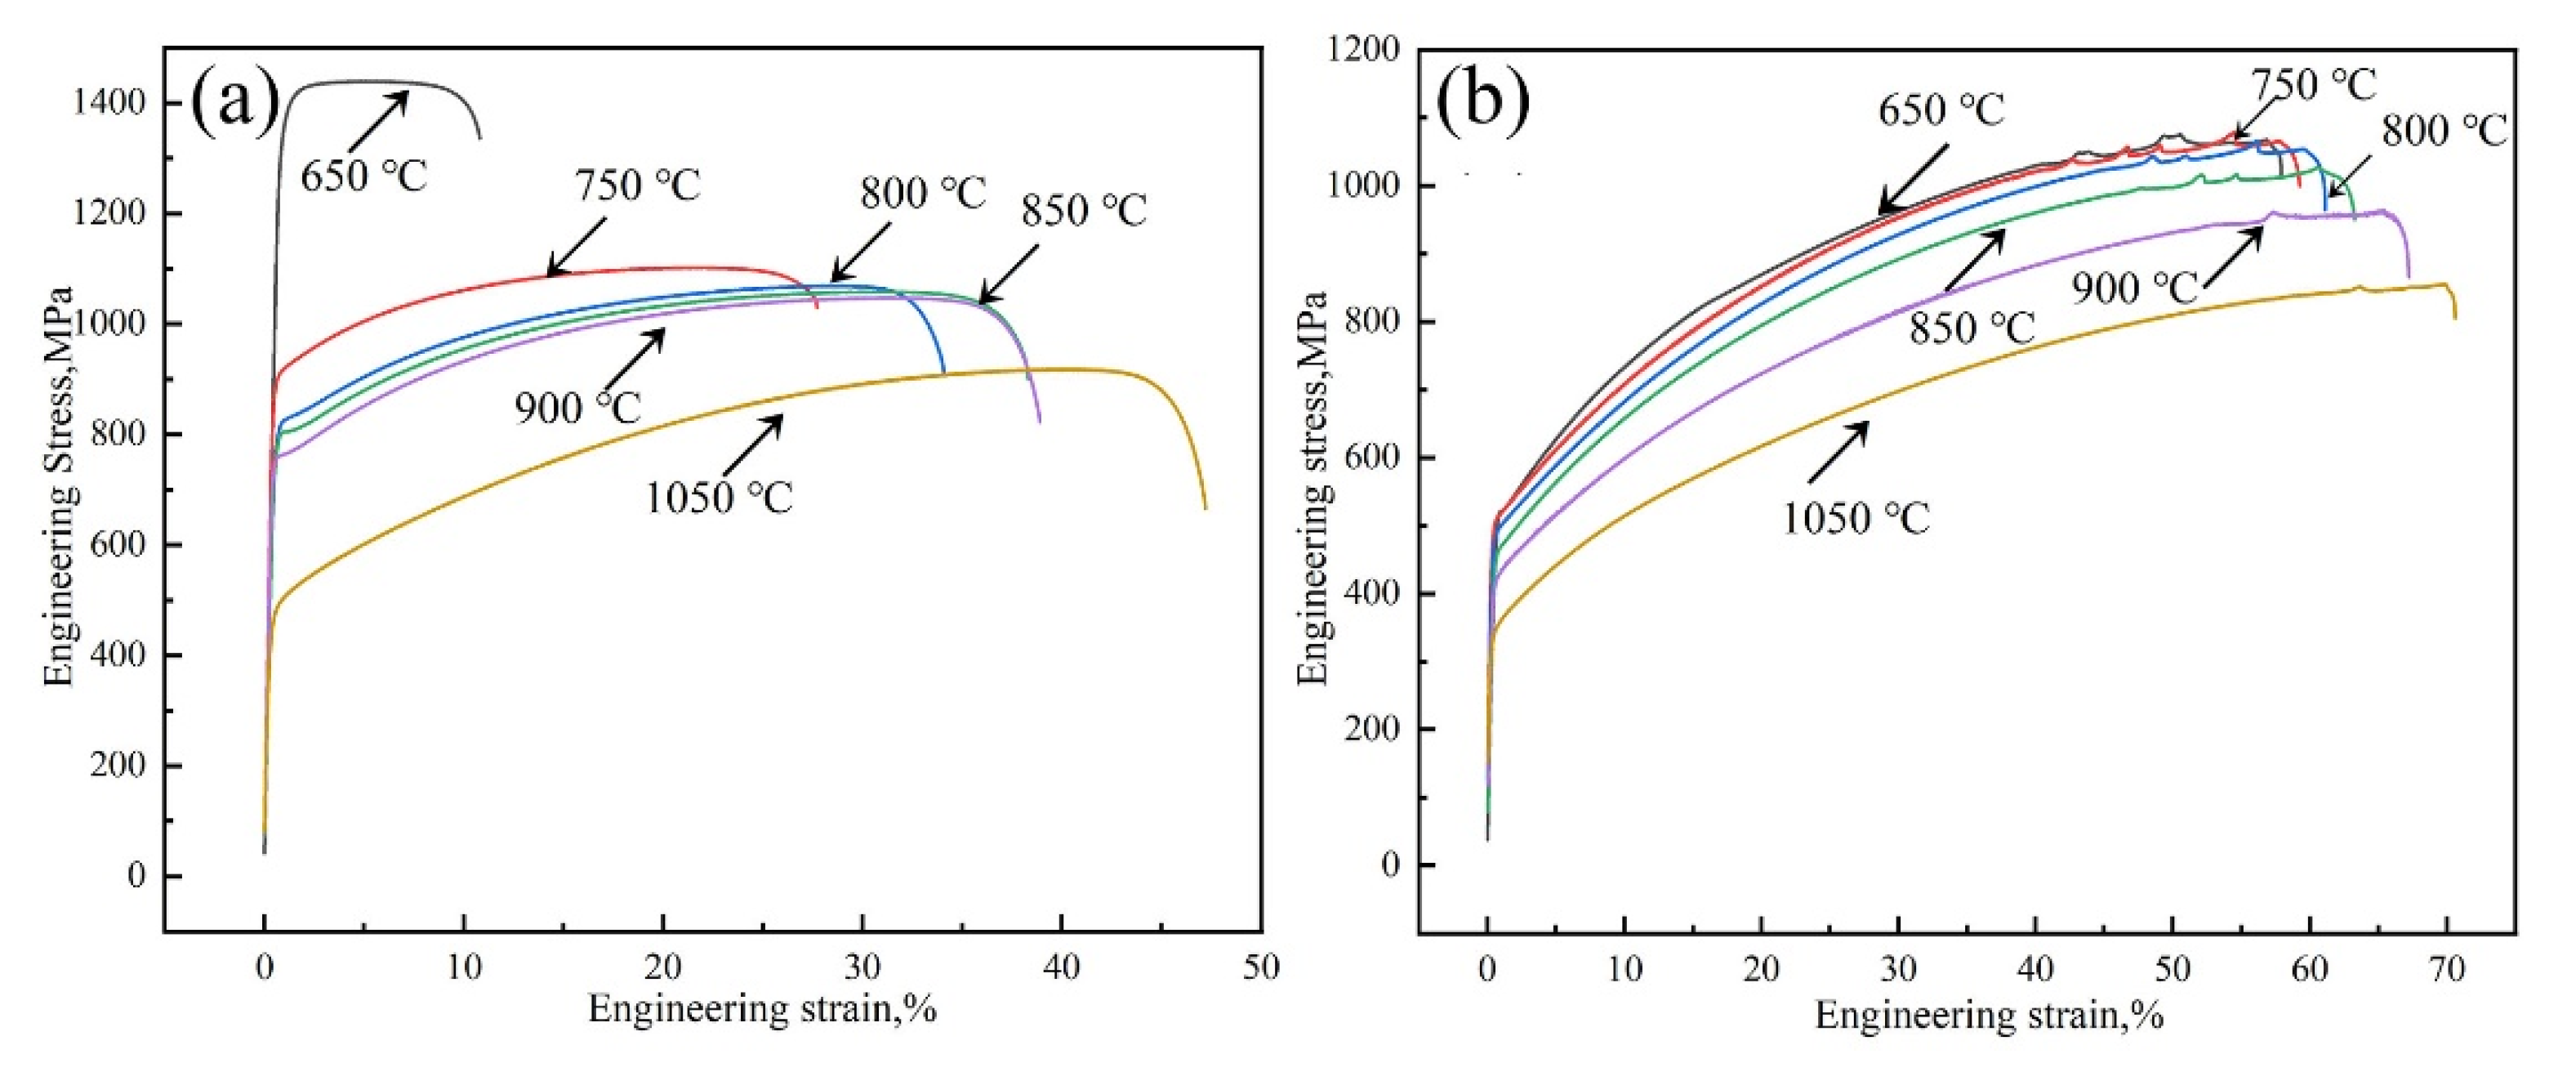
3.2. Tensile Properties at Room Temperature of Experimental Steels under Different Solid Solution Treatments
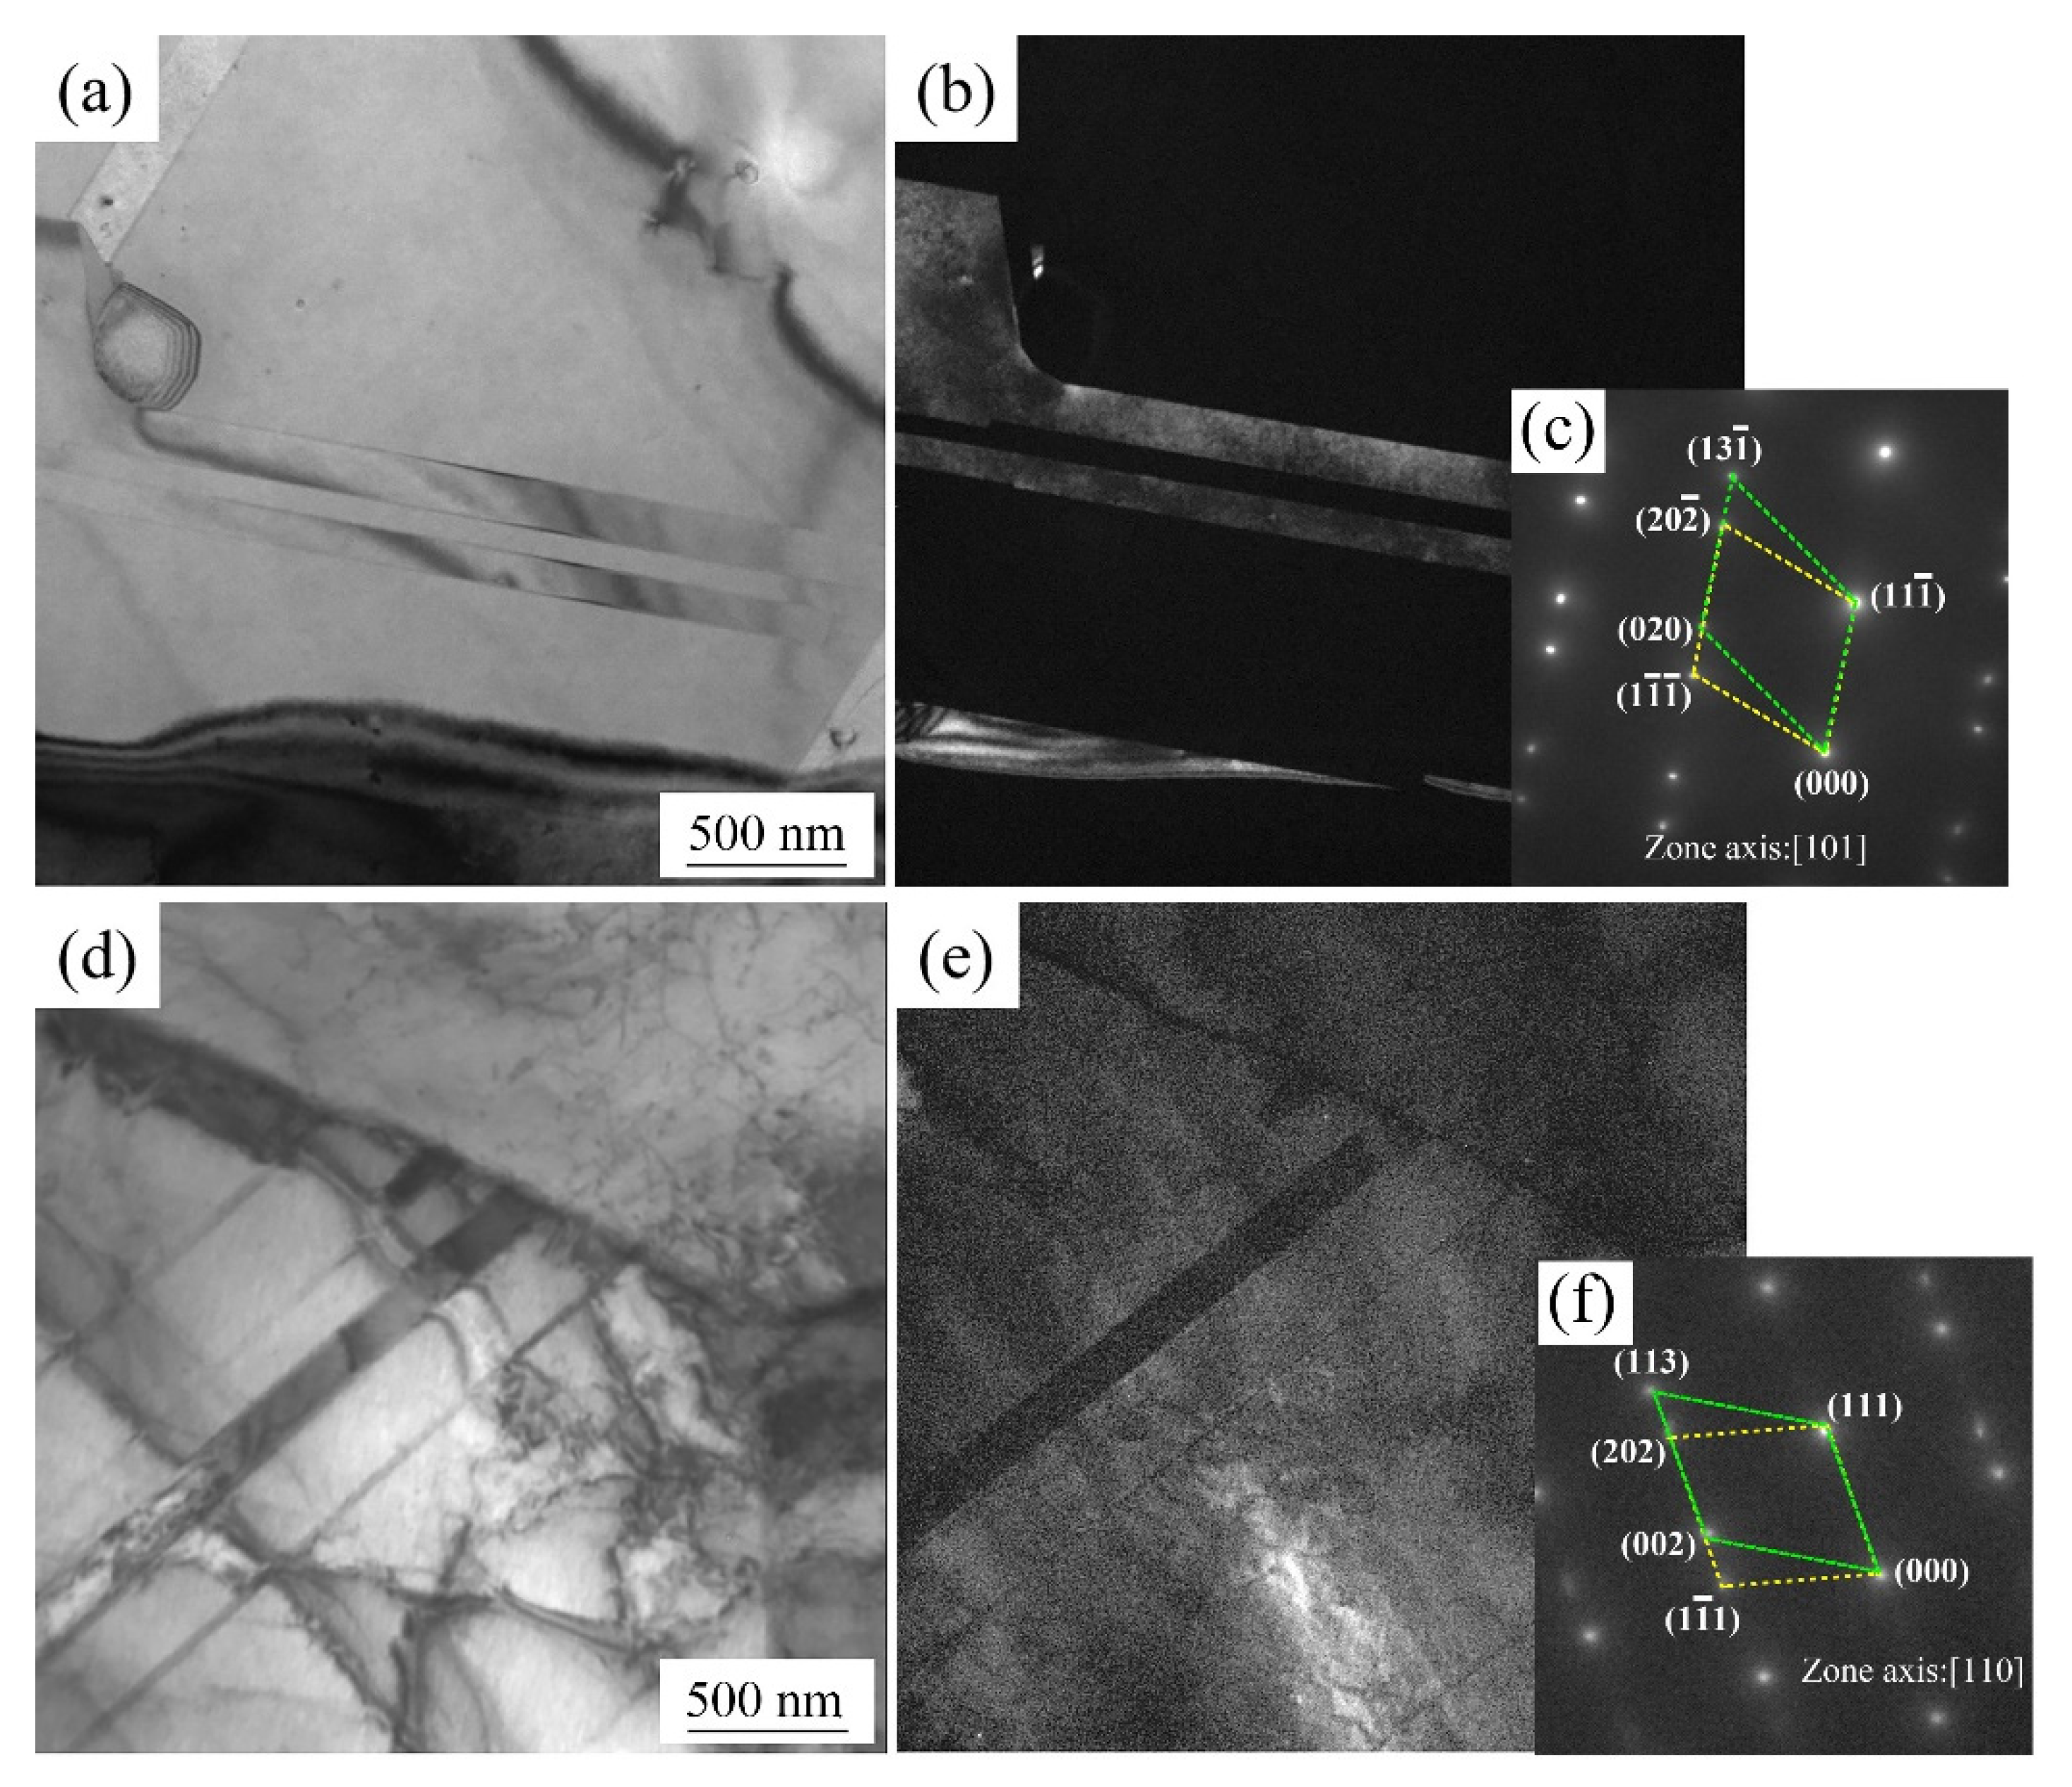
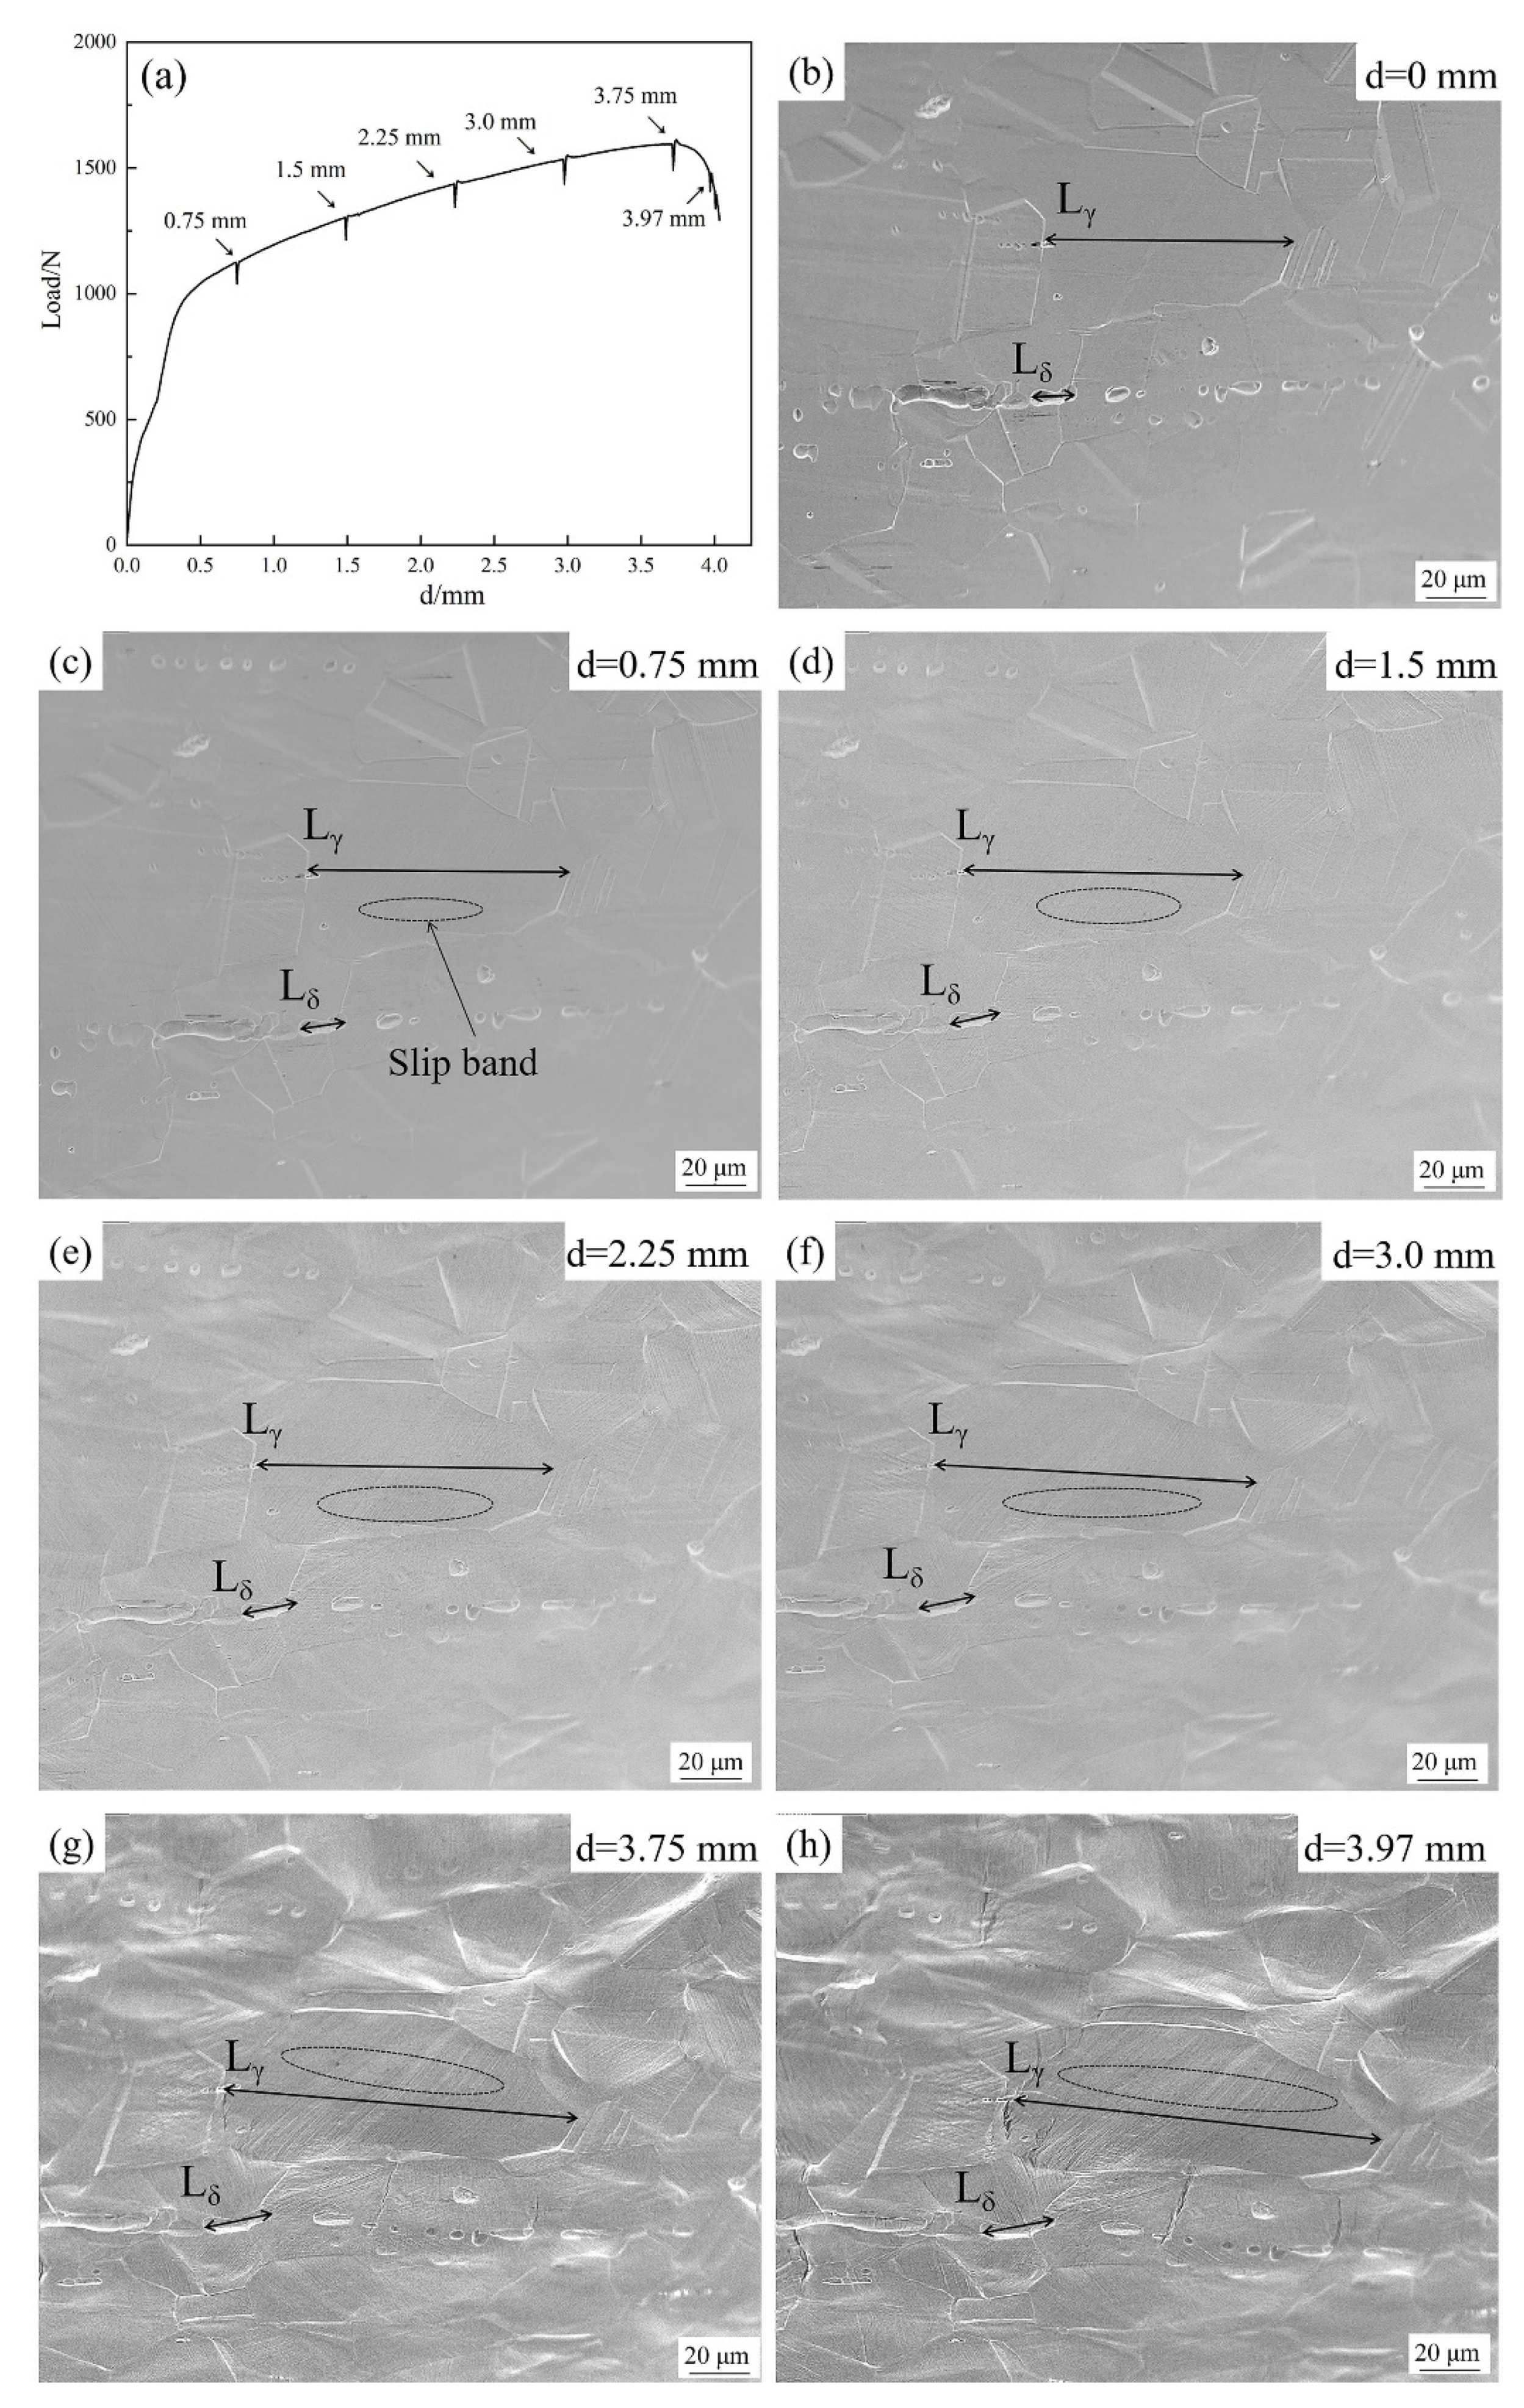
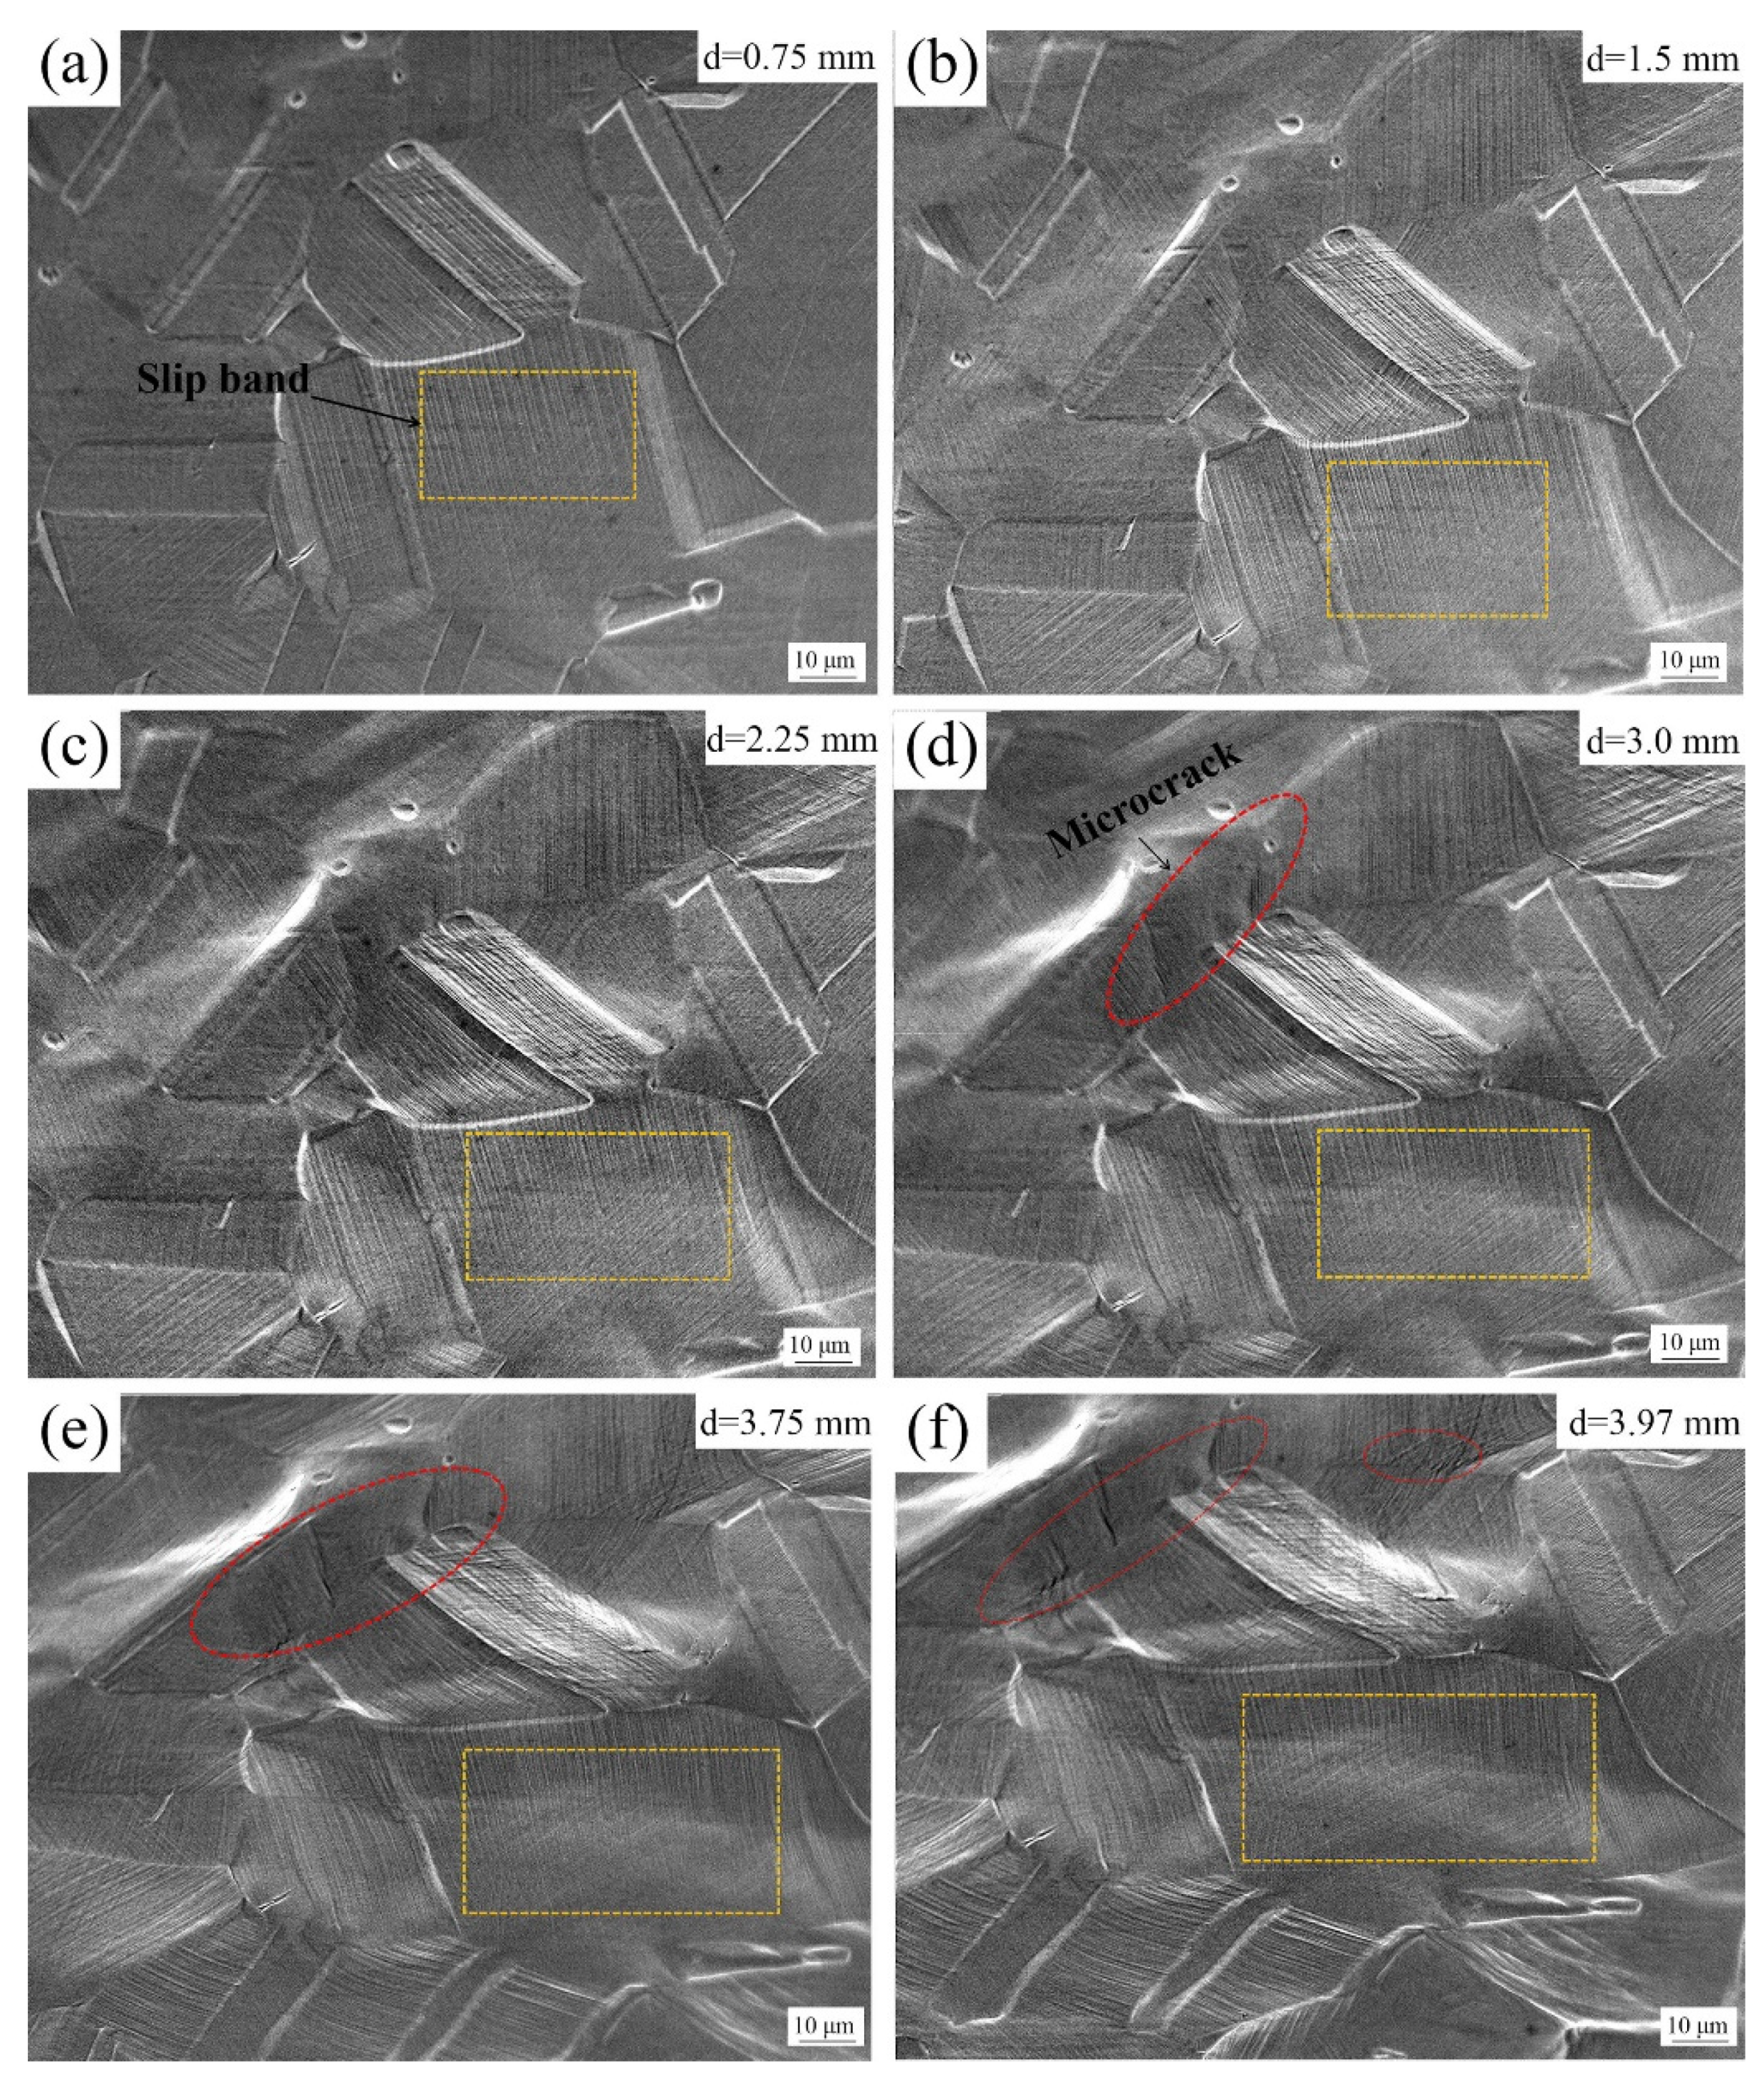
The engineering stress–strain curves of the two experimental steels at different temperatures are shown in Figure 6.
Mechanical properties of 1# and 2# experimental steels after solid solution at different temperatures are shown in Table 2. It is obvious that with the increase in the solid solution temperature, the yield strength and tensile strength of the two steels gradually decreased, but the elongation increased. At the temperatures of 850 °C and 900 °C, the tensile strength of steel 1# could exceed 1000 MPa, and the elongation was close to 40%. The tensile strength of steel 2# was lower than that of steel 1#, but its elongation was higher than 60%, so its PSE was the best and kept stable with the increase in the solid solution temperature.

4. Discussion

Relationship between equilibrium phases and temperature in steel 1# and steel 2# were calculated by Thermo-Calc software (Thermo-Calc 2020b, Thermo-Calc Software AB, Solna, Sweden) with the database TCFE9 [14] as shown in Figure 7. The equilibrium phases consist of FCC_A1 (austenite), BCC_A2 (δ-ferrite), LIQUID, CEMENTITE, KAPPA_E21 (κ carbide) and M23C6 (M23C6 carbide). As demonstrated in Figure 7, δ-ferrite would precipitate at temperatures above 1000 °C. It only dominated the austenite phase in the matrix of steel 2# at the temperatures between about 700 °C and 1300 °C, and there was no precipitation of δ-ferrite.
According to thermodynamic analysis, the δ-ferrite phase would remain in the microstructure after hot rolling for steel 1#. Therefore, it could be found at the temperature of 650 °C after solid solution treatment for 6 min, as shown in Figure 8.
The volume percent of δ-ferrite was determined as 11.3% in the matrix of steel 1# by the quantitative metallographic analysis. With the increase in the solid solution temperature, the δ-ferrite gradually transformed to the austenite phase, which was in accordance with the SEM and XRD analyses shown in Figure 2, Figure 3 and Figure 4. In addition, for steel 1#, κ carbide was in the equilibrium phase with a relatively high content, so it could be found in the matrix at the solid solution temperature of 650 °C.
The modified Olsen–Cohen thermodynamic model could be used to calculate the SFE of the two experimental steels [15]. The calculation formula is as follows:
γ S F E = 2 ρ Δ G γ ε + 2 σ
where ρ is the packing density of 111 close-packed plane atoms, σ is the interface energy of the γ / ε phase, which was 9 mJ/mol, and γ f c c ε h c p is the Gibbs free energy difference between the phases.
The ρ can be expressed as follows:
ρ = 4 3 1 α 2 N
where α is the lattice constant of austenite, and N is the Avogadro constant.
The expression of Gibbs free energy is as follows [16]:
Δ G γ ε = X i Δ G i γ ε + X i X j Ω i j γ ε + Δ G m g γ ε
X i = w i M i w i M i
where Xi is the mole fraction of component i; Δ G i γ ε represents the Gibbs free energy difference between γ f c c ε h c p phase of component i; Ω i j γ ε is the difference in free energy formed by the interaction of components i and j; Δ G m g γ ε is the value of magnetic free energy, and its magnitude is related to the Neel transition temperature of each phase. The calculation formulae are as follows [17]:
Δ G m g γ ε = Δ G m ε Δ G m γ
G m g ϕ = f τ R T ln β + 1
where ϕ represents γ phase or ε phase; R is the gas constant; τ = T / T n e l l , T is the ambient temperature, which was 25 °C in the present work; T n e l l is the Nell temperature; and β is the magnetic parameter related to the composition.
The expression of f τ is as follows.
When   τ < 1 ,
τ   = 1 79 τ 1 / 140 p + 474 / 497 1 / p 1 τ 3 / 6 + τ 9 / 135 + τ 15 / 600 D
When τ > 1 ,
f τ   = τ 5 / 10 + τ 15 / 315 + τ 25 / 1500 D
where p was 0.28 and D was 2.34.
The compositions in austenite of steel 1# under solid solution treatment at different temperatures were determined by SEM and EDS analyses. For the calculation of steel 2#, the matrix composition was adopted. The equilibrium carbon content could be calculated by Thermo-Calc software. The calculation formulae and parameters involved in the stacking fault energy model are listed in Table 3 and Table 4. Then, the stacking fault energy of steel 1# and steel 2# could be calculated. The value of SFE for steel 2# was 24.70 mJ/m2. The values of SFE for steel 1# under solid solution treatment at different temperatures were at the range of 60 mJ/m2 and 65 mJ/m2, as shown in Table 5. As above mentioned, the steels with the SFE between 20 mJ/m2 and 45 mJ/m2 should exhibit the TWIP effect during the tensile deformation process. So, the twinning-induced plasticity effect would be dominated in steel 2#.
In order to further analyze the deformation mechanism of the experimental steels, the variation of instantaneous strain hardening exponent (n-value) with true strain was studied. The n-value, n i , can be deduced from Equation (9) as follows [21]:
n i =   ε t / σ t d σ t / d ε t
where σ t and ε t are the true stress and true strain, respectively.
As shown in Figure 9, the n-value of steel 2# fluctuated significantly in the high-strain stage. With the increase in deformation, the higher efficiency of grain refining resulting from the formation of twining was obtained. So, the n-value was constantly increased, due to the effect of grain refinement strengthening. Accordingly, the gradual stress concentration produced by grain boundary interaction would suppress the twinning formation at higher strain. At the higher strain stage, the motion of dislocation dominated in the matrix, and the interaction between dislocation and solute atoms led to an effect of continuous dynamic strain aging (DSA) [22,23], and then the n-value obviously fluctuated. It was noted that when the temperature increased from 650 °C to 1050 °C, the fluctuation of n-value decreased and delayed because of the better TWIP effect in austenite with a bigger grain size.
As shown in Figure 8, about 10 vol% of strip-like δ-ferrite could be observed in the matrix for steel 1# treated at the temperature of 650 °C. The difference in deformation between δ-ferrite and austenite led to crack initiation. So, the n-value hardly changed with the increase in true strain until fracture. When the temperature increased from 750 °C to 1050 °C, δ-ferrite was gradually decomposed and replaced by austenite and a slowly increasing platform was exhibited on the n value true strain curve. Especially, the value of n increased significantly at the temperature of 1050 °C. Although the existence of κ carbides in steel 1# increased the yield strength resulting from the interaction of nano-scale particles and dislocation, the n-value dropped even faster, due to the inhomogeneous deformation of the ferrite phase in the matrix. For steel 1# with the higher Al content, the n-value did not fluctuate sharply during the high strain stage. This was due to a significant decrease in the C diffusivity when the aluminum content was high, reducing the tendency of the Mn-C short-range ordering, resulting in the suppression of serrated flow caused by DSA [24].
TEM images of the microstructure near the fracture surface of the experimental steels are shown in Figure 10. Coarser deformation twins were distributed in the matrix of steel 2#. A positive correlation between the critical stress required for twin formation and the stacking fault energy was reported [25]. The stacking fault energy of steel 2# was so low that the deformation twins were easily formed, and the performance of the steel was improved. For steel 1#, due to its higher stacking fault energy, deformation twins were not easily produced under tensile load. During the tensile deformation of steel 1#, the multiplication and pile up of dislocation resulted in the increase in the n-value. It can be seen from Figure 10 that deformation twins only generated locally in a small amount, surrounded by high-density dislocations. Because the hardening resulting by the concentration of pile up of dislocation and the softening resulting from the twin induced plasticity coexisted in the matrix of steel during the deformation, a slowly increasing platform on the n-value strain curve was exhibited. When the temperature increased to 1050 °C, the austenite dominated in the matrix, and the effect of grain refinement strengthening by the twin boundary was added, so the value of n increased obviously.
In situ SEM analysis for tensile samples was performed on steel 1# and steel 2# to study the deformation behavior of the matrix under different deformation stages. Figure 11 shows the load-displacement relationship curve of steel 1# and the SEM analysis of the microstructure under different displacements.
In Figure 11, the band-shaped δ-ferrite and annealing twins are distributed in the austenite matrix. The size of the δ-ferrite and austenite was measured under different displacements in order to analyze their deformation ability. Austenite and δ-ferrite were marked as L γ and L δ , as shown in Figure 11. The different deformation of the two phases can be determined by the following equation:
ε i =   I i I 0 / I 0
where ε i is the deformation of the phase at the given displacement, I i the size of the phase at the given displacement, and I 0 the initial size of the phase.
The relationship between the deformation of austenite or δ-ferrite and tensile displacement could be calculated and is shown in Figure 12, in which, with the increase in the tensile displacement, the deformation of the phase increased accordingly and more obviously for austenite. Due to the difference in the deformability between austenite and δ-ferrite, the stress concentration would likely happen at the phase interface between austenite and δ-ferrite during the deformation, resulting in the phase interface microcracks initiation.
As show in Figure 13, many dislocation slip bands were produced during deformation. It can be seen that, even within the same grain, slip bands with different orientations might be formed, as shown in the yellow box. When the displacement was small, due to the high stacking fault energy of steel 1#, the extended dislocations, which were not easy to separate, had low three-dimensional mobility and were prone to cross-slip. As a result, with the displacement increased, the slip band inside the austenite grains was gradually elongated, then twisted, which led to the obvious interaction of the slip band [26]. The uneven deformation of adjacent austenite resulting from the extension of slip band caused stress concentration at the grain boundaries, which led to the formation and propagation of micro-cracks, as shown in the red circle area of Figure 13.
The load-displacement relationship curve of steel 2# and the SEM analysis of microstructure under different displacements are shown in Figure 14. The microstructure of this steel was composed of polygonal and equiaxed austenite. Due to its low stacking fault energy, austenite in steel 2# was prone to induce deformation twins instead of slip band during tensile deformation. Compared with steel 1#, the slip band could be found under the condition of a large displacement. As shown in the black circle area of Figure 14, the slip band with the same orientation distributed in the local area was hardly intersected. Therefore, the deformation of steel 2# was relatively uniform, and there were no micro-cracks in the matrix when the displacement reached the maximum. However, the deformability difference between austenite and δ-ferrite in the microstructure of steel 1#, and the uneven deformation of adjacent austenite resulting from the extension of slip band were the main reasons for its lower plasticity in comparison with steel 2#.

5. Conclusions

1. Aided by thermodynamic calculation, the stacking fault energy of the experimental steels treated by different solid solution temperatures was compared. For the 18Mn-1.5Al steel, due to about 20 mJ/m2 stacking fault energy and uniform austenite matrix, deformation twins were produced in the steel matrix at lower tensile deformation. Because of the dominated TWIP effect, there was no obvious variation for the mechanical properties of samples under different solid solution treatments.
2. With the addition of about 7 wt% aluminum content and after solid solution treatment at 650 °C, over 10 vol% δ-ferrite was distributed in the austenite matrix of the experimental steel. The SFE was increased with the increase in the aluminum content and heat treatment temperature. The κ carbides could be precipitated and the yield strength could be improved by the interaction of the nano-scale carbide and dislocation.
3. As the solution treatment temperature increased from 750 °C to 1050 °C, δ-ferrite in the 18Mn-7Al experimental steel gradually transformed into austenite, and the SFE of 18Mn-7Al steel exceeded to 60 mJ/m2. The n-value was kept lower and stable in a larger strain range, which was caused by the local hardening during tensile deformation. Because of the difference in deformability between the austenite and δ-ferrite, as well as the inconsistent extension of the slip band, the crack was easily initiated. For the 18Mn-1.5Al experimental steel, the n-value constantly increased with the strain increase, resulting from the effect of grain refinement strengthening.

Author Contributions

Conceptualization, Y.-T.H.; formal analysis, Y.-T.H.; investigation, Y.-T.H. and M.-L.D.; methodology, Y.-L.H.; resources, R.-D.L. and Y.Z.; supervision, Y.-L.H. and N.-Q.Z.; writing—original draft, Y.-T.H.; writing—review and editing, Y.-L.H. and N.-Q.Z. All authors have read and agreed to the published version of the manuscript.

Funding

This research was funded by the National Key Research and Development Program of China, grant number 2017YFB0304402, and the National Natural Science Foundation of China, grant number 51971127.

Institutional Review Board Statement

Not applicable.

Informed Consent Statement

Not applicable.

Data Availability Statement

Not applicable.

Conflicts of Interest

The authors declare no conflict of interest.

References

  1. De Cooman, B.C.; Estrin, Y.; Kim, S.K. Twinning-induced plasticity (TWIP) steels. Acta Mater. 2018, 142, 283–362. [Google Scholar] [CrossRef]
  2. Behm, V.; Höfemann, M.; Hatscher, A.; Springer, A.; Kaierle, S.; Hein, D.; Otto, M.; Overmeyer, L. Investigations on Laser Beam Welding Dissimilar Material Combinations of Austenitic High Manganese (FeMn) and Ferrite Steels. Phys. Procedia 2014, 56, 610–619. [Google Scholar]
  3. Kim, H.; Suh, D.-W.; Kim, N.J. Fe-Al-Mn-C lightweight structural alloys: A review on the microstructures and mechanical properties. Sci. Technol. Adv. Mater. 2013, 14, 014205. [Google Scholar] [CrossRef] [PubMed]
  4. Ma, T.; Gao, J.X.; Li, H.R.; Li, C.Q.; Zhang, H.C.; Li, Y.G. Microband-Induced Plasticity in a Nb Content Fe-28Mn-10Al-C Low Density Steel. Metals 2021, 11, 345. [Google Scholar] [CrossRef]
  5. Vidilli, A.L.; Otani, L.B.; Wolf, W.; Kiminami, C.S.; Botta, W.J.; Coury, F.G.; Bolfarini, C. Design of a FeMnAlC steel with TWIP effect and evaluation of its tensile and fatigue properties. J. Alloys Compd. 2020, 831, 154806. [Google Scholar] [CrossRef]
  6. Zambrano, O.A. A General Perspective of Fe-Mn-Al-C Steels. J. Mater. Sci. 2017, 53, 14003–14062. [Google Scholar] [CrossRef] [Green Version]
  7. Park, K.-T.; Jin, K.G.; Han, S.H.; Hwang, S.W.; Choi, K.; Lee, C.S. Stacking fault energy and plastic deformation of fully austenitic high manganese steels: Effect of Al addition. Mater. Sci. Eng. A 2010, 527, 3651–3661. [Google Scholar] [CrossRef]
  8. Hwang, S.W.; Ji, J.H.; Lee, E.G.; Park, K.T. Tensile deformation of a duplex Fe–20Mn–9Al–0.6C steel having the reduced specific weight. Mater. Sci. Eng. A 2011, 528, 5196–5203. [Google Scholar]
  9. Yoo, J.D.; Park, K.T. Microband-induced plasticity in a high Mn-Al-C light steel. Mater. Sci. Eng. A 2008, 496, 417–424. [Google Scholar] [CrossRef]
  10. Frommeyer, G.; Brüx, U. Microstructures and mechanical properties of high-strength Fe–Mn–Al–C light-weight TRIPLEX steels. Steel Res. Int. 2006, 77, 627–633. [Google Scholar] [CrossRef]
  11. Kang, S.; Jung, Y.S.; Jun, J.H.; Lee, Y.K. Effects of recrystallization annealing temperature on carbide precipitation, microstructure, and mechanical properties in Fe–18Mn–06C–1.5Al TWIP steel. Mater. Sci. Eng. A 2010, 527, 745–751. [Google Scholar] [CrossRef]
  12. Chung, K.; Ahn, K.; Yoo, D.H.; Chung, K.H.; Seo, M.H.; Park, S.H. Formability of TWIP (twinning induced plasticity) automotive sheets. Int. J. Plast. 2011, 27, 52–81. [Google Scholar] [CrossRef]
  13. Busch, C.; Hatscher, A.; Otto, M.; Huinink, S.; Vucetic, M.; Bonk, C.; Bouguecha, A.; Behrens, B.A. Properties and application of high-manganese TWIP-steels in sheet metal forming. Procedia Eng. 2014, 81, 939–944. [Google Scholar] [CrossRef] [Green Version]
  14. Thermo-Calc Software 2020b; TCFE9 Steels/Fe-alloys database; Thermo-Calc Software AB: Solna, Sweden, 2020.
  15. Curtze, S.; Kuokkala, V.T.; Oikari, A.; Talonen, J.; Hänninen, H. Thermodynamic modeling of the stacking fault energy of austenitic steels. Acta Mater. 2011, 59, 1068–1076. [Google Scholar] [CrossRef]
  16. Curtze, S.; Kuokkala, V.T. Dependence of tensile deformation behavior of TWIP steels on stacking fault energy, temperature and strain rate. Acta Mater. 2010, 58, 5129–5141. [Google Scholar] [CrossRef]
  17. Hillert, M.; Jarl, M. A model for alloying in ferromagnetic metal. Calphad 1978, 2, 227–238. [Google Scholar] [CrossRef]
  18. Pierce, D.T.; Jiménez, J.A.; Bentley, J.; Raabe, D.; Oskay, C.; Wittig, J.E. The influence of manganese content on the stacking fault and austenite/ε-martensite interfacial energies in Fe–Mn–(Al–Si) steels investigated by experiment and theory. Acta Mater. 2014, 68, 238–253. [Google Scholar] [CrossRef]
  19. Dumay, A.; Chateau, J.P.; Allain, S.; Migot, S.; Bouaziz, O. Influence of addition elements on the stacking-fault energy and mechanical properties of an austenitic Fe–Mn–C steel. Mater. Sci. Eng. A 2008, 483–484, 184–187. [Google Scholar] [CrossRef]
  20. Zambrano, O.A. Stacking Fault Energy Maps of Fe–Mn–Al–C–Si Steels: Effect of Temperature, Grain Size, and Variations in Compositions. J. Eng. Mater. Technol. 2016, 138, 041010.1–0410109. [Google Scholar] [CrossRef]
  21. Holloman, J.H. Tensile deformation. Trans. Metall. Soc. AIME 1945, 162, 268–290. [Google Scholar]
  22. Lan, P.; Zhang, J. Twinning and Dynamic Strain Aging Behavior during Tensile Deformation of Fe–Mn–C TWIP Steel. Mater. Sci. Eng. A 2017, 700, 250–258. [Google Scholar] [CrossRef]
  23. Kim, J.G.; Hong, S.; Anjabin, N.; Park, B.H.; Kim, S.K.; Chin, K.G.; Lee, S.; Kim, H.S. Dynamic strain aging of twinning-induced plasticity (TWIP) steel in tensile testing and deep drawing. Mater. Sci. Eng. A 2015, 633, 136–143. [Google Scholar]
  24. Madivala, M.; Schwedt, A.; Prahl, U.; Bleck, W. Strain Hardening, Damage and Fracture Behavior of Al-Added High Mn TWIP Steels. Metals 2019, 9, 367. [Google Scholar] [CrossRef] [Green Version]
  25. Meyers, M.A.; Vöhringer, O.; Lubarda, V.A. The onset of twinning in metals: A constitutive description. Acta Mater. 2001, 49, 4025–4039. [Google Scholar] [CrossRef]
  26. Wang, J.M.; Zhou, K.K.; Lu, J.; Xu, X.J.; Jiang, Y.F. Influence of Stacking Fault Energy on Grain-refining during Severe Shear Deforming (in Chinese). Chin. J. Mech. Eng. 2008, 44, 126–131. [Google Scholar] [CrossRef]
Figure 1. Schematic diagram of the tensile sample for in situ observation (unit: mm).
Metals 11 01497 g001
Figure 2. SEM (scanning electron microscope) micrographs of steel 1# under different solid solution temperatures: (a) 650 °C, (b) 750 °C, (c) 800 °C, (d) 850 °C, (e) 900 °C and (f) 1050 °C. (δ: δ-ferrite; γ: austenite.)
Metals 11 01497 g002
Figure 3. SEM micrographs of steel 2# under different solid solution temperatures: (a) 650 °C, (b) 750 °C, (c) 800 °C, (d) 850 °C, (e) 900 °C and (f) 1050 °C.
Metals 11 01497 g003
Figure 4. X-ray diffraction patterns of steels under different solid solution temperatures: (a) steel 1# and (b) steel 2#.
Metals 11 01497 g004
Figure 5. TEM (transmission electron microscopy) micrographs of annealing twins microstructure of steels: (ac) steel 1# and (df) steel 2# under the solid solution temperature of 850 °C with (a,d) bright-field images, (b,e) dark-field images and (c,f) corresponding selected area electron diffraction (SAED) patterns.
Metals 11 01497 g005
Figure 6. Engineering stress–strain curves of steels after solid solution treatment at different temperatures for 6 min: (a) steel 1# and (b) steel 2#.
Metals 11 01497 g006
Figure 7. Relationship between equilibrium phases and temperature in steels: (a) steel 1# and (b) steel 2#. FCC_A1: austenite. BCC_A2: δ-ferrite. LIQUID: cementite. KAPPA_E21: κ carbide.M23C6: M23C6 carbide.
Metals 11 01497 g007
Figure 8. Optical microscopy of steel 1# under solid solution treatment at the temperature of 650 °C.
Metals 11 01497 g008
Figure 9. Instantaneous strain hardening exponent as a function of true strain for steels under solid solution treatment at different temperatures: (a) steel 1# and (b) steel 2#.
Metals 11 01497 g009
Figure 10. TEM micrographs of deformation twins microstructure of experimental steels: (ac) steel 1# and (df) steel 2# with (a,d) bright field images, (b,e) dark field images and (c,f) corresponding SAED patterns.
Metals 11 01497 g010
Figure 11. (a) Load-displacement relationship curve of steel 1# and (b–h) SEM analysis of microstructure under different displacements. L γ and L δ are the size of austenite and δ-ferrite, respectively.
Metals 11 01497 g011
Figure 12. Relationship between the deformation and the tensile displacement of the two phases.
Metals 11 01497 g012
Figure 13. Slip bands and microcrack morphology transition of steel 1# with different tensile displacements.
Metals 11 01497 g013
Figure 14. (a) Load-displacement relationship curve of steel 2# and (bg) the SEM analysis of microstructure under different displacements.
Metals 11 01497 g014
Table 1. Chemical composition of experimental steels (wt%).
SteelMnSiAlCFe
1#17.480.407.360.75Bal.
2#18.400.461.500.70Bal.
Table 2. Mechanical properties of steel 1# and steel 2# after different solid solution, temperatures for 6 min. (YS: yield strength; TS: tensile strength; TE: total elongation.)
Temperature/℃SampleYS/MPaTS/MPaTE/%TS × TE/GPa·%
6501#1319 ± 101439 ± 1610.8 ± 0.715.5
2#519 ± 81107 ± 1057.9 ± 1.564.1
7501#901 ± 111106 ± 1027.7 ± 0.530.6
2#506 ± 101079 ± 959.2 ± 0.663.9
8001#813 ± 111069 ± 1934.1 ± 0.736.5
2#489 ± 141051 ± 1961.1 ± 0.964.2
8501#805 ± 141061 ± 1638.3 ± 0.840.6
2#473 ± 101049 ± 1363.1 ± 1.466.2
9001#757 ± 111047 ± 1938.9 ± 0.740.7
2#413 ± 14964 ± 1467.2 ± 1.264.8
10501#494 ± 9919 ± 1447.2 ± 0.943.4
2#363 ± 8855 ± 1070.6 ± 1.460.4
Table 3. Calculation formulae involved in the stacking fault energy model [18,19,20].   Δ G i γ ε represents the Gibbs free energy difference between γ f c c ε h c p phase of component i. β is the magnetic parameter related to the composition. T n e l l : the Nell temperature.
ParametersCalculation Formula and Value
Δ G F e γ ε 431.97   J / m o l
Δ G M n γ ε 3473.32 T   J / m o l
Δ G A l γ ε 4944.9 T   J / m o l
Δ G S i γ ε 2994   J / m o l
Δ G C γ ε 22,166   J / m o l
Δ G F e A l γ ε 3326.28   J / m o l
Δ G F e S i γ ε 1780   J / m o l
Δ G F e C γ ε 42,500   J / m o l
Δ G M n S i γ ε 1780   J / m o l
Δ G M n C γ ε 26,910   J / m o l
Δ G F e M n γ ε 9135.5 + 15,282.1 X M n   J / m o l
β γ 0.7 X F e + 0.62 X M n 0.64 X F e X M n 4 X C
β ε 0.62 X M n 4 X C
T n e l l γ 580 X M n   K
T n e l l ε 250 ln X M n 4750 X M n X C 6.2 X A l + 13 X S i + 720   K
Table 4. Parameters related to temperature adopted for the SFE (stacking fault energy) calculation of experimental steels. Xi” the mole fraction of component i. τ = T / T n e l l
Steel T / ° C X M n X C X A l X S i X F e β γ β ε T n e l l γ T n e l l ε τ f τ Δ G γ ε
1#6500.1700.0220.1280.0080.6720.4150.017153.098.611.948−42.22770
7500.1680.0330.1300.0080.6610.364−0.028152.897.441.951−43.25850
8500.1650.0330.1320.0070.6630.364−0.030152.795.721.951−43.39864
10500.1630.0330.1340.0070.6630.364−0.031152.794.541.951−43.55877
2#-0.1790.0290.0300.0080.7530.434−0.005153.6103.81.939−39.9199.6
Table 5. SFE of 1# steel under solid solution treatment at different temperatures (mJ/m2).
Steel650 °C750 °C850 °C1050 °C
1#60.5664.1864.9465.61
2#24.7024.7024.7024.70
Publisher’s Note: MDPI stays neutral with regard to jurisdictional claims in published maps and institutional affiliations.

