Article

Kinetic Aspects of Phosphorus Removal from Electromagnetically Levitated 600 MPa Steel Droplets

1
Faculty of Metallurgical and Energy Engineering, Kunming University of Science and Technology, Kunming 650093, China
2
Department of Materials Science and Engineering, University of Toronto, Toronto, ON M5S 3E4, Canada
3
Kunming Key Laboratory of Energy Materials Chemistry, Yunnan Minzu University, Kunming 650500, China
*
Author to whom correspondence should be addressed.
Metals 2021, 11(9), 1460; https://doi.org/10.3390/met11091460
Submission received: 21 July 2021 / Revised: 12 September 2021 / Accepted: 13 September 2021 / Published: 15 September 2021

Abstract

:
A kinetic model was developed to study the dephosphorization of 600 MPa steel droplets under electromagnetic levitation conditions. The relationships which were derived from the model between dephosphorization and the influence of temperature and gas flow rate were in good agreement with experimental data. Both temperature and gas flow rate were conducive to the evaporation of phosphorus, with the effect of temperature having a greater influence than that of the gas velocity. The results show that the rate-controlling step for the dephosphorization process was diffusion within the gas phase. This work aims to provide a theoretical basis for process optimization during the dephosphorization of 600 MPa steel.

1. Introduction

Steel is a critical material used in the construction industry, and this has a significant effect on industrial development. With the continuous innovation and development of the construction industry, the market demand for steel has increased, and the performance requirements for steel by the industry have also increased [1]. A key factor that affects the performance is steel strength, including yield strength and tensile strength [1]. Since regular strength steel can no longer meet the requirements of the market, 600 MPa steel has been developed. Compared with low-strength steels such as HRB335, HRB400 and HRB500, the use of 600 MPa steel has decreased consumption by 73.3%, 44.4%, and 19.5%, respectively [2]. However, the presence of phosphorus impurity in the steel will result in the formation of Fe3P, which adversely affects the plasticity and toughness properties. This in turn increases steel brittleness, decreases the cold formability and has a negative effect on weldability of the steel [3,4].
Generally, phosphorus impurities are removed by hot metal pretreatment or during refining in the steelmaking furnace. For example, small tapping troughs have been used to conduct the dephosphorization of molten iron [5] as well as pretreatment in the torpedo car [6]. Phosphorus removal can also be achieved by oxidation reactions during steel refining in the top-blown oxygen converter [7]. Compared with the top-blown vessel, Diaz et al. [8] have shown that the oxidation reaction of phosphorus is more intense when using a bottom-blown oxygen converter. The Lance Bubbling Equilibrium (LBE) method, which involved top and bottom combined blowing, further improved the effect of molten steel dephosphorization [9]. Later, the Baosteel Group independently developed the BOF Refining Process (BRP) for the production of low-phosphorus steel. This process belongs to the converter dual process technology, which means that the dephosphorization converter and the decarburization converter operate simultaneously to produce the target steel grade [10]. Most of the above technologies can achieve dephosphorization, but the dephosphorization process is also affected by some problems, such as phosphorus reversion to the steel, excessive splashing, and adverse refractory reactions [11,12]. In comparison with the traditional dephosphorization methods, electromagnetic levitation (EML) is a container-less refining technology, in which the molten metal does not have contact with refractories and splashing problems are avoided [13]. With levitated droplets, the liquid metal can be easily exposed to different gas environments and reactions can be investigated at very high temperatures, e.g., 3000 K; surface renewal is fast due to electromagnetic stirring, thus conditions are highly favorable for fast reactions [14]. Thus, EML provides an excellent approach for investigating the kinetic aspects of refining reactions at elevated temperatures. It also has the potential to provide a new approach for the removal of phosphorus from high strength steels.
In view of the unique attributes associated with EML, the technique has been utilized for the measurement of thermophysical and thermochemical properties of liquid metals over extended temperature ranges, including surface tension, density, super-cooling phenomena, gas-metal reactions and solute interactions [15,16,17,18,19]. However, there are only a few studies that focus on the removal of impurities from metal alloys under EML conditions. Specifically, Wu et al. [20] studied the effect of thermal diffusion on the decarburization kinetics of nickel-based alloy with a Reynolds number in the range of 2–100 under EML conditions. Gao et al. [21] investigated the kinetics of Fe-Cr-C droplet decarburization using a Computational Fluid Dynamics (CFD) model based on EML experimental conditions. Le et al. [22] studied the kinetics of phosphorus removal from metallurgical grade silicon by means of chemical reactions under EML conditions. Shi et al. [23] investigated the effect of temperature on dephosphorization of ferrosilicon. Recent work has reported on the kinetic aspects of phosphorus removal from metallurgical grade silicon by evaporation under EML conditions [24]. However, there is an absence of relevant research on phosphorus removal from high strength steel under EML conditions. Therefore, in the present work, the aim is the development of a mass transfer model for the removal of phosphorus from high-strength alloy steel droplets. The mass transfer coefficients developed can be used to determine the limiting step for the dephosphorization of 600 MPa steel. In order to check the validity of the derived model, the theoretical values were compared with experimental results from the literature. This work should provide a theoretical basis for process optimization during the dephosphorization of 600 MPa steel.

2. Experimental Aspects
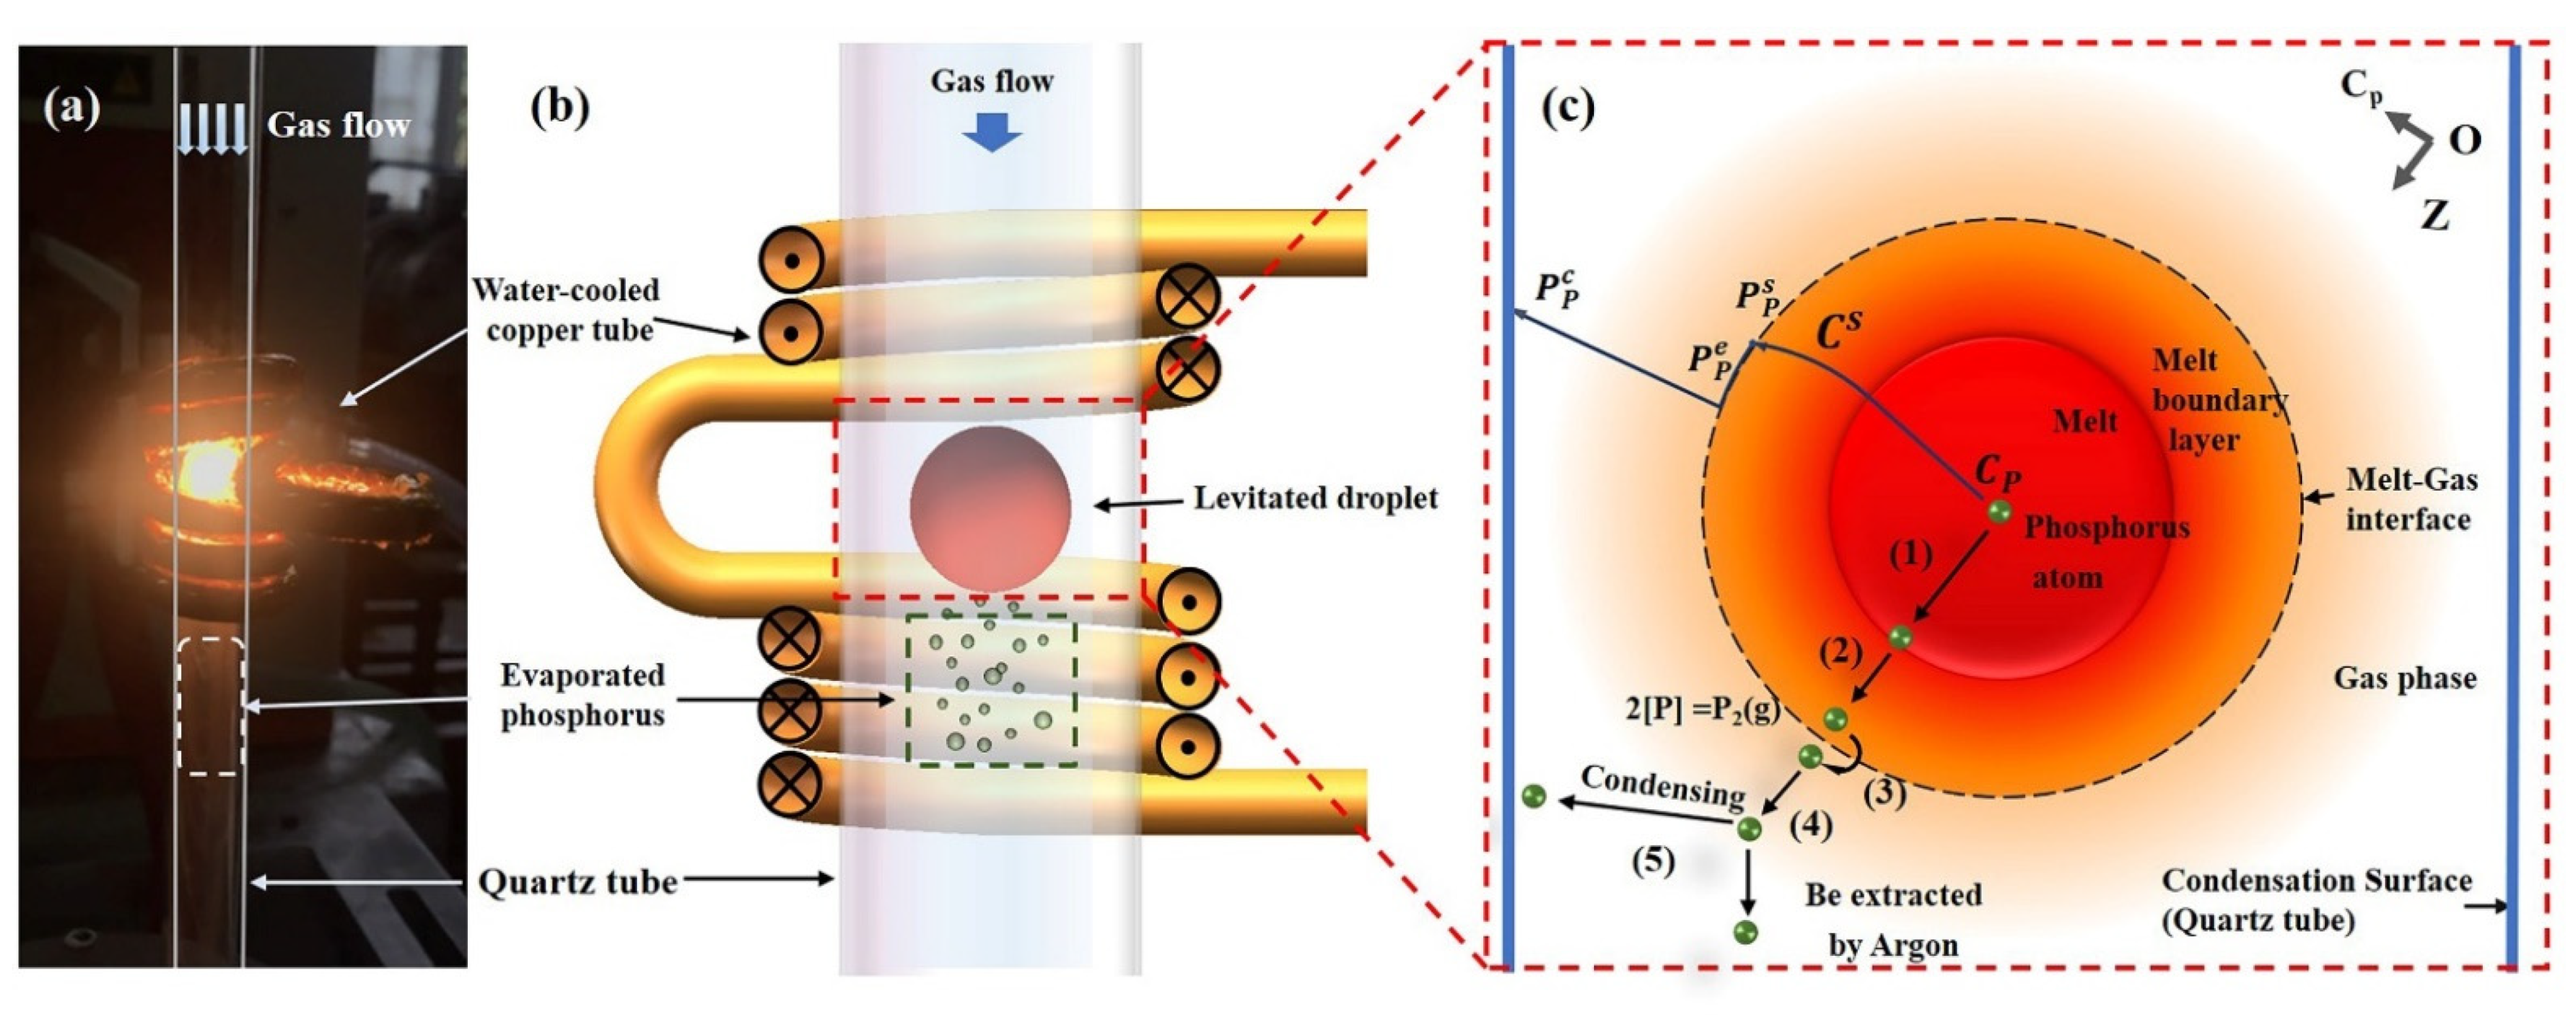
2.1. Equipment

A photograph of the levitated droplet and a diagram of the levitation cell are shown in Figure 1a,b. Dephosphorization experiments of 600 MPa steel were carried out in a levitation facility that consisted of four components: the power supply provided by Shuangping Power Technology Co., Ltd. in Shenzhen, China, a gas control train designed by our team, a temperature measurement unit, and the levitation cell. The frequency of the power input was 320 kHz. The gas train consisted of pure argon (99.999%) from which oxygen and moisture were removed before passing through a gas flow meter and into a mixing vessel. Temperatures were measured with a two-color IR pyrometer which was provided by Chi Rui manufacturer in Shaanxi, China. The levitation system consisted of a levitation coil, a quartz tube, an aluminum-based rotating platform, a copper crucible for quenching, and a sample delivery rod.

2.2. Procedure

The samples for levitation consisted of 600 MPa steel in the weight range 1.0–1.5 g, and the main components are shown in Table 1. Prior to an experiment, argon was passed through the reaction chamber for 3 min to ensure the removal of other gases. Once levitated, the temperature of the levitated sample increased from room temperature to 2273 K within about 60 s. To study the effects of gas velocity and refining temperature on the removal of phosphorus, gas velocities of 0.0414 m/s, 0.0829 m/s, and 0.1243 m/s were selected, and temperatures were controlled at various values in the range 1723 K to 2223 K. At the end of an experiment, the power was switched off and the sample dropped into the copper quenching crucible, after which the sample was digested by aqua regia and the concentration of phosphorus in the sample determined by ICP-OES analysis.

3. Results and Discussion

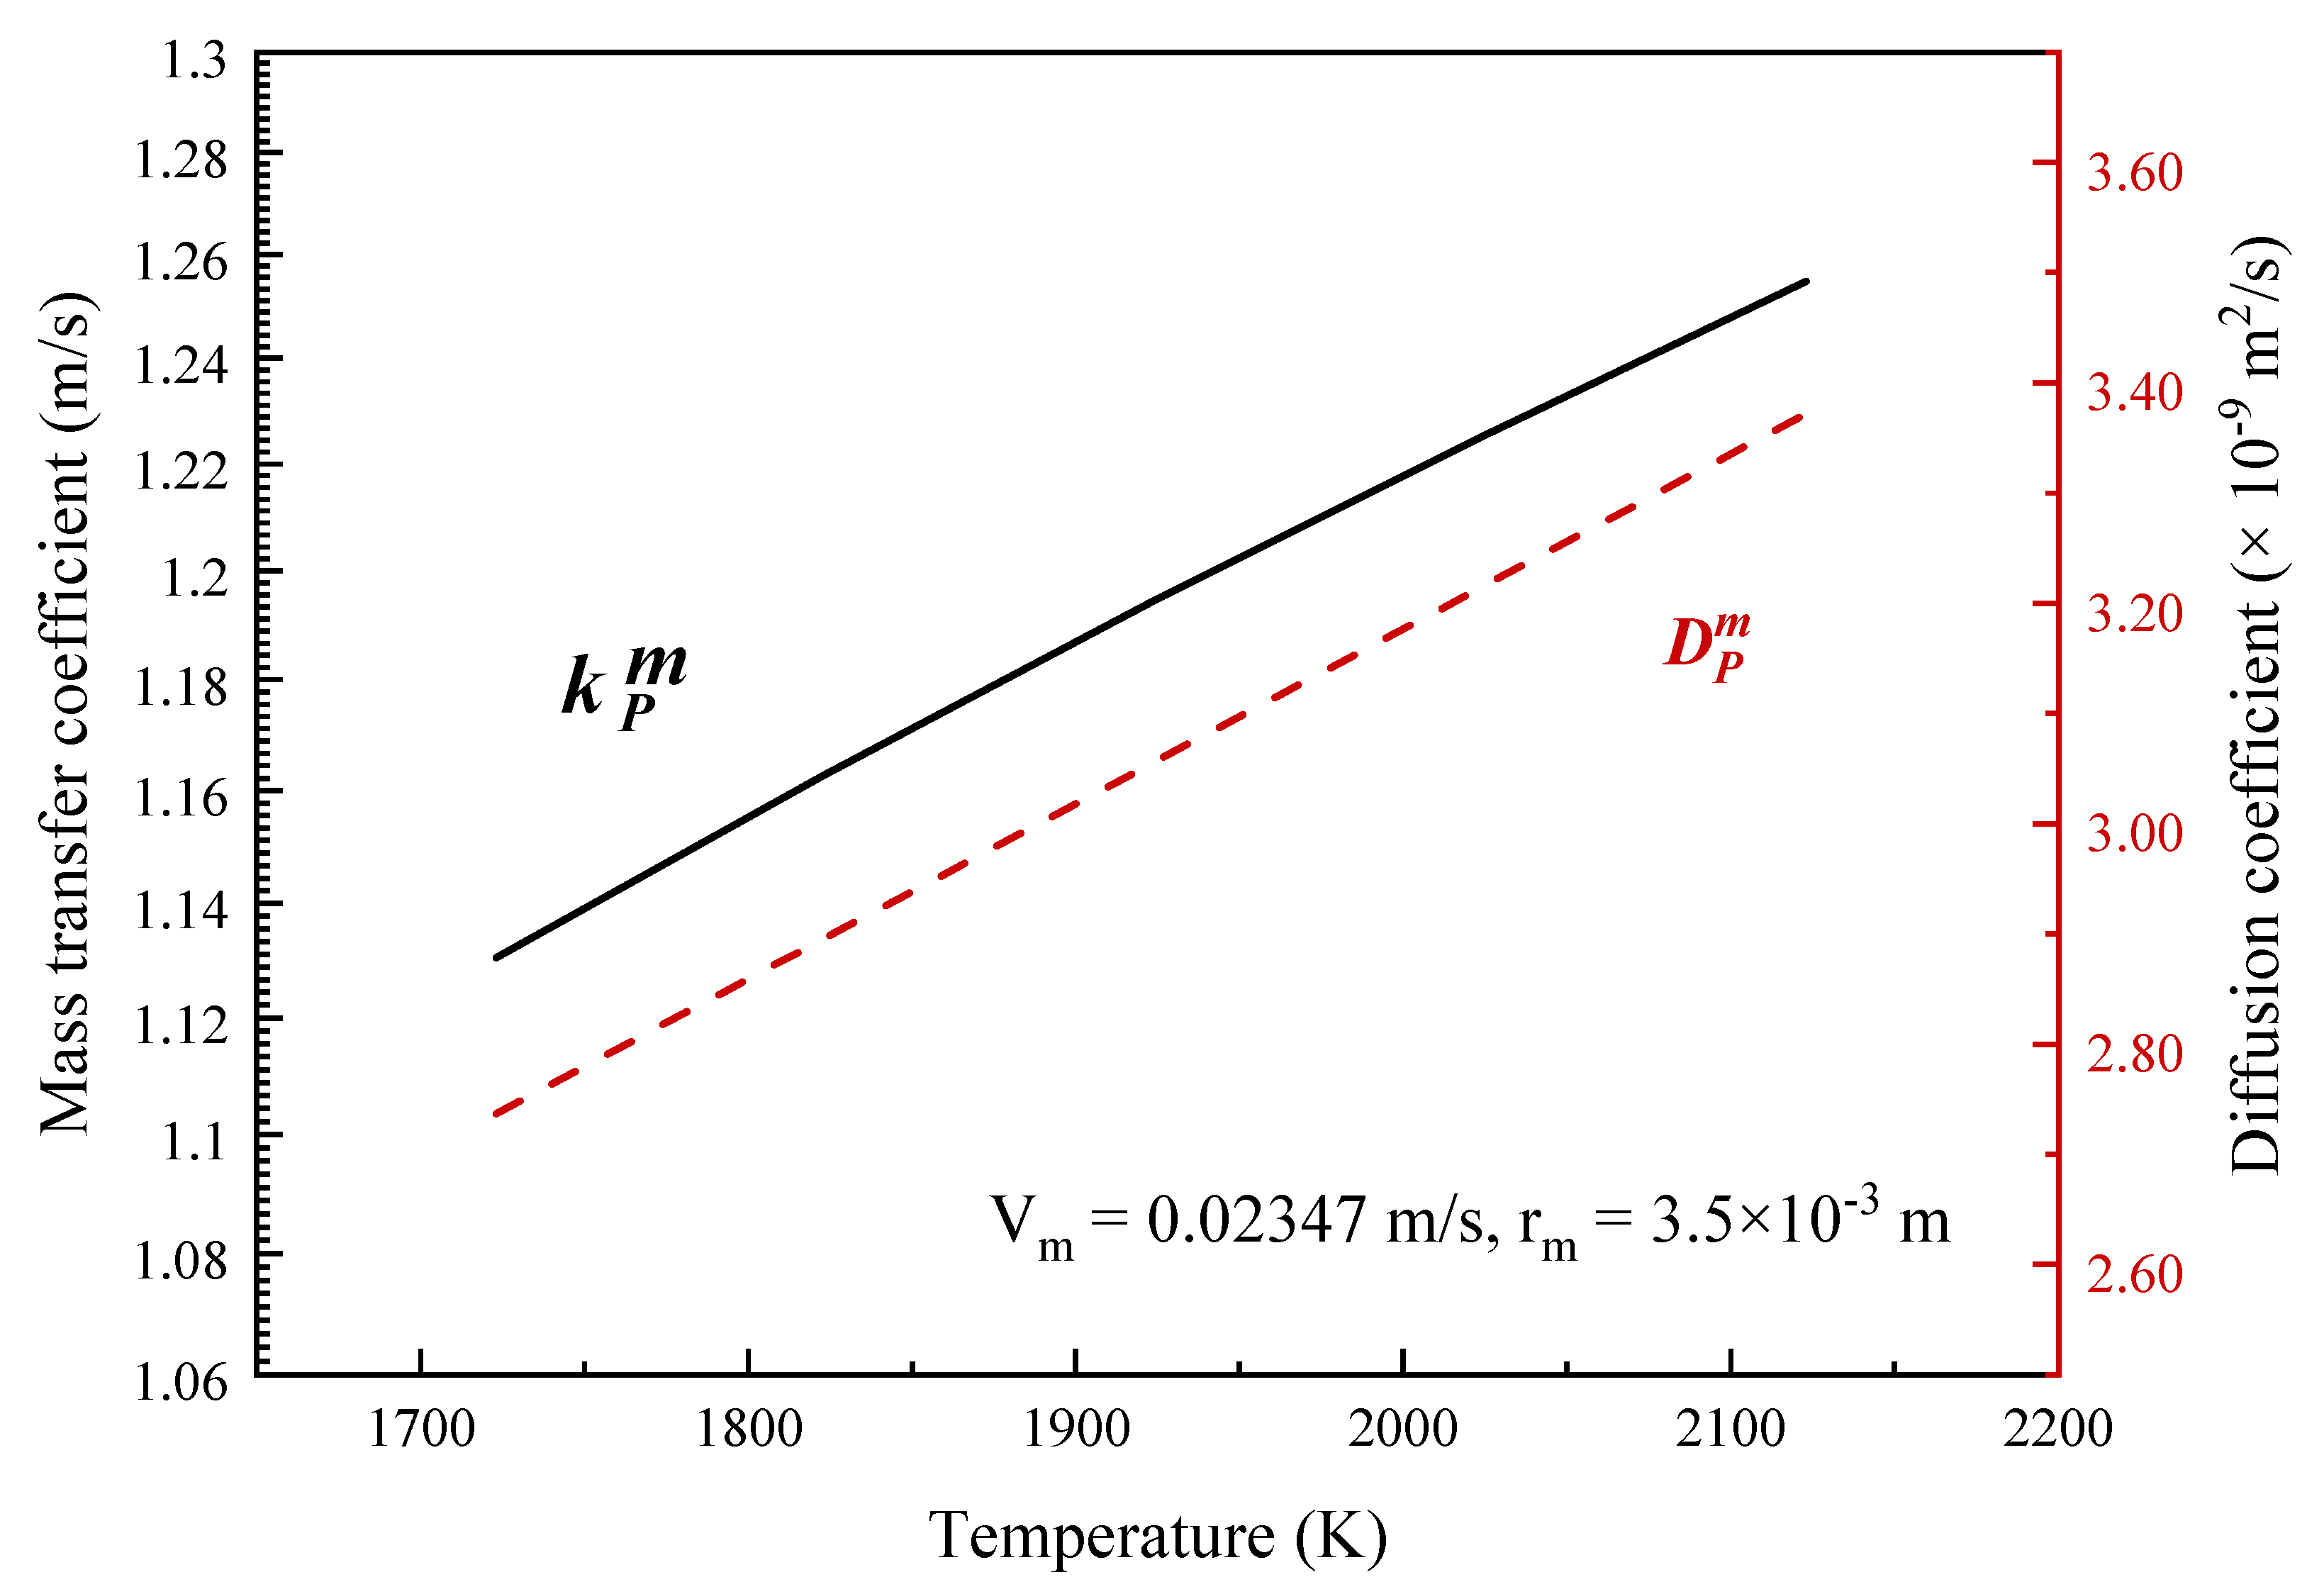
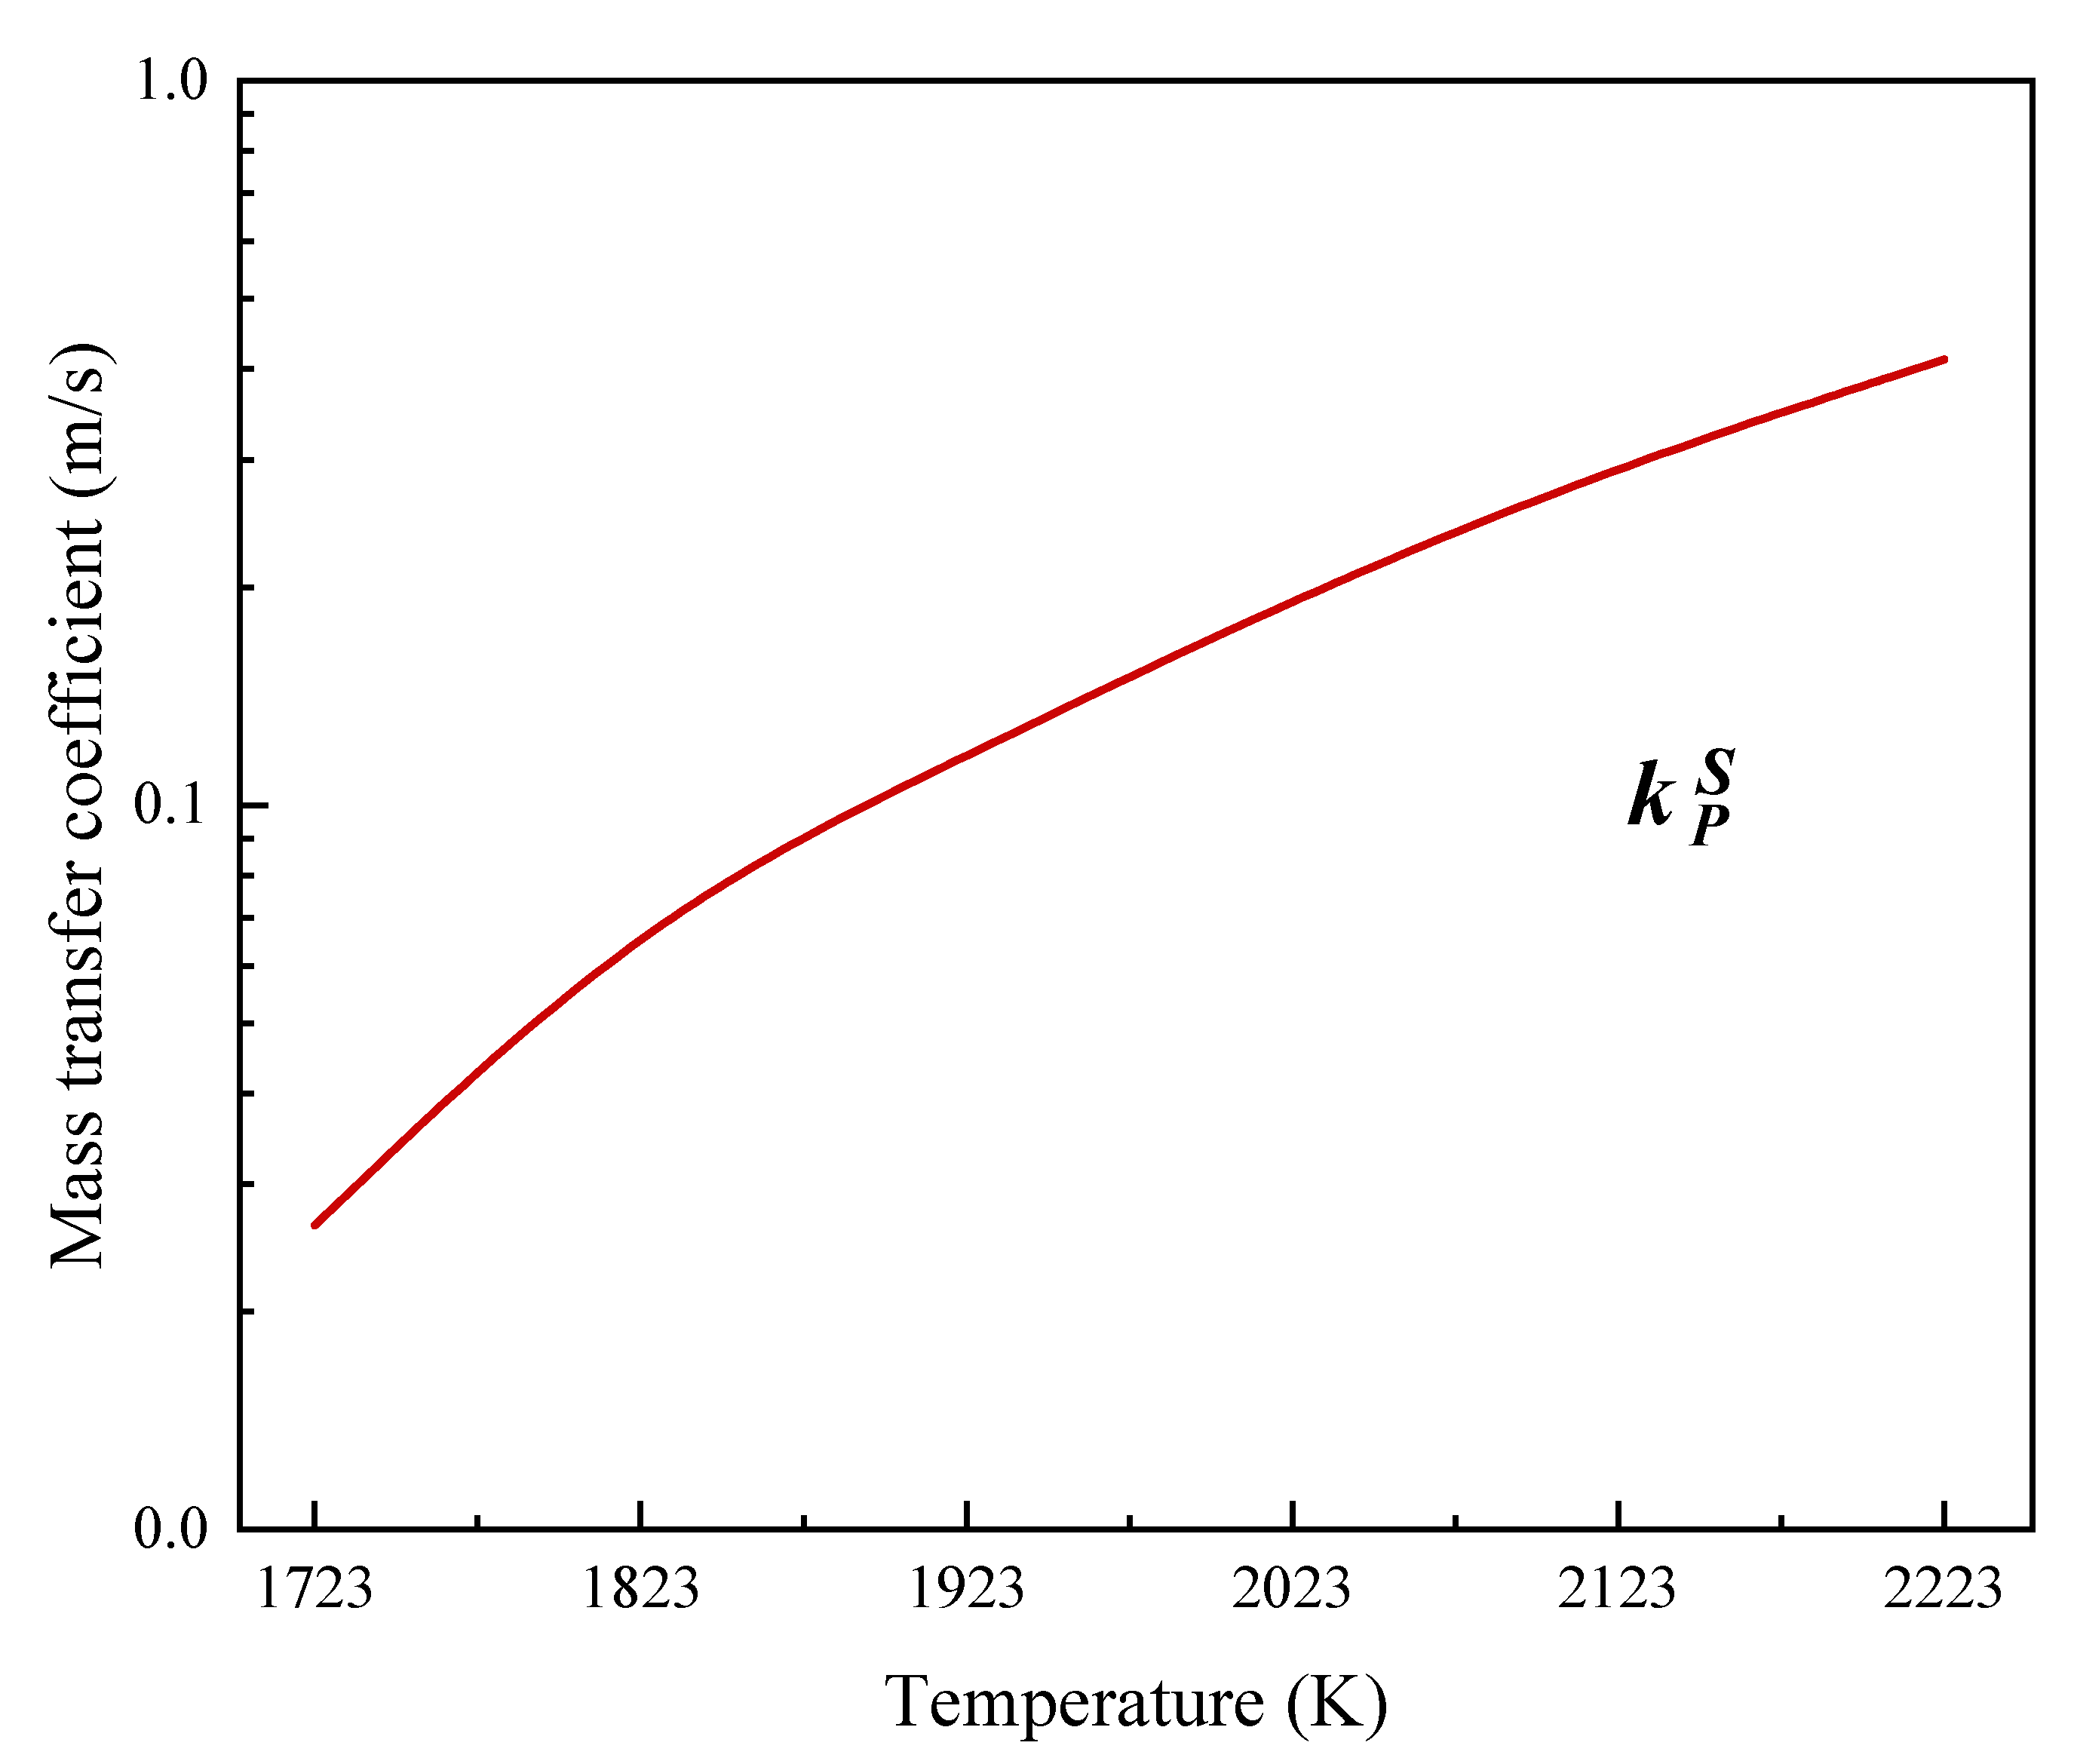
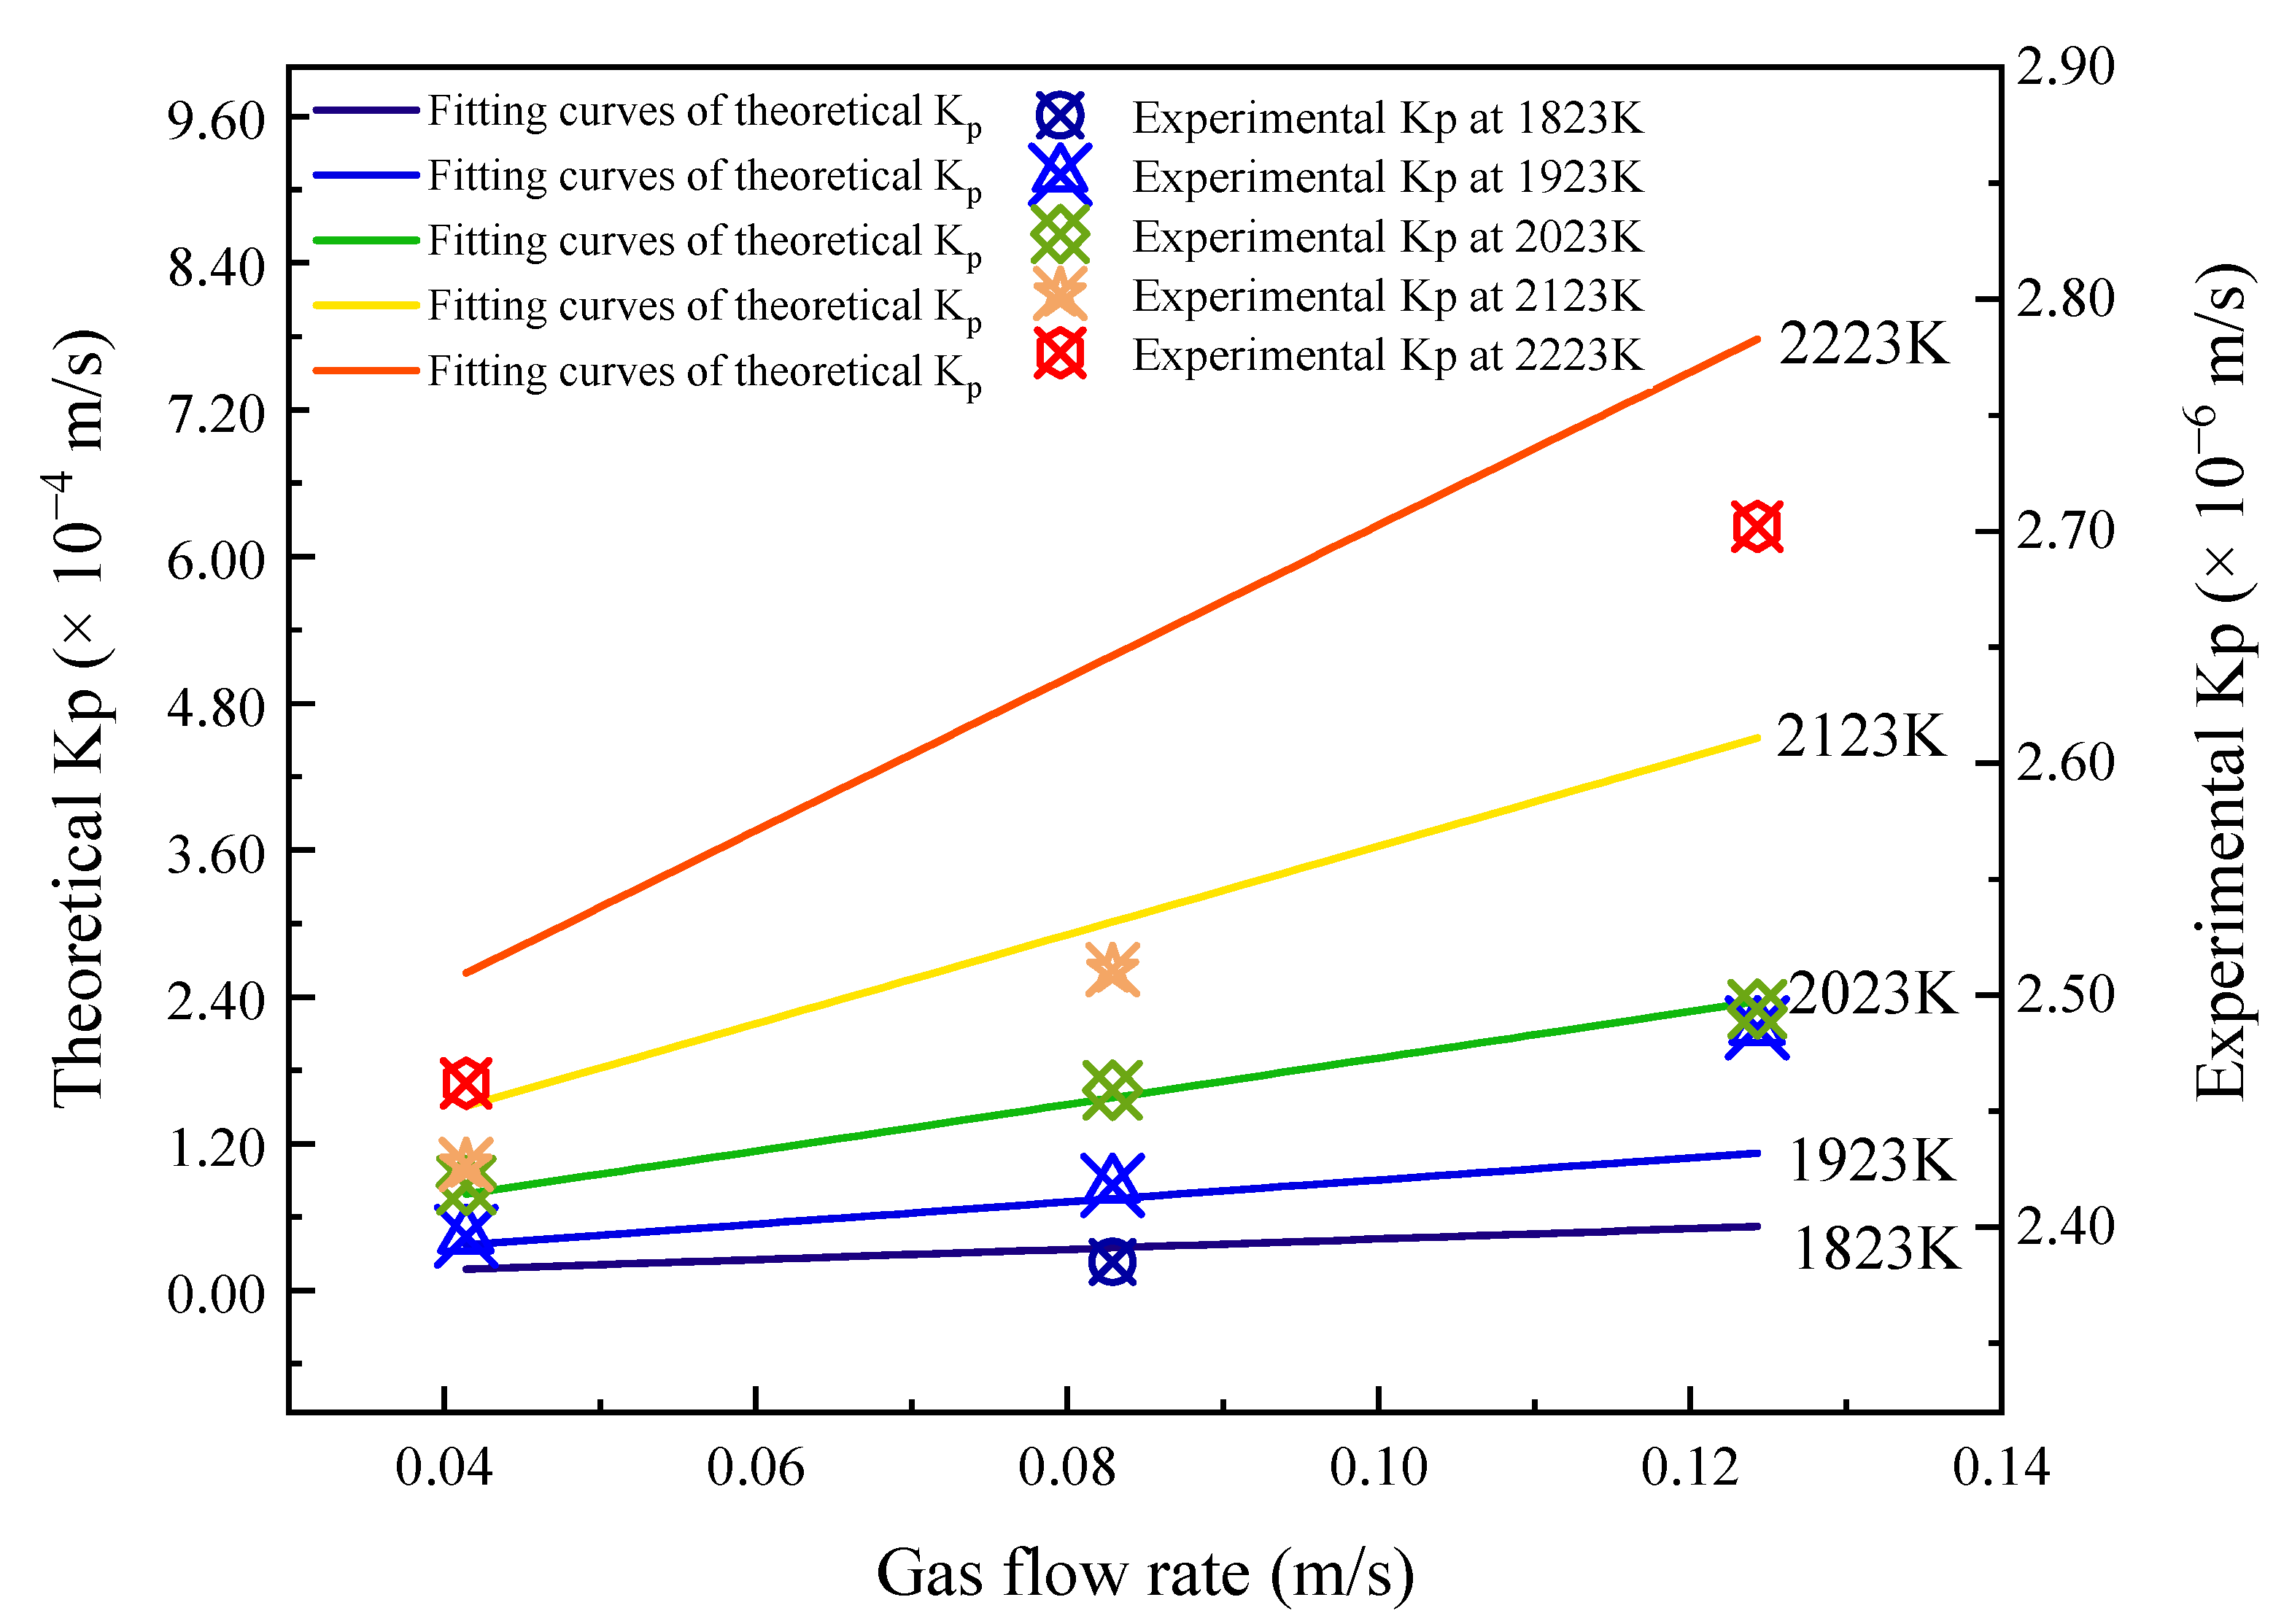
3.1. Mass Transfer Kinetic Model

A schematic representation of the dephosphorization process is shown in Figure 1c. Under high temperature conditions, phosphorus can be continuously evaporated from the surface of the melt and collect in the gas phase before condensing into large particles that are discharged with the protective gas. Assuming that the dephosphorization process is not affected by other elements, the following five steps can be used to describe the dephosphorization process: (1) migration of phosphorus within the melt to the boundary layer; (2) diffusion within the boundary layer to the surface; (3) evaporation from the surface of the droplet; (4) diffusion within the gas phase; and (5) condensation on the inner wall of the quartz tube or removal from the reaction chamber with the protective gas.
During the refining process, the temperature of the metal sample was controlled in the range 1823–2223 K. Since the droplet was subjected to electromagnetic stirring, the distribution of dissolved elements is regarded as uniform, and therefore step (1) was not regarded as a limiting step. During step (5), phosphorus condensed on the inner wall of the reaction tube or was removed by the gas flow. The condensation surface area of the quartz tube was 6.786 × 10⁻² m2, and the surface area of the metal droplet was 1.382 × 10⁻⁴ m2, thus the condensation surface was 500 times larger than the surface area of the droplet. In addition, the gas flow rate varied between 0.0414 m/s and 0.1243 m/s, so step (5) was also not considered to be a restrictive step. For these reasons, the rate-controlling step for the dephosphorization of 600 MPa steel was considered to be step (2), (3), or (4).
During phosphorus evaporation, the phosphorus content on the surface of the droplet is lower than that within the bulk of the melt, which produces a concentration gradient that promotes phosphorus diffusion within the boundary layer from bulk melt to the melt surface. Additionally, because of the difference in phosphorus partial pressure within the gas around the melt surface and the bulk gas phase, there is a pressure differential, which promotes the transportation of phosphorus into the bulk gas.
In step (2), the diffusion of phosphorus within the melt boundary layer can be calculated from the following expression [25]:
J i m = k i m ( C i C i s )
where C i and C i s are the phosphorus contents in the bulk melt and at the melt surface, mol/m3; k i m is the mass transfer coefficient within the boundary layer, m/s.
k i m is calculated by the following formula [25]:
k i m = 8 D i m v m π r m
where r m is the radius of the droplet, m; v m is the surface velocity, m/s; D i m is the diffusion coefficient of phosphorus in the droplet, m2/s.
In Equation (2), v m can be calculated through the relation of v m = U 0 · A , where A is the droplet surface area, m2. Szekely et al. [26] provided the following empirical formula for the characteristic velocity of an induction stirred melt:
U 0 J 0 σ f ρ μ 0 L 2
where J 0 is the current through the coil, A; σ is the conductivity of the droplet, S/m; f is the current frequency, kHz; ρ is the metal density, g/m3; μ 0 is the space permeability, H/m; L is the droplet diameter (6.65 × 10⁻³ m).
Knowing σ = 7.143 × 10⁵ S/m [27], ρ = 7.9 g/cm3 [28] and other test conditions, v m is calculated to have a value of 0.0235 m/s. The velocity of the melt surface is relatively high, and the entire melt surface can be completely melted in a few seconds during EML refining.
The relationship between D i m and the melt temperature is shown as Equation (4) [29]:
D i m = k B T 4 π μ S t e e l r P M P + M S t e e l 2 M P
where k B is Boltzmann constant, 1.38 × 10⁻²³ J/K; μ S t e e l is the viscosity of the 600 MPa steel droplet, Pa∙s; r P is the radius of the phosphorus atom, m; M P is the molar mass of phosphorus, kg/mol; M S t e e l is the molar mass of 600 MPa steel, kg/mol.
It can be concluded from the above formula that the phosphorus mass transfer coefficient in the boundary layer is related to droplet temperature, melt volume, and droplet size. The mass range of the levitated droplets in this study, is 1.0–1.5 g. The corresponding droplet radius is in the range 1.4457 × 10⁻³–3.5655 × 10⁻³ m, and the superficial area is between 2.6264 × 10⁻⁵ m2 and 1.5975 × 10⁻⁴ m2. This change in surface area has little effect on the calculation results, so the difference in surface melting speed caused by the surface area of the droplet can be ignored.
Figure 2 illustrates the effects of refining temperature on the diffusion coefficient and mass transfer coefficient of phosphorus in the boundary layer. With increase in the refining temperature from 1723 K to 2123 K, the diffusion coefficient increased from 2.737 × 10⁻⁹ to 3.372 × 10⁻⁹, and the mass transfer coefficient increased from 1.1304 to 1.2548.
In step (3), when evaporation of phosphorus occurs at the molten metal surface, the mass transfer molar flux can be expressed as [30]:
J i s = α p i e 2 π R T M i
where p i e is phosphorus partial pressure at equilibrium state, Pa; R is the ideal gas constant, 8.314 J/(mol∙K); α is the evaporation coefficient.
Since the metal droplet is levitated in argon and has no contact with refractory or other materials, the surface is not contaminated, and α can be assumed as 1 in this formula. T and G 0 are connected when phosphorus evaporates, and the relationship is shown in Equations (6) and (7) [31].
2 [ P ] = P 2 ( g )
G 0 = 139000   ( ± 2000 ) 43.4 ( ± 10.1 T ) ( J / m o l )
When the reaction is in equilibrium, the Gibbs free energy is expressed by the following formula:
G 0 = R T l n K = R T l n p i e / p 0 f i [ w t   p c t   i ]
where p 0 is the phosphorus gas pressure at standard state; f i is the activity coefficient of phosphorus in liquid 600 MPa Steel; [ w t   p c t   i ] is the content of phosphorus, converted to a molar concentration by the following formula:
[ w t   p c t   i ] = 100 M i ρ C i s
where ρ is the density of liquid steel, kg/m3.
Equations (8) and (9) are introduced into Equation (5) to obtain the expression of maximum molar flux:
J i s = 100 p 0 f i e x p ( G 0 / R T ) ρ M i 2 π R T C i s
or
J i s = k i s C i s
where k i s is the mass transfer coefficient of phosphorus during the surface evaporation process, m/s. The expression is as follows:
k i s = 100 p 0 f i exp ( G 0 / R T ) ρ M i 2 π R T
It can be seen from Equation (12) that the mass transfer coefficient during phosphorus evaporation is related to the droplet temperature, and the relationship is shown in Figure 3.
Figure 3 shows that the mass transfer coefficient increases from 2.63 × 10⁻² m/s to 2.95 × 10⁻¹ m/s when the temperature increases from 1723 K to 2123 K.
In step (4), the transport of phosphorus in the gas phase near the molten metal follows the principles of diffusion mass transfer and convective mass transfer. The relationship for the total molar flux of phosphorus in the gas phase is shown as [32]:
J i g = D i g R T d p i s d x + v g R T f ( p i s p i c )
where D i g is the diffusion coefficient of phosphorus in the gas phase, m2/s; p i s and p i c are the phosphorus partial pressures in the gas film boundary layer around and away from the droplet surface, respectively, Pa; x is the distance of phosphorus atom from the surface, m; v g is the phosphorus velocity, m/s; T f is the effective gas phase film temperature surrounding the droplet [33], K.
It is assumed that the main mechanism of mass transfer is convective [34] under the condition of high gas flow rate. Equation (13) can then be expressed as follows:
J i g = v g R T f ( p i s p i c )
The partial pressures p i s and p i e at the surface of the melt are equal in equilibrium, and p i c is close to zero in the bulk gas phase. By substituting Equations (8) and (9) into Equation (14), the following expression is obtained:
J i g = 100 v g M i p 0 f i exp ( G 0 / R T f ) R T f ρ C i s
or
J i g = k i g C i s
where k i g , the phosphorus mass transfer coefficient in the gas phase, m/s, can be expressed as:
k i g = 100 v g M i p 0 f i exp ( G 0 / R T f ) R T f ρ
Since the gas phase consists of pure argon at high flow rates, it is assumed that v g is equal to the argon flow rate, the values of which are v g 1   = 0.0414 m/s, v g 2   = 0.0829 m/s, and v g 3   = 0.1243 m/s.
In Figure 4, the mass transfer coefficient shows an upward trend when the refining temperature increases and the gas flow rate is kept constant. For example, when the gas flow rate is 0.0414 m/s, and the temperature increases from 1723 K to 2123 K, the phosphorus mass transfer coefficient increases from 7.78 × 10⁻⁶ m/s to 1.51 × 10⁻⁴ m/s. At 2123 K, when the gas velocity increases from 0.0414 m/s to 0.1243 m/s, the mass transfer coefficient increases from 1.51 × 10⁻⁴ to 4.52 × 10⁻⁴. Therefore, both temperature and gas flow rate are conducive to the transport of phosphorus in the gas phase, and the influence of temperature is greater than that of flow rate. This is consistent with the Arrhenius relationship and the exponential dependence of diffusion coefficients and temperature.
The total mass transfer coefficient of phosphorus is the sum of the mass transfer coefficients of each step, the relationship for which is as follows:
k i = ( 1 k i m + 1 k i s + 1 k i g ) 1
According to the above expression, both the mass transfer of phosphorus in the boundary layer and on the surface are influenced by temperature, and when it comes to the gas phase the influencing factors are temperature and gas flow rate. Thus, the main influencing factor for the total dephosphorization process is temperature, followed by gas flow rate.
Figure 5 gives information about the effect of temperature on the mass transfer coefficient of phosphorus in the melt boundary layer, at the melt surface, the gas phase and for the total process. The dotted box in Figure 5a indicates the values in the gas phase and during the whole process. As the values are very close, the details are enlarged in Figure 5b. It is evident that the values for the total mass transfer coefficient are almost identical with the values within the gas phase. According to the calculation results, the order of magnitude of the difference is 10−6. From 1723 K to 2123 K, the mass transfer coefficient of phosphorus increased from 7.78 × 10⁻⁶ to 1.51 × 10⁻⁴, from 1.55 × 10⁻⁵ to 3.01 × 10⁻⁴, and from 2.33 × 10⁻⁵ to 4.52 × 10⁻⁴, when the gas flow rate was 0.0414 m/s, 0.0829 m/s and 0.1243 m/s, respectively. At 1723K and increasing gas flow rate, the corresponding mass transfer coefficient increases from 7.78 × 10⁻⁶ to 2.33 × 10⁻⁵. It is concluded, therefore, that under electromagnetic levitation conditions, the removal of phosphorus from 600 MPa steel is limited by diffusion within the gas phase.

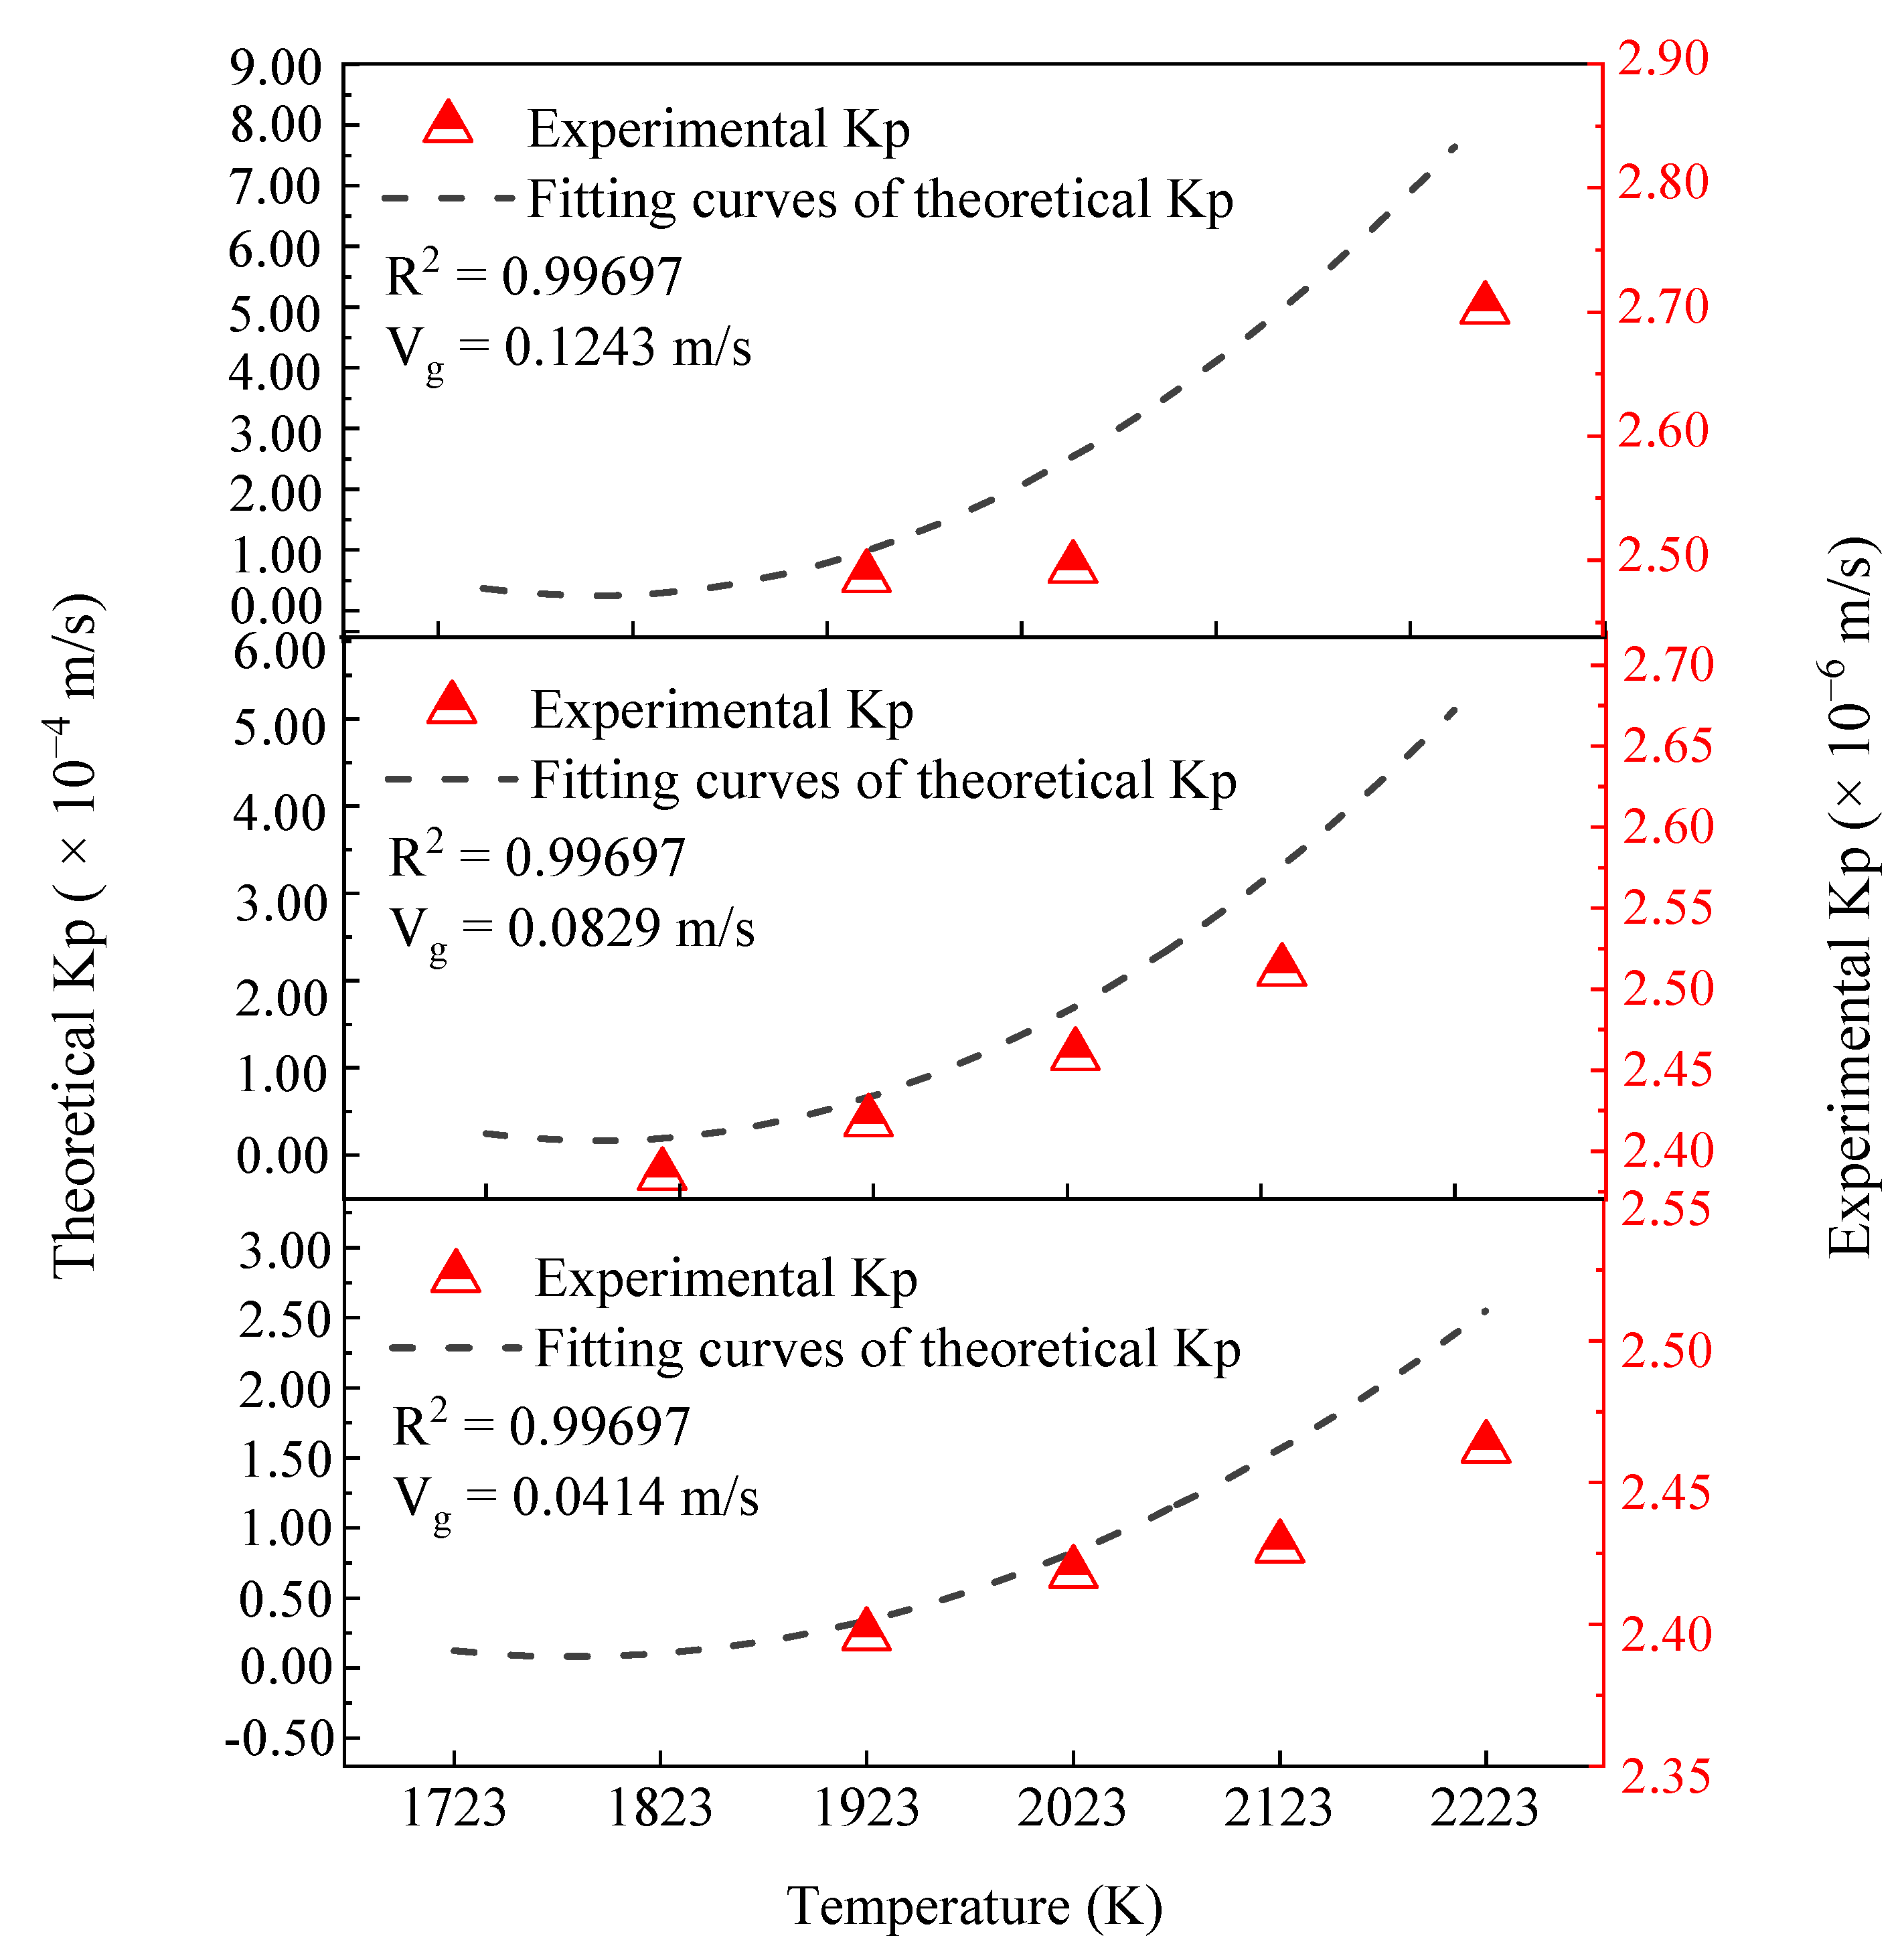
3.2. Experimental Mass Transfer Coefficients

It can be seen from the above analysis that dephosphorization of the levitated steel droplet is influenced by both temperature and gas flow rate. To further study the influence of these two factors, the following formula can be used to determine experimental mass transfer coefficients [35]:
2.303 log C P t C P 0 = k P · A V ( t t 0 )
where C P 0 and C P t are the phosphorus contents at 0s and ts, respectively, mol/L; A is the evaporation area of the metal droplet, m2; V is the volume of molten metal, m3; t t 0 is the refining time, s.
The phosphorus content in 600 MPa steel after refining at different temperatures and gas flow rates are listed in Table 2. The droplets were levitated for 2700 s when the gas flow rates were 0.0829 m/s and 0.1243 m/s. When the gas flow rate was 0.0414 m/s, the levitation time was 3200 s. The corresponding experimental mass transfer coefficients are shown in Table 3.
Figure 6 shows the influence of temperature on the mass transfer coefficients of phosphorus in 600 MPa steel under different gas flow rate conditions. It should be noted that the scales on the left-hand axis for the theoretical values are markedly different from the scales on the right-hand axis for the experimental results. The theoretical values increase significantly with the increase of temperature at each of the different gas velocities. From 1723 K to 2223 K, the theoretical value under three gas flow rates increases from 1.737 × 10⁻⁵ m/s to 2.261 × 10⁻⁴ m/s, from 3.474 × 10⁻⁵ m/s to 5.190 × 10⁻⁴ m/s, and from 5.209 × 10⁻⁵ m/s to 7.780 × 10⁻⁴ m/s, respectively. With the increase in temperature, the experimental value also shows an upward trend. At the lowest and the highest gas flow rate, the experimental value increases from 2.396 × 10⁻⁶ m/s to 2.462 × 10⁻⁶ m/s and from 2.486 × 10⁻⁶ m/s to 2.702 × 10⁻⁶ m/s, respectively, when the temperature increases from 1923 K to 2223 K. At the intermediate gas flow rate, the experimental value increases from 2.385 × 10⁻⁶ m/s to 2.511 × 10⁻⁶ m/s, when the temperature rises from 1823 K to 2123 K. It is apparent that both theoretical and experimental values have the same trend, which supports the reliability of the kinetic model for mass transfer. However, there is a deviation between the theoretical values and the experimental values, which may be due to some uncertain factors associated with the results obtained from the levitation experiments.
Figure 7 illustrates the influence of gas flow rate on the mass transfer coefficient of phosphorus in 600 MPa steel droplets. At constant temperature, increasing the gas flow rate improves the theoretical mass transfer coefficient, and the higher the temperature, the greater the effect of gas flow. At 1823 K and 1923 K, when the gas flow rate increases from 0.0414 m/s to 0.1243 m/s, the corresponding theoretical value increases by 3.47 × 10⁻⁵ m/s and 7.47 × 10⁻⁵ m/s, respectively. At 2223 K, the increasing trend of the theoretical value is 5.18 × 10⁻⁴ m/s which is 15 times and 7 times greater than that at 1823 K and 1923 K, respectively. Hence, compared with the lower refining temperature, the increase in gas flow rate at a higher refining temperature has a more obvious effect on increasing the mass transfer coefficient. When keeping the refining temperature constant, and increasing the gas flow rate from 0.0414 m/s to 0.1243 m/s, the corresponding increase in the theoretical value is smaller than that found when the refining temperature increases from 1827 K to 2223 K and the gas flow rate is kept constant. Based on this behavior, the influence of temperature on the mass transfer coefficient of phosphorus in 600 MPa steel is significantly greater than that of the gas flow rate. With the increase in gas flow rate, the experimental values also show an upward trend similar to that of the fitting curves for the theoretical values. This provides further support for the reliability of the kinetic mass transfer model. Again, there is a deviation between the theoretical values and the experimental values, which may be due to some uncertainties associated with the levitation process.

4. Conclusions

In this study, a kinetic model of phosphorus mass transfer associated with levitated droplets of 600 MPa steel was developed in order to evaluate the influence of temperature and gas flow rate and determine the limiting factors in the dephosphorization process. The findings are summarized below:
  • Under electromagnetic levitation conditions, the mass transfer coefficient associated with the dephosphorization of 600 MPa steel droplets is increased with higher temperatures and gas flow rates.
  • Compared with the lower refining temperature, the same increase in gas flow rate at higher refining temperature produces a greater increase in the mass transfer coefficient.
  • The influence of temperature on the removal of phosphorus is greater than that of gas flow rate.
  • It is concluded that the limiting step for the dephosphorization process is diffusion within the gas phase.

Author Contributions

The research presented here was carried out in collaboration between all authors. Conceptualization, G.Z.; methodology, Q.J.; validation, Q.J.; resources, G.Z., Y.Y., A.M. and L.G.; formal analysis, Q.J.; writing—original draft preparation, Q.J.; writing—review and editing, G.Z., Y.Y. and A.M.; supervision, G.Z., Y.Y. and A.M. All authors have read and agreed to the published version of the manuscript.

Funding

This work was financially supported by the Provincial Science and Technology Department (No. 2018IA055), Scientific Research Fund Project of Yunnan Education Department (No.2021J0652), Yunnan Fundamental Research Projects (No.202101AU070088) and the Analysis and Testing Foundation of Kunming University (No.2020P20193102006 and No.2020P20171102004).

Data Availability Statement

The data that support the findings of this study are available from the authors upon reasonable request.

Conflicts of Interest

The authors declare no conflict of interest.

References

  1. Koskenniska, S.; Kaijalainen, A.; Pikkarainen, T.; Mehtonen, S.; Porter, D.; Kömi, J. Effect of As-Cast Structure and Macrosegregation on Mechanical Properties in Direct-Quenched Low-Alloy Ultrahigh-Strength Steel. Met. Mater. Trans. B 2021, 52, 95–106. [Google Scholar] [CrossRef]
  2. Zhang, J. Research on Composition and Controlled Cooling Process of 600 MPa Grade High Strength Rebar Steel. Ph.D. Thesis, University of Science and Technology Beijing, Beijing, China, 2016. [Google Scholar]
  3. Hui, Y.J.; Chen, B.; Chen, Y.; Xiao, B.L.; Zhang, D.W.; Li, X.L. Development of 600 MPa grade Nb-Ti microalloyed high formability crossbeam steel. J. Iron Steel Res. Int. 2018, 30, 399–404. [Google Scholar]
  4. Wang, H.H.; Li, G.Q.; Zhao, D.; Ma, J.H.; Yang, J. Dephosphorization of high phosphorus oolitic hematite by acid leaching and the leaching kinetics. Hydrometallurgy 2017, 171, 61–68. [Google Scholar] [CrossRef]
  5. Luo, Z.G. Simulation of Dephosphorization Process of Hot Metal Pretreatment with Converter Slag. Ph.D. Thesis, Northeastern University, Xi’an, China, 2003. [Google Scholar]
  6. Zhang, X.S. Basic Principle of Powder Injection Metallurgy; Metallurgical Industry Press: Beijing, China, 1998; pp. 287–290. [Google Scholar]
  7. Tian, Z.H.; Li, B.H.; Zhang, X.M.; Jiang, Z.H. Double Slag Operation Dephosphorization in BOF for Producing Low Phosphorus Steel. J. Iron Steel Res. Int. 2009, 16, 6–14. [Google Scholar] [CrossRef]
  8. Martín, M.; Rendueles, M.; Diaz, M. Steel-Slag Mass Transfer in Steel Converter, Bottom and Top/Bottom Combined Blowing Through Cold Model Experiments. Chem. Eng. Res. Des. 2005, 83, 1076–1084. [Google Scholar] [CrossRef]
  9. Ma, C. Numerical Simulation of Top Bottom Combined Blown Converter Steelmaking Process. Master’s Thesis, Northeastern University, Xi’an, China, 2003. [Google Scholar]
  10. Lu, C.S.; Xu, A.J.; Tian, N.Y.; Qu, J.; Chen, J. Analysis of Converter Dephosphorization Decarbonization Smelting Process and Its Logistics Parameters; Metallurgical Industry Press: Beijing, China, 2005; pp. 130–135. [Google Scholar]
  11. Coley, K.S.; Cu, K.; Dogan, N. Dephosphorization Kinetics between Bloated Metal Droplets and Slag Containing FeO: The Influence of CO Bubbles on the Mass Transfer of Phosphorus in the Metal. Met. Mater. Trans. B 2017, 48, 2984–3001. [Google Scholar]
  12. Jung, H.H.; Joo, H.P. Effect of Direct Reduced Iron (DRI) on Dephosphorization of Molten Steel by Electric Arc Furnace Slag. Met. Mater. Trans. B 2018, 49, 3381–3389. [Google Scholar]
  13. Gao, L.; Shi, Z.; Li, D.H.; Zhang, G.F.; Yang, Y.D.; McLean, A.; Chattopadhyay, K. Applications of Electromagnetic Levitation and Development of Mathematical Models: A Review of the Last 15 Years (2000 to 2015). Met. Mater. Trans. B 2016, 47, 537–547. [Google Scholar] [CrossRef]
  14. Yan, P.; Zhang, G.F.; Yang, Y.D.; McLean, A. Numerical Investigation of the Position and Asymmetric Deformation of a Molten Droplet in the Electromagnetic Levitation System. Met. Mater. Trans. B 2020, 51, 247–257. [Google Scholar] [CrossRef]
  15. Amore, S.; Brillo, J.; Egry, I.; Novakovic, R. Surface tension of liquid Cu-Ti binary alloys measured by electromagnetic levitation and thermodynamic modelling. Appl. Surf. Sci. 2017, 257, 7739–7745. [Google Scholar] [CrossRef]
  16. Sato, Y.; Kameda, Y.; Nagasawa, T.; Sakamoto, T.; Moriguchi, S.; Yamamura, T.; Waseda, Y. Viscosity of molten silicon and the factors affecting measurement. J. Cryst. Growth 2003, 249, 404–415. [Google Scholar] [CrossRef]
  17. Watanabe, M.; Adachi, M.; Uchikoshi, M.; Fukuyama, H. Densities of Pt–X (X: Fe, Co, Ni and Cu) binary melts and thermodynamic correlations. Fluid Phase Equilibr. 2020, 515, 112596. [Google Scholar] [CrossRef]
  18. Luo, B.C.; Wang, H.P.; Wei, B.B. Phase field simulation of monotectic transformation for liquid Ni-Cu-Pb alloys. Chin. Sci. Bull. 2009, 54, 183–188. [Google Scholar] [CrossRef]
  19. Zhang, X.H.; Ruan, Y.; Wei, B.B.; Wang, W.L. Rapid solidification and dendrite growth of ternary Fe-Sn-Ge and Cu-Pb-Ge monotectic alloys. Sci. China Ser. G 2007, 50, 491–499. [Google Scholar] [CrossRef] [Green Version]
  20. Wu, P.; Yang, Y.; Barati, M.; McLean, A. The Effect of Thermal Diffusion on Decarburization Kinetics. Met. Mater. Trans. B 2014, 45, 1974–1978. [Google Scholar] [CrossRef]
  21. Gao, L.; Shi, Z.; Yang, Y.D.; Li, D.H.; Zhang, G.F.; McLean, A.; Chattopadhyay, K. Mathematical Modeling of Decarburization in Levitated Fe-Cr-C Droplets. Met. Mater. Trans. B 2018, 49, 1985–1994. [Google Scholar] [CrossRef]
  22. Barati, M.; Yang, Y.D.; Le, K.; McLean, A. Dephosphorization of Levitated Silicon-Iron Droplets for Production of Solar-Grade Silicon. Met. Mater. Trans. B 2018, 49, 1658–1664. [Google Scholar]
  23. Shi, B.H.; Zhang, G.F.; Yan, P.; Shi, Z.; Zheng, W.; Jiang, Q. Effect of Temperature on Dephosphorization of Ferrosilicon using Electromagnetic Levitation Technology under Vacuum. IOP Conf. Ser. Mater. Sci. Eng. 2018, 423, 012133. [Google Scholar] [CrossRef]
  24. Jiang, Q.; Zhang, G.F.; Yang, Y.D.; McLean, A. Dephosphorization of Metallurgical-Grade Silicon by Electromagnetic Levitation. Met. Mater. Trans. B 2021, 52, 305–313. [Google Scholar] [CrossRef]
  25. Machlin, E.S. Kinetics of vacuum induction refining-theory. Trans. TMS-AIME 1960, 218, 314–326. [Google Scholar]
  26. Szekely, J.; Chang, C.W.; Johnson, W.E. Experimental measurement and prediction of melt surface velocities in a 30,000 lb inductively stirred melt. Met. Mater. Trans. B 1977, 8, 514–517. [Google Scholar] [CrossRef]
  27. Hjellming, L.N.; Walker, J.S. Melt motion in a Czochralski crystal puller with an axial magnetic field: Isothermal motion. J. Fluid Mech. 1986, 164, 237–273. [Google Scholar] [CrossRef]
  28. Mukai, K.; Yuan, Z. Measurement of the density of molten silicon by a modified sessile drop method. Mater. Trans. 2000, 41, 323–330. [Google Scholar] [CrossRef] [Green Version]
  29. Engh, T.A.; Simensen, C.J.; Wijk, O. Principles of Metal Refining; Oxford University Press: Oxford, UK, 1992; pp. 473–476. [Google Scholar]
  30. Ozberk, E.; Guthrie, R.I.L. A kinetic model for the vacuum refining of inductively stirred copper melts. Met. Mater. Trans. B 1986, 17, 87–103. [Google Scholar] [CrossRef]
  31. Scientific Group Thermodata Europe. Thermodynamic Properties of Inorganic Materials; Springer: Berlin/Heidelberg, Germany, 2005; pp. 128–131. [Google Scholar]
  32. Harris, R.; Davenport, W.G. Vacuum distillation of liquid metals: Part I. Theory and experimental study. Met. Mater. Trans. B 1982, 13, 581–588. [Google Scholar] [CrossRef]
  33. Greenberg, L.A.; McLean, A. The Kinetics of Oxygen Dissolution in Liquid Iron and Liquid Iron Alloy Droplets. ISIJ Int. 1974, 14, 395–403. [Google Scholar] [CrossRef]
  34. Harris, R. Vacuum refining copper melts to remove bismuth, arsenic, and antimony. Met. Mater. Trans. B 1984, 15, 251–257. [Google Scholar] [CrossRef]
  35. Siwiec, G. Elimination of Aluminum during the Process of Ti-6Al-4V Alloy, Smelting in a Vacuum Induction Furnace. Arch. Metall. Mater. 2012, 57, 951–956. [Google Scholar] [CrossRef] [Green Version]
Figure 1. (a) Photograph of the levitated droplet (b) schematic diagram of the levitation cell and (c) schematic representation of the phosphorus removal process.
Metals 11 01460 g001
Figure 2. Effects of temperature on the diffusion coefficient and mass transfer coefficient of phosphorus in the boundary layer.
Metals 11 01460 g002
Figure 3. The effect of temperature on the mass transfer coefficient of phosphorus when evaporation occurs from the melt surface.
Metals 11 01460 g003
Figure 4. Effect of temperature on the mass transfer coefficient of phosphorus in the gas phase.
Metals 11 01460 g004
Figure 5. (a) Mass transfer coefficients of phosphorus in 600 MPa steel; (b) enlarged diagram of the mass transfer coefficients in the gas phase and for the whole process.
Metals 11 01460 g005
Figure 6. Effect of temperature on mass transfer coefficients.
Metals 11 01460 g006
Figure 7. Effect of gas flow rate on mass transfer coefficient.
Metals 11 01460 g007
Table 1. The chemical composition of 600 MPa steel (wt.%).
ElementsCPSiMnS
Content (wt.%)0.220.0230.541.460.54
Table 2. Phosphorus content in refined 600MPa steel (mg/L).
Gas Flow Rate (m/s)Refining Temperature (K)
18231923202321232223
0.04140.93880.89020.87070.8008
0.08290.96480.89160.80530.7106
0.12430.75390.74040.73930.4448
Table 3. Total mass transfer coefficients for dephosphorization under different experimental conditions (m/s).
Gas Flow Rate (m/s)Refining Temperature (K)
18231923202321232223
0.04142.396 × 10−62.418 × 10−62.427 × 10−62.462 × 10⁻⁶
0.08292.385 × 10−62.418 × 10−62.459 × 10−62.511 × 10⁻⁶
0.12432.486 × 10−62.494 × 10−62.494 × 10−62.702 × 10⁻⁶
Publisher’s Note: MDPI stays neutral with regard to jurisdictional claims in published maps and institutional affiliations.

