Abstract
By superposition, the individual strengthening mechanisms via hardness analyses and the particle dispersion contribution to strengthening were estimated for Al–C and Al–C–Cu composites and pure Al. An evident contribution to hardening due to the density of dislocations was observed for all samples; the presence of relatively high-density values was the result of the difference in the coefficients of thermal expansion (CTE) between the matrix and the reinforced particles when the composites were subjected to the sintering process. However, for the Al–C–Cu composites, the dispersion of the particles had an important effect on the strengthening. For the Al–C–Cu composites, the maximum increase in microhardness was ~210% compared to the pure Al sample processed under the same conditions. The crystallite size and dislocation density contribution to strengthening were calculated using the Langford–Cohen and Taylor equations from the microstructural analysis, respectively. The estimated microhardness values had a good correlation with the experimental. According to the results, the Cu content is responsible for integrating and dispersing the Al4C3 phase. The proposed mathematical equation includes the combined effect of the content of C and Cu (in weight percent). The composites were fabricated following a powder metallurgical route complemented with the mechanical alloying (MA) process. Microstructural analyses were carried out through X-ray analyses coupled with a convolutional multiple whole profile (CMWP) fitting program to determine the crystallite size and dislocation density.
1. Introduction
The powder metallurgy (PM) technique remains a standard route for preparing metal matrix nanocomposites (MMNC). PM is a technology for the solid-state processing of a wide variety of metal alloys and composite materials [1]; through this route, the manufacture of powders is carried out through a sequence of operations. The powders obtained from mechanical milling are compressed into the desired shape and then subjected to a sintering process at temperatures below the melting point of the lighter component, inducing the particles to bond [2,3]. A new generation of materials can be produced by combining PM methods and mechanical milling (MM), which have characteristics that consist of a metallic matrix with a fine microstructure reinforced with homogeneous nanoscale hard particles [4,5,6,7]. The MM route has been widely accepted to manufacture MMNC due to its easy operation and mass production.
Fine particles dispersion can be carried out in a solid or liquid state. One of the disadvantages of the liquid route is that the particles’ distribution is not homogeneous [8]; on the contrary, in the solid-state route, the MMNC can be produced with uniform particle distributions, with better microstructural control of the phases [9]. Incorporating small particles of the order of a few nanometers finely distributed in the metallic matrix is an effective way to produce stronger structural materials with excellent resistance and rigidity. One of the main advantages of using the Al4C3 phase is that during the fabrication of the Al–C composites and Al–C and Al–C–Cu composites, the Al4C3 nanophase is formed in situ in the sintering process; this results in low production costs. Al4C3 nanophase shows high-temperature strength, cyclic thermal resistance, wear-resistance and low linear expansion coefficient [10]. In the literature, we find different opinions about the hygroscopic property of Al4C3 and its negative effect on the mechanical properties of metal matrix composites. According to some authors, if the Al4C3 particles are completely enclosed in the aluminum matrix, non-reactivity to air humidity is observed [11]. A positive effect is also observed when the Al4C3 phase is homogeneously dispersed [12]. In this work, Cu is used as a transport medium to improve the integration and dispersion of graphite nanoparticles, transforming them into Al4C3 nanophase during sintering treatment. On the other hand, the MM is effective in the integration and dispersion of a second phase. The effectiveness of Al4C3 has been found in recent works, where there is a beneficial combined effect of CNT and the Al4C3 nanophase formed in situ during the sintering process in Al-based composites [13].
The elastic interactions between the particles and the dislocations present in the matrix inhibit the free dislocation movement, increasing the material yield stress. However, the reinforcement efficiency depends on its type, size, morphology, volume fraction and general distribution. In this sense, it is imperative to develop constitutive relationships to predict the mechanical properties of the MMNC based on the processing conditions, composition and microstructure (grain size, dislocation density, size and morphology of the reinforcement) [14,15]. The X-ray diffraction technique is used to determine the structure regarding microstrains and crystallite size in crystalline materials. When the crystallite is small, or lattice defects distort the crystal lattice as dislocations, the diffraction peaks profiles are broadened [16]. Currently, for evaluating X-ray diffraction profiles or patterns, different procedures have been used; one of these methods is the convolutional multiple whole profile (CMWP) method. This technique produces the convolutions of model-based, physically well-established size and strain profiles and instrumental profiles. It compares the constructed and measured diffraction patterns using a non-linear least-squares fitting procedure [17,18,19]. In this program, the effect of microstrain in peak broadening is caused by dislocations, where the analytic function is represented by a Fourier transform expressed as [20]:
where f is the strain function, g is the absolute value of the diffraction vector, L is the Fourier variable, b is the absolute value of the Burgers vector and R*e is a length parameter. The anisotropic effect is considered by the contrast factor of dislocations, C [21]. In this work, the crystallite size and dislocation density were determined by analyzing the diffraction peaks using the CMWP program, assuming that the strain is caused by dislocations [22]. The crystallite size, dislocation density and particle dispersion contribution to the microhardness were determined using some theoretical models. In this work, Cu was used to promote the dispersion of graphite in the Al matrix to produce Al–C composite powders in the milled condition. During the sintering process, C is transformed in Al4C3, thus obtaining an Al–Cu alloy with Al4C3 composites as the final product.
2. Materials and Methods
Al–C–Cu based nanocomposites were produced by mixing Al powder (99.5% purity), Al powder (99.5 wt.% pure Al, −325 mesh, Sigma-Aldrich) and 25 wt.% of C powder (99.5 wt.% pure elemental C, −20 + 84 mesh, Sigma-Aldrich), Cu powder spherical (99.5 wt.% pure Cu, −100 mesh, Alfa Aesar) and various powder mixtures composed of C and Cu–C (previously milled) powders (see Table 1). Each Al–C and Al–C–Cu mixture was mechanically milled in a high-energy Spex mill for 4 h. Argon was used as the milling atmosphere. For the preparation of the C–Cu and Al–C–Cu samples, no process control agent was used. The milling ball to powder weight ratio was set to 5:1. The total weight of the sample was 30 g. The vial and milling balls used were made of hardened steel. Compacted powder samples were obtained by pressing the powder mixtures for 2 min at ~1200 MPa in uniaxial load. No wall lubrication was used during pressing, considering that the C added to the Al–C–Cu composite powder acts as a lubricant during pressing. The sample sizes were h: φ (height: diameter) of 1, with a diameter of 6 mm. After that, the samples were sintered at 550 °C for 2 h using argon as a sintering atmosphere. To measure the relative density value of consolidated samples, Archimedes’ technique was utilized. TEM characterization was performed using an electron microscope (JEOL USA Inc., Peabody, MA, USA). JEM-2200FS (JEOL Ltd., Tokyo, Japan) equipped with a 200 kV field emission gun (FEG) and energy dispersive spectrometer (EDS). Scanning electron microscopy images were acquired by a cold field emission JEOL JSM-7401 device (JEOL Ltd., Tokyo, Japan).

Table 1.
Composition and sample identification (in wt.% and g).
F microscope (JEOL LTD, Akishima, Tokyo, Japan). The consolidated and sintered specimens were studied by X-ray diffraction. The diffraction profiles were measured by a Philips X’pert powder diffractometer using a Cu cathode (λ = 0.15406 nm). The step size and step time were 0.02° and 5 s, respectively. The X-ray diffraction peak profile analysis was carried out to determine the crystallite size distribution and the dislocation density of the nanocomposites studied using the CMWP fitting procedure program. It was assumed that strain is caused mainly by dislocation increase [23]. The lattice parameters of the various nanocomposites were obtained from the positions of the X-ray diffraction peaks calculated by the Rietveld method. The material hardness was measured by a Micro Hardness tester (FM-07), using an indentation time of 10 s under a maximum load of 200 g.
3. Results and Discussion
3.1. Microstructural Analysis
Figure 1 shows the SEM image of the C–Cu mixture powder, (a) secondary electron (SE) and backscattered-electron (BSE). From the BSE image (1b), the clear zone corresponds to the Cu phase and the dark zone to graphite. The BSE image (see Figure 1b) shows small dark particles (graphite) dispersed in the Cu matrix.
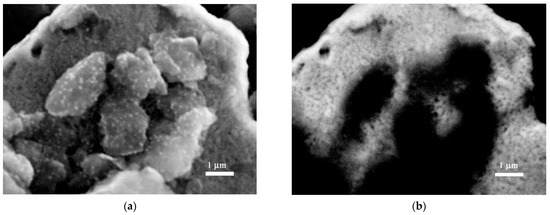
Figure 1.
SEM image from the C–Cu mixture power. (a) SEM secondary electron image. (b) SEM backscattered-electron image.
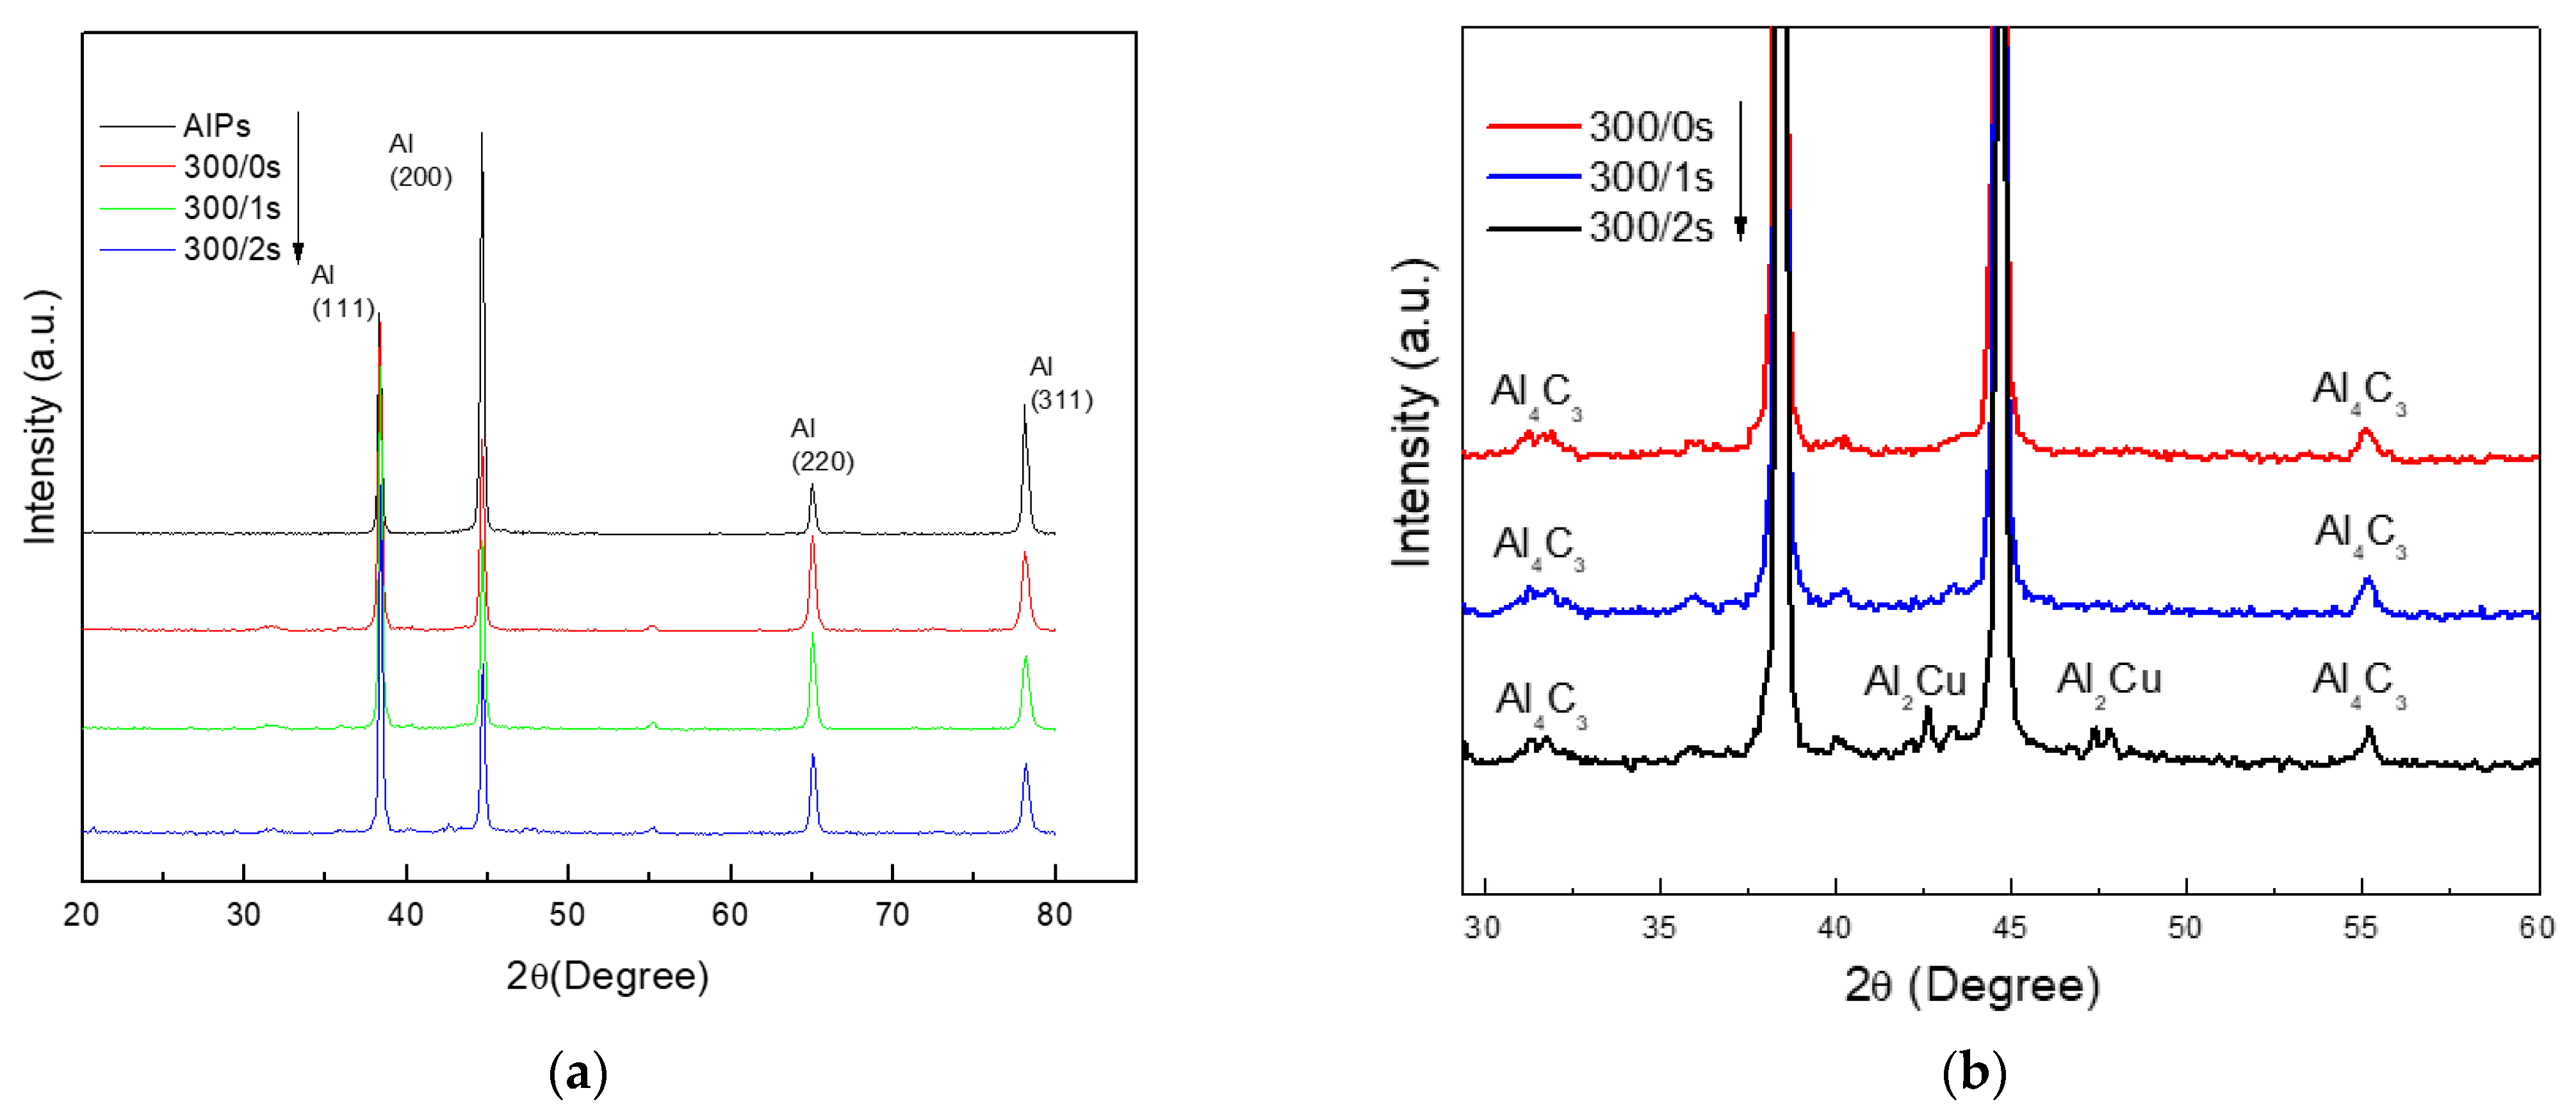
The X-ray diffraction patterns of the samples with 3 wt.% C and Alp samples are presented in Figure 2a. The diffraction patterns show the characteristic Al peaks, and Figure 2b shows the broadening of the X-ray diffraction profiles. In the DRX patterns, the presence of the Al4C3 phase for the composites is detected with 3 wt.% of C content and the Al2Cu phase in the sample with 2 wt.% of Cu content.
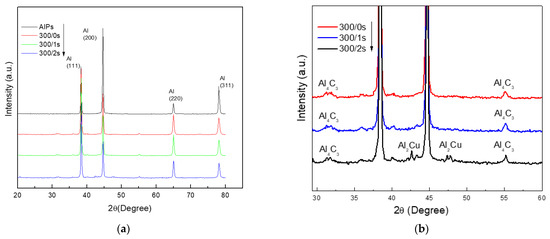
Figure 2.
(a) X-ray diffraction spectrum for the sintered composites with 3 wt.% C content and the AlPs sample. (b) Image enlargement of X-ray diffraction profiles.
The X-ray diffraction results obtained from Al–C, Al–C–Cu samples and pure Al are summarized in Table 2. This table shows the lattice parameter a obtained from the Rietveld analysis. The table also shows the dislocation density ρ and the mean crystallite size d obtained from the CMWP program. After the milling process, a refined microstructure is obtained with a small crystallite size and high microstrain values; this nanostructured state is induced by the severe deformation accumulated during the milling of the Al matrix [24]. At this stage of the process, the C phase acts as a control agent process preventing the excessive cold welding of the Al particles during the milling process [19]. After the sintering process, the crystallite size grows, and the C phase transforms into the Al4C3 nanophase. The presence of the Al4C3 nanophase prevents the excessive growth of crystallite size and promotes an increase in the density of dislocations. Values of density dislocation and crystallite size in the as-milled condition had been reported previously in other work [5].
Table 2.
Results from Rietveld and CMWP software.
The experimental microhardness HEXP (VH) and standard deviation (SD) from measurements made at various compositions of Al–C, Al–C–Cu samples and pure Al are presented in Table 3. The table also includes the relative density of each sample of green compacts and sintered conditions.
Table 3.
Microhardness experimental results HEXP and standard deviation (SD) for all samples.
As observed in the table, a relatively high density is obtained in the green compacts. After the sintering process, the density values show a slight increase only in samples with 3 wt.% of C and the 75/50 sample. Despite not having obtained a noticeable shrinkage in the samples due to argon used instead of nitrogen (as suggested by other authors) atmosphere, the use of argon does not significantly affect the hardness tests and is almost ineffective for high-density compacts [25,26]. The density values also show that powders with high mechanical resistance (samples with 3% by weight of C) showed greater difficulty to be compacted in green, resulting in lower RD values; despite having been highly densified (at ~1200 Mpa).
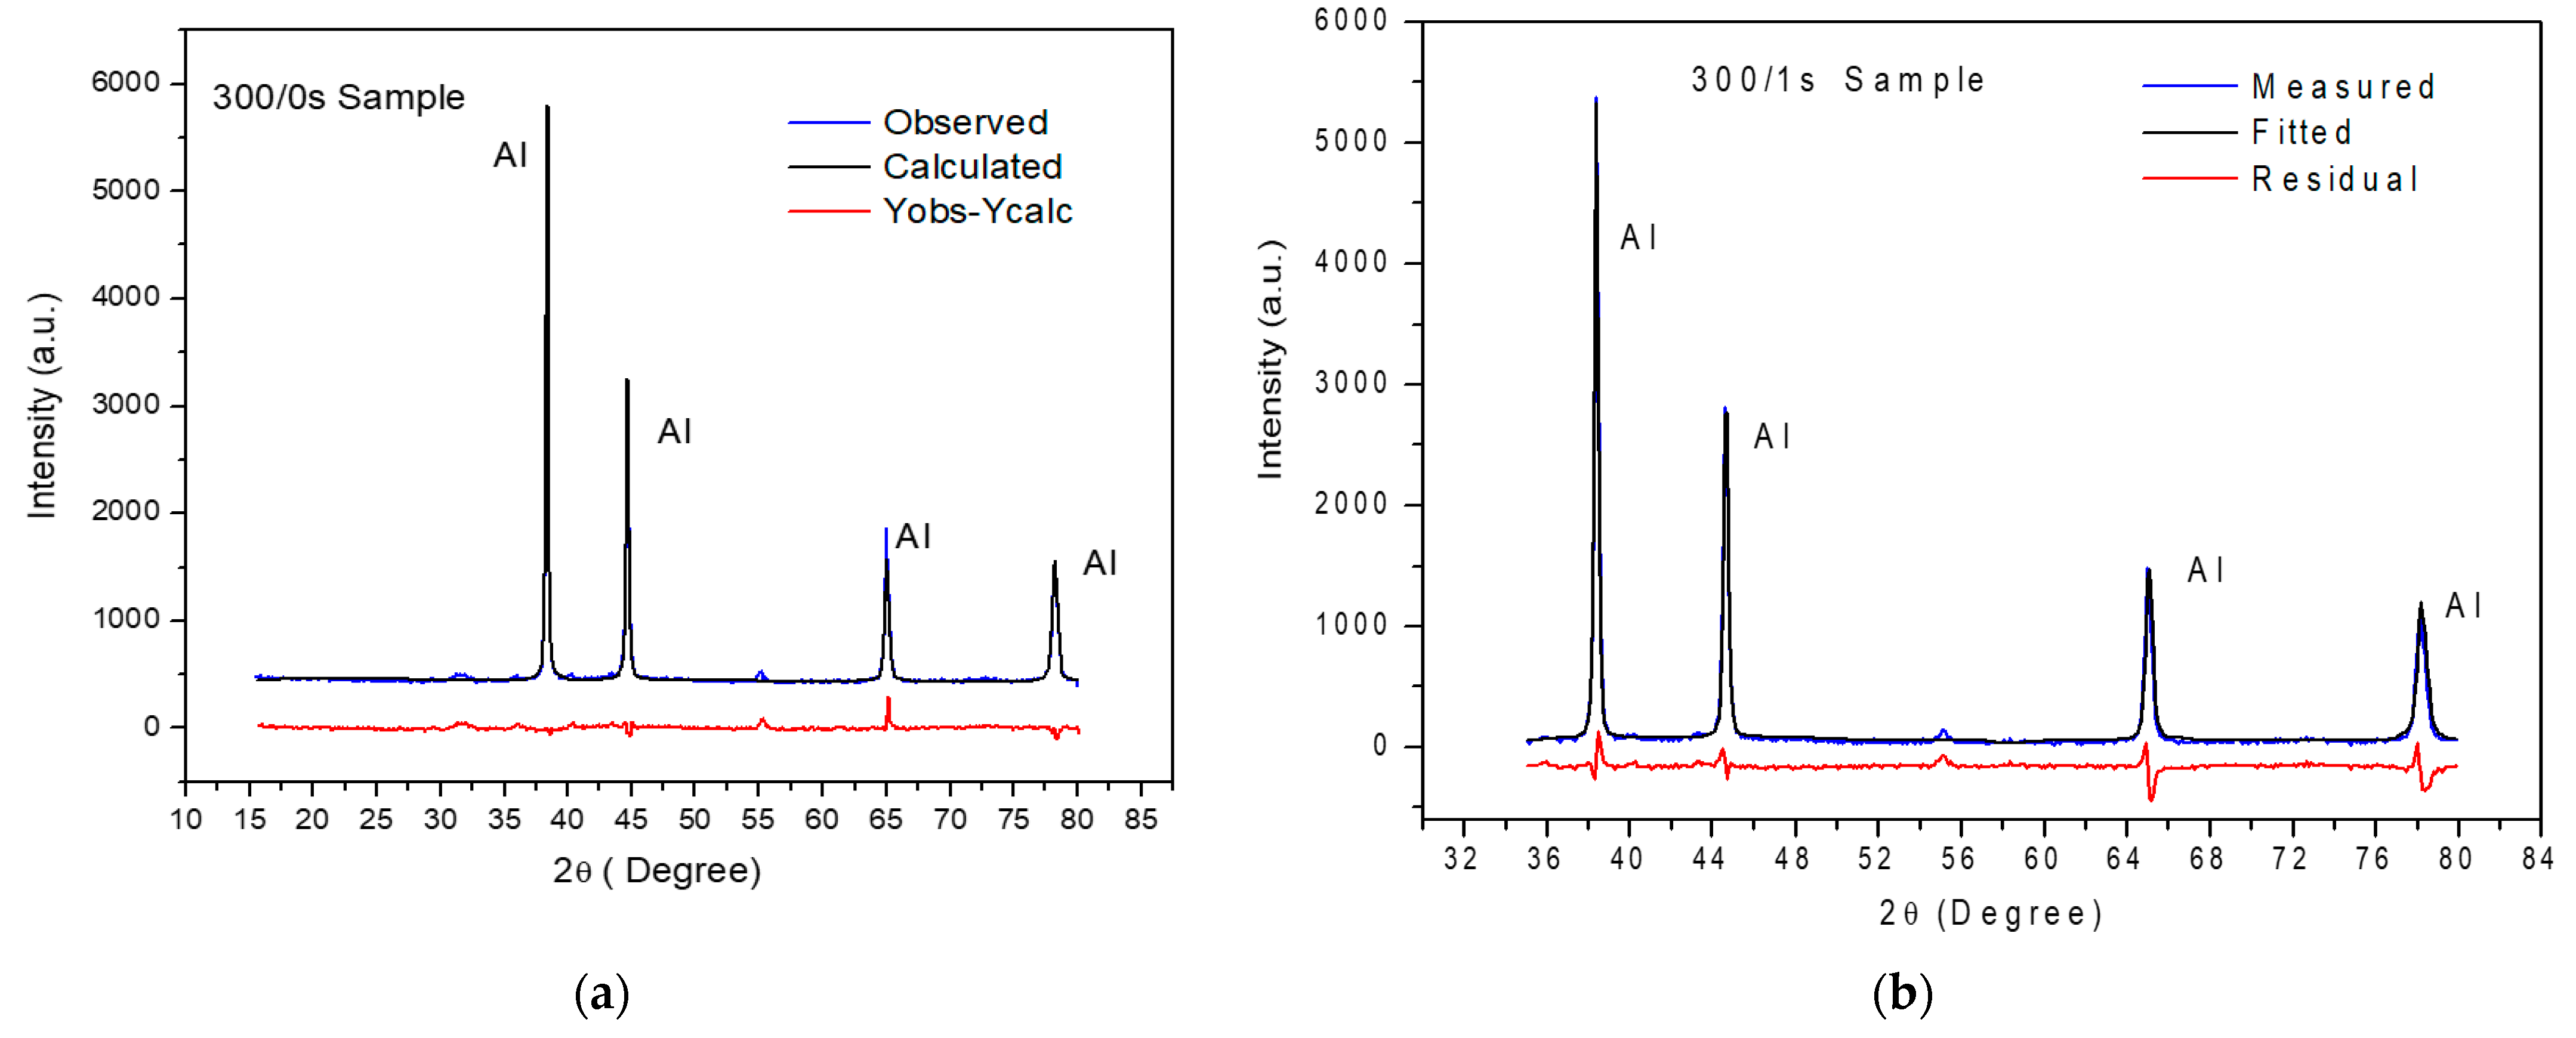
An example of Rietveld’s refinement of an XRD pattern for the 300/0s sintered sample is shown in Figure 3a. An example of CMWP fitting of the XRD pattern for the 300/1s sintered sample is shown in Figure 3b.
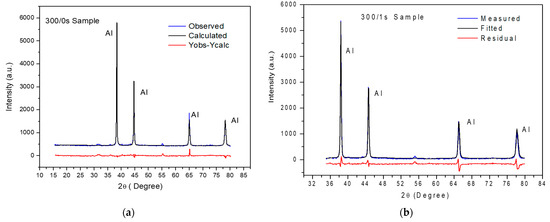
Figure 3.
(a) The Rietveld refinement of the XRD pattern of the 300/0s sintered sample. (b) The CMWP fitting of the XRD pattern of the 300/1s sintered sample.
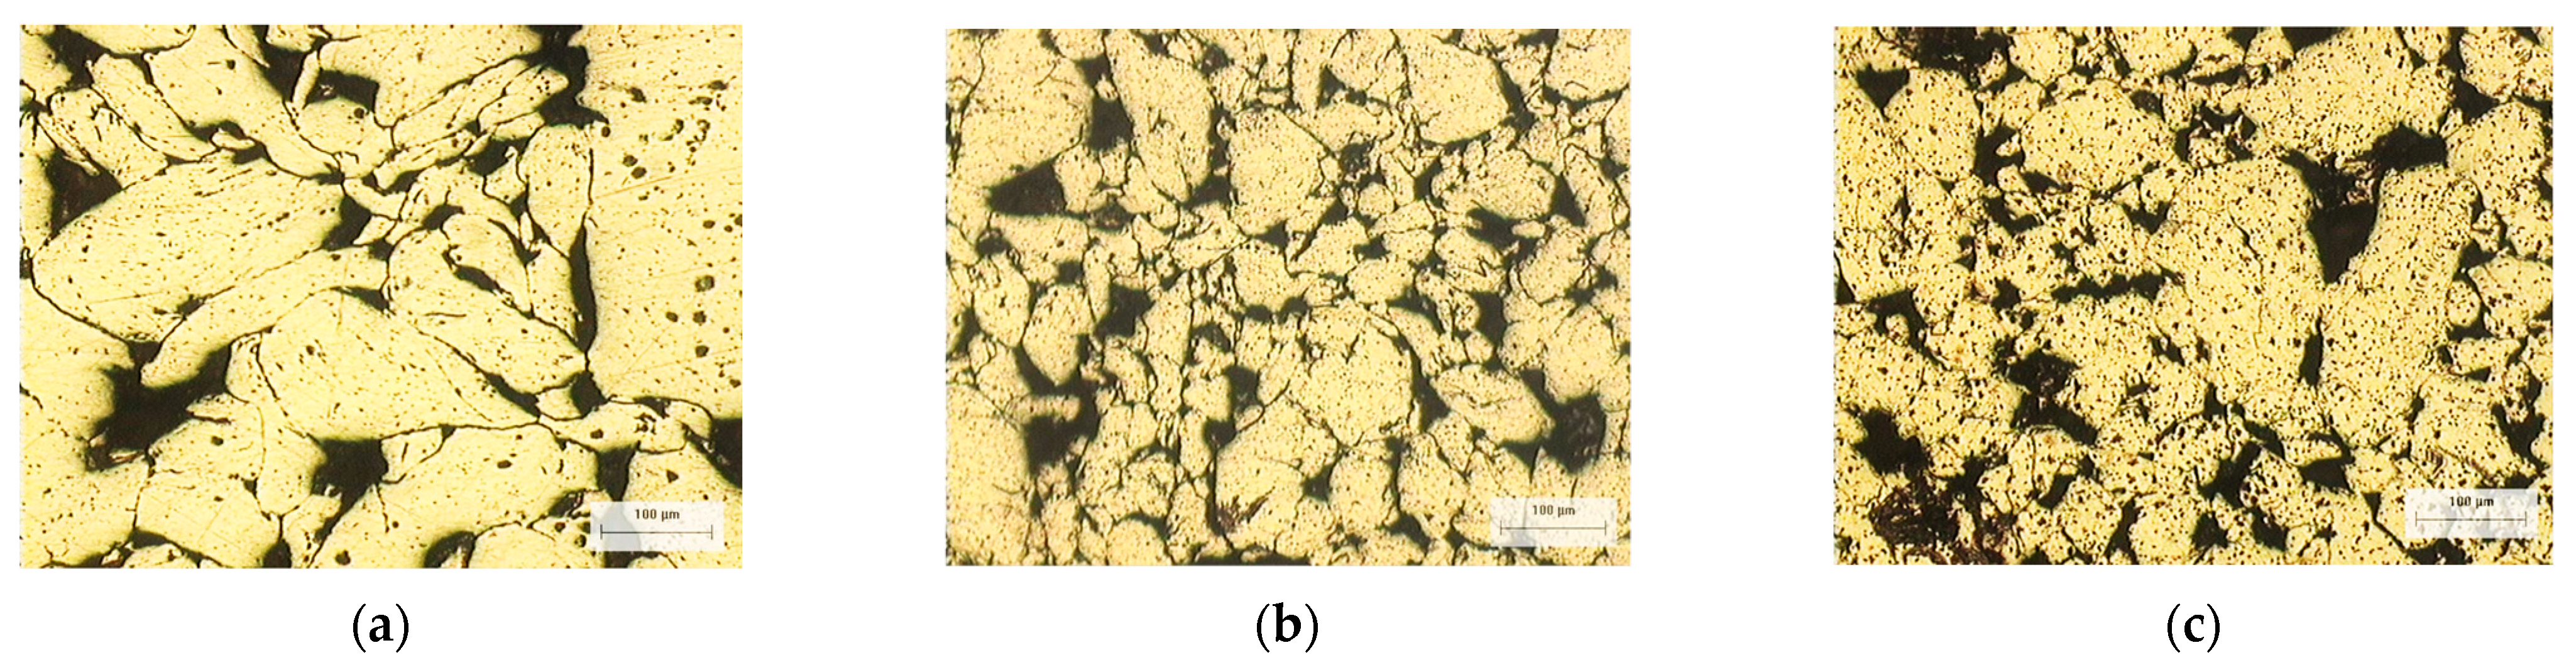
Figure 4a–c shows the metallographic microstructure of samples with only C content (75/0s and 300/0s) and the Alps sample. Figure 5a–c shows the metallographic microstructure of samples with C–Cu content (75/05s and 300/1s and 300/2s). Smaller grain sizes are observed in samples with C–Cu content. The dark regions in the optical micrographs correspond to pores and the grain boundary; it is also noticeable that the samples with Cu content show a relatively smaller grain size compared with the samples that only contain C.
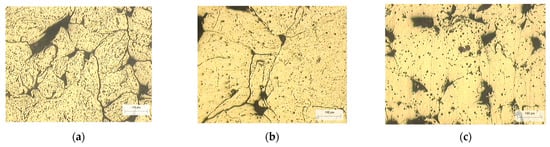
Figure 4.
(a) Metallographic microstructure of the Alps. (b) Metallographic microstructure of the 75/0s composite. (c) Metallographic microstructure of the 300/0s composite.
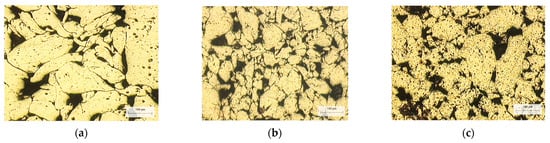
Figure 5.
(a) Metallographic microstructure of the 75/05s. (b) Metallographic microstructure of the 300/1s composite. (c) Metallographic microstructure of the 300/2s composite.
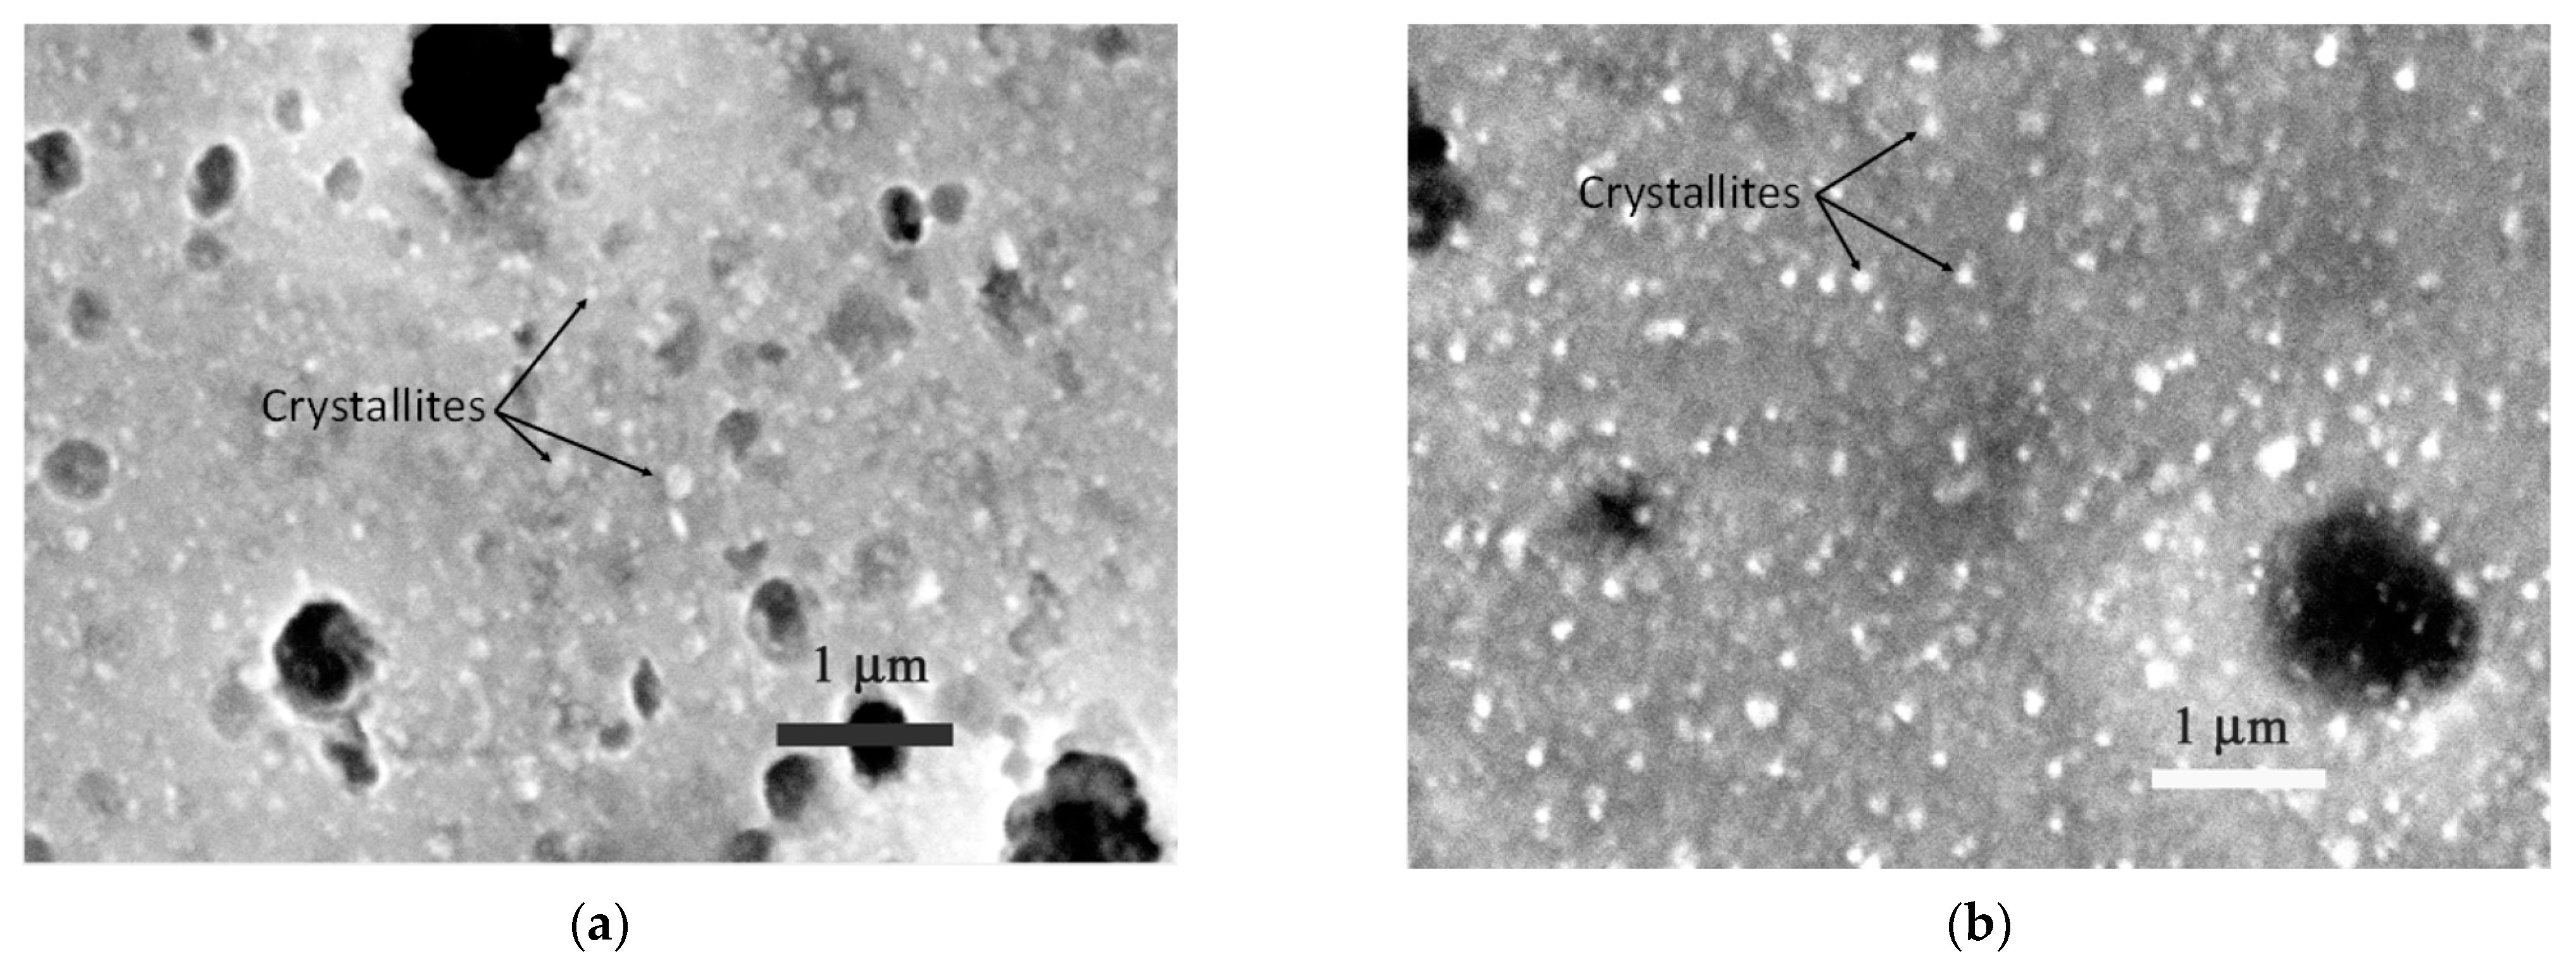
Figure 6 and Figure 7 show the microstructure of Alps, 75/0s, 300/0s and 300/1s samples. SEM micrographs show the presence of crystallites, which are below 100 nm in size. Samples with a high carbon C content (300/0s and 300/1s) have a smaller crystallite size and a more homogeneous distribution. These results are in agreement with the crystallite size results found in the XRD tests.

Figure 6.
SEM microstructural image of (a) Alps and (b) 75/0s samples.
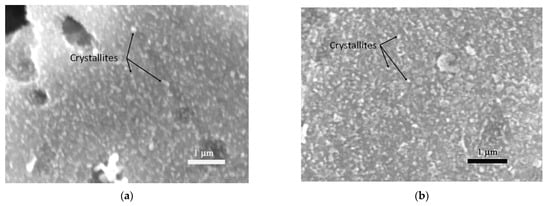
Figure 7.
(a) SEM image of the 300/0s sample microstructure. (b) SEM image of the 300/1s sample microstructure.
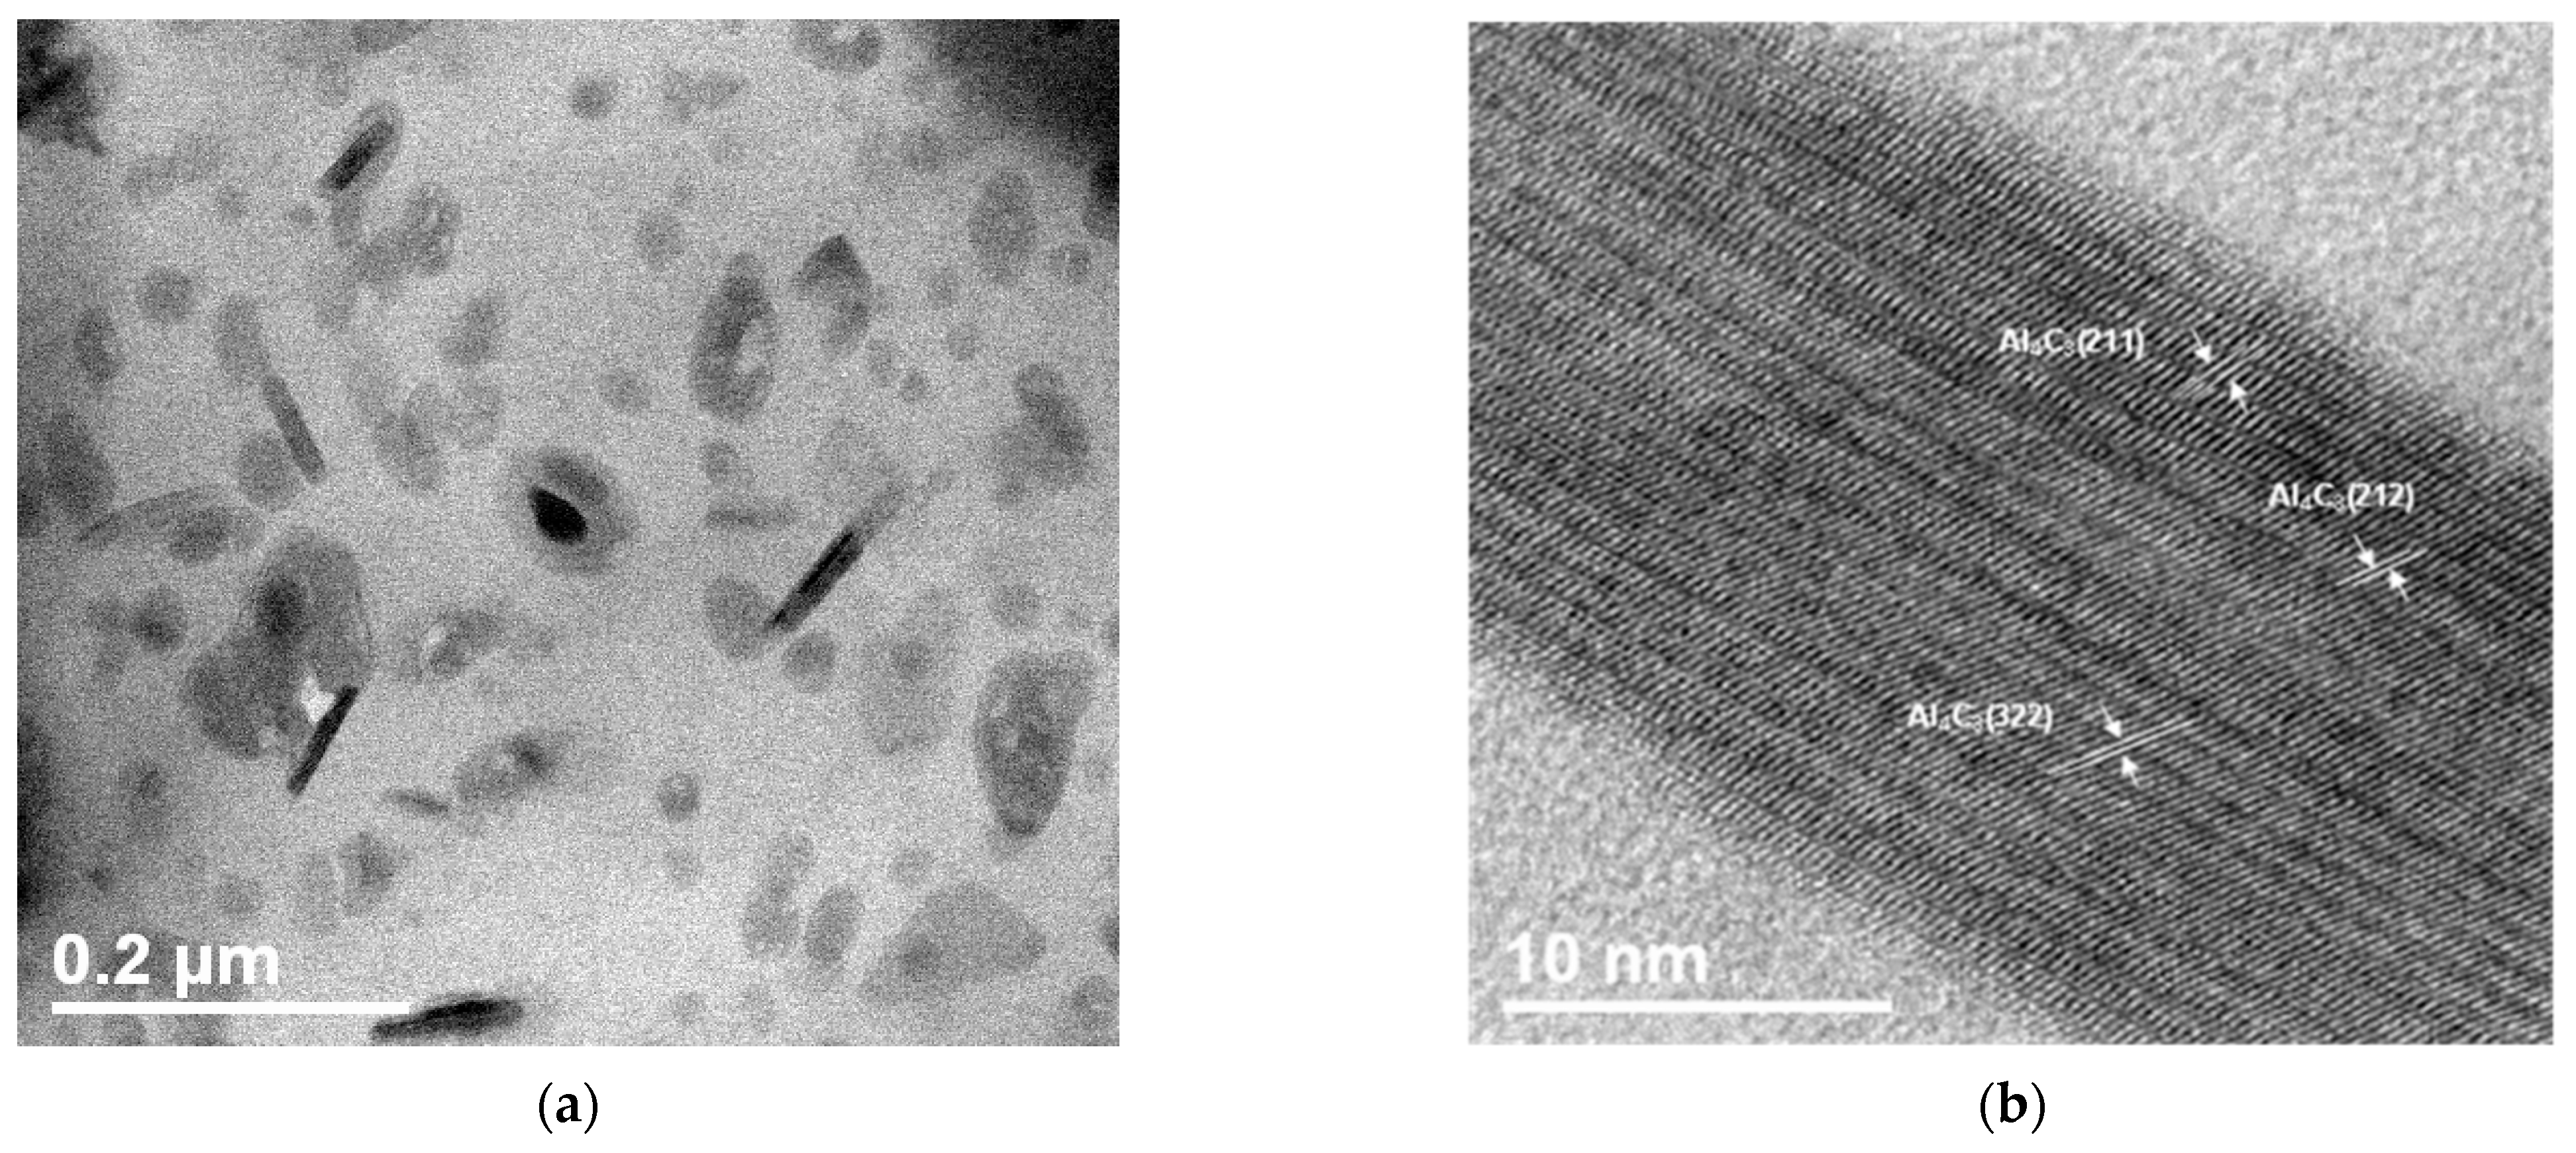
Figure 8a shows a STEM bright-field image of the aluminum carbide nanoparticles uniformly distributed in the Al matrix of the nanocomposite; the rod-shaped particles are about 60 nm long and 10 nm wide. The HRTEM image of Figure 8b shows the interplanar distances of the rod-shaped particle, which correspond to the Al4C3 compound.

Figure 8.
(a) HRTEM image of 300/1s sample. (b) Close view of a particle.
3.2. Hardness Contribution Analysis
By superposing of every single contribution to strengthening (via hardness increase analysis), the microhardness (H) was expressed in the following equation [27]:
where HPN is the Peierls–Nabarro strengthening hardness contribution and HSS is the contribution caused by solid solution. The Peierls–Nabarro strengthening hardness contribution, called lattice friction, is the baseline resistance to dislocation. In the composite, the atoms of C and Cu in the composites that had no time to precipitate during the sintering process are solid-dissolved in the Al matrix. They play the role of solid-solution strengthener.
H = HPN + HSS + HD + HC + HP
HD is the dislocation’s hardness contribution, HC is the hardness contribution by crystallite size and HP is the direct contribution by particles dispersion. The Orowan mechanism is based on the interaction of nanoparticles with dislocations; the effect of particle dispersion hardening is calculated from the Orowan equation:
where HP is the hardness contribution by particle dispersion, b is a vector of Burger, l is the space between the particles and G is the shear modulus. A critical parameter of dispersion hardened materials is the interparticle spacing l. The interparticle spacing has been subject to many interpretations. A simple expression is the following:
where f is the volume fraction of the reinforcement and r is the radius of particle reinforcement. The HP term was estimated as a function of wt.% of C and Cu content. On the other hand, it has been previously reported that HPN contribution has a relatively low value [28] and the HSS parameter is mainly related to the lattice parameter [29]. According to the results, the lattice parameter varies slightly with composition (see Table 2), and its impact could be considered relatively low. In determining the model, the HL parameter was considered the sum of both HPN and HSS and calculated for each composite group, Al–C and Al–C–Cu. Therefore, the sum of these contributions, named HL, is:
HL = HPN + HSS
The strengthening hardness effect by dislocations, HD, is described by the modified Taylor equation [8,30]:
where k = αMGb, G is the modulus of elasticity in shear and is equal to 26 GPa, b is the Burger’s vector 0.2863 nm, α is the dislocation pattern hardness coefficient, M is the Taylor factor and ρ is the dislocation density in the final condition.
HD = kρ1/2
The strengthening contribution by crystallite HC is described by Langford–Cohen [15,31]:
where d is the crystallite size and k1 = 6 Gb.
HC = k1d−1
3.3. Strengthening Hardness Contributions
Using the dislocation density ρ and the mean crystallite size d values from the experimental results (see Table 2), the terms HD and HC were calculated using Equations (5) and (6), respectively. From these equations, the material constant k of Equation (6) was determined by using α = 0.3 and M = 2 [32]. The modulus of elasticity for pure Al in shear is G = 26 GPa, and the Burguer vector b = 0.2863 nm. The result of the equation was divided by 3 to approximate microhardness [33]; the constant value obtained is k = 1.48 × 10⁻⁶ mVH. The constant k1 = 1303.3 nmVH was obtained from [22].
The term HP in Equation (2), was expressed for Al–C compounds as:
and for Al–C–Cu composites, HP was expressed as:
The β1 and β2 are saturation constants, α1 and α1 are material constants (Al–C composites and Al–Cu composites, respectively). The C and Cu values correspond to the composition in weight percentage (see Table 1). From the previous analyses, the microhardness modeled (HMOD) for:
Al–C compounds is
and for Al–C–Cu compounds is
To obtain estimated microhardness values (HMOD) as a function of crystallite size, d, dislocation density, ρ and C and Cu wt.% for the Al–C and Al–C–Cu composites, the parameters of Equations (10) and (11) were estimated with the least square method. By using the microhardness experimental mean values, HEXP (from Table 3), the dislocations and the crystallite size values (HD and HC, respectively) from Table 4, the term HL for Al–C and Al–C–Cu composites were calculated. From the mathematical calculations, the constants, β1 = 0.018, α1 = 0.0066, β2 = 0.01 and α2 = 0.0446, were obtained. Table 4 shows the calculated values of HL, HP and HMOD for each sample.
Table 4.
HL, HD and HC values and modeled HMOD.
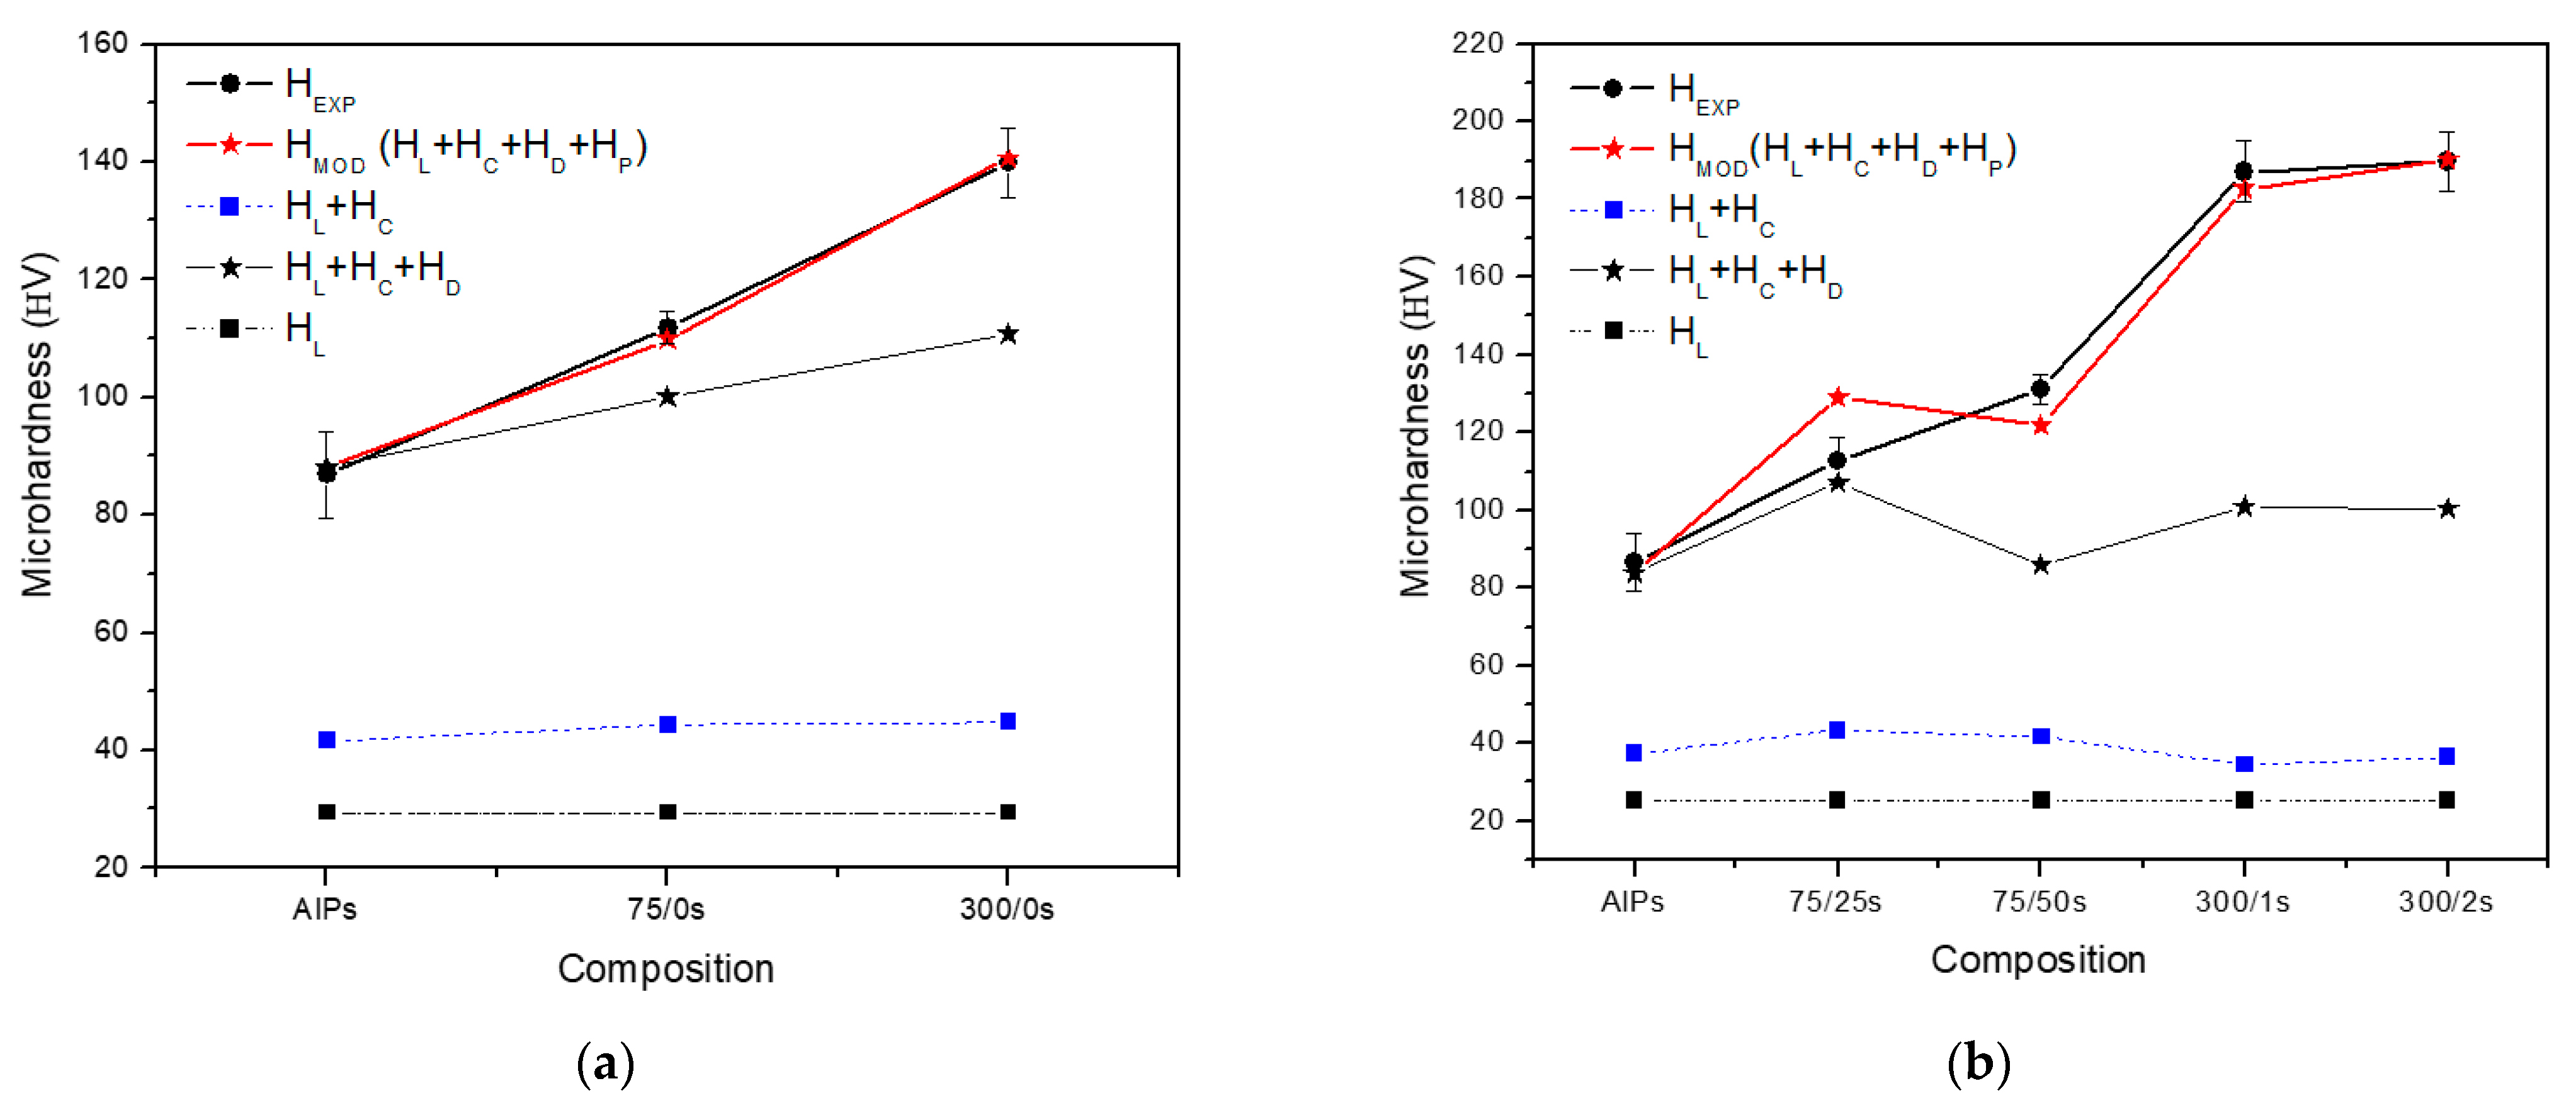
The graph of Figure 9a,b shows each of the strengthening contributions separately: Peierls–Nabarro and solid solution (HL), dislocation density (HD), the crystallite size (HC) and by particle dispersion (HP), the Al–C composites (see Figure 9a) and for the Al–C–Cu composites (see Figure 9b). Each term was added to the next and was graphically represented: HL, HL + HD, HL + HD + HC, and HL + HD + HC + HP. The graph also shows the experimental microhardness curve HEXP and the HMOD calculated curve.
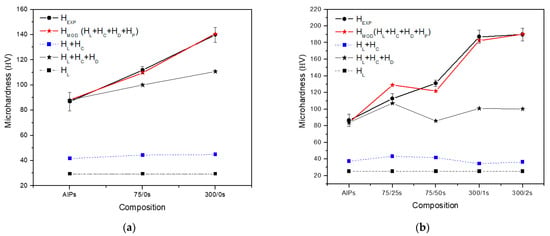
Figure 9.
Experimental and calculated microhardness as a function of composition HL, dislocation density (HD), the crystallite size (HC) and particle dispersion and HP contribution microhardness terms for (a) Al–C composites and (b) Al–C–Cu composites.
The calculated HL term was plotted for each Al–C and Al–C–Cu compound observed in Figure 9a,b, respectively. It is important to note that the HL values found (see Table 4) for all composites are practically similar to the HL found in the Al sample. This result follows that the reinforcing effect of the solid solution due to Cu or C is negligible. Most of the C and Cu content may be precipitated during the sintering process. The HPN (that determines the strength of crystals) is considered as the main contribution to the hardening for both composites and Al. The relatively small HL value indicates that most of the C and Cu in solid solution in the milled condition was transformed into the Al4C3 Al2Cu phases. A similar analysis was carried out in other work [5]. Still, on Al–C composites analyzed in the milled condition, the HL value found was 48.88 HV, resulting in a significant C solid solution effect before sintering processes. The strengthening effect due to crystallite size HC was graphically represented by adding the HL to the HC term, resulting in HL + HC. For the Al–C composites, the increase of the hardness HL + HC follows a slight increase with the composition (see Figure 9a); the maximum increase compared to the Alp sample was ~8% corresponding to the 300/0s sample, with an average contribution to hardening due to the crystallite size of about 15 VH (see Table 4). A higher contribution to the hardness of the crystallite size for Al–C composites in the unsintered condition was observed in other work [7]. On the other hand, the dislocation density shows a significant contribution to the Al matrix hardening. The dislocations (HD) strengthening hardness effect was plotted and added to the term HL + HC. The HD term resulting in HL + HC +HD, as observed in the graphs of Figure 9a,b. For samples with only C addition (see Figure 9a), a proportional increase with the C content is observed, with an increase in hardness compared to the Alp sample of around 26%, corresponding to the 300/0s sample, which corresponds to a contribution to hardening of ~65 VH (see Table 4). While for Al–C–Cu composites (see Figure 9b), a variation of HD with the composition is evident. Two maximum values are observed in the 75/25s and 300/1s samples with an increase in hardness value of ~21% compared to the Alp sample and an average contribution to the hardening of ~65 VH (see Table 4). Some strength increments for different strengthening mechanisms have been reported, where dislocation contribution to the strengthening was about 25%, and about 60% correspond to the particle dispersion contribution to the strengthening [34]. The addition of reinforcing particles leads to an increase in the number of dislocations, which restricts the free movement of dislocations, increasing the hardness of the compound [35]. The graph of Figure 9a,b also shows the HEXP curve and the modeled curve HMOD for both Al–C and Al–C–Cu composites; as is observed, there is a close correlation of the modeled curve HMOD regarding the experimental hardness HEXP results (see Table 3). For the compounds Al–C, it was possible to estimate the compound microhardness using the concentration of C. For the compounds Al–C–Cu, the product in weight percent of C and Cu was used, considering the interaction effects to the hardening of the C and Cu contents. As a result, it was possible to appreciate particles dispersion contribution effects (HP) for the Al–C and Al–C–Cu samples. For the Al–C composites, the increase of the HP hardness contribution follows a proportional increase to the composition (see Figure 9a), for the 3/00s sample, the maximum increase reached compared to the Alp sample was ~60%, with an average contribution to the hardening of ~30 VH (see Table 4), while for the Al–C–Cu compounds, there is no proportional relationship of the HP hardness contribution with the composition (see Figure 9b). The maximum values observed were for the 300/1s and 300/2s samples, with an average increase of ~210% compared to the Alp sample and an average contribution to the hardening HP of ~85 VH (see Table 4). For the Al–C composites, the reinforcement is mainly due to the density of dislocations contribution; an increment in the dislocation density is produced because of the difference in the coefficients of thermal expansion (CTE) between the matrix and reinforced particles when a composite was subjected to thermal changes during the sintering process [36]. For these composites, the increase in microhardness follows a linear trend with the composition. During the manufacturing process, C adheres to the surface of Al powders (without a complete integration) and partially distributing itself in the Al matrix, as is reported in other works [37]. Despite not being efficiently integrated into the Al matrix, the precipitation of the Al4C3 phase produces an increase in the density of dislocations as a result of the sintering process. On the other hand, for the Al–C–Cu composites, during the fabrication of the C–Cu mixture, the C adheres to the Cu particles, which allows that during the composite manufacturing process, the C is integrated and distributed efficiently in the Al matrix (see Figure 1a,b). For these composites, the main reinforcement contribution effects are the dislocation density promoted during the sintering process by the CTE and the homogeneous dispersion of Al4C3 particles. Precipitation of Al2Cu phase for 300/1s composites was not observed particles in the XRD patterns of Figure 2b. An increase of 2wt.% Cu in the composite (300/2s) revealed the Al2Cu phase presence in the XRD pattern of Figure 2b, but not an increase of the microhardness values as is observed in Figure 9b. The combined effect between Cu and C, as a product of Cu*C, was proposed in the model (see Equation (11)).
4. Conclusions
According to the results, the Cu addition is responsible for the integration and dispersion of the Al4C3 phase. C is integrated at Cu particles during the C–Cu additive fabrication and introduced to the aluminum matrix and transformed to Al4C3 during the sintering process. The samples with Cu showed that the particle dispersion hardness contribution of HP is considerably higher than pure Al and the Al–C composites. The main factor of the Al matrix reinforcement is the Al4C3 nanophase. However, minor contributions of the Al2Cu phase and graphite nanoparticles (not transformed during the sintering process) are possible. A direct correspondence between the experimental microhardness values (HEXP) and the estimated microhardness values, HMOD, was observed. In general, for all samples, the dislocation density shows an evident contribution to the hardness; for the samples with only C addition, the dislocation hardening HD follows a proportional increase with the composition. However, two maximum peaks are observed for the C–Cu samples content at 75/25s and 300/1s at a Cu/C ratio of about 0.333 (1/3). The crystallite size hardness contribution had a low impact; this result is consistent with the relatively high crystallite size value found in the XRD results product of the sintering process.
Author Contributions
Conceptualization, data curation, writing—review & editing, conceptualization, V.G.O.; proyect administration, conceptualization, data curation, formal analysis, writing—review & editing, A.S.B.; investigation, methodology, software, M.S.B.; investigation, methodology, software, H.M.P.; resources, visualization, C.G.O.; investigation, methodology, writing—original draft, I.E.G. All authors have read and agreed to the published version of the manuscript.
Funding
This research was funded by Universidad Tecnológica de Chihuahua Sur.
Institutional Review Board Statement
Not applicable.
Informed Consent Statement
Not applicable.
Data Availability Statement
Data sharing is not applicable for this article.
Acknowledgments
Thanks to S. Tarin-Bejarano for their valuable technical assistance.
Conflicts of Interest
The authors declare no conflict of interest.
References
- Saboori, A.; Moheimani, S.K.; Dadkhah, M.; Pavese, M.; Badini, C.; Fino, P. An overview of key challenges in the fabrication of metal matrix nanocomposites reinforced by graphene nanoplatelets. Metals 2018, 8, 172. [Google Scholar] [CrossRef] [Green Version]
- Samal, C.P.; Parihar, J.S.; Chaira, D. The effect of milling and sintering techniques on mechanical properties of Cu–graphite metal matrix composite prepared by powder metallurgy route. J. Alloy. Compd. 2013, 569, 95–101. [Google Scholar] [CrossRef]
- Jiang, Y.; Tan, Z.; Xu, R.; Fan, G.; Xiong, D.-B.; Guo, Q.; Su, Y.; Fan, J.; Zhang, D. Tailoring the structure and mechanical properties of graphene nanosheet/aluminum composites by flake powder metallurgy via shift-speed ball milling. Compos. Part A-Appl. S 2018, 111, 73–82. [Google Scholar] [CrossRef]
- Guo, X.; Guo, Q.; Nie, J.; Liu, Z.; Li, Z.; Fan, G.; Xiong, D.-B.; Su, Y.; Fan, J.; Zhang, D. Particle size effect on the interfacial properties of SiC particle-reinforced Al-Cu-Mg composites. Mat. Sci. Eng. A-Struct. 2018, 711, 643–649. [Google Scholar] [CrossRef]
- Santos-Beltrán, A.; Gallegos-Orozco, V.; Goitia Reyes, R.; Miki-Yoshida, M.; Estrada-Guel, I.; Martínez-Sánchez, R. Mechanical and microstructural characterization of dispersion strengthened Al–C system nanocomposites. J. Alloy. Compd. 2010, 489, 626–630. [Google Scholar] [CrossRef]
- Kavimani, V.; Soorya Prakash, K.; Thankachan, T. Investigation of graphene-reinforced magnesium metal matrix composites processed through a solvent-based powder metallurgy route. B Mater. Sci. 2019, 42, 39–42. [Google Scholar] [CrossRef] [Green Version]
- Amherd Hidalgo, A.; Frykholm, R.; Ebel, T.; Pyczak, F. Powder metallurgy strategies to improve properties and processing of titanium alloys: A review. Adv. Eng. Mater. 2017, 19, 1600743. [Google Scholar] [CrossRef]
- Khakbiz, M.; Akhlaghi, F. Synthesis and structural characterization of Al–B4C nano-composite powders by mechanical alloying. J. Alloy. Compd. 2009, 479, 334–341. [Google Scholar] [CrossRef]
- Zamani, N.A.B.N.; Asif Iqbal, A.K.M.; Nuruzzaman, D.M. Fabrication and characterization of Al2O3 nanoparticle reinforced aluminium matrix composite via powder metallurgy. Mater. Today Proc. 2020, 29, 190–195. [Google Scholar] [CrossRef]
- Bendoumia, M.; Triaa, S.; Azzaz, M. Structural proprieties of the Al–Al4C3 nanocomposite produced via mechanical alloying and annealin. Micro. Nano Lett. 2017, 12, 630–632. [Google Scholar] [CrossRef]
- Ma, B.; Wang, J.; Lee, T.; Dorris, S.E.; Wen, J.; Uthamalingam, B. Microstructural characterization of al4c3 in aluminum-graphite composite prepared by electron-beam melting. J. Mater. Sci. 2018, 53, 10173–10180. [Google Scholar] [CrossRef]
- Velgosová, O.; Besterci, M.; Balloková, B. Influence of Al4C3 nanophase on structural stability and mechanical properties of Al-Al4C3 composites after thermal exposure. Metall. Res. Technol. 2018, 115, 606. [Google Scholar] [CrossRef]
- Luo, S.; Li, R.; He, P.; Yue, H.; Gu, J. Investigation on the microstructure and mechanical properties of cnts-alsi10mg composites fabricated by selective laser melting. Materials 2021, 14, 838. [Google Scholar] [CrossRef]
- Sadooghi, A.; Payganeh, G. Effects of sintering process on wear and mechanical behavior properties of titanium carbide/hexagonal boron nitrid/steel 316L base nanocomposites. Mater. Res. Express 2018, 5, 2. [Google Scholar] [CrossRef]
- Woo, W.; Balogh, L.; Ungár, T.; Choo, H.; Feng, Z. Grain structure and dislocation density measurements in a friction-stir welded aluminum alloy using X-ray peak profile analysis. Mat. Sci. Eng. A-Struct. 2008, 498, 308–313. [Google Scholar] [CrossRef]
- Stalin, B.; Sudha, G.T.; Ravichandran, M. Optimization of powder metallurgy parameters for aa7072-moo3 composites through taguchi method. Mater. Today Proc. 2020, 22, 2622–2630. [Google Scholar] [CrossRef]
- Ungar, T.; Gubicza, J.; Ribarik, G.; Borbély, A. Crystallite size distribution and dislocation structure determined by diffraction profile analysis: Principles and practical application to cubic and hexagonal crystals. J. Appl. Cryst. 2001, 34, 298–310. [Google Scholar] [CrossRef] [Green Version]
- Kumar, A.; Singh, R.C.; Chaudhary, R. Recent progress in production of metal matrix composites by stir casting process: An overview. Mater. Today Proc. 2020, 21, 1453–1457. [Google Scholar] [CrossRef]
- Nauyoks, S.; Wieligor, M.; Zerda, T.W.; Balogh, L.; Ungar, T.; Stephens, P. Stress and dislocations in diamond–SiC composites sintered at high pressure, high temperature conditions. Compos. Part A Appl. S 2009, 40, 566–572. [Google Scholar] [CrossRef]
- Ribárik, G. Modeling of Diffraction Patterns Based on Microstructural Properties. Ph.D. Thesis, Eötvös Loránd University, Budapest, Hungary, 2008. [Google Scholar]
- Ribárik, G.; Jóni, B.; Ungár, T. The convolutional multiple whole profile (cmwp) fitting method, a global optimization procedure for microstructure determination. Crystals 2020, 10, 623. [Google Scholar] [CrossRef]
- Balogh, L.; Nauyoks, S.; Zerda, T.W.; Pantea, C.; Stelmakh, S.; Palosz, B.; Ungár, T. Structure of diamond–silicon carbide nanocomposites as a function of sintering temperature at 8GPa. Mater. Sci. Eng. A 2008, 487, 180–188. [Google Scholar] [CrossRef]
- Suryanarayana, C. Mechanical alloying and milling. Prog. Mater. Sci. 2001, 46, 1–184. [Google Scholar] [CrossRef]
- Al-Aqeeli, N.; Mendoza-Suarez, G.; Suryanarayana, C.; Drew, R.A.L. Development of new Al-based nanocomposites by mechanical alloying. Mat. Sci. Eng. A-Struct. 2008, 480, 392–396. [Google Scholar] [CrossRef]
- Wang, X.; Li, X.; Zhang, L.; Fang, M.H.; Sercombe, T.B. The effect of atmosphere on the structure and properties of selective laser melted AL-12 SI alloy. Mat. Sci. Eng. A-Struct. 2014, 597, 370–375. [Google Scholar] [CrossRef] [Green Version]
- Schaffer, G.B.; Hall, B.J. The influence of the atmosphere on the sintering of aluminum. Metall. Mater. Trans. A 2002, 33, 3279–3284. [Google Scholar] [CrossRef]
- Cahn, R.W.; Haasen, P.; Argon, A.S. Physical metallurgy. In Mechanical Properties of Single-Phase Crystalline Media, Deformation at Low Temperature, 4th Mat. Sci. Eng. A-Struct. ed.; Elsevier Science B.V.: Amsterdam, The Netherlands, 1996; pp. 1878–1955. [Google Scholar]
- Goussous, S.; Xu, W.; Wu, X.; Xia, K. Al-C nanocomposites consolidated by back pressure equal channel angular pressing. Compos. Sci. Technol 2009, 69, 1997–2001. [Google Scholar] [CrossRef]
- Arik, H. Effect of mechanical alloying process on mechanical properties of α-Si3N4 reinforced aluminum-based composite materials. Mater. Design 2008, 29, 1856–1861. [Google Scholar] [CrossRef]
- Abdoli, H.; Asgharzadeh, H.; Salahi, E. Sintering behavior of al-aln nano structured composite powder synthesized by high-energy ball milling. J. Alloy. Compd. 2009, 473, 116–122. [Google Scholar] [CrossRef]
- Balogh, L.; Ungár, T.; Zhao, Y.; Zhu, Y.T.; Horita, Z.; Xu, C.; Langdon, T.G. Influence of stacking-fault energy on microstructural characteristics of ultrafine-grain copper and copper–zinc alloys. Acta. Mater. 2008, 56, 809–820. [Google Scholar] [CrossRef]
- Velgosova, O.; Besterci, M.; Hvizdos, P.; Kulu, P. Analysis of Al-12Al4C3 composite. Mater. Sci. 2006, 12, 199–201. [Google Scholar]
- Meyers, M.A.; Mishra, A.; Benson, D.J. Mechanical properties of nanocrystalline materials. Prog. Mater. Sci. 2006, 51, 427–556. [Google Scholar] [CrossRef]
- Leng, J.; Dong, Y.; Ren, B.; Wang, R.; Teng, X. Effects of graphene nanoplates on the mechanical behavior and strengthening mechanism of 7075al alloy. Materials 2020, 13, 5808. [Google Scholar] [CrossRef]
- Kareem, A.; Qudeiri, J.A.; Abdudeen, A.; Ahammed, T.; Ziout, A. A review on AA 6061 metal matrix composites produced by stir casting. Materials 2021, 14, 175. [Google Scholar] [CrossRef] [PubMed]
- Ma, P.; Jia, Y.; Gokuldoss, P.K.; Yu, Z.; Yang, S.; Zhao, J.; Li, C. Effect of Al2O3 nanoparticles as reinforcement on the tensile behavior of al-12si composites. Metals 2017, 7, 359. [Google Scholar] [CrossRef] [Green Version]
- Bostan, B.; Özdemir, A.T.; Kalkanli, A. Microstructure characteristics in Al-C system after mechanical alloying and high temperature treatment. Powder Metall. 2004, 47, 37–42. [Google Scholar] [CrossRef]


Publisher’s Note: MDPI stays neutral with regard to jurisdictional claims in published maps and institutional affiliations. |
© 2021 by the authors. Licensee MDPI, Basel, Switzerland. This article is an open access article distributed under the terms and conditions of the Creative Commons Attribution (CC BY) license (https://creativecommons.org/licenses/by/4.0/).