Article

Numerical Analysis on Characteristics of Reduction Process within a Pre-Reduction Rotary Kiln

1
School of Metallurgy, Northeastern University, Shenyang 110819, China
2
Institute of Solid State Physics, Vienna University of Technology, Wiedner Hauptstr. 8-10, 1040 Vienna, Austria
3
Tangsteel New District Ironmaking Business Department, Hebei Iorn & Steel Group, Tangshan 063000, China
4
Hebei Yanxing Machinery Co., Ltd., Zhangjiakou 075000, China
*
Author to whom correspondence should be addressed.
Metals 2021, 11(8), 1180; https://doi.org/10.3390/met11081180
Submission received: 21 June 2021 / Revised: 22 July 2021 / Accepted: 22 July 2021 / Published: 25 July 2021

Abstract

:
The reduction process inside the ore pre-reduction rotary kiln involves a series of physicochemical reactions, and in-depth understanding of the reduction behavior is helpful to improve the product quality and productivity. This paper reports a three-dimensional steady state mathematical model based on computational fluid dynamics, which considers heat transfer, mass transfer and chemical reactions inside the rotary kiln. A user-defined functions (UDFs) program in C language is developed to define physical parameters and chemical reactions, and calculate the heat and mass transfer between freeboard and bed regions. The model is validated by measurement data and is then used to investigate the detailed information inside the rotary kiln. The results show that there is a temperature gradient in the bed, which is maximal near the kiln tail and decreases gradually as the reduction process progresses. The result also confirms that the reduction of FeO to Fe is the limiting step of the whole reduction process because this reaction requires a higher reduction potential. Furthermore, the influence of C/O mole ratio and fill degree are analyzed by comparing the average bed temperature, reduction potential and metallization ratio.

1. Introduction

As the most efficient technique, blast furnace ironmaking is currently the most widely used ironmaking process. However, it has inherent defects, such as long process, high dependence on coke, environmental pollution and so on. Additionally, with the depletion of coking coal and the strict emission standards of various countries, developing an alternative ironmaking process has always been a hot topic [1,2]. In recent decades, many research institutions and steel companies have carried out research on smelting reduction technology [3,4,5,6]. Among such research, a new smelting reduction process for iron ore processing has been presented by China Iron and Steel Research Institute Group (CISRI) [7,8]. The core of the process consists of two reactors: one is the pre-reduction rotary kiln, and the other one is the smelting reduction furnace. The main purpose of this process using a reliable rotary kiln as a pre-reduction reactor is to use the thermal energy and chemical energy of gas from the final reduction reactor to lighten the load of iron oxide reduction in the smelting reduction process, further improving the energy utilization of the whole system. Undoubtedly, the stable pre-reduction process is also the necessary guarantee for the smelting reduction process. Therefore, it is necessary to study the characteristics of a rotary kiln-based process on the reduction behavior of iron oxide.
Due to the enclosed process and the limitation of measuring equipment, it is difficult to directly obtain the comprehensive information by measurement. To solve this problem, many researchers have suggested employing mathematical methods. For example, Kingsley et al. [9] established a one-dimensional model of mass and energy transfer based on the FORTRAN program, and the obtained result provides a powerful approach for kiln operational optimization. However, due to the one-dimensional nature, the mass and energy balance equations are solved for the solid and gas assuming only axial temperature variation, that is, the solid and gas phases are fully mixed in cross-section, which is obviously far from the actual production. With the development of computational fluid dynamics (CFD), the numerical simulation technique has been widely used to solve such problems. A two-dimensional numerical simulation has been frequently used. Mujumdar et al. [10,11] developed a comprehensive framework based on a two-dimensional model. They divided the computational domain into two regions: freeboard region and bed region, and then connected heat and mass transfer through a common interface. The model was able to predict qualitative and quantitative information about the key parameters. Furthermore, a similar approach was used by Gaurav et al. [12,13] to investigate the influence of input parameters on the metallization ratio and temperature profile. Unfortunately, the two-dimensional model only considers one axial section of the rotary kiln, which makes it difficult to reflect the overall behavior of the rotary kiln. In order to be more relevant to practical production, it is necessary to develop a more practical three-dimensional computational fluid dynamics (CFD) model. Manju et al. [14] developed a three-dimensional numerical model of the pneumatic coal injection and combustion process using the Eulerian–Lagrangian approach. The influence of operating parameters such as particle size distribution and wall temperature on the distribution of injected particles was investigated. However, the reduction process in the bed region was not included. In fact, the flame stability, combustion characteristics and temperature distribution directly affect the reduction process and product quality, and the release of gas from the bed region also affects the distribution of gas and temperature in the freeboard region.
As mentioned above, this work proposed a strategy of a three-dimensional steady state mathematical model with the Eulerian method to investigate the characteristics inside the rotary kiln. This model involved mass, momentum and heat transfers, as well as combustion and reduction reactions both in the freeboard and bed regions. The simulation results show detailed information from inside the rotary kiln, such as the temperature field, variation of gas and solid phase species. Additionally, the effects of key operational parameters on the average bed temperature, reduction potential and metallization ratio are discussed. These findings are helpful to control and optimize the reduction process in the pre-reduction rotary kiln.

2. Model Description

2.1. Description of the Process and Assumption

The schematic diagram of the pre-reduction rotary kiln is shown in Figure 1. The kiln is 48 m long, with a 2.3 m internal diameter and is inclined by 2 degrees. In order to obtain the appropriate temperature profile, the air supply was staged, and five blowers were placed around the kiln at equal spacing to inject air. The raw materials were charged from the kiln tail in a predetermined ratio and heated by the hot flue gas flowing in reverse direction. The iron oxide was gradually reduced to metallic iron, and then the products of kiln were hot-charged into the smelting reduction furnace.
The reduction process in the rotary kiln is complicated, including mass transfer, heat transfer, various chemical reactions and so on. Hence, it is necessary to make some simplifications for developing a mathematical model. In this study, the rotary kiln is divided into two separate regions: freeboard region and bed region, as shown in Figure 2. It is assumed that only gas phase exists in the freeboard region, and both gas and solid phases exist in the bed region. The two regions are coupled through a common boundary, and mass transfer and heat exchange occur between freeboard region and bed region via this boundary.

2.2. Governing Equations

In this work, the rotary kiln model is a 3D steady-state model. Both gas and solid phases are treated as interpenetrating continua phases using the Eulerian method. The governing equations of mass, momentum, energy and species transport for the gas phase and solid phase can be written as follows:
( ε p ρ p ϕ v p ) = ( ε p Γ ϕ ( ϕ ) ) + S ϕ
where the diffusive coefficient (Γϕ), variable (ϕ) and source term (Sϕ) change with different kinds of governing equations, as summarized in Table 1.

2.3. Reaction Kinetics Model

2.3.1. Coal Devolatilization

In the coal devolatilization process, it is considered that coal forms volatile matter and char in the gas phase and solid phase, respectively [15]. This process consists of two steps and can be described as follows:
Coal = ψ1Char + Volatile matter
Volatile matter = ψ2CO + ψ3CO2 + ψ4H2 + ψ5H2O + ψ6CH4 + ψ7N2
The ψ is the mass fraction of pyrolysis products, which is determined by the coal proximate and elemental analysis [16]. Moreover, the release of individual gas species from volatile matter is assumed to be a self-degradation [17], and the first-order reaction model developed by Donskoi was used [18]:
R v i = k v i , 0 exp ( E v a , i R T ) W v i M v i

2.3.2. Homogeneous Reaction

In this model, the solid–solid reactions are neglected because they only take place at the contact surface of particles. For gas–gas reactions, gases’ combustion and water–gas shift reactions are mainly considered. In the complex turbulent reacting flow, the reaction rate is usually controlled by chemical reaction kinetics and turbulent mixing rate. Therefore, the finite rate/eddy-dissipation model was adopted to describe the influence of turbulence–chemistry interaction on the reaction process [19]. This model computes both the Arrhenius rate and the mixing rate, and the smaller is favored. The kinetic parameters of homogenous reactions are shown in Table 2. The reaction rates can be calculated by the following equations:
R i , r = ( v i , r v i , r ) ( k f , r j = 1 N r [ C j . r ] η j , r k b , r j = 1 N r [ C j , r ] η j , r )
R i , r = min { v i , r M w , i A ρ ε k min R ( Y R v R , r M w , R ) , v i , r M w , i A B ε k p Y p j N v j , r n M w , j }

2.3.3. Heterogeneous Reaction

For gas–solid reactions, the main reactions are the carbon gasification (by CO2 and H2O) and the reduction of iron oxides (by CO and H2). Since the pellet is made of very fine particles, the time scale for the reactions at high temperature is much shorter than the time scale for diffusion in the pores. Therefore, it can reasonably be assumed that pores will not contribute significantly to the reaction rate, that is, the gas–solid reactions are limited to the reaction interface. The shrinking core model developed by Sun and Lu was used to describe the heterogeneous reaction process [22,23]. This model takes into account the effects of heat and mass transfer on the reaction rate. The kinetic parameters of these heterogeneous reactions are shown in Table 3. The reaction rates can be calculated by the following equations:
R i C O = S f , i n i 4 π r i 2 ( 1 f i ) 2 3 k i , o exp ( E a , i R T ) ( C c o C c o 2 K e , i )
R i H 2 = S f , i n i 4 π r i 2 ( 1 f i ) 2 3 k i , 0 exp ( E a , i R T ) ( C H 2 C H 2 O K e , i )
R c C O 2 = S f , c n c 4 π r c 2 ( 1 f c ) 2 3 k c , 0 exp ( E a , c R T ) ( C c o 2 C c o 2 K e , c )
R c H 2 O = S f , c n c 4 π r c 2 ( 1 f c ) 2 3 k c , 0 exp ( E a , c R T ) ( C H 2 O C H 2 C C O K e , c )

2.4. Turbulence Model

The standard k-ε model was adopted to simulate the gas phase turbulence in the freeboard region. For the bed region, the details of the movement of solids in the radial direction and variation of bed height are ignored, and solids are regarded as pseudo-homogeneous fluids. The flow velocity of solid particles in the axial direction is very small, and the turbulence has little effect on the reduction process. Hence, the bed region is assumed to be a laminar zone. The standard k-ε model is a two-equation turbulence model based on the transport equation of turbulence kinetic energy (k) and its dissipation rate (ε). The expression is as follows [25,26]:
( ρ k ) t + ( ρ k v ) = [ ( μ + μ t σ k ) k ] + C k ρ ε
( ρ ε ) t + ( ρ ε v ) = [ ( μ + μ t σ ε ) ε ] + ε k ( C ε 1 C K C ε 2 ρ ε )
where Cε1 = 1.44, Cε2 = 1.92, Cμ = 0.09, σk = 1.0, σε = 1.3.

2.5. Radiation Model

In this work, the discrete ordinates (DO) radiation model was used to calculate the radiation flux. The DO model is suitable for solving radiation problem in the entire range of optical thicknesses, especially for the problem of local heat source. The model solves the radiative transfer equation (RTE) for a finite number of discrete solid angles, each associated with a vector direction fixed in the global Cartesian system [27], and the equation can be written as follows:
( I ( r , s ) s ) + ( a + σ s ) I ( r , s ) = a n 2 σ T 4 π + σ s 4 π 0 4 π I ( r , s ) Φ ( s , s ) d Ω
where a is the absorption coefficient of gas phase. Here, the weighted-sum-of-gray-gases model (WSGGM) is used to specify the variable absorption coefficient [28].

2.6. Heat Transfer in the Bed Region

As shown in Figure 2, the heat transfer mechanisms of the top and bottom surfaces of the bed are different. The top surface of the bed is heated mainly by convection and radiation from the gas and radiation from the inner exposed wall. The heat flux of top surface can be defined as [29,30]:
q t o p = h g b ( T g T b ) + e g X b g ( E g J b ) + ( 1 e g ) X b w ( J e w J b )
h g b = 0.46 λ g Re 0.535 Re ω 0.104 η s 0.341 / D e
The bottom surface of the bed receives heat from conduction, convection and radiation from the covered wall. Tscheng and Watkinson [30] have reported the combined heat transmission coefficient between bottom surface and covered wall, and the heat flux is given by:
q b o t t o m = h w b ( T w T b )
h w b = 11.6 λ s R θ ( ω R 2 θ α s ) 0.3
Moreover, the rotation speed of the pre-reduction rotary kiln is very low at 0.6 rpm, and the active layer makes up a very small portion of the bed region. Hence, it is reasonable to treat the heat transfer process of the bed in the rotary kiln approximately according to the heat transfer process of the plug flow region, which is a common method and has been widely used [31,32,33]. The expression of effective thermal conductivity in the bed is as follows [33]:
λ s , e f f = ε s 1 λ s + 1 4 σ e d p T 3 + 4 ε g σ e d p T 3

2.7. Numerical Method and Boundary Condition

Figure 3 shows the geometric model of the rotary kiln. To simplify the model and improve the grid quality, the elbows are simplified with cylinders as air inlets, which has no effect on the simulation results. Figure 4 presents the computational grid of the rotary kiln created using ICEM CFD, containing 4,118,224 hexahedral cells in all regions. The CFD software FLUENT was used for the simulation process. The segregated independent and 3D steady solver was adopted. The governing equations were discretized with second order upwind scheme using the control volume method and solved by SIMPLE arithmetic, and the simulation process was considered as convergence when the residuals are less than 1 × 10⁻⁵. Furthermore, the mass transfer and heat exchange on the interface were defined as mass source and energy sink, and the UDF program in C language was developed and linked to FLUENT to calculate the energy absorbed by bed surface and gas escaping from the bed surface.
The boundary condition of the rotary kiln for numerical simulation is shown in Figure 3. The boundary conditions of fuel-inlet, air-inlet and raw material-inlet are “mass-flow-inlet”. The boundary conditions of gas-outlet and product-outlet are “pressure-outlet”. The mass flow rate and temperature of fuel gas are 0.468 kg/s and 1473 K, respectively. The mass flow rate and temperature of raw material are 2.833 kg/s and 300 K, respectively. The mass flow rate and temperature of combustion air are 0.443 kg/s and 300 K, respectively. The particle size was set to 13 mm. The chemical composition of fuel gas and raw material are listed in Table 4 and Table 5. In addition, the shear condition at the kiln wall is the no-slip condition, and heat transfer coefficient for convection and radiation from kiln wall to environment was calculated by [34]:
h w e c = 0.11 k a D s h ( ( 0.5 Re ω 2 + G r ) Pr a ) 0.35
h w e r = σ e T s h 4 T a 4 T s h T a

3. Results and Discussion

3.1. Model Validation

The comparison between the computational and measured results is listed in Table 6, mainly composed of gas composition and temperature of exhaust gas at the kiln tail, metallization rate (MR) of the reduced product outlet and relative error. The metallization rate (MR) and relative error are given by Equations (19) and (20). As shown in Table 6, the simulation results are in good agreement with the measured value. The maximum relative error between measured and calculated results is 10.8%. Generally speaking, the model in this work is reasonably reliable for predicting the inner characteristics of the rotary kiln.
M R = w Fe w Fe + 56 72 × w FeO + 112 160 × w Fe 2 O 3 + 168 232 × w Fe 3 O 4
Relative   Error = | Measured   value Simulated   value | Measured   value

3.2. Basic Analysis

3.2.1. Temperature Distribution

Figure 5 displays the temperature distribution of the gas phase along the axial section of the pre-reduction rotary kiln. The high temperature zones near the flames due to combustion reactions of H2 and CO are visible, and the maximum temperature at the edge of flames is about 2200 K. Moreover, the combustion-supporting air enters the rotary kiln through five different nozzles to form five combustion regions, which is beneficial to reasonably controlling the axial temperature distribution and preventing local high temperature zones near the bed surface.
Figure 6 shows the temperature distribution of the solid phase within the bed cross-section at different positions. “L” represents the distance from the cross-section to the kiln tail. As expected, the temperature of the cross-section within the bed is not uniform, and there is a temperature gradient in the radial direction. The temperature of the bed surface and bottom is higher than that of the core. To better describe the evolution of temperature, the temperature of the cross-section along the axis of the rotary kiln is illustrated in Figure 7. Tave, Tmax, Tmin and ΔT represent the average temperature, the maximum temperature, the minimum temperature, and the difference between maximum temperature and minimum temperature of the cross-section, respectively. After the raw materials are charged into the kiln at ambient temperature, the raw materials near the outer region are heated rapidly, while the heating rate of raw materials near the core region is relatively slow, and the temperature gradient at the kiln tail is larger than others. As the raw materials move toward the kiln head, the temperature gradient gradually decreases and changes gently after moving to the middle part of the kiln. This is mainly because the heating rate is restrained by carbon gasification reactions (by CO2 and H2O), which are strongly endothermic reactions.

3.2.2. Distribution of Gas Composition

The detailed information of the main gas species’ distribution (O2, CO, H2, CO2, H2O) in the rotary kiln is obtained by calculation. Figure 8 shows the contour of the gas phase in mass fraction along the axial section. To maintain the reducing atmosphere in the kiln, the air supply is insufficient. It can be seen that there is almost no O2 in the kiln except near the nozzles, which is beneficial to reducing the risk of re-oxidization of the metalized Fe. At the combustion reaction zones, a portion of CO and H2 are consumed rapidly. The concentrations of CO and H2 gradually decrease in the direction of gas flow; on the contrary, the concentrations of H2O and CO2 gradually increase.
Figure 9 shows the average mole fraction of gas species (CO, H2, CO2, H2O) in the bed region as a function of distance from the kiln tail, which are the intermediate gases for the reduction of iron oxides by carbon. It is observed that the concentrations of gas species (CO, H2, CO2, H2O) increase linearly near the inlet of raw materials. This is mainly attributed to the rapid release of volatile matter. After that, the volatile mater is gradually exhausted and the concentrations of H2 and H2O gradually decrease. When the materials move to the middle of the rotary kiln, there is almost no H2 and H2O in the system. On the contrary, with the increase of material temperature, the rate of carbon gasification is accelerated. When the generation rate of CO exceeds its consumption rate, the concentration of CO keeps increasing. Moreover, the variation in concentration of CO2 is different from that of CO. The increase of CO2 concentration in the early stage of reduction process may be attributed to the generation of volatile matter and reduction of iron oxide by CO, while the decrease of CO2 concentration in the later stage of the reduction process is attributed to the rapid consumption of carbon gasification.

3.2.3. Variation of Iron Oxides

Figure 10 presents the average mass fraction of solid species (Fe, FeO, Fe2O3, Fe3O4) in the bed region as a function of distance from the rotary kiln tail. When the material temperature is higher than 570 °C, the reduction process of Fe2O3 to Fe includes three steps: Fe2O3→Fe3O4→FeO→Fe. The reduction of Fe2O3 to Fe3O4 occurs rapidly, which is due to the low reduction potential required for this reaction. It can be seen that this reaction has been completed when the material reaches the middle of kiln. Since the reduction rate of Fe2O3 to Fe3O4 is faster than that of Fe3O4 to FeO, the concentration of Fe3O4 increases first and then decreases. Once Fe3O4 is completely reduced to FeO, only the reduction of FeO to Fe remains, and then the concentration of FeO decreases gradually. Obviously, the reduction of FeO to Fe is the rate limiting step of the reduction process because this reaction requires a higher reduction potential. In addition, there is almost no H2 in the system after the materials reach the middle of the rotary kiln (Figure 9), and the reduction reaction of iron mainly occurs in the second half of the rotary kiln. Therefore, it can be considered that H2 makes little contribution to the reduction of FeO to Fe, and CO is the major reducing agent for this reduction reaction.

3.3. Influences of C/O Ratio

The C/O mole ratio is an important parameter in industrial production. To investigate the effect of C/O mole ratio on reduction process, the C/O mole ratio is set to 0.8, 1.0, 1.2 and 1.4, respectively, and the fill degree of the rotary kiln is kept at 11.6%. Figure 11 shows the variation of average bed temperature along the axial section with different C/O mole ratios. It is clear that the trends of average bed temperature for different C/O mole ratios are similar, and the heating rate is first fast and then slow. The fast heating rate in the early stage is mainly due to the large temperature gradient between the bed and surrounding environment. Moreover, the reductions of Fe2O3 and Fe3O4 are the main reactions in this stage, thus the amount of heat consumption by reactions is small. Besides, the average bed temperatures change very little between different C/O mole ratios, which indicates that the effect of the C/O mole ratio on the average bed temperature is negligible.
The reduction potential is defined by Equation (23), which is an important index with which to evaluate the reduction ability of intermediate reducing gas. Figure 12 shows the variation of reduction potential along the axial section with different C/O mole ratios. As shown in Figure 12, comparing the four simulation cases at the same position, the reduction potential increases significantly with the increase of C/O mole ratio. In general, the reduction potential is determined by the gas composition, and the higher reduction potential represents the higher concentration of reducing gas. Clearly, the carbon concentration in the bed increases with the increase of C/O mole ratio. This is helpful to accelerate the carbon gasification reactions, leading to an increase in the concentration of reducing gas.
Reduction   Potential = φ C O + φ H 2 φ C O + φ H 2 + φ C O 2 + φ H 2 O
Figure 13 shows the variation of metallization rate along the axial section with different C/O mole ratios. It can be observed that the decrease of C/O mole ratio is unfavorable to the production of metallic iron. This can be explained by the obtained results from Figure 11 and Figure 12. Both the average bed temperature and reduction potential are very important for the reduction process. Although the C/O mole ratio has little effect on the average bed temperature, it has a strong effect on the reduction potential. At the same bed temperature, the higher reduction potential of reducing gas leads to a stronger reduction ability, which promotes the reduction of FeO to Fe.

3.4. Influences of Fill Degree

In the previous discussion, the fill degree of the rotary kiln is fixed. This section examines the influence of fill degree on the reduction process in the rotary kiln, and the fill degree is set to 11.6%, 16.6%, 21.6% and 26.6%, respectively. Figure 14 shows the variation of average bed temperature along the axial section for different fill degrees. It appears that the fill degree has a strong effect on the average bed temperature. As expected, the higher fill degree lengthens the path of heat transfer throughout the bed, which leads to lower bed temperature.
Figure 15 shows the variation of reduction potential along the axial section for different fill degrees. It is found that the reduction potential decreases with the increase of fill degree. The curves are mainly composed of three parts. In the first part, the reduction potential rapidly increases due to the release of volatile matter. With the increase of fill degree, the bed temperature decreases correspondingly, which weakens the release rate of volatile matter and prolongs the residence time in the first part. The second part is a period with a very slow rising rate, and the reduction potential remains nearly constant in this part. This implies that the supply of reducing gas just meets the requirement of reduction reactions. Similarly, the increase of the fill degree also extends the residence time of the second part. With the increases of bed temperature, the carbon gasification reactions become significant, and the reduction potential rises again, which marks the beginning of the third part and lasts until the product is discharged from the kiln head.
Figure 16 shows the variation of metallization rate along the axial section for different fill degrees. It can be seen that there is almost no metallic iron in the bed at the early stage, and then the metallization rate gradually increases as the reduction reaction progresses. A lower metallization rate is found in the case of higher fill degree at the same position. When the fill degree increases to 26.6%, the final metallization rate is only 26.3%. This is because higher fill degree leads to lower bed temperature and lower reduction potential, which is unfavorable to the reduction reactions. Therefore, in order to ensure product quality, the fill degree should not be too high in practical production.

4. Conclusions

In the present work, the reduction process in a pre-reduction rotary kiln is studied by the computational fluid dynamic approach. Based on the simulation results, the following conclusions can be drawn:
(1) A temperature gradient (ΔT) was found in the bed, which is maximal near the kiln tail and decreases gradually as the reduction process progresses.
(2) The reductions of Fe2O3 to Fe3O4 and Fe3O4 to FeO are always fast, and the reduction of FeO to Fe is the limiting step of the whole reduction process because this reaction requires a higher reduction potential. H2 makes little contribution to the reduction of FeO to Fe, and CO is the major reducing agent for this reduction reaction.
(3) The reduction potential curves can be divided into three parts. The curves increase rapidly in the first part and then remain nearly constant in the second part. In the third part, the curves increase again until the products are discharged from the kiln head.
(4) The C/O mole ratio has little effect on the average bed temperature but has a strong effect on the reduction potential. The higher reduction potential promoted the reduction process.
(5) With the increase of fill degree, both average bed temperature and reduction potential decrease. When the fill degree increases to 26.6%, the final metallization rate is only 26.3%.

Author Contributions

Conceptualization, C.L. and X.D.; methodology, X.Y.; software, C.L.; validation, H.L., C.D. and J.W.; formal analysis, C.L.; investigation, J.W.; resources, C.D.; data curation, H.L.; writing—original draft preparation, C.L.; writing—review and editing, X.D.; visualization, X.Y.; supervision, X.D.; project administration, X.Y.; funding acquisition, X.D. All authors have read and agreed to the published version of the manuscript.

Funding

This research was funded the National Key R&D Program of China (2017YFB0603801).

Institutional Review Board Statement

Not applicable.

Informed Consent Statement

Not applicable.

Data Availability Statement

Not applicable.

Conflicts of Interest

The authors declare no conflict of interest.

Nomenclature

AsArea (m2)RMolar gas constant (J/mol·K)
CpSpecific heat capacity (J/kg·K)RiRate of reaction i (mol/m3·s)
DiMass diffusion coefficient (m2/s)ReReynolds number (‒)
DshDiameter of kiln (m)Sϕ,pSource term for phase p (kg/m3·s)
Ea,iActivation energy of reaction i (J/kg·mol)TTemperature (K)
FgsDrag force (N/m2)vpVelocity of phase p (m/s)
GrGrashof number (‒)YiMole fraction of species i (‒)
HpEnthalpy of phase p (J/mol)Greek Symbols
ΔHiEnthalpy of reaction i (J/mol)αsThermal diffusivity (m2/s)
hHeat transfer coefficient (W/m2·K)εpVolume fraction of phase p (‒)
JRadiation intensity (W/m2)θCentral angel (rad)
kTurbulence kinetic energy (J)λpThermal conductivity (W/m·K)
Ke,iEquilibrium constant of reaction i (‒)ρpDensity of phase p (kg/m3)
MiMolecular weight of species i (kg/mol)σStefan-Boltzmann constant (W/m2·K4)
PPressure (Pa)Subscripts
PrPrandtl number (‒)gGas phase
qHeat flux (J/m2·s)sSolid phase

References

  1. Quader, M.A.; Ahmed, S.; Dawal, S.Z.; Nukman, Y. Present needs, recent progress and future trends of energy-efficient Ultra-Low Carbon Dioxide (CO2) Steelmaking (ULCOS) program. Renew. Sustain. Energy Rev. 2016, 55, 537–549. [Google Scholar] [CrossRef]
  2. Xu, W.; Cao, W.; Zhu, T.; Li, Y.; Wan, B. Material Flow Analysis of CO2 Emissions from Blast Furnace and Basic Oxygen Furnace Steelmaking Systems in China. Steel Res. Int. 2015, 86, 1063. [Google Scholar] [CrossRef]
  3. Qu, Y.; Yang, Y.; Zou, Y.; Zeilstra, C.; Meijer, K.; Boom, R. Thermal decomposition behavior of fine ore particle. ISIJ Int. 2014, 53, 2196–2205. [Google Scholar] [CrossRef] [Green Version]
  4. Srivastava, B.; Roy, S.K.; Sen, P.K. An Approach for Simulation of COREX Process Smelter Gasifier for Prediction of Coal Rate and Silicon in Hot Metal. Metall. Mater. Trans. B 2010, 41, 935–939. [Google Scholar] [CrossRef]
  5. Wu, S.; Xu, J.; Yang, S.; Zhou, Q.; Zhang, L. Basic Characteristics of the Shaft Furnace of COREX(R) Smelting Reduction Process Based on Iron Oxides Reduction Simulation. ISIJ Int. 2010, 50, 1032–1039. [Google Scholar] [CrossRef] [Green Version]
  6. Liu, X.; Pan, G.; Wang, G.; Wen, Z. Mathematical model of lump coal falling in the freeboard zone of the COREX melter gasifier. Energy Fuels 2011, 25, 5729–5735. [Google Scholar] [CrossRef]
  7. Zhang, X.H.; Zhao, K.; Bai, G.C.; Zhang, Y.Z.; Gao, J.J.; Zhang, Y.Y. Thermal analysis of rotary kiln oxygen combustion melting furnace under multi-constraint conditions. Iron Steel 2020, 55, 9–15. [Google Scholar]
  8. Gao, J.J.; Wan, X.Y.; Qi, Y.H.; Wang, F. Technical analysis on ironmaking process of rotary kiln pre-reduction and smelting by coal and oxygen. J. Iron Steel Res. 2018, 30, 91–96. [Google Scholar]
  9. Kingsley, T.C.; Kritzinger, H.P. Modelling and optimization of a rotary kiln direct reduction process. J. South. Afr. Inst. Min. Metall. 2015, 115, 51–60. [Google Scholar]
  10. Mujumdar, K.S. Modeling of Rotary Cement Kilns: Applications to Reduction in Energy Consumption. Ind. Eng. Chem. Res. 2016, 45, 2315–2330. [Google Scholar] [CrossRef]
  11. Mujumdar, K.S.; Ranade, V.V. CFD modeling of rotary cement kilns. Asia-Pac. J. Chem. Eng. 2008, 3, 106–118. [Google Scholar] [CrossRef]
  12. Gaurav, G.K.; Khanam, S. Computational fluid dynamics analysis of sponge iron rotary kiln. Case Stud. Therm. Eng. 2016, 9, 14–27. [Google Scholar] [CrossRef] [Green Version]
  13. Gaurav, G.K.; Khanam, S. Analysis of temperature profile and % metallization in rotary kiln of sponge iron process through CFD. J. Taiwan Inst. Chem. Eng. 2016, 63, 473–481. [Google Scholar] [CrossRef]
  14. Manju, M.S.; Savithri, S. Three dimensional CFD simulation of pneumatic coal injection in a direct reduction rotary kiln. Fuel 2012, 102, 54–64. [Google Scholar] [CrossRef]
  15. Vicente, W.; Ochoa, S.; Aguillon, J.; Barrios, E. An Eulerian model for the simulation of an entrained flow coal gasifier. Appl. Therm. Eng. 2003, 23, 1993–2008. [Google Scholar] [CrossRef]
  16. Merrick, D. Mathematical models of the thermal decomposition of coal. Fuel 1983, 62, 540–546. [Google Scholar] [CrossRef]
  17. Kuwauchi, Y.; Barati, M. A Mathematical Model for Carbothermic Reduction of Dust-Carbon Composite Agglomerates. ISIJ Int. 2013, 53, 1097–1105. [Google Scholar] [CrossRef] [Green Version]
  18. Donskoi, E.; Mcelwain, D.L.S.; Wibberley, L.J. Estimation and modeling of parameters for direct reduction in iron ore/coal composites: Part II. Kinetic parameters. Metall. Mater. Trans. B 2003, 34, 255–266. [Google Scholar] [CrossRef]
  19. Magnussen, B.F.; Hjertager, B.H. On mathematical modeling of turbulent combustion with special emphasis on soot formation and combustion. Symp. Combust. 1977, 16, 719–729. [Google Scholar] [CrossRef]
  20. Silaen, A.; Wang, T. Effect of turbulence and devolatilization models on coal gasification simulation in an entrained-flow gasifier. Int. J. Heat Mass Transf. 2010, 53, 2074–2091. [Google Scholar] [CrossRef]
  21. Mei, Z.; Li, P.; Wang, F.; Zhang, J.; Mi, J. Influences of Reactant Injection Velocities on Moderate or Intense Low-Oxygen Dilution Coal Combustion. Energy Fuels 2013, 28, 369–384. [Google Scholar] [CrossRef]
  22. Sun, S.; Lu, W.K. Mathematical Modeling of Reactions in Iron Ore/Coal Composites. ISIJ Int. 2007, 33, 1062–1069. [Google Scholar] [CrossRef]
  23. Sun, S.; Lu, W.K. Building of a Mathematical Model for the Reduction of Iron Ore in Ore/Coal Composites. ISIJ Int. 2007, 39, 130–138. [Google Scholar] [CrossRef] [Green Version]
  24. Sun, K.; Lu, W.K. Mathematical Modeling of the Kinetics of Carbothermic Reduction of Iron Oxides in Ore-Coal Composite Pellets. Metall. Mater. Trans. B 2009, 40, 91–103. [Google Scholar] [CrossRef]
  25. Jones, W.P.; Launder, B.E. The prediction of laminarization with a two-equation model of turbulence. Int. J. Heat Mass Transf. 1972, 15, 301–314. [Google Scholar] [CrossRef]
  26. Jaw, Y.; Chen, C. Fundamentals of turbulence modeling. J. Fluid Mech. 1998, 371, 379–381. [Google Scholar]
  27. Chui, E.H.; Raithby, G.D. Computation of radiant heat transfer on a nonorthogonal mesh using the finite-volume method. Numer. Heat Transf. Part B Fundam. 1993, 23, 269–288. [Google Scholar] [CrossRef]
  28. Smith, T.F.; Shen, Z.F.; Friedman, J.N. Evaluation of coefficients for the weighted sum of gray gases model. ASME J. Heat Transf. 1982, 104, 602–608. [Google Scholar] [CrossRef]
  29. Gorog, J.P.; Adams, T.N.; Brimacombe, J.K. Regenerative heat transfer in rotary kilns. Metall. Trans. B 1982, 13, 153–163. [Google Scholar] [CrossRef]
  30. Tscheng, S.H.; Watkinson, A.P. Convective heat transfer in a rotary kiln. Can. J. Chem. Eng. 1979, 57, 433–443. [Google Scholar] [CrossRef] [Green Version]
  31. Marias, F.; Roustan, H.; Pichat, A. Modelling of a rotary kiln for the pyrolysis of aluminium waste. Chem. Eng. Sci. 2005, 60, 4609–4622. [Google Scholar] [CrossRef]
  32. Boateng, A.A. On flow-induced kinetic diffusion and rotary kiln bed burden heat transport. Chem. Eng. Commun. 1998, 170, 51–66. [Google Scholar] [CrossRef]
  33. Boateng, A.A.; Barr, P.V. A thermal model for the rotary kiln including heat transfer within the bed. Int. J. Heat Mass Transf. 1996, 39, 2131–2143. [Google Scholar] [CrossRef]
  34. Agrawal, A.; Ghoshdastidar, P.S. Numerical simulation of heat transfer during production of rutile titanium dioxide in a rotary kiln. Int. J. Heat Mass Transf. 2017, 106, 263–279. [Google Scholar] [CrossRef]
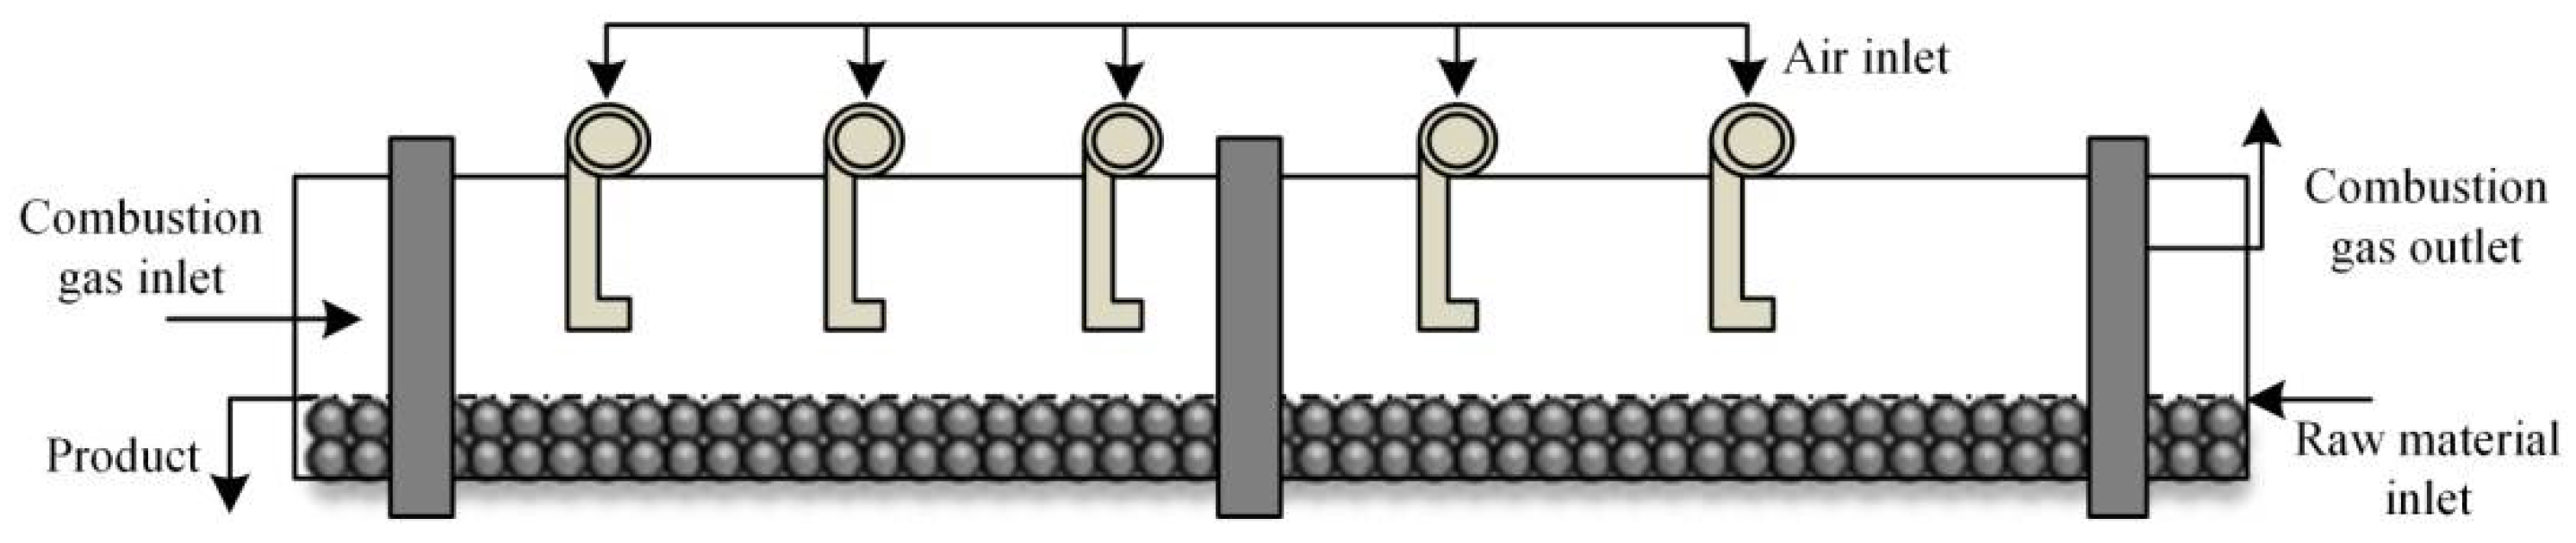
Figure 1. Schematic diagram of the pre-reduction rotary kiln.
Metals 11 01180 g001
Figure 2. Heat and mass transfer between freeboard region and bed region.
Metals 11 01180 g002
Figure 3. Simplified geometric model of the rotary kiln.
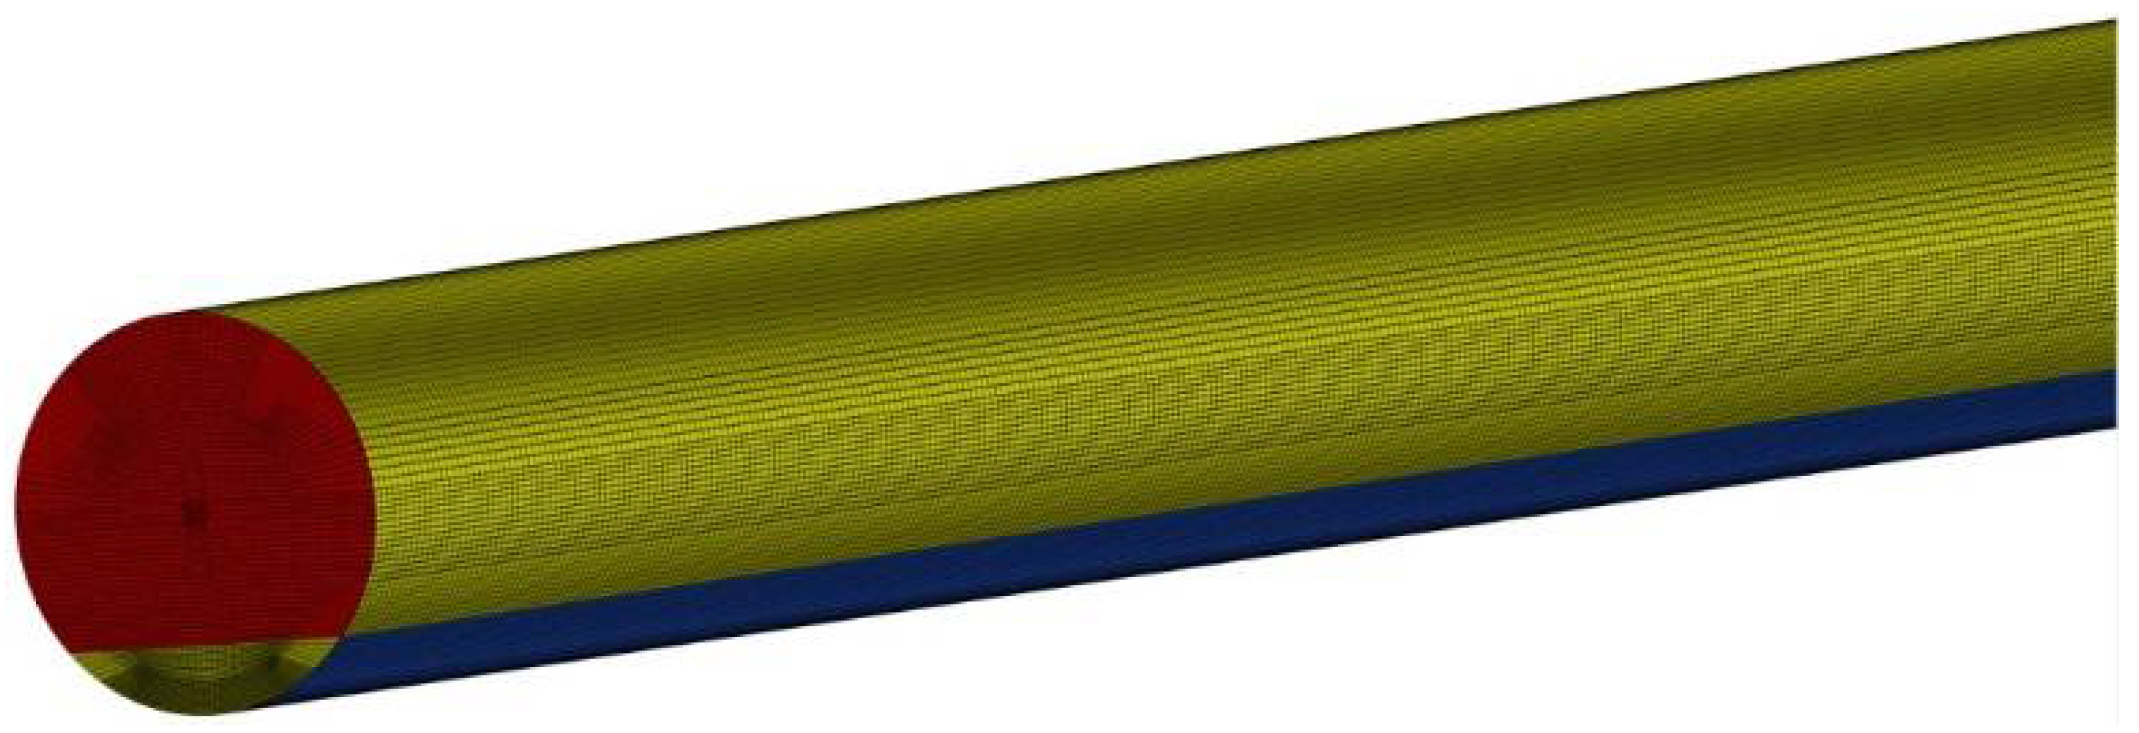
Metals 11 01180 g003
Figure 4. Computation mesh.
Metals 11 01180 g004
Figure 5. Temperature distribution of the gas phase along the axial section.
Metals 11 01180 g005
Figure 6. Temperature distribution of the solid phase within the bed cross-section.
Metals 11 01180 g006
Figure 7. Temperature distribution of the cross-section along the axis of the rotary kiln.
Metals 11 01180 g007
Figure 8. Composition distributions of the gas phase along the axial section.
Metals 11 01180 g008
Figure 9. Average mole fraction of gas composition in the bed region along the axial section.
Metals 11 01180 g009
Figure 10. Average mass fraction of solid composition in the bed region along the axial section.
Metals 11 01180 g010
Figure 11. Average bed temperature along the axial section for different C/O mole ratios.
Metals 11 01180 g011
Figure 12. Reduction potential along the axial section for different C/O mole ratios.
Metals 11 01180 g012
Figure 13. Metallization rate along the axial section for different C/O mole ratio.
Metals 11 01180 g013
Figure 14. Average bed temperature along the axial section for different fill degrees.
Metals 11 01180 g014
Figure 15. Reduction potential along the axial section for different fill degree.
Metals 11 01180 g015
Figure 16. Metallization rate along the axial section for different fill degrees.
Metals 11 01180 g016
Table 1. Variables in Equation (1).
PhaseEq.ϕΓϕSϕ
GasMass10Sϕ,g
Momentum v g 0 ε g ( P + ρ g g ) + F g s
EnergyHgλg/CP,g h g s A s ( T g T s ) + M o n = 1 n ( R n Δ H n T )
Species iYi,gρg Di k R i , k M i
SolidMass10Sϕ,s
Momentum v s 0 ε s ( P + ρ s g ) F g s
EnergyHsλs,eff/CP,s h g s A s ( T s T g ) M o n = 1 n ( R n Δ H n T )
Species jYj,sρsDj k R j , k M j
Table 2. Kinetic parameters of homogenous reactions [20,21].
ReactionAr (s−1)Ea (J/kmol)βrReaction Order
2CO + O2 = 2CO22.2 × 10121.7 × 1080[CO][O2]
2H2 + O2 = 2H2O6.8 × 10151.67 × 108−1[H2]0.25[O2]1.5
CO + H2O = CO2 + H22.75 × 1098.4 × 1070[CO][H2O]
Table 3. Kinetic parameters of heterogeneous reactions [24].
Reactionski,0 (m·s−1)Ea (J/mol)KeRate Expressions
C + CO2 = 2CO1.87 × 108221,800exp (−20,765.92/T + 32.8)Equation (9)
C + H2O = CO + H26.05 × 105172,700exp (−16,142.19/T + 28.16)Equation (10)
3Fe2O3 + CO = 2Fe3O4 + CO22700113,859exp (5815.5/T + 5.5076)Equation (7)
3Fe2O3 + H2 = 2Fe3O4 + H2O16092,000exp (2065/T + 8.102)Equation (8)
Fe3O4 + CO = 3FeO + CO22371,100exp (−4685.22/T + 5.19)Equation (7)
Fe3O4 + H2 = 3FeO + H2O3063,600exp (−1857.51 + 1.01)Equation (8)
FeO + CO = Fe + CO21769,454exp (2376.46/T−2.82)Equation (7)
FeO + H2 = Fe + H2O3063,600exp (−1857.51/T + 1.01)Equation (8)
Table 4. Chemical composition of fuel gas.
SpeciesCOCO2H2H2ON2
Mole fraction56.720.014.34.84.2
Table 5. Chemical composition of raw material.
SpeciesFe2O3FeOAl2O3SiO2CaOMgOTiO2CVolAsh
Mass fraction38.624.62.63.51.12.75.015.34.71.9
Table 6. Comparison between measured and simulated results.
ParametersMeasuredSimulatedRelative Error
CO(%)19.420.24.3%
CO2(%)24.222.95.1%
H2(%)8.19.010.8%
H2O(%)15.214.91.6%
T(K)102310022.1%
Metal(%)70.072.43.4%
Publisher’s Note: MDPI stays neutral with regard to jurisdictional claims in published maps and institutional affiliations.

