Abstract
High-voltage and alternating current conductors are mainly made up of a steel core and an envelope made of aluminum wires. The alloys commonly used in the shell are of pure aluminum, which provides low electrical resistivity, but also low mechanical resistance. The correlation between resistance and electrical resistivity has become a design limitation, which limits the development of new alloys. Traditional airline conductors limit their service temperature to a maximum of 80 °C. Al-Zr alloys are susceptible to hardening by aging treatment at high temperatures due to the precipitation of the metastable L12-Al3Zr phase, which allows their working temperature to be limited to 300 °C. This work aims to correlate the resistance and electrical resistivity of two alloys with hyperperitectic compositions, subjected to a solution treatment at 640 °C. At the same time, the aging potential at different temperatures is analyzed using aging duration of up to 900 h. Whereas, the ultimate goal is to correlate the results with electrical resistivity, trying to achieve resistivity values lower than 28 nΩm. It is worth mentioning that there is a slow aging process and the inverse correlation between hardness and electrical resistivity. The optimum result is achieved in an alloy with more than 0.4% Zr subjected to aging at 380 °C in a time range between 425 and 900 h. In these cases, electrical resistivity values lower than 26 nΩm were reached. Transmission electron microscopy (TEM) verified the nanometric size of the L12-Al3Zr precipitates and their coherence with the α(Al) matrix. In turn, the size distribution of the precipitates was analyzed, revealing two different families of precipitates with respective averages of 4 and 19 nm. The precipitates associated with the average of 4 nm are the majority when the aging time is 425 h. However, when the aging time increases to 900 h, sizes close to 20 nm are the majority. This confirms the slow growth of the L12-Al3Zr precipitates during aging and the beginning of the over-aging phenomenon after almost 900 h of aging.
1. Introduction
High voltage and alternating current conductors are mainly made up of a steel core and an aluminum wire sheath. The aluminum alloys currently used are practically pure aluminum, which provides high electrical conductivity, but low mechanical resistance [1]. This sheath takes advantage of the skin effect of the alternating current, which tends to flow preferentially along the periphery of the circular section of the cable. This is due to the countercurrent electromotive force generated in the core of every conductor by the action of the magnetic field [2]. Steel provides rigidity and mechanical resistance to the conductor. These conductors can be subject to fatigue phenomena derived from the combined action of their own weight and the changes in winds speed and direction [3]. The fatigue resistance of the conductor can be further compromised if corrosive processes derived from high rainfall may also occur. If any of the aluminum wires were to break, high intensity arcs could be struck between the fractured ends, inducing high temperatures and microstructural variations that reduce the mechanical resistance of the wires without fragmenting. These weakened threads could become fractured by gusts of wind. Moreover, gradually, there would be an increase in the intensity of current in the few aluminum wires that present continuity. This will produce an increase in temperature that would increasingly compromise the strength of the aluminum wires that remain without fracturing [4]. All this justifies the development of new aluminum alloys with greater mechanical resistance and greater thermal resistance, while maintaining high electrical conductivity. The correlation between resistance and electrical conductivity becomes a limitation that restricts the development of Al-based alloys, with simultaneously high resistance and enhanced electrical conductivity [1,5,6,7,8]. An example of these alloys, capable of balancing resistance and electrical conductivity, are Al-Zr alloys. These alloys are susceptible to hardening by an aging heat treatment due to the precipitation of the metastable L12-Al3Zr phase, which presents a cubic structure coherent with the α(Al) matrix. This phase is kinetically stable up to 475 °C [1,9,10,11,12,13,14,15]. The nucleation and growth of this metastable phase is quite slow, due to the low diffusivity of Zr in Al [7,16]. It is known, in fact, that the diffusivity coefficient is estimated to be around 10–15 m2/s [7]. These kinetics can be accelerated by adding alloying elements such as Er, Yb, Sc or Y [15,16]. To achieve the maximum aging potential, some researchers propose to obtain a supersaturated solid solution of Zr in Al by means of very fast solidification [17,18,19]. The cores of the solidification dendrites present a higher density of these precipitates, and these are smaller than in the interdendritic zones. This indicates that the nucleation of this phase is induced by the segregation of Zr in these areas, resulting in a smaller critical nucleation radius in the core of the solidification dendrites than in the interdendritic zones [1]. The metastable L12-Al3Zr phase transforms to its more stable phase when the alloy is kept at elevated temperatures for several hours [1]. The most common Zr weight percentage in these alloys is around 0.3%. At this percentage, the liquidus temperature is about 750 °C and the solidus temperature is 660.5 °C [7]. With percentages lower than 0.28%, a peritectic reaction occurs and the primary solidification phase is Al3Zr. Figure 1 shows the binary equilibrium diagram of Al-Zr up to a Zr weight percent of 0.6%. The maximum solubility of Zr in the α(Al) phase is 0.28% at 660.5 °C. Once the alloy has solidified, the aging potential could be increased if a solution treatment is carried out below the solidus temperature followed by a very rapid cooling, obtaining a supersaturated solid solution of Zr in the α(Al) phase. The optimum aging temperatures are in the range 350–425 °C, which allows its resistance to be maintained up to temperatures around 300 °C. An increase in electrical conductivity is observed during the aging of these alloys. This is due to the precipitation of the Zr atoms that were in solid solution [1].
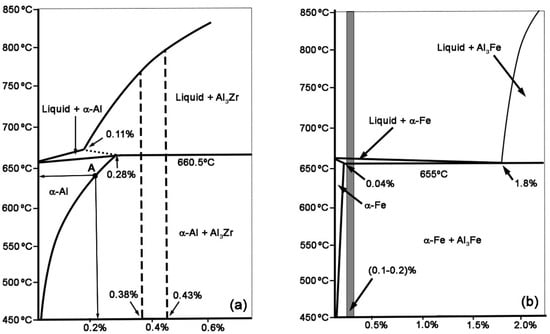
Figure 1.
Al-Zr and Al-Fe equilibrium binary diagrams. Percentages by weight are shown on the abscissa axes. (a) Al-Zr diagram. Alloy-I has 0.38% Zr and Alloy-II 0.43%; (b) Al-Fe diagram. Both alloys are represented with the grey-shaded band.
Traditional airline conductors limit their working temperature to a maximum of 80 °C. However, HTLS (High Temperature Low Sag) conductors can extend their application range up to 150–230 °C. These conductors have an Al envelope with approximately 0.3% Zr. The IEC 62004 standard (International Electrotechnical Commission) classifies these conductors into four groups, depending on the required requirements. The maximum electrical resistivities are limited between 28,735 and 31,347 nΩm [20].
The aim of this work is to analyze the behavior of two aluminum alloys containing around 0.4% by weight of Zr, subjected to i) solution treatments at high temperature, 640 °C and ii) prolonged aging treatments of up to 900 h. The main objective is to assess the effectiveness of a solution treatment at high temperatures for hyperperitectic Zr compositions on the aging potential and correlate the results with electrical resistivity. Whereas, the mean challenge of the proposed study would be to achieve values lower than 28 nΩm.
2. Materials and Methods
Table 1 shows the chemical compositions of the analyzed alloys. It should be noted that, in addition to Zr, these alloys contain a certain amount of Fe. These alloys were cast in a tundish at a temperature of 900 °C, from which the molten metal is transferred into a U-shaped circular copper mold cooled with water, producing a rectangular cross-section bar that is transported by rollers to the rolling mills where the bar is transformed into a 10 mm diameter wire rod, working in a temperature range between 500 and 520 °C. Once this process is finished, the material is water-cooled to a temperature of about 50 °C.

Table 1.
Chemical composition (in weight %).
Figure 1 shows the Al-Zr and Al-Fe equilibrium binary diagrams. In Figure 1a it can be seen that both qualities are in the hyperperitectic chemical composition range of the Al-Zr diagram. The liquidus temperature of both compositions is in the range 760–810 °C. In a non-equilibrium solidification, the Zr may have a stronger tendency to segregate into the core of the solidification dendrites. Figure 1b shows the compositional range between 0.1 and 0.2 of Fe where both qualities are found. It can be observed that both qualities have hypoeutectic compositions and that, contrary to Zr, in a non-equilibrium solidification, Fe has a tendency to segregate to the last solidifying liquid in the interdendritic regions and grain boundaries. The amount of Fe present in those alloys does not produce a notable decrease in the electrical conductivity of Al. However, the Al3Fe precipitates favor a slight increase in the strength of the alloy [20].
Both qualities were subjected to a dissolution treatment at 640 °C for 2 h in order to increase the solubility limit of Zr in Al matrix up to point A, shown in Figure 1a. Then, they were all cooled in water to 12 °C and immediately subjected to the aging treatment so as not to reduce their hardening potential during aging. Two aging temperatures were tested: 380 and 400 °C. For electrical resistivity measurements, 24 rod samples were cut for each alloy with a length of 300 mm. The hardness measurements were performed using another 24 rod samples cut for each alloy with 10 mm length.
The microstructure of the wire rod was analyzed after hot forming and after dissolution heat treatment with cooling in water. The preparation of the metallographic specimens was carried out through the following steps: (1) cutting with a SiC disc, (2) cold-mounting in epoxy resin, (3) grinding with SiC papers of different abrasive grain sizes ranging from grit 240 to 600, and, finally, (4) polishing in three stages with textile cloths using different types of abrasives in each step. In a first stage, 6 and 1 µm diamond paste was used, while in the second stage a 0.5 µm alumina solution was used and, in a third stage, a 0.05 µm colloidal silica solution was employed. (5) The chemical etching attack was carried out in two stages. At first, the following solution was used: 2 mL of HF, 3 mL of HCl, 5 mL of HNO3 and 190 mL of distilled water. Later, a solution consisting of a mixture of 4 g of KMnO4, 1 g of NaOH in 100 mL of distilled water was used. The optical microscope used was a NIKON Epiphot 200 (Nikon, Tokyo, Japan) and the images were obtained using the OmniMet Enterprise image analyzer software (Omnimet Enterprise, Buehler, Coventry, UK).
After the aging treatment, the morphology, structure and composition of the precipitates were analyzed using transmission electron microscopy (TEM). The equipment used was the JEOL JEM-2100F from the Technical-Scientific Services of the University of Oviedo (SEM, JEOL, Nieuw-Vennep, The Netherlands). This equipment is equipped with a Field Emission Gun (FEG) operating at an acceleration voltage of 200 kV and an ultra-high-resolution pole-piece objective lens, which allows it to achieve a resolution of 1.9 Å between points and 1.0 Å between lines. The process for the preparation of the samples, for their observation, was as follows: Initially the samples were sectioned until reaching thicknesses of less than 1 mm. For this, a precision cutter with a diamond blade (Struers Minitom, Madrid, Spain) was used. The samples, approximately 2 × 4 mm2 in size, were then thinned to a thickness of 40 µm. This process was done by mechanical grinding using Dimple Grinder (Gatan model 565). Subsequently, an ionic “thinning” was carried out, using the Precision Ion Polishing System (PIPS ™ model 691 from Gatan, Pleasanton, CA, USA), at an acceleration voltage of the Argon ion beam of 4 keV and an angle of incidence of 10°. Then, the samples were gently milled at 0.5 keV until the samples were perforated. Finally, the SOLARUS 950 Advanced Plasma Cleaner (Gatan, Pleasanton, CA, USA) was used to clean the samples’ surface prior to TEM analysis.
All Vickers hardness values were obtained under the application of a 31.25 kg load. The results correspond to the average value obtained from 20 indentations per each sample.
For each sample the resistivity value, ρ, is obtained by means of the experimental circuit schematically shown in Figure 2. From the measurements of the voltage that the sample supports (VR) and the current flowing through it (IR), the value of its resistance, Rsample, is calculated by applying Ohm’s law. Knowing the value of the resistance, the resistivity can be obtained through the following expression:
where S is the cross-sectional area of the sample and L is the length between the points where the potential difference VR is measured.
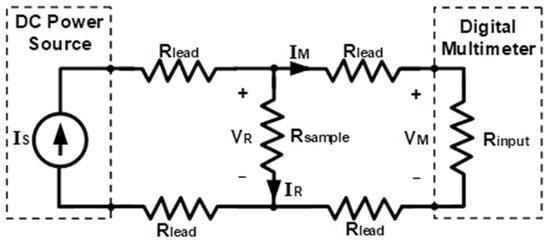
Figure 2.
Experimental scheme used for four-wire resistivity measurements. VR is the voltage that the sample supports; IR is the current flowing through of the sample; Rsample is the resistance sample. Rlead is the resistance of the connecting cables; IS is the value of the current that the circuit supplies; VM is the voltage measured by this multimeter; RINPUT is the resistance of the multimeter and IM is the value of the current of the part of the multimeter circuit.
In order to avoid the error in the measurement that the resistance of the connection cables would introduce, Rlead, due to the low resistance values of the samples, the measurements were carried out with a four-wire assembly (Figure 2). For this, a direct current source, model 6063 from Keysight Technologies (Keysight Technologies Spain, Madrid, Spain), was used, with which the value of the circuit supply current, IS, was set. The measurement of the voltage VR was carried out with a digital multimeter, model 2400 from Keithley Instruments (Keysight Technologies Spain, Madrid, Spain). The voltage measured by this multimeter, VM, can be considered equal to VR since the high Rinput value makes IM negligible, and consequently, so are the voltage drops in the cables that connect the multimeter with the sample to be tested. Similarly, it can also be considered that the current IR is equal to that supplied by the source IS. The resistivity values were determined from the VR measurements made at different distances for the same sample: 100, 150, 200, 250 and 300 mm.
For each heat treatment, 3 rods were used which generated a total of 15 measurements for each heat treatment.
3. Results
The microstructure obtained in both alloys after solution treatment at 640 °C and subsequent water-cooling is shown in Figure 3. A single-phase microstructure is observed in both cases, so it can be deduced that the solution treatment was effective and the potential for structural hardening in both alloys is high. After this treatment, the obtained hardness of Alloy-I (0.38% Zr) was 23 HV and the hardness of Alloy-II (0.43% Zr) was 24 HV.
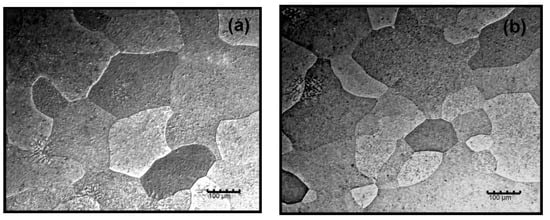
Figure 3.
Microstructure after solution treatment at 640 °C and cooling in water. (a) Alloy-I, 0.38% Zr; (b) Alloy-II, 0.43% Zr.
The hardness and electrical resistivity results are illustrated in Figure 4. In all cases, it can be confirmed that the electrical resistivity decreases as the hardness increases by aging treatment. Slightly higher hardness peaks are reached in Alloy-II, compared to Alloy-I. Moreover, it is found that these hardness peaks are higher when aging is carried out at 380 °C. On the other hand, the lowest values of electrical resistivity are reached in Alloy-II aged at 380 °C, resulting in values even lower than 26 nΩm after 425 h of aging. Whereas, in this same alloy, aged at 400 °C, a slight rise in electrical resistivity is observed after 900 h of aging. The optimum aging time at 400 °C is observed after 425 h, where the peak of hardness of about 33 HV and a resistivity of 26 nΩm are reached. The onset of over-aging takes place after 900 h of aging where the hardness was reduced to 32 HV and the resistivity increased slightly above 27 nΩm. Figure 5 and Figure 6 analyze the microstructural differences that could justify this change in trend. From their analysis, it seems to be confirmed that the growth of the transitional intermediate precipitates, L12-Al3Zr, is quite slow due to the low diffusivity of Zr in Al, and that over-aging would not begin until over 900 h.
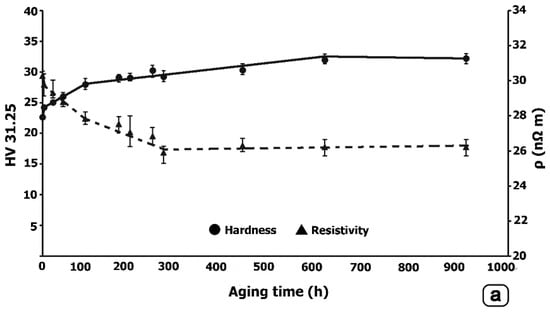
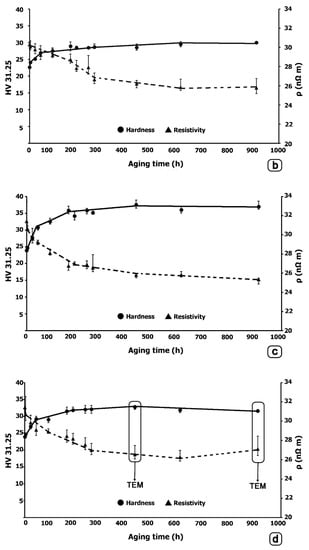
Figure 4.
Hardness and electrical resistivity. (a) Alloy-I aged at 380 °C; (b) Alloy-I aged at 400 °C; (c) Alloy-II aged at 380 °C; (d) Alloy-II aged at 400 °C. In the last figure, the samples analyzed by TEM are marked.
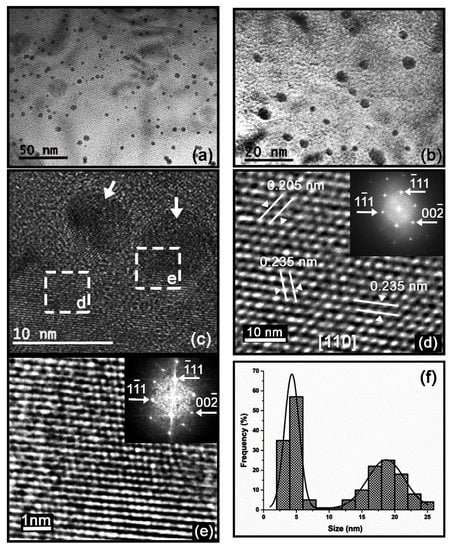
Figure 5.
Alloy-II aged at 400 °C for 425 h. (a,b) TEM images at different magnifications showing the size and morphology of the precipitates; (c) TEM image showing two nanometric precipitates; (d) HRTEM image of the area enclosed by the dashed square “d” in (c) in which the solid white lines show the measured interplanar distances; the inset in this image shows the indexed FFT pattern; (e) HRTEM image (including its indexed FFT pattern) of the area enclosed by the dashed square “e” in (c) showing the coherence of a nanometric precipitate of the metastable L12-Al3Zr phase with the lattice of α(Al) matrix in the (110) plane; (f) Histogram of the size distribution of the precipitates.
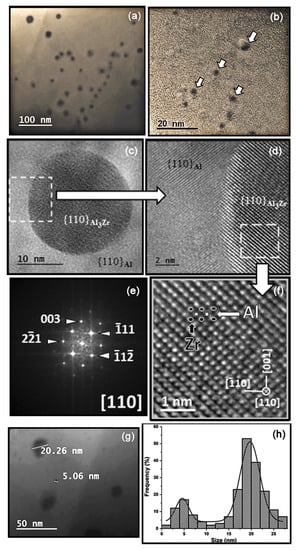
Figure 6.
Alloy-II aged at 400 °C for 900 h. (a,b) TEM images at different magnifications showing the size and morphology of the precipitates; (c) TEM image showing a nanometric precipitate of the metastable L12-Al3Zr phase in (110) facet of the α(Al) matrix; (d) HRTEM image of the area enclosed by the dashed square in (c) showing the coherence of this nanosized precipitate of the metastable L12-Al3Zr phase with the matrix of α(Al) in the (110) plane. (f) HRTEM image, and (e) its indexed FFT pattern, corresponding to the area enclosed by the dashed square in (d). Pointed out, in an illustrative way, is the atomic structure model of the cubic Al3Zr-phase superimposed on it; (g) TEM image showing the two families of precipitate sizes; (h) Histogram of the distribution of the size of the precipitates.
The results of TEM analysis of Alloy-II aged at 400 °C for 425 h and 900 h are shown in Figure 5 and Figure 6, respectively. Figure 5a–c and Figure 6a–c show the nanometric size and spherical morphology of the precipitates. The HRTEM (High Resolution Transmission Electron Microscopy) image in Figure 5d and its indexed FFT (Fast Fourier Transform) pattern in the inset, in which the measured interplanar distances (d111 = 2.35 Å, d002 = 2.05 Å) are shown, confirm the FCC (Face-Centered Cubic) crystal structure (a = 4.0497 Å, Fm-3m) of the α(Al) matrix. The HRTEM images of Figure 5e and Figure 6d show the coherence of the nanometric precipitates of the metastable L12-Al3Zr phase with the α(Al) matrix lattice within the (110) facet. The HRTEM images and their indexed FFT pattern in Figure 5e and Figure 6e–f corroborates that these nanometric precipitates correspond to the metastable L12-Al3Zr phase that crystallizes in the FCC crystal structure (a = 4093 Å, Pm-3m).
Figure 5f and Figure 6h show the histograms of the size distribution of the precipitates, corresponding to the samples aged for 425 and 900 h, respectively. These histograms were obtained by measuring the size of ~200 particles in each sample. The solid black line corresponds to the bimodal Gaussian distribution function fitted to these histograms. Two distinct families of nanosized precipitates can be observed in both cases, with average values of around 5 and 20 nm, respectively. In the sample aged for 425 h, the mean values for both families were 4.3 and 18.6 nm, with the smallest precipitates being the majority. Whereas the mean values for both families in the sample aged for 900 h were 4.6 and 19.7 nm. However, in the latter case, the largest precipitates are the majority. This corroborates the slow growth of the L12-Al3Zr precipitates and the over-aging after 900 h. The metastable precipitates grow during the aging treatment by diffusion of atoms from the supersaturated solid solution (after dissolution treatment at 640 °C) to the precipitates. As the supersaturation decreases, the precipitates continue to grow in accordance with Ostwald ripening. The process is driven by a reduction in surface energy, so that the larger precipitates coarsen as the smaller ones dissolve. As the precipitates grow, the coherency strain increases until interfacial bond strength is exceeded and the precipitates become non-coherent [21]. In Figure 4d it can be seen that, as the size of the precipitates increases, there is a decrease in hardness and electrical conductivity. Some of these latter precipitates are shown in Figure 7, which were aged for 900 h at 400 °C. The key is to create very small intragranular coherent L12-Al3Zr nanoprecipitates. As the size of the precipitates increases, the local strain field increases, which is an obstacle to the movement of electrons, slightly increasing electrical resistivity [5]. Figure 7a shows the phases analyzed by EDX (SEM-energy-dispersive X-ray spectroscopy). Table 2 shows the results. It can be seen how the precipitates indicated in spectra 1 to 3 correspond to the L12-Al3Zr phase. The results corresponding to spectra 4 and 5 would correspond with the matrix phase. The absence of Zr can be observed in said matrix phase. The presence of Cu atoms in solid solution is observed, both in the matrix phase and in the L12-Al3Zr phase. This is due to the presence of traces of Cu in the chemical composition. It should be noted that copper at up to ~1.5 wt.% has little effect on the as-cast structure, since most of it dissolves in α(Al) [22]. Figure 7b shows Al (red) and Zr (green) element line-scan profiles and line-scan plots of number of counts versus distance recorded. A slightly higher Cu concentration is detected in the precipitates. This is because Cu atoms dissolved in the matrix tend to diffuse towards a shell at the particle/matrix interface [9].
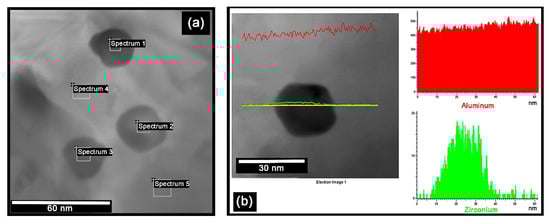
Figure 7.
STEM images and EDX analysis of the large precipitates in Aloy-II aged at 400 °C for 900 h. (a) The areas that were analyzed by EDX microanalysis are indicated; (b) Al (red) and Zr (green) element line-scan profiles and line-scan plots of number of counts versus distance recorded.
Table 2.
Semi-quantitative EDX microanalysis of the phases indicated in Figure 7a (in atomic%).
4. Conclusions
The aim of this work is to study the aging potential of two Al-Zr alloys with hyperperitectic compositions, subjected to a solution treatment at 640 °C and subsequent water-cooling. In addition, we analyzed the evolution of electrical resistivity with long aging duration of up to 900 h, until achieving electrical resistivity values lower than 26 nΩm. The main conclusions are as follows:
- The solution treatment at 640 °C followed by cooling in water is effective in obtaining single-phase microstructures, which explain the high potential for structural hardening.
- As the hardness increases during aging, the electrical resistivity decreases.
- The greatest hardness values were achieved with aging at 380 °C. The alloy with 0.43% Zr exceeded greatly the 35 HV after 425 h of aging. After 600 h of aging, electrical resistivities of less than 26 nΩm were reached.
- Two families of L12-Al3Zr precipitates with average diameters of 4 and 20 nm were observed. When the aging time is around 425 h, the precipitates belonging to the more abundant family had an average diameter of 4 nm and those of the less abundant one had an average diameter of 20 nm. In contrast, after 900 h, the precipitates with an average diameter of 4 nm became less abundant when compared to the precipitates with a diameter of 20 nm. This confirms the slow growth of the L12-Al3Zr precipitates during aging and the onset of over-aging after almost 900 h.
Author Contributions
F.A.-A. conceived and designed the investigation, analyzed the data and wrote the paper; Z.A., A.G.-P., M.G.M. and A.C.-V. performed all laboratory work. All authors have read and agreed to the published version of the manuscript.
Funding
This research received no external funding.
Data Availability Statement
Data are contained within the article.
Conflicts of Interest
The authors declare no conflict of interest.
References
- Fadayomi, O.; Sanders, P.G.; Odegard, G.M. Microstructure and properties of precipitation-hardened Zr and Zn-Zr based aluminum alloys. J. Alloys Compd. 2019, 788, 1218–1230. [Google Scholar] [CrossRef]
- Montes, J.M.; Cintas, J. Ciencia e Ingeniería de Materiales; Paraninfo: Madrid, Spain, 2014; pp. 492–496. [Google Scholar]
- Gonzalez-Pocino, A.; Alvarez-Antolin, J.F.; Asensio-Lozano, J. In-Service Microstructural Modifications caused by Fatigue Phenomena leading to the Failure of a High-Voltage Cable. Prakt. Metallogr. -Pract. Metallogr. 2019, 56, 288–302. [Google Scholar] [CrossRef]
- Zhang, J.Y.; Wang, B.; Wang, H.; Zhang, C.M. Improvement in compressive creep resistance of Al-0.2Zr alloy with L1(2) structured Sc-enriched precipitates. Mater. Charact. 2020, 159, 10. [Google Scholar] [CrossRef]
- Jiang, S.Y.; Wang, R.H. Manipulating nanostructure to simultaneously improve the electrical conductivity and strength in microalloyed Al-Zr conductors. Sci. Rep. 2018, 8, 13. [Google Scholar] [CrossRef] [Green Version]
- Erol, H.; Tecer, H.; Acer, E.; Kadioglu, C.; Gunduz, M. Tensile Strength of Al-Zr Overhead Line Conductors. Light Met. Technol. 2013, 765, 793. [Google Scholar] [CrossRef]
- Cadirli, E.; Tecer, H.; Sahin, M.; Yilmaz, E.; Kirindi, T.; Gunduz, M. Effect of heat treatments on the microhardness and tensile strength of Al-0.25 wt.% Zr alloy. J. Alloys Compd. 2015, 632, 229–237. [Google Scholar] [CrossRef]
- Du, X.D. Study on ageing and creep of Al-0.1Zr alloy. Mater. Sci. Eng. 2006, 432, 84–89. [Google Scholar] [CrossRef]
- Cassell, A.M.; Robson, J.D.; Race, C.P.; Eggeman, A.; Hashimoto, T.; Besel, M. Dispersoid composition in zirconium containing Al-Zn-Mg-Cu (AA7010) aluminium alloy. Acta Mater. 2019, 169, 135–146. [Google Scholar] [CrossRef]
- Knipling, K.E.; Dunand, D.C.; Seidman, D.N. Precipitation evolution in Al-Zr and Al-Zr-Ti alloys during aging at 450–600 degrees C. Acta Mater. 2008, 56, 1182–1195. [Google Scholar] [CrossRef]
- Mahmudi, R.; Sepehrband, P.; Ghasemi, H.M. Improved properties of A319 aluminum casting alloy modified with Zr. Mater. Lett. 2006, 60, 2606–2610. [Google Scholar] [CrossRef]
- Park, W.W. Alloy designing and characterization of rapidly solidified Al-Zr(-V) base alloys. Mater. Des. 1996, 17, 85–88. [Google Scholar] [CrossRef]
- Zhang, Y.Z.; Zhou, W.; Gao, H.Y.; Han, Y.F.; Wang, K.; Wang, J.; Sun, B.D.; Gu, S.W.; You, W.R. Precipitation evolution of Al-Zr-Yb alloys during isochronal aging. Scr. Mater. 2013, 69, 477–480. [Google Scholar] [CrossRef]
- Knipling, K.E.; Dunand, D.C.; Seidman, D.N. Nucleation and precipitation strengthening in dilute Al-Ti and Al-Zr alloys. Metall. Mater. Trans. A-Phys. Metall. Mater. Sci. 2007, 38, 2552–2563. [Google Scholar] [CrossRef]
- Gao, H.Y.; Feng, W.Q.; Wang, Y.F.; Gu, J.; Zhang, Y.Z.; Wang, J.; Sun, B.D. Structural and compositional evolution of Al-3(Zr, Y) precipitates in Al-Zr-Y alloy. Mater. Charact. 2016, 121, 195–198. [Google Scholar] [CrossRef]
- Zhang, Y.Z.; Gao, H.Y.; Wang, Y.F.; Wang, J.; Sun, B.D.; Gu, S.W.; You, W.R. Effects of Y addition on microstructure and properties of Al-Zr alloys. Trans. Nonferrous Met. Soc. China 2014, 24, 2239–2243. [Google Scholar] [CrossRef]
- Belov, N.A. Aluminium casting alloys with high content of zirconium. Alum. Alloy. Phys. Mech. Prop. 1996, 217, 293–298. [Google Scholar] [CrossRef]
- Berezina, A.L.; Segida, O.O.; Nosenko, V.K.; Schmidt, U.; Kotko, A.V. Ageing of the rapidly-quenched Al-Zr alloys. Met. I Noveishie Tekhnologii 2006, 28, 1493–1507. [Google Scholar]
- Brodova, I.G.; Bashlykov, D.V.; Yablonskikh, T.I.; Stolyarov, V.V. Formation of supersaturated solid solutions in Al-Zr (Fe) alloys upon shear under pressure and their behavior upon annealing. Phys. Met. Metallogr. 2002, 94, S82–S90. [Google Scholar]
- Knych, T.; Piwowarska, M.; Uliasz, P. Studies on the process of heat treatment of conductive AlZr alloys obtained in various productiveprocesses. Arch. Metall. Mater. 2011, 56, 685–692. [Google Scholar] [CrossRef] [Green Version]
- Sjolander, E.; Seifeddine, S. The heat treatment of Al-Si-Cu-Mg casting alloys. J. Mater. Process. Technol. 2010, 210, 1249–1259. [Google Scholar] [CrossRef] [Green Version]
- Belov, N.; Korotkova, N.; Akopyan, T.; Tsydenov, K. Simultaneous Increase of Electrical Conductivity and Hardness of Al-1.5 wt.% Mn Alloy by Addition of 1.5 wt.% Cu and 0.5 wt.% Zr. Metals 2019, 9, 1246. [Google Scholar] [CrossRef] [Green Version]
Publisher’s Note: MDPI stays neutral with regard to jurisdictional claims in published maps and institutional affiliations. |
© 2021 by the authors. Licensee MDPI, Basel, Switzerland. This article is an open access article distributed under the terms and conditions of the Creative Commons Attribution (CC BY) license (https://creativecommons.org/licenses/by/4.0/).