Article

Superior Hydrogen Sorption Kinetics of Ti0.20Zr0.20Hf0.20Nb0.40 High-Entropy Alloy

1
School of Physics, University of Electronic Science and Technology of China, Chengdu 610054, China
2
Institute of Nuclear Physics and Chemistry, China Academy of Engineering Physics, Mianyang 621900, China
3
Applied Ion Beam Physics Laboratory, Institute of Modern Physics, Fudan University, Shanghai 200433, China
4
School of Materials Science and Engineering, The University of New South Wales, Sydney, NSW 2074, Australia
*
Authors to whom correspondence should be addressed.
Jianwei Zhang and Pengcheng Li contributed equally to this work.
Metals 2021, 11(3), 470; https://doi.org/10.3390/met11030470
Submission received: 8 February 2021 / Revised: 18 February 2021 / Accepted: 27 February 2021 / Published: 12 March 2021

Abstract

:
High entropy alloys (HEAs) are composed of multiple main metal elements and have attracted wide attention in various fields. In this study, a novel Ti0.20Zr0.20Hf0.20Nb0.40 HEA was synthesized and its hydrogenation properties were studied, including sorption thermodynamics and hydrogen absorption/desorption kinetics. The maximum hydrogen absorption capacity was 1.5 H/atom at 573 K. X-ray diffraction (XRD) analysis indicated that the crystal structure of Ti0.20Zr0.20Hf0.20Nb0.40 HEA transformed from body-centered cubic (BCC) to body-centered tetragonal (BCT) with increasing hydrogen content, and to face-centered cubic (FCC) after hydrogen absorption to saturation. As a multi-principal element alloy, the Ti0.20Zr0.20Hf0.20Nb0.40 HEA possesses unique hydrogen absorption characteristics. The hydrogen absorption platform pressure rises gradually with the increase of the hydrogen absorption amount, which is caused by multiple kinds of BCT intermediate hydrides with consecutively increasing c/a. The full hydrogen absorption of the Ti0.20Zr0.20Hf0.20Nb0.40 HEA was completed in almost 50 s, which is faster than that of the reported hydrogen storage alloys in the literature. The experimental results demonstrate that the Ti0.20Zr0.20Hf0.20Nb0.40 HEA has excellent kinetic properties, unique thermodynamic hydrogen absorption performance, as well as a low plateau pressure at room temperature.

1. Introduction

With social and economic development, non-renewable energy sources (such as coal, oil, etc.), which have caused global environmental pollution, have become increasingly exhausted. As a renewable fuel, hydrogen is a promising energy carrier in the future due to its high calorific value and almost zero emissions [1,2,3,4,5]. However, the premise of hydrogen energy application is based on the development of safe, economical and effective hydrogen storage materials [3,6]. There is a rich variety of solid hydrogen storage materials, including intermetallic compounds, complex hydrides and chemical hydrides, etc. [7,8]. Compared with gaseous hydrogen storage and liquid hydrogen storage, solid hydrogen storage demonstrates higher safety, higher hydrogen storage density and better reversibility [9,10,11]. In recent decades, hydrogen storage alloys have been considered good hydrogen storage materials because of their high safety, low cost, non-greenhouse gas generation, high hydrogen storage per unit volume and high hydrogen absorption/release reversibility [12,13,14]. From metal to alloy to alloy doping, the composition of hydrogen storage alloys has becomes more and more complex with the development of research [8,14]. Different from traditional alloys with one principal element, high-entropy alloys (HEAs) are characterized by multiple main elements, which was first proposed by Yeh [15] in 2004. Due to the high-entropy, lattice distortion, sluggish diffusion and cocktail effect of HEAs [16,17], their properties have many advantages [17,18,19,20,21,22], such as excellent mechanical properties (high hardness, good ductility, etc. [21,23,24]), high thermal stability [25], resistance to corrosion [26] and so on.
Studies on the hydrogen storage performance of HEAs are still in the preliminary stage. It has been reported that HEAs with certain elements show unique hydrogen storage performance [27,28,29,30,31,32,33,34,35,36,37,38,39,40,41]. The progress in research into HEAs’ hydrogen storage properties will be described briefly. The hydrogen storage performance of HEAs is greatly affected by the composition of the elements. Kao, et al. [27] first reported the hydrogen storage performance of multi-component CoFeMnTixVyZrz alloys, and studied the effects of different x, y and z values on the hydrogen storage performance of the alloys. Therefore, the diversity of the composition of elements creates more chances to regulate the hydrogen storage properties of HEA. The hydrogen storage gravimetric capacity of HEA can be improved by selecting light elements. Lightweight MgZrTiFe0.5Co0.5Ni0.5 HEA with a body-centered cubic (BCC) structure was easily prepared from pure elements by ball milling under the argon (Ar) atmosphere by Zepon et al. [34]. Theoretically, the hydrogen storage gravimetric capacity of MgZrTiFe0.5Co0.5Ni0.5 HEA can reach 3.5%wt. Moreover, some HEAs have larger H/atom capacities than conventional alloys, indicating that they have a greater hydrogen storage potential. TiVZrNbHf HEA had a hydrogen storage capacity H/M atomic ratio of 2.5, and is the HEA with the maximum hydrogen storage capacity to date, reported by Sahlberg, et al. [30]. This is because lattice distortion contributes to the storage of hydrogen in both tetrahedral and octahedral gaps, and ultimately the TiVZrNbHf HEA stores large quantities of hydrogen. The hydrogen absorption and desorption phase transition process of some HEAs is more complex than traditional alloys. Zlotea, et al. [35] synthetized a new TiZrNbHfTa HEA by vacuum arc melting. Pressure–composition isotherm (PCI) analysis indicated that there are two plateaus for hydrogen absorption. The corresponding X-ray diffraction (XRD) showed that the crystal structure of the alloys before and after hydrogen absorption changed from BCC to face-centered cubic (FCC), and there was an intermediate tetragonal monohydride phase.
The thermodynamic and kinetic properties of hydrogen storage in HEAs have rarely been systematically studied. The effects of different components of Ti0.20Zr0.20Hf0.20MoxNb0.40−x (x = 0, 0.10, 0.20, 0.30, 0.40) HEA on thermal stability was studied in a previous work [38]. It was found that the increase of the Nb element increased the cell volume of the hydride, which would improve the hydrogen storing capacity and the thermal stability. The study of thermal properties is very important and common for alloys [42]. The results suggested that Ti0.20Zr0.20Hf0.20Nb0.40 HEA presents better thermal stability due to the higher binding energy of its hydride. Further study of its kinetic properties is therefore worthwhile. In this work, the thermodynamics and kinetics of the hydrogen storage properties of Ti0.20Zr0.20Hf0.20Nb0.40 HEA were investigated. The relationship of the phase structure transformation of Ti0.20Zr0.20Hf0.20Nb0.40 HEA with respect to the hydrogen content was studied in detail using XRD.

2. Materials and Methods

2.1. Sample Preparation

A Ti0.20Zr0.20Hf0.20Nb0.40 HEA ingot (20 ± 1.5 mm in diameter) was prepared using the arc-melting method [37,38]. All the raw materials were 99.99% purity particles, and the size ranged from 1 to 10 mm [38]. The furnace was purged with argon gas (99.99% purity) three times before melting, and each time the chamber was evacuated to 5 × 10⁻³ Pa. The arc furnace working pressure was 5 × 10⁴ Pa. High melting-point metals like Nb and Hf were put on the top layer, whereas the Ti and Zr metals were laid at the bottom. The alloy ingot was evenly distributed by repeated stirring and melting five times to improve the homogeneity.

2.2. Hydrogenation Performance Test

The alloy ingot was cut with a computer numerical control (CNC) wire-cut electric discharge machine to prepare 1 cm × 1 cm bulk samples with a thickness of 5 mm. The bulk sample was mechanically polished to remove the surface contaminates and oxide layer, followed by the chemical cleaning with deionized water, acetone and anhydrous ethanol in turn. The bulk Ti0.20Zr0.20Hf0.20Nb0.40 HEA was degassed and activated in a home-made Sievert-type apparatus. To obtain the Ti0.20Zr0.20Hf0.20Nb0.40 HEA powder, the bulk sample was degassed up to 893K under a base vacuum of 1 × 10⁻⁵ Pa, followed by the thermal activated at 873K for 12 h in a 4.5 × 10⁶ Pa H2 environment. Afterwards, the Ti0.20Zr0.20Hf0.20Nb0.40 HEA was ground into powder in a glove box filled with argon gas (99.9%, 1 × 10⁵ Pa) using agate before the hydrogenation experiments.
The thermodynamic properties were measured by PCI curves using the home-made Sievert-type equipment, which can sustain up to 5 × 10⁶ Pa hydrogen pressure at temperatures up to 600 °C. The weighted Ti0.20Zr0.20Hf0.20Nb0.40 HEA powder (509.5 mg) was put in a quartz tube and then into the sample holder. The PCI curves were measured at temperatures of 573, 673, 773 and 873 K, with an upper hydrogen pressure of 5 × 10⁵ Pa. The test temperature was kept constant for 1 h before each experiment to ensure the experiment temperature was accurate and uniform.
The hydrogen absorption/desorption kinetics of the Ti0.20Zr0.20Hf0.20Nb0.40 HEA were evaluated in powder form using the SETARAM PCTPRO (Setaram of KEP Technologies, Mougins-Sophia Antipolis, France) volumetric instrument. For the hydrogen absorption kinetic measurements, the test temperature was selected as 573, 673, 773 and 873 K and the initial hydrogen pressure was 2 × 10⁵ Pa. Before each experiment, the hydrogen was completely discharged (pressure < 1 × 10⁻⁴ Pa), and the experiment was automatically terminated when the deviation of hydrogen absorption pressure was less than 0.1% within 30 min. The hydrogen desorption kinetic measurements were performed at 673, 773 and 873 K. The Ti0.20Zr0.20Hf0.20Nb0.40 HEA powder was fully hydrogen charged before each test.

2.3. Sample Characterization

The surface morphology of Ti0.20Zr0.20Hf0.20Nb0.40 HEA bulk was characterized by scanning electron microscope (SEM, Zeiss Auriga workstation, Carl Zeiss Microscopy GmbH, Jena, Germany) equipped with an X-ray energy dispersive spectroscopy system (EDS, Oxford X-MaxN 150 mm2, Oxford Instruments, Abingdon, UK). The alloy composition and the distribution of Ti, Zr, Hf and Nb elements were analyzed using EDS. The crystal structures of Ti0.20Zr0.20Hf0.20Nb0.40 HEA and its hydrides were determined by XRD [43] (PANalytical B.V., Almelo, The Netherlands), using an X’Pert PRO MPD working at 40 kV and 40 mA. The typical scanning parameters are 25–90° in 2θ, 0.013° in step size and 0.4 s in count time.

3. Results

3.1. Microstructure of the As-Cast HEA Alloy

Zhang et al. [18,44] proposed the principle for the formation of solid solution phase in high entropy alloys: atomic-size difference δ < 8.5%, mixing entropy 11 J/(K·mol) < ΔSmix < 19.5 J/(K·mol) and mixing enthalpy 22 kJ/mol < ΔHmix < 7 kJ/mol. The above values for the Ti0.20Zr0.20Hf0.20Nb0.40 HEA were calculated to be δ = 5.51%, ΔSmix = 11.1 K·mol and ΔHmix= 1.28 kJ/mol [38], which conforms to the principle of the formation of single phase HEA. Figure 1a shows the SEM image of the Ti0.20Zr0.20Hf0.20Nb0.40 HEA and Figure 1b–e displays the EDS maps of Ti, Zr, Hf and Nb elements from the area in Figure 1a. The EDS results show that the actual chemical composition of the synthesized HEA was Ti0.202Zr0.194Hf0.204Nb0.399, which is similar to the designed Ti0.20Zr0.20Hf0.20Nb0.40 alloy. The four metal elements were distributed uniformly in the alloy without the precipitation of an intermetallic phase, which is consistent with the XRD results. The above results demonstrate that the single BCC phase Ti0.20Zr0.20Hf0.20Nb0.40 HEA was successfully synthesized.

3.2. Thermodynamic Properties of the HEA Alloy

The PCI curves at four constant temperatures ranging from 573 to 873 K were measured and plotted in Figure 2. At each test temperature, the hydrogen pressure increases slowly with the hydrogen content during the hydrogen absorption, and sharply increases with the hydrogen content up to the full hydrogenation. Figure 2b is a magnified image of the denoted area in Figure 2a with a hydrogen pressure ranging from 0 to 0.1 × 10⁵ Pa, which presents the hydrogen plateau pressure at different temperatures more clearly. The plateau pressure of hydrogen absorption and the maximum equilibrium hydrogen storage capacity at different temperatures are tabulated in Table 1.
It is interesting to note that the shape of the plateau of this HEA presents a steep slope, which is similar to that of the deuterium absorption plateau of Ti-Hf alloys [45]. It is reasonable to assume that the inclined plateau pressure of Ti0.20Zr0.20Hf0.20Nb0.40 HEA is correlated to the distorted lattice, which is caused by the multi-principal component characteristics of the HEA. Generally, a plateau in the PCI curve is thought to be a phase transformation and cell volume expansion caused by the hydrogen uptake for the pure metal [11,12]. A series of intermediate hydride phases might be formed due to the distorted lattice of HEA, which induces the consecutively increasing slope in the PCI curve. The region with hydrogen absorption less than 0.6 H/atom was taken for analysis, since the plateau pressure change in this region was smaller and more similar to the single plateau model. It is clear that in this region the average plateau pressure of the Ti0.20Zr0.20Hf0.20Nb0.40 HEA increased from 7 to 1530 Pa with the increasing temperature from 573 to 873 K. On the contrary, the maximum equilibrium hydrogen storage capacity decreased from 1.5 H/atom to 0.98 H/atom with the increasing test temperature.
As shown in Figure 2b, the hydrogen average plateau pressures at the four temperatures were obtained. The curve with the horizontal coordinate of 1000/T and the vertical coordinate of Ln(P) is plotted in Figure 3. The relationship between Ln(P) and 1000/T is linear fitted using the following formula [12,46,47,48].
ln P H 2 = Δ H 0 / R T Δ S 0 / R
In the Van’t Hoff Formula (1), P H 2 is the hydrogen absorption plateau pressure, Δ H 0 is the standard enthalpy, Δ S 0 is the standard entropy, R is the gas constant (8.314 J·mol−1·K−1) and T is the test temperature in kelvins.
The fitting results indicate that the slope ( k = Δ H 0 / R ) and the intercept ( b = Δ S 0 / R ) are −9.14 ± 0.34 and 17.92 ± 0.49, respectively. The standard entropy and standard enthalpy of HEA hydride are calculated to be Δ H 0 = 76 ± 3   kJ · mol 1 and Δ S 0 = 149 ± 4   J · mol 1 · K 1 , respectively. Moreover, the hydrogen absorption plateau pressure is extrapolated to be 1.6 × 10⁻⁸ Pa at 298 K.

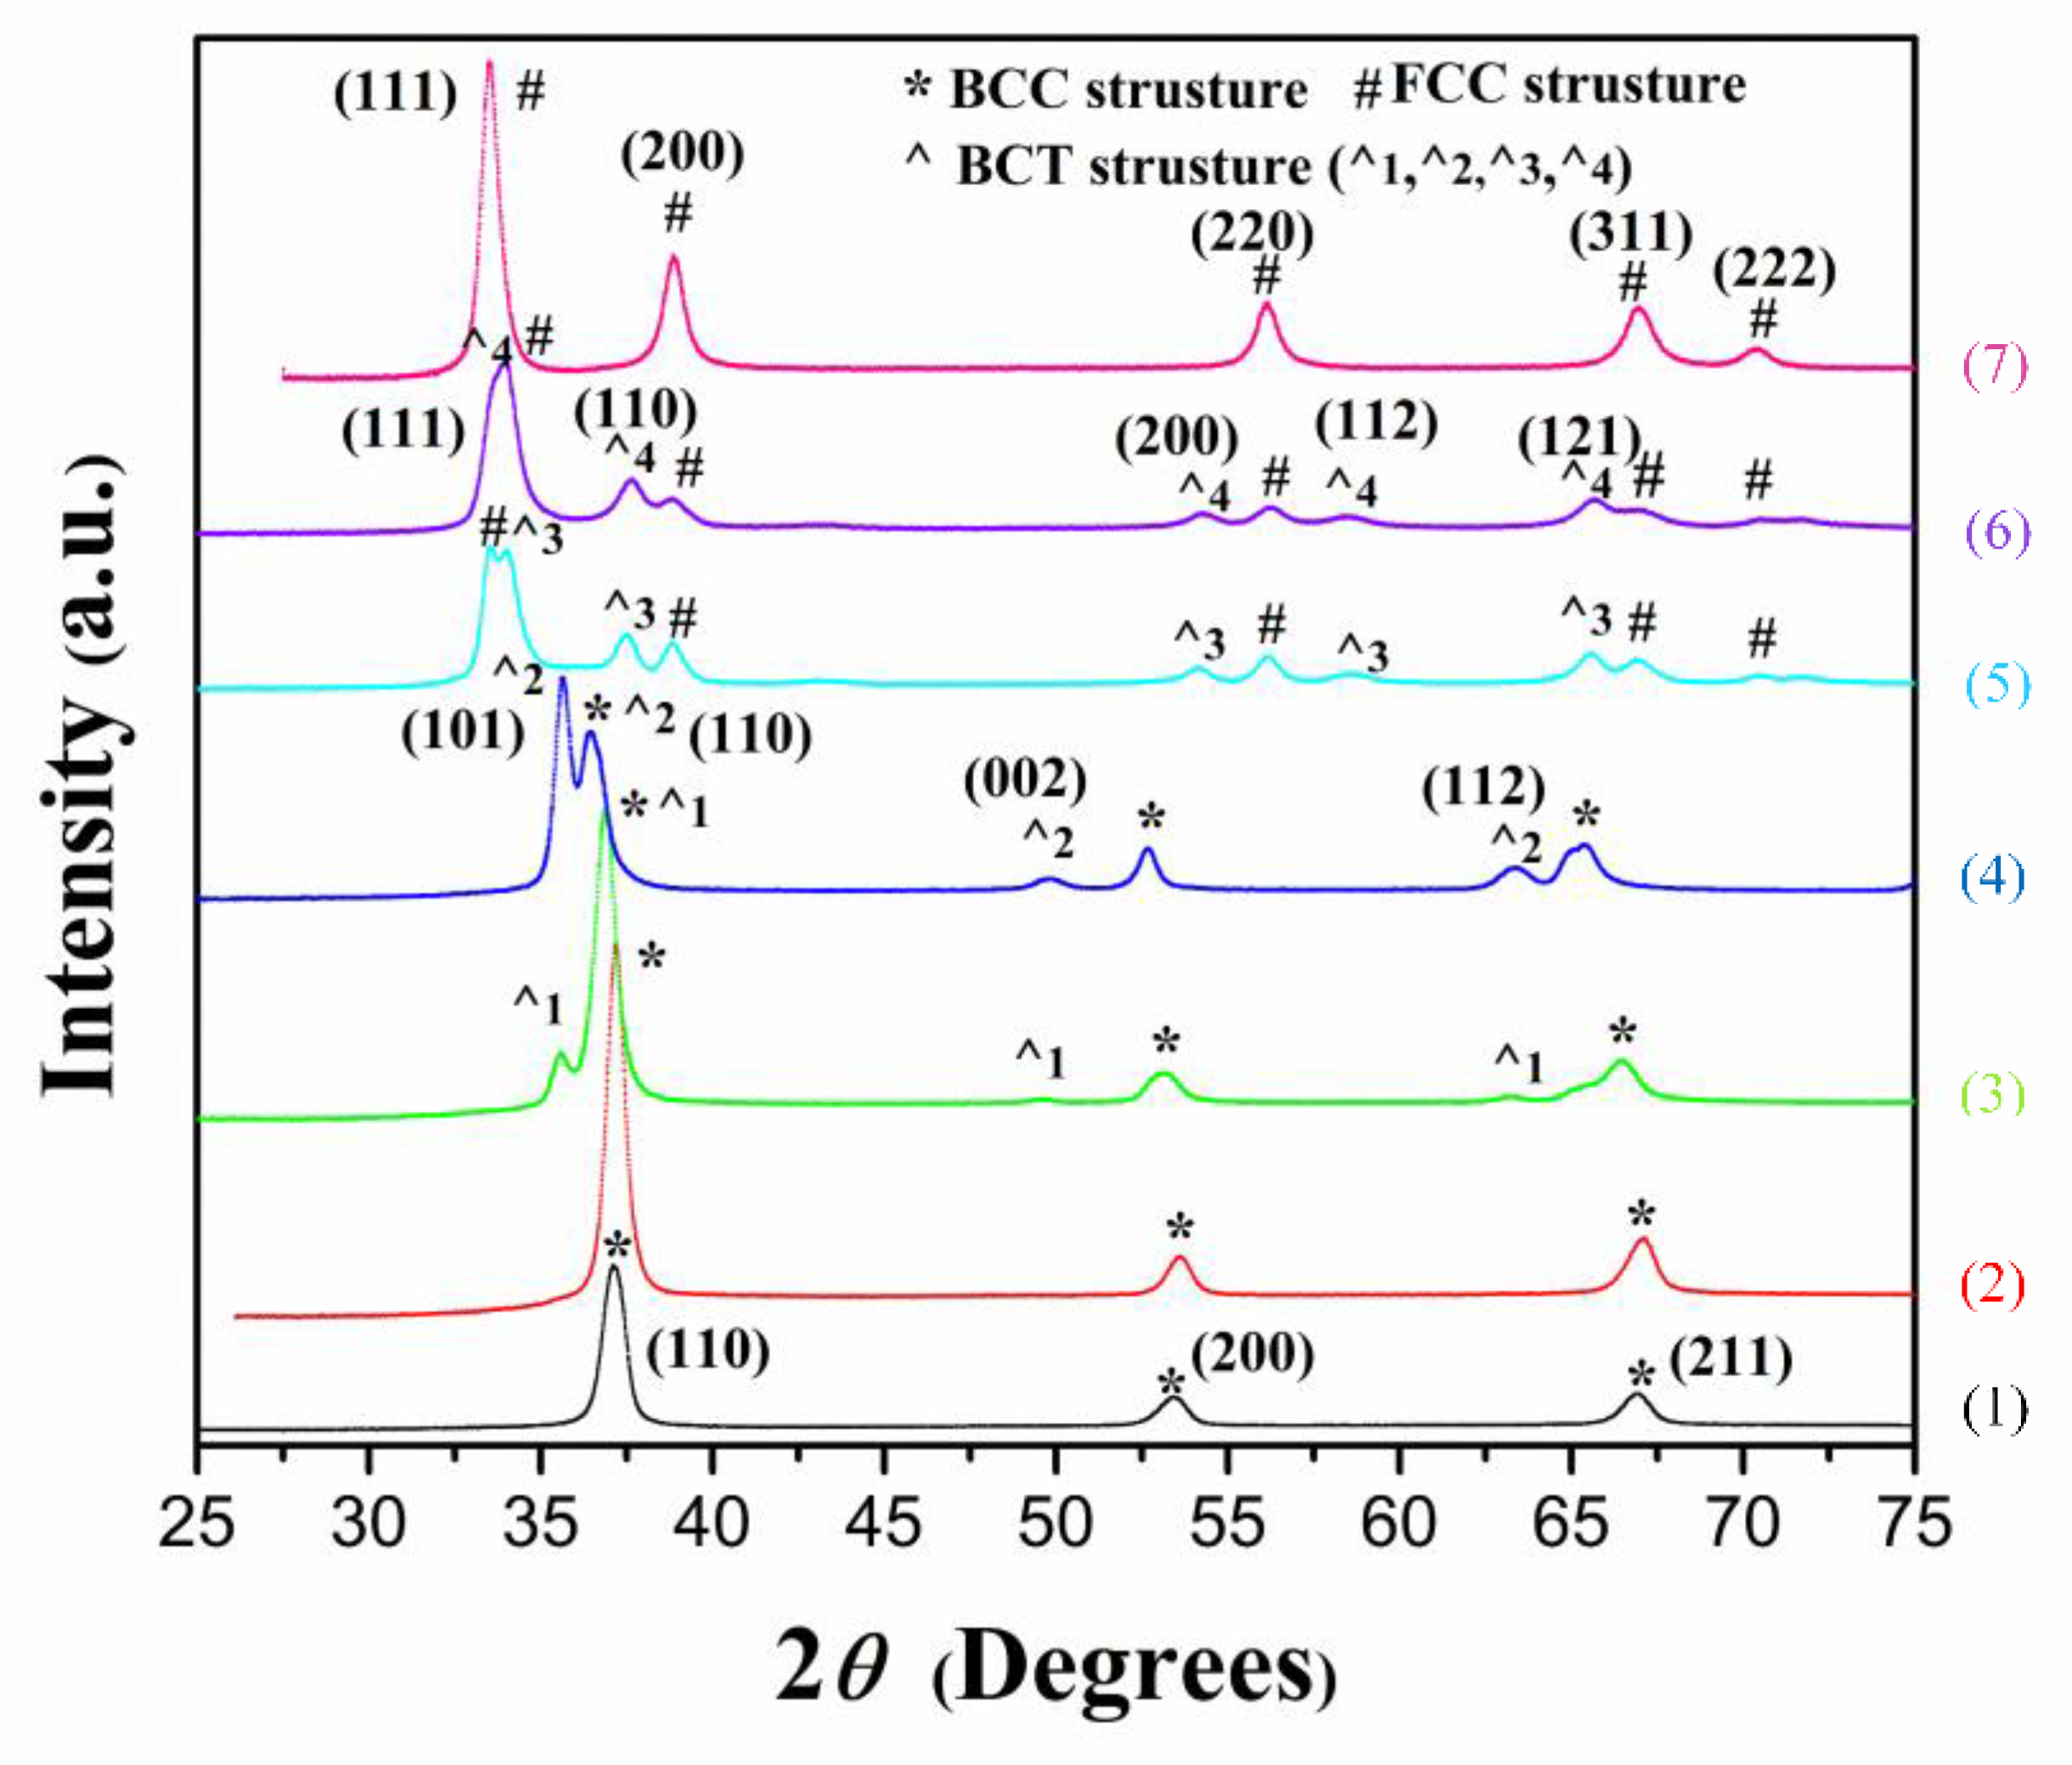
3.3. Crystal Structure Transition during the Hydrogen Absorption

To explore the crystal structure transition during the hydrogen absorption, a series of Ti0.20Zr0.20Hf0.20Nb0.40 HEA hydrides with different hydrogen contents were prepared using the home-made hydrogenation equipment. According to the gas state equation, a certain amount of hydrogen gas was calculated and inserted into the sample holder to obtain an HEA hydride sample with a differing hydrogen content (1) before adsorption hydrogen (P), ((2) 0.05H/atom (P), (3) 0.2H/atom (P), (4) 0.4H/atom (P), (5) 0.8H/atom (P), (6) 1.1H/atom (P), (7) 1.6H/atom fully Hydride (P)) at room temperature. Figure 4 shows the XRD patterns of the Ti0.20Zr0.20Hf0.20Nb0.40 HEA and its hydrides with different hydrogen contents. The XRD pattern of the HEA powder after desorption of HEA hydride is also included in the pattern. The crystal structure, lattice constants and cell volume of the Ti0.20Zr0.20Hf0.20Nb0.40 HEA powder and its hydrides were calculated and are summarized in Table 2. For the Ti0.20Zr0.20Hf0.20Nb0.40 HEA powder (P), three major peaks could be observed in the XRD patterns ((1)) at 37.9, 54.6 and 68.4°, which have been carefully indexed as (110), (200) and (211) planes of a BCC crystal, which is in accordance with the reported structure of HEAs in the literature [36,37,38]. No other diffraction peaks from other intermetallic or precipitates were found in the XRD patterns, implying that Ti0.20Zr0.20Hf0.20Nb0.40 HEA has a single phase with a BCC structure, in spite of mixing up to four metals in the alloy.
During the earlier stage of hydrogen absorption processing, the crystal structure of Ti0.20Zr0.20Hf0.20Nb0.40 HEA hydride remained BCC and the cell volume increased with the hydrogen content. It was speculated that the hydrogen had just entered the HEA and diffused into the lattice interstitials of the HEA. The lower hydrogen content of less than 0.2 H/atom is not enough to induce the phase transition, instead causing the slight cell volume expansion of the BCC lattice. This transition corresponds to the PCI curve at the early stage of the hydrogen absorption plateau area, shown in Figure 2. There is an intermediate phase with a body-centered tetragonal (BCT) structure before the hydrogen absorption to full saturation. The hydrogen absorption plateau pressure of this HEA changed during the hydrogen absorption, following the precipitation of the BCT intermediate phase. As for the inclined plateau in Figure 2, the hydrogen absorption pressure of Ti0.20Zr0.20Hf0.20Nb0.40 HEA increased with the increasing hydrogen content and environmental temperature. Once the hydrogen content increased to 0.2 H/atom and 0.4 H/atom, the full occupancy of the interstitial sites had been reached. At that time, the lattice expansion of the BCC structure caused the structure to transition to a BCT1 and BCT2 structure with a c/a of 1.07 and 1.05, whereas lattice volume rose to 43.63 A3 and 44.44 A3. Once the hydrogen atoms entering the gap occupying the interstitials reached a certain amount, the lattice expansion would give rise to a phase structure transition. However, the region with a large gap can still have a certain amount of hydrogen storage margin, so some BCC will be transformed into BCT, which may be the reason for the small width and low inclination of the plateau pressure observed in the early stage. With the increase in hydrogen absorption, HEA entered the middle and later stages of the plateau, as shown in Figure 2, and the plateau inclination gradually increased. This is due to the fact that more and more BCC was transformed into BCT, and the biphasic coexistence gradually appeared, and BCT gradually became the main phase. With the further increase in hydrogen content, the amount of hydrogen entering the lattice gap could no longer maintain the original HEA structural phase, and the new FCC phase appeared. When the hydrogen storage capacity was between 0.8 and 1.1 H/atom, the c/a of BCT3 and BCT4 structure expanded up to 1.240 and 1.244, and the cell volume expanded up to 47.81 A3 and 48.01 A3, and the FCC structure started to precipitate. After full hydrogenation, all of the BCC and BCT structures of Ti0.20Zr0.20Hf0.20Nb0.40 HEA hydrides had transformed into a single FCC structure, having a cell volume of 99.21 A3.

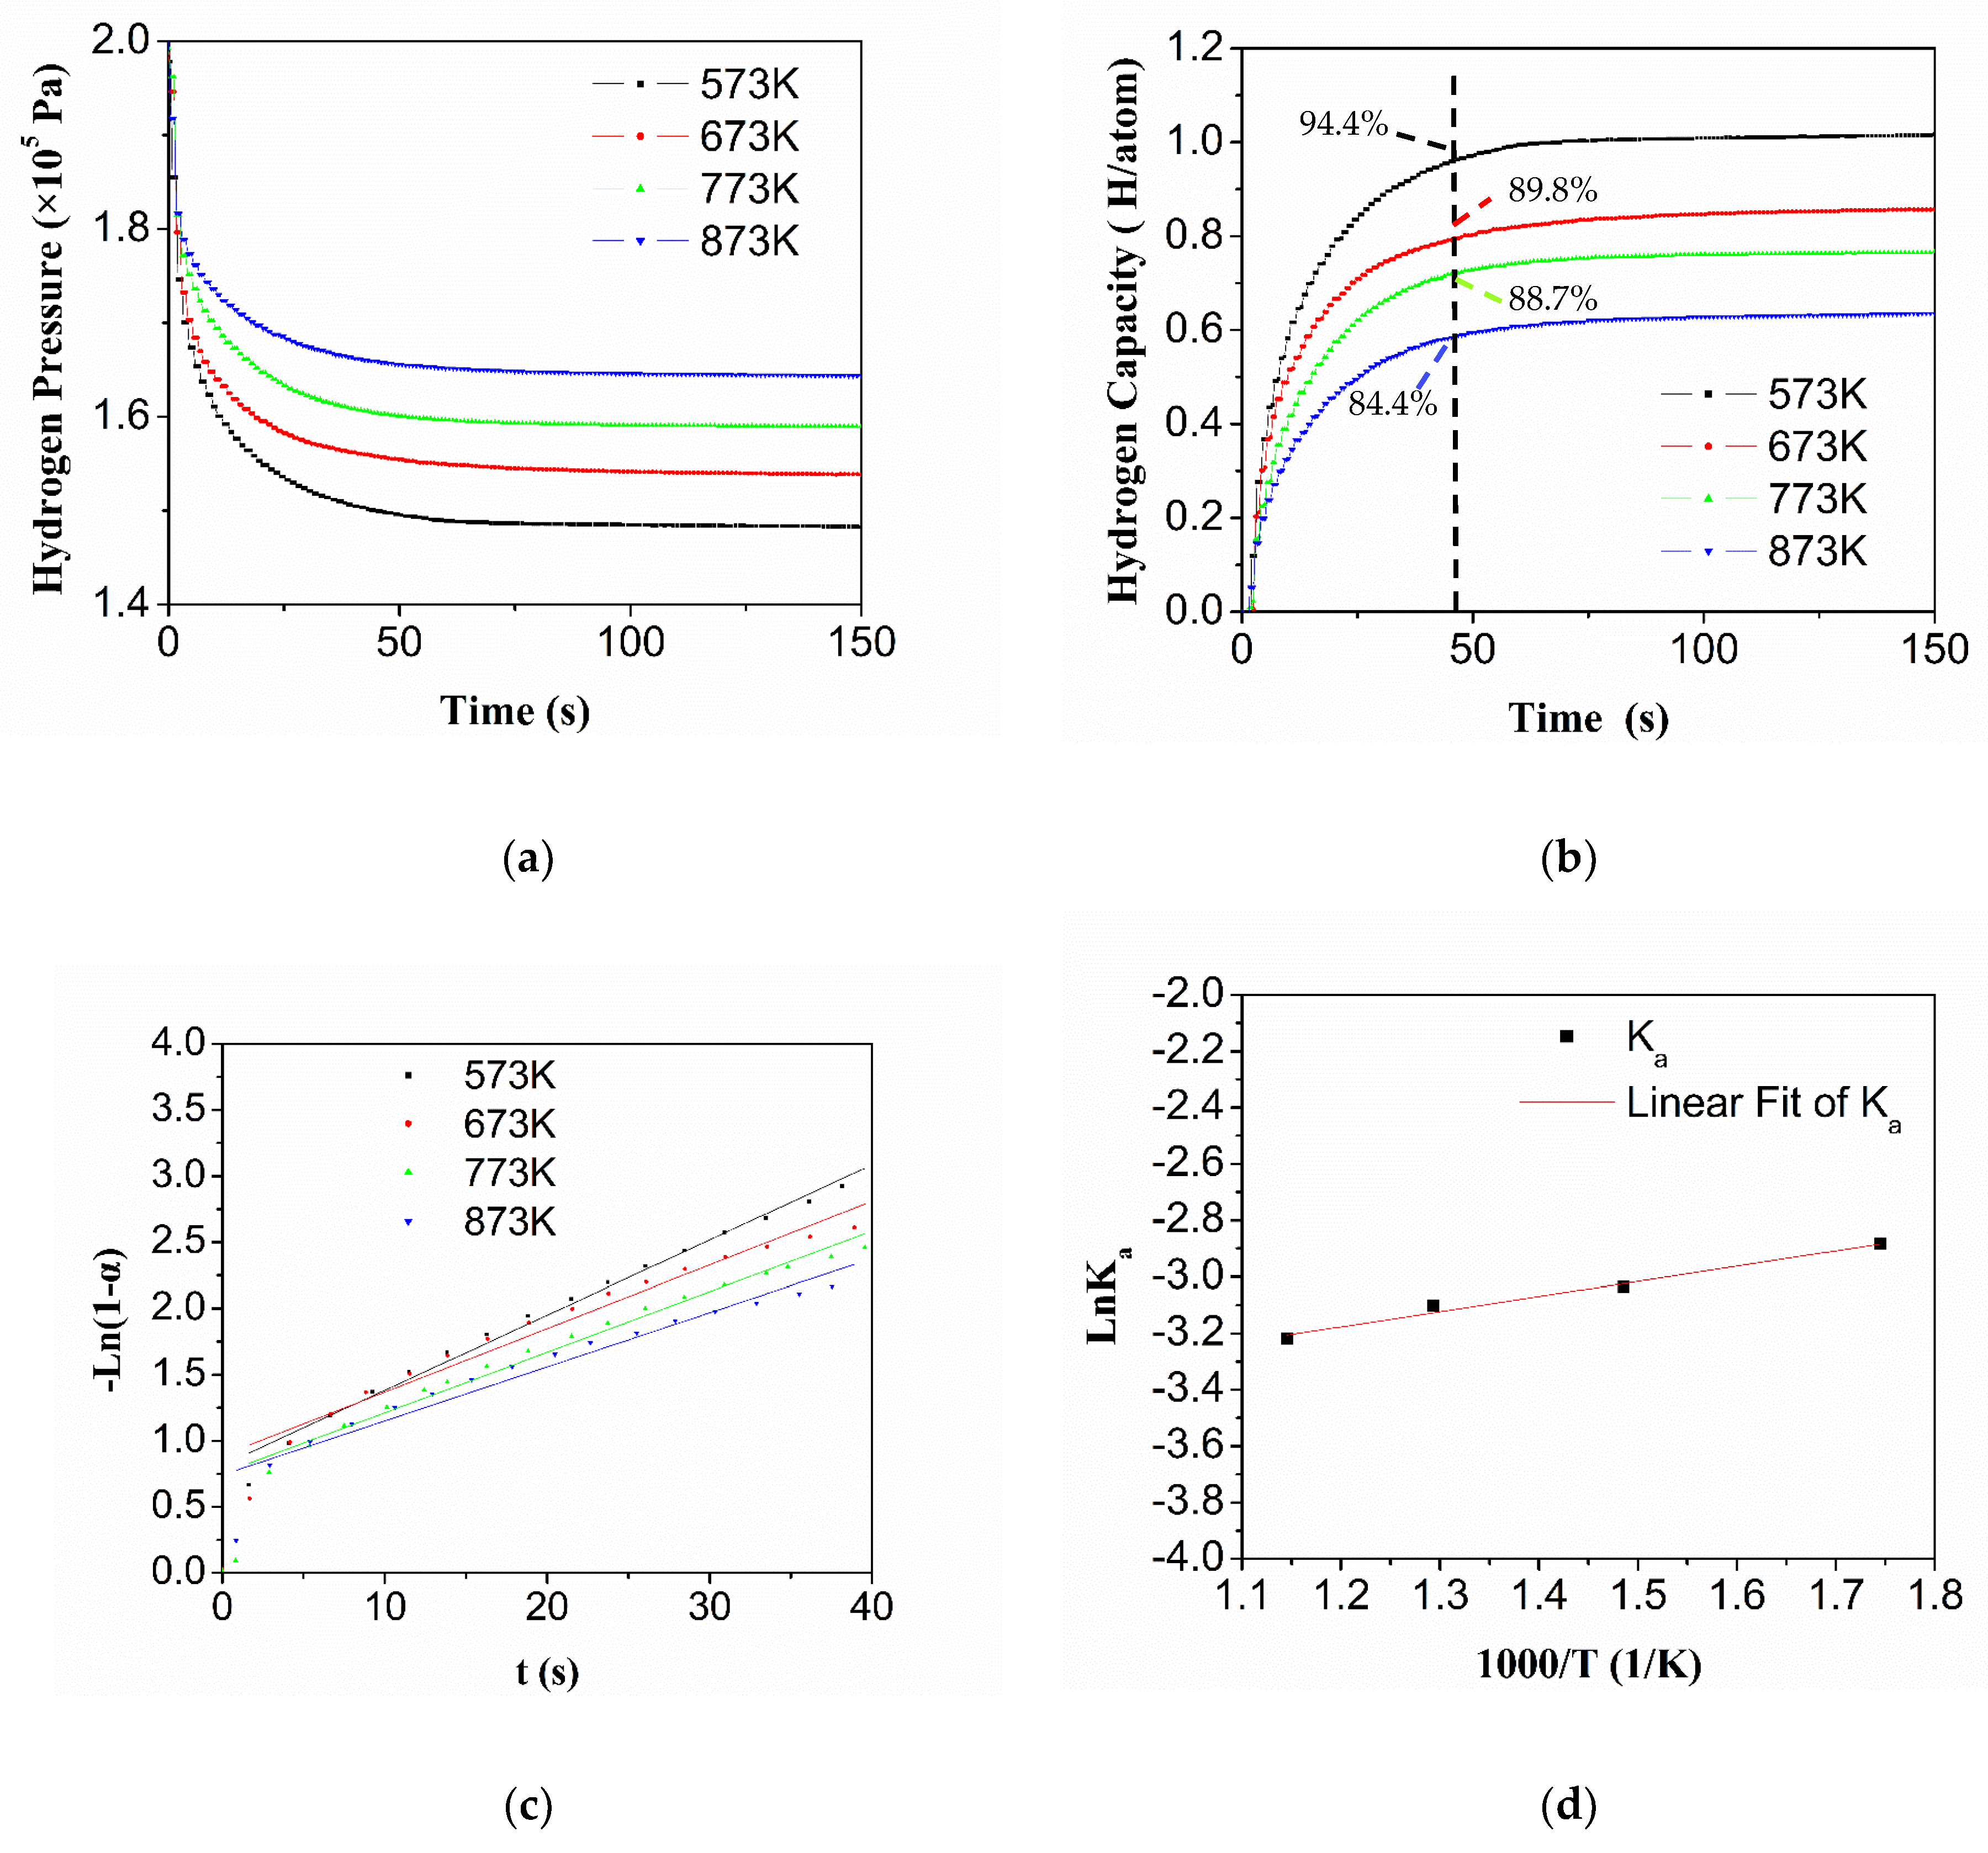
3.4. Hydrogen Sorption Kinetics of HEA Alloy

Figure 5 shows the hydrogen absorption kinetic curves of Ti0.20Zr0.20Hf0.20Nb0.40 HEA at different temperatures. The curves of hydrogen pressure and hydrogen capacity changing with time are presented in Figure 5a,b, respectively. The hydrogen absorption kinetics of the Ti0.20Zr0.20Hf0.20Nb0.40 HEA is rapid, and the hydrogen absorption pressure is close to equilibrium in about 50 s (Figure 5). The initial hydrogen pressure is 2 × 10⁵ Pa, and the equilibrium hydrogen pressure increases gradually with the increasing temperature, which conforms to the gas state equation. The equilibrium hydrogen storage capacity gradually decreases with the increase of temperature, implying the processing of hydrogen absorption. The hydrogen pressure and temperature are thought to be the driving forces of the hydrogenation process, as they benefit the hydrogen atoms’ diffusion into metal lattice. Moreover, the higher temperature is not only conducive to accelerating the hydrogen atom diffusion in the lattice, but also promotes the decomposition of metal hydride as a hindering force. The hydrogenation and decomposition processes are considered to have a competitive relationship during hydrogen sorption at high temperature. As for the Ti0.20Zr0.20Hf0.20Nb0.40 HEA, it seems that the decomposition plays a major role in the hydrogen sorption process. The specific values for hydrogen absorption equilibrium pressure and equilibrium hydrogen storage capacity are shown in Table 3.
With reference to metals and alloys, the hydrogen storage process steps include physisorption, chemisorption, surface penetration, diffusion and hydride formation [49]. Apart from the first step (i.e., physisorption), other steps can be rate-limiting and influence the kinetics of hydrogen sorption [50]. Each hydrogen absorption kinetic step has its corresponding kinetic model [51,52]. The hydrogen absorption kinetic process of Ti0.20Zr0.20Hf0.20Nb0.40 was carefully analyzed and compared to the most consistent first-order chemical reaction model. The corresponding rate-limiting factor K a of this kinetic model for this HEA was calculated using the following formula:
ln ( 1 α ) = K a t
In Formula (2) [52], α is the conversion fraction, α = ( P 0 P ) / ( P 0 P t ) , t is the reaction time, P is the hydrogen pressure, P 0 is the initial hydrogen pressure, P t is the reaction equilibrium pressure and K a is the reaction rate constant. According to Formula (2), the hydrogen absorption pressure of the ln ( 1 α ) changing with time at different temperatures was linearly fitted and is shown in Figure 5c. It was demonstrated that the reaction rate of this HEA during the hydrogen absorption can be regarded as constant at the same temperature. As shown in Figure 5c, the slope of each fitting line is the hydrogen absorption reaction rate constant K a at the test temperature, of which the specific value is listed in the third row of Table 3.
As shown in Figure 5d, the data points of Ln K a changing with the 1000/T at four temperatures was linearly fitted to yield the activation energy based on the Arrhenius formula:
Ln K a = LnA E a / R T
In Formula (3) [49,50], A is the factor and E a is the performance activation energy (kJ/mol) of the hydrogen absorption reaction. The slope of the fitting line of these four points is calculated to show the activation energy of hydrogen absorption reaction ( E a ) of hydrogenated Ti0.20Zr0.20Hf0.20Nb0.40 is −4.37 kJ/mol.

3.5. Hydrogen Desorption Kinetics of HEA Alloy

Figure 6 shows the kinetic hydrogen desorption curves of Ti0.20Zr0.20Hf0.20Nb0.40 HEA. The curves of hydrogen pressure and hydrogen capacity changing with time are plotted in Figure 6a,b, respectively. The hydrogen equilibrium pressure increased with increasing temperature since more hydrogen is released at higher temperatures. The analysis method of the desorption activation energy is the same as that of the hydrogen absorption kinetics. The most suitable kinetic model is also the first-order chemical reaction model. For the kinetic process of hydrogen desorption, it is known from previous analysis that the increase in temperature is beneficial to the weakening of the rate-limiting step (hydride decomposition). Therefore, the calculated hydrogen desorption reaction rate constant K d increases with increasing temperature (Table 4, Figure 6c), indicating that the higher the temperature is, the faster the hydrogen reaction rate is. It is easier to desorb hydrogen at high temperature. When the temperature is higher than 673 K, the Ti0.20Zr0.20Hf0.20Nb0.40 HEA desorbed almost 0.85 H/atom in 150 s, implying excellent hydrogen desorption kinetics. Ln K d is linearly related to 1000/T, and the hydrogen desorption performance activation energy E d of the Ti0.20Zr0.20Hf0.20Nb0.40 HEA is expressed as the slope of the fitted line in Figure 6d and was calculated to be 6.74 kJ/mol.

4. Discussion

4.1. Controllability of Thermodynamic Stability

Based on thermodynamics theory, Δ H 0 can be used as an index to evaluate the stability of alloy hydrides. The smaller Δ H 0 is, the more stable the metal hydride is [53]. As shown in Table 5, the standard entropy of pure titanium (Ti) hydride ( Δ H 0 = 142   kJ · mol 1 ) is smaller than that of Ti0.20Zr0.20Hf0.20Nb0.40 HEA hydride, implying that the Ti hydride is more stable at room temperature (RT). However, the subtle difference may help to improve the hydrogenation performance of Ti0.20Zr0.20Hf0.20Nb0.40 HEA hydride during hydrogen desorption. Note that compared with the Ti0.25Zr0.25Nb0.25Ta0.25 HEA, the substitution of the element Ta for Hf, a tiny composition change, cases a remarkable decrease in the standard, to Δ H 0 = 6.4   kJ · mol 1 . This could be interpreted based on the following two major factors. Firstly, the atomic size difference δ of Ti0.25Zr0.25Nb0.25Ta0.25 HEA is 3.75% [46] smaller than that of Ti0.20Zr0.20Hf0.20Nb0.40 HEA, which indicates that the Ti0.25Zr0.25Nb0.25Ta0.25 HEA has fewer gaps for the migration of hydrogen atoms. Secondly, Nb and Ta precipitate to form (Nb,Ta)H complexes during the hydrogenation of Ti0.25Zr0.25Nb0.25Ta0.25 HEA. The hydrogen atoms have a preferred orientation when they enter their interstitial deposits, so Ti0.20Zr0.20Hf0.20Nb0.40 HEA is more likely to form hydrides than Ti0.25Zr0.25Nb0.25Ta0.25 HEA. The above results suggest that Ti0.20Zr0.20Hf0.20Nb0.40 HEA can be considered as a whole and further analyzed thermodynamically by means of the analysis of elemental hydrides. The above results suggest that the thermodynamic analysis of Ti0.20Zr0.20Hf0.20Nb0.40 HEA is similar to that of other metal and alloy hydrides. The calculation and comparison of the value of Δ H 0 of the HEA alloy system can provide a reference for judging the stability of its corresponding hydride. Meanwhile, the thermal stability of HEA’s hydrides can be affected by change the elements of the HEA. This is because the change in elements could result in different formation enthalpies of its hydrides, and the possibility of phase separation of hydrogen elements in HEA due to the presence of multiple elements. We believe that the standard enthalpy of Ti0.25Zr0.25Nb0.25Ta0.25 hydride is much higher than that of Ti0.20Zr0.20Hf0.20Nb0.40 in this paper, because there is a phase separation of hydrogen elements in Ti0.25Zr0.25Nb0.25Ta0.25 hydride, forming (Nb,Ta)H.

4.2. Unique Feature of PCI Curve of HEA Alloy

It has been demonstrated that HEAs might have better hydrogen storage characteristics than traditional pure metals and binary alloys. In the PCI curves of HEA alloys, the plateau presents unique feature in comparison to the traditional hydrogen storage materials. The plateau pressure of HEA gradually increases with the increase in hydrogen content (Figure 2) before the full hydrogenation of HEA. The main reason for the sloping plateau is that this BCC is a solid solution and there are different environments for the interstitial sites. Thus, the energy is different from one site to another. The plateau width of the Ti0.20Zr0.20Hf0.20Nb0.40 HEA becomes shorter with the increase in temperature. The maximum equilibrium hydrogen storage of the Ti0.20Zr0.20Hf0.20Nb0.40 HEA decreases with increasing temperature. The hydrogen atoms occupy the interstitial sites of the HEA hydride lattice, and an energy barrier is required for hydrogen diffusion and hydride decomposition. The higher the temperature is, the easier the barrier is to be broken through. Therefore, the structure of this HEA hydride is likely to decompose at higher temperature. The results from the PCI curves (Figure 2) and XRD patterns (Figure 4) show that the plateau starts to appear with the formation of BCT intermediate hydride at 0.2 at% H. At 573 K, the continuous inclined plateau area remains until the hydrogen absorption capacity is up to 1.1 at%. The unique feature of the inclined plateau in the PCI curve has also been observed in some other high entropy alloys (HfNbTiVZr [32], TiZrNbHfTa [35], CoFeMnTixVyZrz [27]). In situ XRD studies on the hydrogen absorption of HfNbTiVZr [32] indicate that the peak position shifts continuously towards a lower angle during the phase transformation from BCC to FCC. In this study, continuous intermediate BCT hydrides with increasing cell volume were observed during the hydrogen absorption, which is in good agreement with the in-situ XRD results [32]. It can be assumed that the formation of BCT hydrides induces the gradual increase in plateau pressure during the hydrogen absorption process of the HEA.

4.3. Fast Hydrogen Sorption Kinetic Performance

According to the hydrogen absorption kinetics curve of this HEA (Figure 5a), the higher the temperature, the slower the hydrogen absorption velocity of this HEA, which is consistent with K a , since K a also decreases with increasing temperature. This result indicates that the increase in temperature hindered the rate of hydrogen absorption. This might be because the higher the temperature is, the more easily and rapidly the hydride of Ti0.20Zr0.20Hf0.20Nb0.40 HEA decomposes.
The comparison of the kinetics performance (absorption time, E a ) of Ti0.20Zr0.20Hf0.20Nb0.40 HEA with that of other pure metals and alloys is shown in Table 6. The results indicate that Ti0.20Zr0.20Hf0.20Nb0.40 HEA absorbs hydrogen much faster than conventional metals such as Ti and some typical traditional hydrogen storage alloys. The previous analysis has shown that the lower the temperature, the faster the hydrogen absorption speed of this HEA. At 573 K, the hydrogen absorption time was 50 s, and when temperature changes to room temperature, this HEA had a faster hydrogen absorption speed, which indicates that it has more rapid hydrogen absorption advantages than CoFeMnTixVyZrz and Ti0.25Zr0.25Nb0.25Ta0.25. This activated HEA mainly undergoes elementary reactions, as shown in Formulas (3) and (4). Reaction (3) corresponds to the formation of the transition phase hydride of the BCT phase, whereas reaction (4) corresponds to the formation of final hydrides in the FCC phase. In the process of hydrogen absorption, the two-phase region has a large span (according to Figure 2b and Figure 4), and the activation energy required for the phase-to-phase transition is small. Moreover, lattice distortion leads to more gaps opening, and the hydrogen atom migration energy barrier between gap openings is low. These two reasons are conducive to the weakening of the rate-limiting step in hydride formation; thus, it has a good kinetic hydrogen absorption performance.
M + H 2 M H x
M H x + H 2 M H 1.6

5. Conclusions

According to the above results and discussion, the following conclusions can be obtained:
  • The hydrogenation performance of Ti0.20Zr0.20Hf0.20Nb0.40 HEA was systematically evaluated. The maximum equilibrium hydrogen storage capacity of the Ti0.20Zr0.20Hf0.20Nb0.40 HEA is 1.5 H/atom at 573 K. The thermal stability of HEA hydrides can be changed by the adjustment of their elements, and some HEA hydrides may exhibit a phase separation phenomenon of hydrogen elements, and this phenomenon may be beneficial in reducing its hydrides’ thermal stability.
  • Ti0.20Zr0.20Hf0.20Nb0.40 HEA has a unique feature in its PCI curve. Before the full hydrogenation of the HEA, the increase in hydrogen content leads to a gradual increase in its plateau pressure. Furthermore, with the increase in temperature, the plateau width of the HEA becomes shorter. During the hydrogen absorption process, the structure of Ti0.20Zr0.20Hf0.20Nb0.40 HEA hydride undergoes a transition from BCC to FCC with a BCT intermediate state with the increasing hydrogen content. A series of BCT hydrides with different cell volumes precipitate consecutively with the increasing hydrogen content, which causes the increased plateau pressure during hydrogen absorption.
  • Ti0.20Zr0.20Hf0.20Nb0.40 HEA exhibits outstanding hydrogenation kinetics properties. Almost full hydrogen absorption (94.4%, 573 K) is completed in 50 s, which is less than that of other synthesized hydrogen storage materials in the literature. Moreover, in contrast with the hydrogenation reaction, the decomposition process is more significant when the temperature is higher than 573 K. The hydrogen absorption reaction rate constant of the HEA gradually decreases with increasing temperature.
  • According to the fitting calculation of the average plateau pressure at different temperatures, the platform pressure of Ti0.20Zr0.20Hf0.20Nb0.40 HEA at room temperature is extrapolated to be 1.6 × 10⁻⁸ Pa. The activation energy E a of the reaction between the alloy and hydride is negative (−4.37 kJ/mol), indicating that the hydrogenation of Ti0.20Zr0.20Hf0.20Nb0.40 HEA is spontaneous after primary activation.
The above results prove the outstanding properties of the Ti0.20Zr0.20Hf0.20Nb0.40 HEA during the hydrogenation cycle, which might be due to the HEA alloy composition and the distortion features of the HEA. Ti0.20Zr0.20Hf0.20Nb0.40 HEA has certain application value as a hydrogen storage material, a fast energy storage material, as well as a low-plateau-pressure functional component. Further study on the fast hydrogen storage mechanism of this HEA can provide references for improving the kinetic properties of hydrogen storage materials. Radiation resistance [60] material might be another field of HEA.

Author Contributions

Drafting the manuscript, analysis and interpretation of data, conception and design of study, J.Z. (Jianwei Zhang); sample preparation, hydrogenation performance test, P.L.; hydrogenation experiment, G.H. and W.Z.; theory of assistance, J.H. and H.X.; SEM and EDS analysis, J.Z. (Jian Zheng); thermodynamic property analysis, X.Z. (Xiaosong Zhou); kinetics analysis, X.X. and J.Y.; drafting the manuscript, conception and design of study and data curation, H.S.; revision of the manuscript, S.L. and X.Z. (Xiaotao Zu). All authors have read and agreed to the published version of the manuscript.

Funding

H.H. Shen is grateful for support from the President’s Foundation of the China Academy of Engineering Physics (Grant No. YZJJLX2018003); H.Y. Xiao was supported by the Joint Funds of the National Natural Science Foundation of China (Grant No. U1930120); J. Zheng is grateful for support from the National Natural Science Foundation of China (Grant No. 11805171).

Institutional Review Board Statement

Not applicable.

Informed Consent Statement

Not applicable.

Data Availability Statement

The raw/processed data required to reproduce these findings cannot be shared at this time as the data also form part of an ongoing study.

Acknowledgments

Authors would like to acknowledge alloy smelting support from L.Y. Xiong in Institute of Metal Research, Chinese Academy of Sciences.

Conflicts of Interest

The authors declare no conflict of interest.

References

  1. Eberle, U.; Felderhoff, M.; Schüth, F. Chemical and Physical Solutions for Hydrogen Storage. Angew. Chem. Int. Ed. 2009, 48, 6608–6630. [Google Scholar] [CrossRef] [PubMed]
  2. Liu, C.; Li, F.; Ma, L.P.; Cheng, H.M. Advanced Materials for Energy Storage. Adv. Mater. 2010, 22, E28–E62. [Google Scholar] [CrossRef]
  3. Zhang, F.; Zhao, P.C.; Niu, M.; Maddy, J. The Survey of Key Technologies in Hydrogen Energy Storage. Int. J. Hydrogen Energy 2016, 41, 14535–14552. [Google Scholar] [CrossRef]
  4. Colbe, J.B.V.; Ares, J.R.; Barale, J.; Baricco, M.; Buckley, C.; Capurso, G.; Gallandat, N.; Grant, D.M.; Guzik, M.N.; Jacob, I.; et al. Application of Hydrides in Hydrogen Storage and Compression: Achievements, Outlook and Perspectives. Int. J. Hydrogen Energy 2019, 44, 7780–7808. [Google Scholar] [CrossRef]
  5. Yang, Z.; Zhao, M.; Ding, X.; Liu, Z.R.; Tian, H.; Shen, H.H.; Zu, X.T.; Li, S.; Qiao, L. One-Step Colloid Fabrication of Nickel Phosphides Nanoplate/Nickel Foam Hybrid Electrode for High-Performance Asymmetric Supercapacitors. Chem. Eng. J. 2019, 373, 1132–1143. [Google Scholar]
  6. Principi, G.; Agresti, F.; Maddalena, A.; Russo, S.L. The Problem of Solid State Hydrogen Storage. Energy 2009, 34, 2087–2091. [Google Scholar] [CrossRef]
  7. Jena, P. Materials for Hydrogen Storage: Past, Present, and Future. J. Phys. Chem. Lett. 2011, 2, 206–211. [Google Scholar] [CrossRef]
  8. Rusman, N.A.A.; Dahari, M. A Review on the Current Progress of Metal Hydrides Material for Solid-State Hydrogen Storage Applications. Int. J. Hydrogen Energy 2016, 41, 12108–12126. [Google Scholar] [CrossRef]
  9. Yu, X.B.; Tang, Z.W.; Sun, D.L.; Ouyang, L.Z.; Zhu, M. Recent Advances and Remaining Challenges of Nanostructured Materials for Hydrogen Storage Applications. Prog. Mater. Sci. 2017, 88, 1–48. [Google Scholar] [CrossRef]
  10. Billur, S.; Farida, L.D.; Michael, H. Metal Hydride Materials for Solid Hydrogen Storage:A Review. Int. J. Hydrogen Energy 2007, 32, 1121–1140. [Google Scholar]
  11. Abdalla, A.M.; Hossain, S.; Nisfindy, O.B.; Azad, A.T.; Dawood, M.; Azad, A.K. Hydrogen Production, Storage, Transportation and Key Challenges with Applications: A Review. Energy Convers. Manag. 2018, 165, 602–627. [Google Scholar] [CrossRef]
  12. Schlapbach, L.; Züttel, A. Hydrogen-Storage Materials for Mobile Applications. Nature 2001, 414, 353–358. [Google Scholar] [CrossRef] [PubMed]
  13. Niaz, S.; Manzoor, T.; Pandith, A.H. Hydrogen Storage: Materials, Methods and Perspectives. Renew. Sustain. Energy Rev. 2015, 50, 457–469. [Google Scholar] [CrossRef]
  14. Nassar, A.E.; Nassar, E.E.; Younis, M.A. Hydrogen Storage Alloys: Types and Characteristics. In Handbook of Ecomaterials; Springer International Publishing AG: Cham, Switzerland, 2018; pp. 1–19. [Google Scholar]
  15. Yeh, J.W.; Chen, S.K.; Lin, S.J.; Gan, J.Y.; Chin, T.S.; Shun, T.T.; Tsau, C.H.; Chang, S.Y. Nanostructured High-Entropy Alloys with Multiple Principal Elements_ Novel Alloy Design Concepts and Outcomes. Adv. Eng. Mater. 2004, 6, 299–303. [Google Scholar] [CrossRef]
  16. Yeh, J.W. Recent Progress in High-Entropy Alloys. Eur. J. Control 2016, 31, 633–648. [Google Scholar] [CrossRef]
  17. Miracle, D.B.; Senkov, O.N. A Critical Review of High Entropy Alloys and Related Concepts. Acta Mater. 2017, 122, 448–511. [Google Scholar] [CrossRef] [Green Version]
  18. Zhang, Y.; Zuo, T.T.; Tang, Z.; Gao, M.C.; Dahmen, K.A.; Liaw, P.K.; Lu, Z.P. Microstructures and Properties of High-Entropy Alloys. Prog. Mater. Sci. 2014, 61, 1–93. [Google Scholar] [CrossRef]
  19. Tsai, M.H.; Yeh, J.W. High-Entropy Alloys: A Critical Review. Mater. Res. Lett. 2014, 2, 107–123. [Google Scholar] [CrossRef]
  20. Miracle, D.B. Critical Assessment 14: High Entropy Alloys and Their Development as Structural Materials. Mater. Sci. Technol. 2015, 31, 1142–1147. [Google Scholar] [CrossRef] [Green Version]
  21. Ye, Y.F.; Wang, Q.; Lu, J.; Liu, C.T.; Yang, Y. High-Entropy Alloy Challenges and Prospects. Mater. Today 2016, 19, 349–362. [Google Scholar] [CrossRef]
  22. Zhang, W.R.; Liaw, P.K.; Zhang, Y. Science and Technology in High-Entropy Alloys. Sci. China Mater. 2018, 61, 2–22. [Google Scholar] [CrossRef] [Green Version]
  23. Diao, H.Y.; Feng, R.; Dahmen, K.A.; Liaw, P.K. Fundamental Deformation Behavior in High-Entropy Alloys: An Overview. Curr. Opin. Solid State Mater. Sci. 2017, 21, 252–266. [Google Scholar] [CrossRef]
  24. Harrington, T.J.; Gild, J.; Sarker, P.; Toher, C.; Rost, C.M.; Dippo, O.F.; McElfresh, C.; Kaufmann, K.; Marin, E.; Borowski, L.; et al. Phase Stability and Mechanical Properties of Novel High Entropy Transition Metal Carbides. Acta Mater. 2019, 166, 271–280. [Google Scholar] [CrossRef] [Green Version]
  25. Zou, Y.; Wheeler, J.M.; Ma, H.; Okle, P.; Spolenak, R. Nanocrystalline High-Entropy Alloys: A New Paradigm in High-Temperature Strength and Stability. Nano Lett. 2017, 17, 1569–1574. [Google Scholar] [CrossRef] [PubMed]
  26. Shi, Y.Z.; Yang, B.; Liaw, P. Corrosion-Resistant High-Entropy Alloys: A Review. Metals 2017, 7, 43. [Google Scholar] [CrossRef] [Green Version]
  27. Kao, Y.F.; Chen, S.K.; Sheu, J.H.; Lin, J.T.; Lin, W.E.; Yeh, J.W.; Lin, S.J.; Liou, Z.H.T.; Wang, C.W. Hydrogen Storage Properties of Multi-Principal-Component Cofemntixvyzrz Alloys. Int. J. Hydrogen Energy 2010, 35, 9046–9059. [Google Scholar] [CrossRef]
  28. Kim, J.H.; Han, K.S.; Hwang, K.T.; Kim, B.G.; Kang, Y.M. Effect of Heat Treatment on Microstructure and Hydrogen Storage Properties of Mass-Produced Ti0.85zr0.13(Fex–V)0.56mn1.47ni0.05. Alloy. Int. J. Hydrogen Energy 2013, 38, 6215–6220. [Google Scholar] [CrossRef] [Green Version]
  29. Kunce, I.; Polanski, M.; Bystrzycki, J. Microstructure and Hydrogen Storage Properties of a Tizrnbmov High Entropy Alloy Synthesized Using Laser Engineered Net Shaping (Lens). Int. J. Hydrogen Energy 2014, 39, 9904–9910. [Google Scholar] [CrossRef]
  30. Sahlberg, M.; Karlsson, D.; Zlotea, C.; Jansson, U. Superior Hydrogen Storage in High Entropy Alloys. Scientificreports 2016, 6, 1–6. [Google Scholar] [CrossRef] [PubMed] [Green Version]
  31. Wang, N.J.; Liu, Y. Microstructure of Nb-Ta-V Based Hydrogen Permeation High Entropy Alloys. Mater. Sci. Forum 2016, 849, 3–7. [Google Scholar] [CrossRef]
  32. Karlsson, D.; Ek, G.; Cedervall, J.; Zlotea, C.; Møller, K.T.; Hansen, T.C.; Bednarčík, J.; Paskevicius, M.; Sørby, M.H.; Jensen, T.R.; et al. Structure and Hydrogenation Properties of a Hfnbtivzr High-Entropy Alloy. Inorg. Chem. 2017, 57, 2103–2110. [Google Scholar] [CrossRef]
  33. Kunce, I.; Polański, M.; Czujko, T. Microstructures and Hydrogen Storage Properties Of la Ni Fe V Mn Alloys. Int. J. Hydrogen Energy 2017, 42, 27154–27164. [Google Scholar] [CrossRef]
  34. Zepon, G.; Leiva, D.R.; Strozi, R.B.; Bedoch, A.; Figueroa, S.J.A.; Ishikawa, T.T.; Botta, W.J. Hydrogen-Induced Phase Transition of Mgzrtife0.5co0.5ni0.5 High Entropy Alloy. Int. J. Hydrogen Energy 2018, 43, 1702–1708. [Google Scholar] [CrossRef]
  35. Zlotea, C.; Sow, M.A.; Ek, G.; Couzinié, J.P.; Perrière, L.; Guillot, I.; Bourgon, J.; Møller, K.T.; Jensen, T.R.; Akiba, E.; et al. Hydrogen Sorption in Tizrnbhfta High Entropy Alloy. J. Alloys Compd. 2019, 775, 667–674. [Google Scholar] [CrossRef]
  36. Hu, J.T.; Shen, H.H.; Jiang, M.; Gong, H.F.; Xiao, H.Y.; Liu, Z.J.; Sun, G.A.; Zu, X.T. A Dft Study of Hydrogen Storage in High-Entropy Alloy Tizrhfscmo. Nanomaterials 2019, 9, 461. [Google Scholar] [CrossRef] [Green Version]
  37. Shen, H.H.; Zhang, J.W.; Hu, J.T.; Zhang, J.C.; Mao, Y.W.; Xiao, H.Y.; Zhou, X.S.; Zu, X.T. A Novel Tizrhfmonb High-Entropy Alloy for Solar Thermal Energy Storage. Nanomaterials 2019, 9, 248. [Google Scholar] [CrossRef]
  38. Shen, H.H.; Hu, J.T.; Li, P.C.; Huang, G.; Zhang, J.W.; Zhang, J.C.; Mao, Y.W.; Xiao, H.Y.; Zhou, X.S.; Zu, X.T.; et al. Compositional Dependence of Hydrogenation Performance of Ti-Zr-Hf-Mo-Nb High-Entropy Alloys for Hydrogen/Tritium Storage. J. Mater. Sci. Technol. 2020, 55, 116–125. [Google Scholar] [CrossRef]
  39. Dewangan, S.K.; Sharma, V.K.; Sahu, P.; Kumar, V. Synthesis and Characterization of Hydrogenated Novel Alcrfemnniw High Entropy Alloy. Int. J. Hydrogen Energy 2020, 45, 16984–16991. [Google Scholar] [CrossRef]
  40. Ek, G.; Nygard, M.M.; Pavan, A.F.; Montero, J.; Henry, P.F.; Sorby, M.H.; Witman, M.; Stavila, V.; Zlotea, C.; Hauback, B.C.; et al. Elucidating the Effects of the Composition on Hydrogen Sorption in Tivzrnbhf-Based High-Entropy Alloys. Inorg. Chem. 2021, 60, 1124–1132. [Google Scholar] [CrossRef]
  41. Strozi, R.B.; Leiva, D.R.; Huot, J.; Botta, W.J.; Zepon, G. Synthesis and Hydrogen Storage Behavior of Mg–V–Al–Cr–Ni High Entropy Alloys. Int. J. Hydrogen Energy 2021, 46, 2351–2361. [Google Scholar] [CrossRef]
  42. Wang, C.Z.; Wang, H.X.; Shankar, K.; Morozov, E.V.; Hazell, P.J. On the Mechanical Behaviour of Steel Wire Mesh Subjected to Low-Velocity Impact. Thin-Walled Struct. 2021, 159, 107281. [Google Scholar] [CrossRef]
  43. Cai, C.; Wang, M.Y.; Han, S.B.; Wang, Q.; Zhang, Q.; Zhu, Y.M.; Yang, X.M.; Wu, D.J.; Zu, X.T.; Sterbinsky, G.E.; et al. Ultrahigh Oxygen Evolution Reaction Activity Achieved Using Ir Single Atoms on Amorphous Coox Nanosheets. ACS Catal. 2020, 11, 123–130. [Google Scholar] [CrossRef]
  44. Zhang, Y.; Zhou, Y.; Lin, J.; Chen, G.; Liaw, P. Solid-Solution Phase Formation Rules for Multi-Component Alloys. Adv. Eng. Mater. 2008, 10, 534–538. [Google Scholar] [CrossRef]
  45. Bing, W.Z.; Long, X.G.; Zhu, Z.L.; Hao, W.L.; Luo, S.Z.; Peng, S.M. Structure and Thermodynamic Aspect of Ti-Hf Alloys and Their Deuterides. Chin. J. Inorganal Chem. 2010, 26, 1008–1012. [Google Scholar]
  46. Zhang, C.; Song, A.; Yuan, Y.; Wu, Y.; Zhang, P.L.; Lu, Z.P.; Song, X.P. Study on the Hydrogen Storage Properties of a TiZrNbTa High Entropy Alloy. Int. J. Hydrogen Energy 2020, 45, 5367–5374. [Google Scholar] [CrossRef]
  47. Xiong, W.; Li, B.Q.; Wang, L.; Li, J.; Kong, F.Q.; Yan, H.Z. Investigation of the Thermodynamic and Kinetic Properties of La–Fe–B System Hydrogen-Storage Alloys. Int. J. Hydrogen Energy 2014, 39, 3805–3809. [Google Scholar] [CrossRef]
  48. Ruz, P.; Banerjee, S.; Halder, R.; Kumar, A.; Sudarsan, V. Thermodynamics, Kinetics and Microstructural Evolution of Ti0.43zr0.07cr0.25v0.25 Alloy Upon Hydrogenation. Int. J. Hydrogen Energy 2017, 42, 11482–11492. [Google Scholar] [CrossRef]
  49. Martin, M.; Gommel, C.; Borkhart, C.; Fromm, E. Absorption and Desorption Kinetics of Hydrogen Storage Alloys. J. Alloys Compd. 1996, 238, 193–201. [Google Scholar] [CrossRef]
  50. Jain, A.; Agarwal, S.; Ichikawa, T. Catalytic Tuning of Sorption Kinetics of Lightweight Hydrides: A Review of the Materials and Mechanism. Catalysts 2018, 8, 651. [Google Scholar] [CrossRef] [Green Version]
  51. Pang, Y.P.; Li, Q. A Review on Kinetic Models and Corresponding Analysis Methods for Hydrogen Storage Materials. Int. J. Hydrogen Energy 2016, 41, 18072–18087. [Google Scholar] [CrossRef]
  52. Khawam, A.; Flanagan, D.R. Solid-State Kinetic Models: Basics and Mathematical Fundamentals. Phys. Chem. B 2006, 110, 17315–17328. [Google Scholar] [CrossRef]
  53. Gao, M.C.; Gao, P.; Hawk, J.A.; Ouyang, L.Z.; Alman, D.E.; Widom, M. Computational Modeling of High-Entropy Alloys: Structures, Thermodynamics and Elasticity. J. Mater. Res. 2017, 32, 3627–3641. [Google Scholar] [CrossRef]
  54. Zhao, J.W.; Ding, H.; Tiana, X.F.; Zhao, W.J.; Hou, H.L. Thermodynamic Calculation on the Formation of Titanium Hydride. Chin. J. Chem. Phys. 2008, 21, 569. [Google Scholar] [CrossRef]
  55. Huang, G.; Cao, X.H.; Long, X.G.; Yang, B.F.; Liu, W.K. Research on the Kinetics Isotope Effects of Tritium Absorbing Hydrogen, Deuterium and Titanium. J. Mater. Sci. Eng. 2005, 23, 850–853. [Google Scholar]
  56. Park, C.N.; Lee, J.Y. Kinetic Properties of the Hydrogenation of the Feti Intermetallic Compound. J. Less-Common Met. 1983, 91, 189–201. [Google Scholar]
  57. Israel, A.; Jacob, I. Kinetics and Thermodynamics of Hydrogen Absorption in the Zr(Al0.1fe0.9)2 Intermetallic Compound. J. Alloys Compd. 1997, 260, 131–134. [Google Scholar] [CrossRef]
  58. Kitada, M. Absorption-Desorption Characteristics of Hydrogen for Lani5, Ceco5, and Smco5. J. Jpn. Inst. Met. 1977, 41, 412–420. [Google Scholar] [CrossRef] [Green Version]
  59. Simičić, M.V.; Zdujić, M.; Dimitrijević, R.; Nikolić-Bujanović, L.; Popović, N.H. Hydrogen Absorption and Electrochemical Properties of Mg2ni-Type Alloys Synthesized by Mechanical Alloying. J. Power Sources 2006, 158, 730–734. [Google Scholar]
  60. He, J.X.; Shen, Y.; Li, B.; Xiang, X.; Li, S.; Fang, X.; Xiao, H.Y.; Zu, X.T.; Qiao, L. A Comparative Study of the Structural and Optical Properties of Si-Doped Gaas under Different Ion Irradiation. Opt. Mater. 2021, 111, 110611. [Google Scholar] [CrossRef]
Figure 1. (a) SEM image of Ti0.20Zr0.20Hf0.20Nb0.40 high entropy alloy (HEA). The energy dispersive spectroscopy (EDS) maps of (b) Ti, (c) Zr, (d) Hf and (e) Nb elements on the sample surface of (a) showed homogeneous distributions of all four metal elements.
Metals 11 00470 g001
Figure 2. (a) Hydrogen absorption Pressure–composition isotherm (PCI) curve of Ti0.20Zr0.20Hf0.20Nb0.40 HEA at different temperatures; (b) magnified image of the denoted area with dotted line in (a).
Metals 11 00470 g002
Figure 3. Van ’t Hoff curve illustrating the relationship between plateau pressure and temperature.
Metals 11 00470 g003
Figure 4. The XRD patterns of Ti0.20Zr0.20Hf0.20Nb0.40 alloy charged with differing hydrogen content: (1) Powder (P), (2) 0.05 H/atom (P), (3) 0.2 H/atom (P), (4) 0.4 H/atom (P), (5) 0.8 H/atom (P), (6) 1.1 H/atom (P), (7) 1.6 H/atom (fully hydride).
Metals 11 00470 g004
Figure 5. The hydrogen absorption kinetics curves of Ti0.20Zr0.20Hf0.20Nb0.40 HEA at 573 K, 673 K, 773 K, 873 K (initial hydrogen pressure: 2 × 10⁵ Pa): (a) hydrogen capacity; (b) hydrogen pressure; (c) the hydrogen absorption kinetic analysis curves of Ti0.20Zr0.20Hf0.20Nb0.40 HEA; (d) the relationship between the activation energy and temperature of the hydrogen absorption reaction.
Metals 11 00470 g005
Figure 6. The hydrogen desorption kinetics curves of Ti0.20Zr0.20Hf0.20Nb0.40 HEA at temperatures of 673 K, 773 K and 873 K: (a) hydrogen capacity; (b) hydrogen pressure; (c) the hydrogen desorption kinetic analysis curves of Ti0.20Zr0.20Hf0.20Nb0.40 HEA; (d) the relationship between activation energy and temperature of the hydrogen desorption reaction.
Metals 11 00470 g006
Table 1. The plateau pressures and hydrogen storage capacities of Ti0.20Zr0.20Hf0.20Nb0.40 HEA at different temperatures (573, 673, 773, and 873 K) during pressure-composition-isotherm (PCI) tests. The plateau pressure here is the average sloping plateau pressure when the hydrogen storage is less than 0.6 H/atom.
Temperature (K)Plateau Pressure (Pa)Hydrogen Storage Capacity (<5 × 10⁵ Pa, H/atom)
57371.50
673741.27
7735291.02
87315300.98
Table 2. The crystal structure, lattice constant and volume of the synthesized Ti0.20Zr0.20Hf0.20Nb0.40 HEA with differing hydrogen content. BCC, body-centered cubic (BCC); BCT body-centered tetragonal (BCT); FCC, face-centered cubic.
Sample Status (H/atom)Crystal StructureLattice Constant (nm)Cell Volume (A3)Pattern No. in Figure 4
Powder (P)BCCa = 0.3357 (1)37.841
0.05 (P)BCCa = 0.3412 (1)39.732
Hydride 0.2 (P)BCCa = 0.3445 (1)40.93
BCT1a = 0.3445 (1),
c = 0.3675 (4)
43.63
Hydride 0.4 (P)BCCa = 0.3493 (3)42.374
BCT2a = 0.3487(1),
c = 0.3666 (1)
44.44
Hydride 0.8 (P)FCCa = 0.4625 (1)98.925
BCT3a = 0.3378 (2),
c = 0.4189 (5)
47.81
Hydride 1.1 (P)FCCa = 0.4629 (2)99.186
BCT4a = 0.3379 (1),
c = 0.4204 (3)
48.01
Fully Hydride 1.6 (P)FCCa = 0.4629 (1)99.217
Table 3. The hydrogen absorption equilibrium pressure, equilibrium hydrogen storage capacity and hydrogen absorption reaction rate at different temperatures of Ti0.20Zr0.20Hf0.20Nb0.40 HEA during the hydrogen absorption kinetics test.
Temperature (K)Hydrogen Absorption Equilibrium Pressure (Pa)Equilibrium Hydrogen Storage Capacity (H/atom)Hydrogen Absorption Reaction Rate Ka (1/s)R2 (%)
5731478381.030.05699.0
6731528070.890.04894.5
7731572070.820.04595.8
8731621620.700.04095.3
Table 4. The hydrogen desorption equilibrium pressure, equilibrium hydrogen storage capacity and hydrogen desorption reaction rate at different temperatures in Ti0.20Zr0.20Hf0.20Nb0.40 HEA during the hydrogen desorption kinetics test.
Temperature (K)Hydrogen Desorption Equilibrium Pressure (Pa)Equilibrium Hydrogen Storage Capacity (H/atom)Hydrogen Desorption Reaction Rate Kd (1/s)R2 (%)
6732584−0.480.01297.47
7733655−0.670.01397.35
8734586−0.850.01697.53
Table 5. Standard enthalpies and entropies of Ti and HEA hydrides.
Metal/AlloysMetal
Hydrides
Atomic Size Difference δStandard Enthalpy
ΔH0 (kJ·mol−1)
Standard Entropy
ΔS0 (J·mol−1·K−1)
Reference
TiTiH2/−142.39−143.0[54]
Ti0.25Zr0.25Nb0.25Ta0.25(Nb,Ta)H3.75−6.4−4.3[46]
Ti0.20Zr0.20Hf0.20Nb0.40(HEA)H1.65.51−75.99−148.99This work
Table 6. Comparison of dynamic performance between traditional hydrogen storage alloys and some HEAs.
TypeExamplePressure/
Temperature
ta
(s)
Ea
(kJ/mol)
Ref
MetalTi4400 Pa/823 K40055.6[55]
Traditional Hydrogen Storage AlloysABFeTi2.5 × 106 Pa/294 K2707.53[56]
AB2Zr(Al0.1Fe0.9)25 × 106 Pa/265 K>72029[57]
AB5LaNi52 × 105 Pa/293 K12013.2[58]
A2BMg2Ni573 K600/[59]
Solid solution alloy (BCC)Ti0.43Zr0.07Cr0.25V0.252 × 106 Pa/293 K60020.9[48]
HEAsCoFeMnTixVyZrz298 K>100 s/[27]
Ti0.25Zr0.25Nb0.25Ta0.252 × 105 Pa/290 K606.14[46]
Ti0.20Zr0.20Hf0.20Nb0.402 × 105 Pa/573 K50−4.37This work
Publisher’s Note: MDPI stays neutral with regard to jurisdictional claims in published maps and institutional affiliations.

