Abstract
An innovative way to utilize deep-sea manganese nodules is described in this paper. The manganese nodules were reduced by aluminothermy and subsequently added into aluminum as a mixture of alloying elements in their natural ratio. The microstructure and properties of aluminum alloys containing 1.2, 7.7, and 9.7 wt % of reduced nodules were studied. The alloys were formed by Al matrix and minor amounts of Al6(Fe,Mn) and Al11Fe7 intermetallic phases. The alloys containing a higher amount of reduced nodules are characterized by very good thermal stability. The obtained alloys were studied by X-ray diffraction, their microstructure was observed by scanning electron microscopy, and their local chemical composition was analyzed by energy dispersive spectrometer. The hardness of the samples was measured on the initial materials and after long-term annealing. Based on the obtained results, the aluminum alloys, with the addition of reduced deep-sea nodules, can serve as precursors for processing, e.g., by rapid solidification or hot working methods.
1. Introduction
The seabed is covered by a large number of minerals, the two main classes of which are biogenous and hydrogenous sediments. In between these two classes, there are manganese nodules, also known as ferromanganese concretions. They were discovered by the Challenger expedition in the 1870s, like many other oceanographic facts and objects. The manganese nodules are composed of oxides and hydroxides of Mn, Fe, Cu, Co, Ni, and other elements. They are distinguishable by their typical black color, size of around 5 cm, and mamillated shape (roundish with small humps). This unusual shape originates from frequent overturning motions, which keep them on the very top of the seafloor. Their growth is caused by microorganisms, which reduce the cations, with limited solubility in seawater. Their growth rate is in millimeters per million years, which causes the formation of growth rings containing information about Cenozoic history (modern history from the geological point of view—from about 60 million years ago until now). The nodules not only serve as documentation on sea conditions in history but are also promising raw materials [].
As mentioned above, the manganese nodules contain not only Mn but also Fe, Ni, Cu, Co, and rare earth elements like Ce, Nd, and Dy []. Interestingly, the main reason for mining manganese nodules is the possibility of extracting valuable minor elements. The nodules are formed by fine grains (approx. 100 nm) with Fe and Mn oxide lattices, where the other elements are present as substitutional or absorbed atoms []. Due to this fact, it is not possible to enrich any fraction of milled nodules by classical methods like magnetic separation or flotation []. The whole mass of deep-sea nodules has to be processed to gain the elements of interest. Together with technologically complicated mining [] and the ecological aspects of mining [], these are the reasons why the attitude towards nodule processing is changing []. Recently, manganese nodules have become a popular topic again [].
The processing of nodules can be divided into two main categories—pyrometallurgical and hydrometallurgical methods [,]. The nodules in their original form are porous and fragile, which makes them easy to be milled to fine powder. On the other hand, it keeps humidity in the material, and a huge amount of energy has to be consumed only for drying due to the porosity []. The problem with humidity is negligible in the case of hydrometallurgical processing of the nodules, and, hence, this way seems to be slightly preferred in the published works [,,,]. Dissolution of the whole mass of nodules leads to the consumption of significant amounts of leaching agents (e.g., H2SO4) []. The solution obtained by this process has a complex chemical composition, and the individual elements are subsequently separated by their specific reactions, e.g., precipitation of Fe in the form of jarosite []. Selective leaching of the elements of interest is a more sophisticated approach that might be carried out in acids [,] and alkalis []. Its efficiency might be increased by using microwaves [], or selectivity might be provided by using fungi-mediated leaching [] or nonionic surfactants []. Pyrometallurgical treatments like chlorination, sulfonation, and reduction roasting before leaching have also been described []. The solid residue after leaching might be used as a sorbent agent [,], which decreases the amount of waste produced during processing. Nevertheless, the water consumption for leaching of materials with low concentrations of the elements of interest is problematic when water is almost a strategic source. Pyrometallurgical reduction by the mixture of anthracite, CaF2, SiO2, and FeS led to the concentration of the valuable elements forming the nodules [], and the use of the reduced material for further hydrometallurgical separation has been suggested.
The above-presented methods, developed for the processing of deep-sea nodules, are rather complex and costly; hence, they make the mining and use of these raw materials even less economical. Therefore, we recently proposed an innovative approach—to reduce the nodules without the separation of individual metals, giving rise to a novel grade of materials []. The manganese nodules are predominantly formed by oxides of Mn and Fe in various oxidation states [,]. The reduction of MnO2 by metallic Al is a well-known exothermic reaction, so it may also be effective in the reduction of milled manganese nodules []. We tested this method for the processing of crushed deep-sea nodules and obtained new manganese alloys that are characterized by very good wear-resistance [].
The progressive Al alloys are alloyed by transition metals (TMs) and, often, also by rare earth metals (RE), where the ratios of the individual elements are variable. Many of the alloying elements applied in aluminum alloys are the ones that are also in manganese deep-sea nodules. For example, the addition of a small amount of Mn (0.2 wt %) into cast Al–Si–Fe alloy increases tensile strength []. The addition of Mn, together with Ca, which is an element also contained in manganese nodules, positively modified the morphology of Al–Si–Mg–Fe alloy and increased the alloy quality []. Moreover, the Al–Mn–Fe alloys are already used in the industry, e.g., under the designation of AW 3003, and they are usually processed by continuous and semicontinuous casting processes [,,,,]. The main structural features, with strengthening properties, in these alloys are plate-shaped dispersoids of the Al6(Mn,Fe) phase []. This is the equilibrium phase for alloys with a low amount of alloying elements. At higher content of alloying elements, other phases occur. In the Al alloy with 18 at % of Mn and 10% of Fe, a stable decagonal quasicrystalline phase, Al73.0Mn20.5Fe6.5, accompanied by Al11Mn4 and Al10Mn3 phases, is observed. The quasicrystal material is enriched by interesting properties such as high hardness and wear-resistance. The above-mentioned studies show that alloying by both Mn and Fe is very promising. From the other elements obtained in manganese nodules, the role of Cu in Al alloys is well known and described [,,]. It is based on precipitation strengthening at the Al2Cu phase. Ni and Co increase the number of TMs in the system, which is convenient if the alloy should be processed by rapid solidification techniques because it increases the glass-forming ability of the alloy []. The presence of RE has already been reported to improve the thermal stability of the rapidly solidified Al alloys []. Due to a larger atomic ratio of the RE, it also increases the glass-forming ability of the alloy system [].
Since all of the metals included in the deep-sea nodules have been already studied or even industrially applied as alloying elements for aluminum alloys, the use of their combination in a natural ratio seems to be promising. Therefore, this paper aims to test the applicability of the aluminothermy-reduced deep-sea nodules as the mixture of alloying elements for aluminum.
2. Materials and Methods
The milled manganese nodules from the Clarion–Clipperton zone were reduced by a stoichiometric amount of Al. Detailed information on the reduction process is given in []. The reduced material was melted with technically pure aluminum (min. 99.5 wt % Al) in the induction furnace in an argon atmosphere. The total weight of each sample before melting was 200 g. The melt was cast to a mold of 20 mm in diameter. The chemical composition was measured by an fluorescence spectrometer (XRF, Axios, PANanalytical, Almelo, The Netherlands). Phase composition was determined by a X-ray diffractometer (XRD, PANanalytical X’pert PRO, Almelo, The Netherlands) with Co anode, using a step of 0.026° 2 Th. and the measuring time per step of 1 s. The materials were examined by an Olympus PME 3 (Olympus, Tokyo, Japan) light optical microscope (LOM) and a TESCAN VEGA 3 LMU scanning electron microscope (SEM, TESCAN, Brno, Czech Republic), with an accelerating voltage of 20 kV and a working distance of 15 mm for energy dispersive spectroscopic analysis (EDS, Oxford Instruments, Abingdon, UK). Backscattered electrons (BSEs) were used for imaging. The samples were observed after etching in the 0.5% solution of HF for 3 s. Point analysis was measured at least three times on microstructurally equivalent places (e.g., matrix or intermetallic phase). In the results, the part for each alloy presented only one representative spectrum. Image analysis was performed by ImageJ 1.43 software. The Vickers microhardness (136-degree diamond pyramid indenter) was measured using a Future-Tech FM-700 device (Future-Tech Corp, Tokyo, Japan) with a load of 1 kg and a dwell time of 15 s. The presented value is an average of 10 measurements.
The alloys are labeled according to the approximate total amounts of the alloying elements—1, 7, and 9.
The materials were annealed at 450 °C for 100 h in a resistance furnace (Martinek) in an air atmosphere with subsequent air cooling.
3. Results and Discussion
The chemical composition of all three tested materials (1, 7, and 9) is given in Table 1. The content of Si is higher than expected in all alloys; this is probably caused by the presence of Si in the technically pure aluminum, which was used for their preparation. The amount of alloying elements in Alloy 1 is lower than expected, which is probably caused by the burning-out of the alloying elements during melting or by improper homogenization of the melt.

Table 1.
Chemical composition of studied materials given in wt % (X-ray fluorescence spectrometer (XRF)).
The phase composition of all alloys is shown in XRD patterns in Figure 1. In Alloy 1, the aluminum matrix with a negligible amount of a minor Al6(Fe,Mn) phase was detected. In Alloys 7 and 9, the presence of Al6(Fe,Mn) and Al11Fe7 phases was observed in addition to the aluminum matrix. Minor elements are probably dissolved in the major phases.
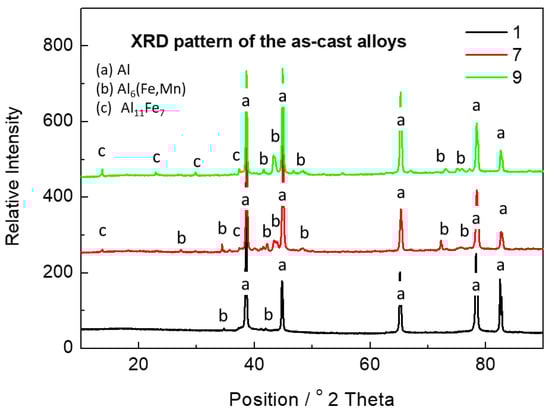
Figure 1.
XRD pattern of the as-cast alloys.
The optical (LM) and electron (SEM-BSE) micrographs of the studied alloys are presented in Figure 2, Figure 3 and Figure 4. The microstructure of Alloy 1 is composed predominantly of an Al matrix, which is in agreement with the phase composition documented in Figure 1.
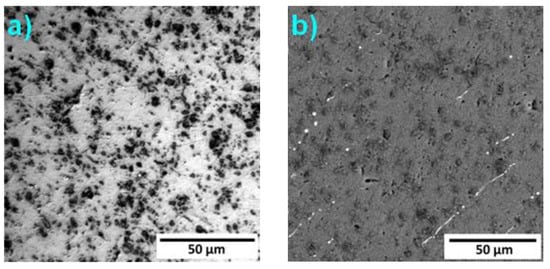
Figure 2.
Microstructure of Alloy 1: (a) light optical microscope (LOM) and (b) electron (SEM-BSE) micrographs.
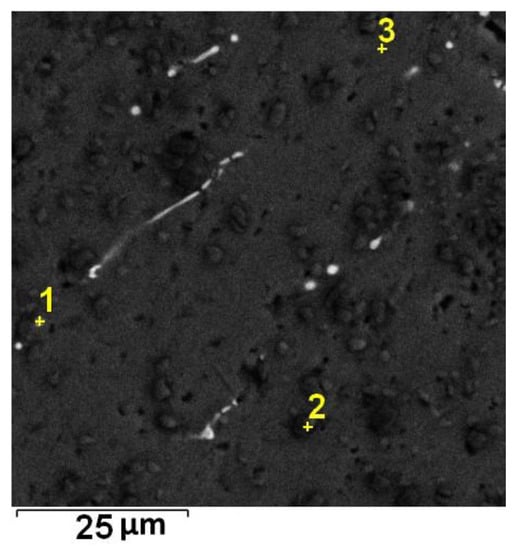
Figure 3.
Localization of point EDS analyses shown in Table 2; SEM-BSE.
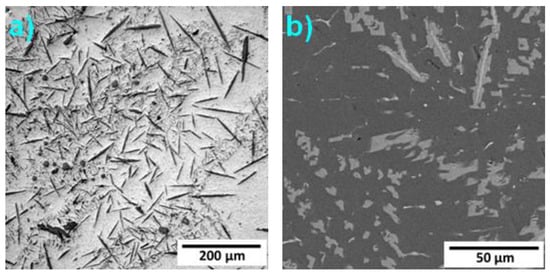
Figure 4.
Microstructure of Alloy 7: (a) (LOM); (b) SEM-BSE.
The black spots in Figure 2a, which appear as dark grey spots in Figure 2b, might be formed by Si that originates from the impurities in the initial Al. More probably, these particles are SiC abrasive particles extracted from the grinding paper. This alloy has extremely low hardness, and hence, it is impossible to preclude this contamination during the sample preparation. The minor intermetallic phases are visible as the bright elongated particles in Figure 2b.
The composition corresponding to the bright particles is shown as Spectrum 1 in Table 2. The localization of point EDS analyses is shown in Figure 3. The size of the bright particles is too small, and, therefore, the point EDS spectra also contain signals from the Al matrix. It can be suggested that the minor phase is Al6(Mn,Fe), which is in agreement with the XRD results shown in Figure 1.
Table 2.
EDS point analyses of Alloy 1. The location of individual spectra is shown in Figure 3.
The microstructure of Alloy 7 is formed by the Al matrix, minor Si-rich particles, and needles rich in Mn and Fe. The needles have a core with a higher content of alloying elements, as can be seen in Figure 4b and Figure 5.
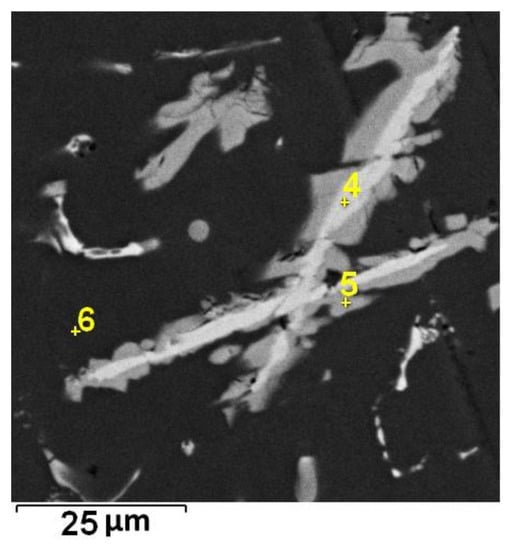
Figure 5.
Localization of point EDS analyses shown in Table 3; SEM-BSE.
The average total content of Mn and Fe in the core parts of the needles is about 35 wt %. The content of these elements in the Al6(Mn,Fe) phase is 25 wt %. The difference between the measured and theoretical composition may be caused by the low accuracy of the EDS analysis, or the cores may be the residues of unreacted reduced manganese nodules.
When all point EDS analyses given in Table 3 are compared, they reveal that the content of Fe is the same in the core and in the shell of the needles. This disclaims the theory of unreacted residues. The shells of needles (Spectrum 5) are formed by the Fe-rich phase, and it was probably Al11Fe7 that was observed in Figure 1.
Table 3.
EDS point analyses of Alloy 5. The location of individual spectra is shown in Figure 5.
In the microstructure of Alloy 9, interconnected oxide particles (randomly in few places) were observed, which are illustrated in Figure 6a as a black stripe. In the detailed view given in Figure 6b, a microstructure formed by needles and fine particles can be observed.
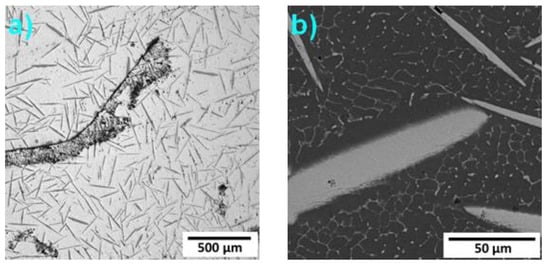
Figure 6.
Microstructure of Alloy 7: (a) LOM, (b) SEM-BSE.
The total content of Mn and Fe in the needles in Alloy 9 was estimated to be about 35 wt %; in this case, see also Table 4. These particles are formed by the Al6(Mn,Fe) phase. The fine particles occupying the interdendritic spaces are rich in iron and might be formed by the Al11Fe7 phase. However, this morphology is typical for the Al13Fe4 phase []. The fact that this phase was not detected by the XRD given in Figure 1 may be caused by the very small size of the particles and a content lower than 5 wt %.
Table 4.
EDS point analyses of Alloy 7. The location of individual spectra is shown in Figure 7.
The fact that the EDS result for Mn and Fe might be overestimated is confirmed by Spectra 7 and 8 in Table 4, which were measured in the Al matrix. The measured content of alloying elements was far behind the equilibrium solubility of those elements in the Al matrix [].
The area fraction of minor phases (and the content of the elements included in them) increases with an increase in the amount of the alloying elements, as shown in Table 5. However, the increase in the amount of minor phases is not fully proportional to the content of alloying elements. The explanation may be the presence of different types and mutual ratios of minor phases in each alloy.
Table 5.
Area fraction of minor phases in the as-cast alloys.
The Vickers hardness (HV1) of alloys is presented in Table 6. The hardness of Alloy 1 corresponds to pure Al []. With an increasing amount of alloying elements, the hardness values are also increasing. This may be caused by the presence of a higher amount of hard intermetallic phases by solid solution strengthening or the combined effect of both mechanisms mentioned.
Table 6.
Microhardness (HV1) of the as-cast alloys.
The thermal stability of studied materials was determined by annealing at 450 °C for 100 h, and the micrographs of annealed alloys are presented in Figure 8. The elongated particles in Alloy 1 were spheroidized. The microstructure of Alloy 7 exhibited the most significant change. The cores of the needles disappeared, and precipitation of a minor phase in the interdendritic spaces took place. The microstructure of Alloy 9 remained unchanged.
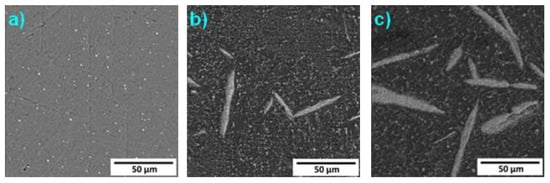
Figure 8.
Microstructure of the alloys after annealing at 450 °C for 100 h: (a) 2, (b) 5, (c) 7 (SEM-BSE).
Although some microstructural changes were observed after annealing, the area fraction of minor phases remained unaffected within the experimental errors, as shown in Table 7.
Table 7.
Area fraction of minor phases in the alloys after annealing at 450 °C for 100 h.
The thermal stability of alloys was also confirmed by hardness measurement after annealing (the results are given in Table 8), which was also maintained at the same levels as before the annealing.
Table 8.
Microhardness (HV1) of the alloys annealed at 450 °C for 100 h.
The microstructure of Alloys 7 and 9 have the same morphology as the equilibrium precursors for rapidly solidified Al alloys described in our previous works []. Alloy 9, with the highest amount of alloying elements, especially exhibited high thermal stability in the cast state, which is a necessary assumption for obtaining thermally stable rapidly solidified fine-grained alloys.
4. Conclusions
It is proven in this paper that the natural alloy obtained by the reduction of milled manganese nodules by aluminum can be successfully used for the production of Al–Mn–Fe-based alloys. When the content of alloying elements was 7 and 9 wt %, the alloys exhibited high thermal stability. The alloys described in this study have the potential to be processed by unconventional techniques like rapid solidification, with the aim to obtain promising structural materials.
Author Contributions
Conceptualization, A.M. and P.N.; investigation, A.M. and M.O.; writing—original draft preparation, A.M. and P.N. All authors have read and agreed to the published version of the manuscript.
Funding
This research was funded by the Czech Science Foundation (project No. 20-15217S).
Data Availability Statement
The data are stored by the authors of the paper and not available publicly.
Conflicts of Interest
The authors declare no conflict of interest.
References
- Wang, X.; Muller, W.E.G. Marine biominerals: Perspectives and challenges for polymetallic nodules and crusts. Trends Biotechnol. 2009, 27, 375–383. [Google Scholar] [CrossRef] [PubMed]
- Randhawa, N.S.; Hait, J.; Jana, R.K. A brief overview on manganese nodules processing signifying the detail in the Indian context highlighting the international scenario. Hydrometallurgy 2016, 165, 166–181. [Google Scholar] [CrossRef]
- Wegorzewski, A.V.; Köpcke, M.; Kuhn, T.; Sitnikova, M.A.; Wotruba, H. Thermal Pre-Treatment of Polymetallic Nodules to Create Metal (Ni, Cu, Co)-Rich Individual Particles for Further Processing. Minerals 2018, 8, 523. [Google Scholar] [CrossRef]
- Zhao, F.; Jiang, X.; Wang, S.; Feng, L.; Li, D. The Recovery of Valuable Metals from Ocean Polymetallic Nodules Using Solid-State Metalized Reduction Technology. Minerals 2020, 10, 20. [Google Scholar] [CrossRef]
- Jones, D.O.B.; Ardron, J.A.; Colaço, A.; Durden, J.M. Environmental considerations for impact and preservation reference zones for deep-sea polymetallic nodule mining. Mar. Policy 2020, 118, 103312. [Google Scholar] [CrossRef]
- Sparenberg, O. A historical perspective on deep-sea mining for manganese nodules, 1965–2019. Extr. Ind. Soc. 2019, 6, 842–854. [Google Scholar] [CrossRef]
- Hein, J.R.; Koschinsky, A.; Kuhn, T. Deep- ocean polymetallic nodules as a resource for critical materials. Nat. Rev. 2020, 1, 159. [Google Scholar] [CrossRef]
- van Wijk, J.M.; de Hoog, E. Size reduction of CCZ polymetallic nodules under repeated impact fragmentation. Results Eng. 2020, 7, 100154. [Google Scholar] [CrossRef]
- Shen, Y.; Xue, W.; Li, W.; Li, S.; Liu, X. Recovery of Mn2+, Co2+ and Ni2+ from manganese nodules by redox leaching and solvent extraction. Trans. Nonferrous Met. Soc. China 2007, 17, 1105–1111. [Google Scholar] [CrossRef]
- Parhi, P.K.; Park, K.H.; Nam, C.W.; Park, J.T.; Barik, S.P. Extraction of rare earth metals from deep sea nodule using H2SO4 solution. Int. J. Min. Process. 2013, 119, 89–92. [Google Scholar] [CrossRef]
- Parhi, P.K.; Park, K.H.; Nam, C.W.; Park, J.T. Liquid-liquid extraction and separation of total rare earth (RE) metals from polymetallic manganese nodule leaching solution. J. Rare Earths 2015, 33, 207. [Google Scholar] [CrossRef]
- Jandavá, J.; Vu, H.; Lisá, K.; Gragar, T.; Boháček, J. Hydrometallurgical processing of manganese deep-sea nodules: Dissolution and iron recovery. In Proceedings of the Fourth (2001) Ocean Mining Symposium, Szczecin, Poland, 23–27 September 2001. [Google Scholar]
- Senanayake, G. Acid leaching of metals from deep-sea manganese nodules—A critical review of fundamentals and applications. Min. Eng. 2011, 24, 1379–1396. [Google Scholar] [CrossRef]
- Jana, R.K.; Pandey, B.D. Premchand. Ammoniacal leaching of roast reduced deep-sea manganese nodules. Hydrometallurgy 1999, 53, 45–56. [Google Scholar] [CrossRef]
- Knaislová, A.; Vu, H.; Dvořák, P. Microwave and Ultrasound Effect on Ammoniacal Leaching of Deep-Sea Nodules. Minerals 2018, 8, 351. [Google Scholar] [CrossRef]
- Beolchini, F.; Becci, A.; Barone, G.; Amato, A.; Hekeu, M.; Danovaro, R.; Dell’Anno, A. High fungal-mediated leaching efficiency of valuable metals from deep-sea polymetallic nodules. Env. Technol. Innov. 2020, 20, 101037. [Google Scholar] [CrossRef]
- Mukherjee, P.; Pattnaik, S.; Sanjay, K.; Mohapatra, M. Manganese enrichment of polymetallic oceanic nodules via selective leaching process for energy storage applications. J. Chem. Technol. Biotechnol. 2020. [Google Scholar] [CrossRef]
- Vu, H.; Kristianova, E.; Dvořák, P.; Abramowski, T.; Dreiseitl, I.; Adrysheva, A. Modified Leach Residues from Processing Deep-Sea Nodules as E_ective Heavy Metals Adsorbents. Metals 2019, 9, 472. [Google Scholar] [CrossRef]
- Li, D.; Fu, Y.; Sun, X.; Wei, Z. Critical metal enrichment mechanism of deep-sea hydrogenetic nodules: Insights from mineralogy and element mobility. Ore Geol. Rev. 2020, 118, 103371. [Google Scholar] [CrossRef]
- Novák, P.; Vu, N.H.; Šulcová, L.; Kopeček, J.; Laufek, F.; Tsepeleva, A.; Dvořák, P.; Michalcová, A. Structure and Properties of Alloys Obtained by Aluminothermic Reduction of Deep-Sea Nodules. Materials 2021, 14, 561. [Google Scholar] [CrossRef] [PubMed]
- Kim, H.Y.; Han, S.W.; Lee, H.M. The influence of Mn and Cr on the tensile properties of A356–0.20Fe alloy. Mater. Lett. 2006, 60, 1880–1883. [Google Scholar] [CrossRef]
- Sreeja Kumari, S.S.; Pillai, R.M.; Pai, B.C. A study on the structural, age hardening and mechanical characteristics of Mn and Ca added Al–7Si–0.3Mg–0.6Fe alloy. J. Alloy. Compd. 2008, 453, 167–173. [Google Scholar] [CrossRef]
- Poková, M.; Cieslar, M.; Lacaze, J. TEM Investigation of Precipitation in Al-Mn Alloys with Addition of Zr. In Proceedings of the International Conference Microscopy and Non-destructive Materials Testing 2012, Litoměřice, Czech Republic, 17–18 October 2012. [Google Scholar]
- Martins, J.P.; Carvalho, A.L.M.; Padilha, A.F. Microstructure and texture assessment of Al–Mn–Fe–Si (3003) aluminum alloy produced by continuous and semicontinuous casting processes. J. Mater. Sci. 2009, 44, 2966–2976. [Google Scholar] [CrossRef]
- Huang, K.; Engler, O.; Li, Y.J.; Marthinsen, K. Evolution in microstructure and properties during non-isothermal annealing of a cold-rolled Al–Mn–Fe–Si alloy with different microchemistry states. Mater. Sci. Eng. A 2015, 628, 216–229. [Google Scholar] [CrossRef]
- Huang, K.; Li, Y.; Marthinsen, K. Isothermal annealing of cold-rolled Al−Mn−Fe−Si alloy with different microchemistry states. Trans. Nonferrous Met. Soc. China 2014, 24, 3840–3847. [Google Scholar] [CrossRef][Green Version]
- Huang, K.; Marthinsen, K. The effect of heating rate on the softening behaviour of a deformed Al–Mn alloy with strong and weak concurrent precipitation. Mater. Charact. 2015, 110, 215–221. [Google Scholar] [CrossRef]
- Li, Y.J.; Zhang, W.Z.; Marthinsen, K. Precipitation crystallography of plate-shaped Al6(Mn,Fe) dispersoids in AA5182 alloy. Acta Mater. 2012, 60, 5963–5974. [Google Scholar] [CrossRef]
- Wang, S.; Fan, C. Crystal Structures of Al2Cu Revisited: Understanding Existing Phases and Exploring Other Potential Phases. Metals 2019, 9, 1037. [Google Scholar] [CrossRef]
- Fatmi, M.; Ghebouli, B.; Ghebouli, M.A.; Chihi, T.; Ouakdi, E.; Heiba, Z.A. Study of Precipitation Kinetics in Al-3.7 wt% Cu Alloy during Non-Isothermal and Isothermal Ageing. Chin. J. Phys. 2013, 51, 1019. [Google Scholar] [CrossRef]
- Vončina, M.; Medved, J.; Mrvar, P. Energy of Precipitation of Al2Cu and alpha—AlFeSi Phase from the AlCu3 Alloy and the Shape of Precipitates. Metalurgija 2009, 48, 9–13. [Google Scholar]
- Lu, Z.P.; Liu, C.T. A new glass-forming ability criterion for bulk metallic glasses. Acta Materialia 2002, 50, 3501–3512. [Google Scholar] [CrossRef]
- Michalcova, A.; Vojtech, D.; Schumacher, G.; Novak, P.; Klementova, M.; Serak, J.; Mudrova, M.; Valdaufova, J. Influence of cooling rate and cerium addition on rapidly solidified Al-TM alloys. Kov. Mater. Met. Mater. 2010, 48, 1–7. [Google Scholar] [CrossRef]
- Michna, Š.; Lukac, I.; Ocenasek, V.; Koreny, R.; Drapala, J.; Schneider, H.; Miskufova, A. Encyklopedie Hliníku, 1st ed.; Adin: Prešov, Slovakia, 2006; ISBN 80-89041-88-4. [Google Scholar]
- Alshabatat, N.; Al-Qawabah, S. Effect of 4%wt. Cu Addition on the Mechanical Characteristics and Fatigue Life of Commercially Pure Aluminum. Jordan J. Mech. Ind. Eng. 2014, 9, 297–301. [Google Scholar]

Publisher’s Note: MDPI stays neutral with regard to jurisdictional claims in published maps and institutional affiliations. |
© 2021 by the authors. Licensee MDPI, Basel, Switzerland. This article is an open access article distributed under the terms and conditions of the Creative Commons Attribution (CC BY) license (http://creativecommons.org/licenses/by/4.0/).