Article

Experimental Analysis and Optimization of EDM Parameters on HcHcr Steel in Context with Different Electrodes and Dielectric Fluids Using Hybrid Taguchi-Based PCA-Utility and CRITIC-Utility Approaches

by
Manjunath Patel Gowdru Chandrashekarappa
1,
Sandeep Kumar
2,
Jagadish
3,*,
Danil Yurievich Pimenov
4 and
Khaled Giasin
5
1
Department of Mechanical Engineering, PES Institute of Technology and Management, Shivamogga, Affiliated to Visvesvaraya Technological University, Belagavi 590018, India
2
Department of Mechanical Engineering, Bengal College of Engineering & Technology, Durgapur 713212, India
3
Department of Mechanical Engineering, National Institute of Technology Raipur, Chhattisgarh 492010, India
4
Department of Automated Mechanical Engineering, South Ural State University, Lenin Prosp. 76, 454080 Chelyabinsk, Russia
5
School of Mechanical and Design Engineering, University of Portsmouth, Portsmouth PO1 3DJ, UK
*
Author to whom correspondence should be addressed.
Metals 2021, 11(3), 419; https://doi.org/10.3390/met11030419
Submission received: 6 February 2021 / Revised: 22 February 2021 / Accepted: 28 February 2021 / Published: 4 March 2021
(This article belongs to the Special Issue Optimization and Analysis of Metal Cutting Processes)

Abstract

:
Industries demand stringent requirements towards economical machining without hindering the surface quality while cutting high carbon high chromium (HcHcr) steel. Electrical discharge machining (EDM) of HcHcr steel aims at reducing machining cost (i.e., maximize material removal rate (MRR) and minimize tool wear rate (TWR)) with good surface quality (i.e., minimize surface roughness (SR)). A comparative study was carried out on EDM of HcHcr D2 steel (DIN EN ISO 4957) by applying Taguchi L18 experimental design considering different electrode materials (copper, graphite, and brass), dielectric fluids (distilled water and kerosene), peak current, and pulse-on-time. The process performances were analyzed with respect to material removal rate, surface roughness, and tool wear rate. Pareto analysis of variance was employed to estimate the significance of the process variables and their optimal levels for achieving lower SR and TWR and higher MRR. Hybrid Taguchi-CRITIC-Utility and Taguchi-PCA-Utility methods were implemented to determine the optimal EDM parameters. Higher MRR of 0.0632 g/min and lower SR of 1.68 µm and TWR of 0.012 g/min was attained by graphite electrode in presence of distilled water as dielectric fluid compared to the brass and copper. Additionally, a metallographic analysis was carried out to study the surface integrity on the machined surfaces. Micrographic analysis of the optimal conditions showed lower surface roughness and fewer imperfections (lesser impression, waviness surface, and micro-cracks) compared to worst conditions.

1. Introduction

High carbon high chromium (HcHcr) steels are widely used to prepare dies and tools for applications in automobile and structural industries. HcHcr steels exhibit better dimensional stability, abrasion, and wear resistance, high compressive strengths, hardenability, and hot hardness properties [1]. These properties could help the materials to withstand the cyclic application of compressive stresses imposed on the punch and die during operations. Traditional machining of high carbon high chromium steels possesses difficulties due to their work-hardened nature and tool-work contact behavior experiences a variable cutting force that could result in rapid tool wear, rough machined surface, and high tooling cost [2]. The generation of powdered chips (i.e., dust) generated during machining causes serious environmental and health issues [3].
Non-traditional machining methods overcome the shortcomings of traditional machining methods in cutting high strength materials [4]. Thermal energy based on laser beam machining results in large heat-affected zones, recast layer formation, and thickness limitations (i.e., converging and diverging shape of beam profile) due to the taper produced during machining [5]. Mechanical energy-based abrasive water jet machining does not cut all thick-size materials, surface degradation, dimensional inaccuracies as a result of taper (i.e., the jet exits the work surface at a different angle than it enters) produced while making holes [6,7,8]. Higher tool wear of ultrasonic machining limits cutting hard materials economically [9]. Electrochemical machining failed to cut sharp corners or a flat base because the electrolyte tends to erode sharp profiles [10]. Therefore, the appropriate choice of the machining process is essential for obtaining high-quality parts without affecting the cost.
The electrical discharge machining (EDM) process has proven its effectiveness to generate complex profiles even for hard and brittle materials with fewer heat-affected zones and dimensional inaccuracies [11,12,13,14]. Performance characteristics (material removal rate (MRR), tool wear rate (TWR), and surface roughness (SR)) are influenced significantly by the variables, namely peak current, discharge energy, electrode material, dielectric fluid, plus on time, and other process parameters [15,16]. Machining AISI D2 steel with different electrode material and flushing pressure affects more on MRR and SR [17]. The Taguchi method identified that peak current directly influences electrode wear, whereas pulse duration affects the MRR [18]. Powdered metallurgy tool electrode is used to evaluate the process parameters of EDM process (such as MRR, SR, and TWR) of hast alloy with the change in current and voltage. Maximum MRR was observed at the mid-values of voltage, minimum TWR at low values of current, and minimum SR was observed at the mid-values of current and voltage [19]. EDM of AISI D2 steel is carried out under the influence of kerosene with different proportions of Cu-W electrode material, flushing pressure, current, and duty cycle on MRR and SR [20]. The electrode material was found to have the strongest effect on both the responses.
In previous studies, experiments were conducted to examine the electrode materials influence under kerosene oil as a dielectric fluid medium [21]. Electrode materials, gap voltage, peak current, duty cycle, and pulse on-time influences are examined on the responses (MRR, TWR, and radial overcut, (ROC)) while machining Inconel 718 material [22]. The factor peak current contributes more towards MRR, pulse on time for TWR, and duty cycle for ROC. The dielectric fluid emphasis on machined work material performances (MRR, SR, and TWR) were discussed by different authors [23,24]. Dielectric fluid plays a vital role during machining, namely insulation, ionization, debris removal, heat spark cooling, and flushing to remove the possible arcing that generates abnormal processes in machining performances. In the EDM process, hydrocarbon oils, water-based, and gaseous-based dielectric fluids are used [25,26]. The comparative analysis of distilled water, compound dielectric, and kerosene as a dielectric medium was investigated on titanium alloy machining performances (MRR, TWR, and SR) [27]. Distilled water resulted in higher MRR in the machining of Ti-6Al-4V alloy, compared to kerosene [28]. Machining Al-SiC composites with kerosene dielectric medium resulted in a uniform surface finish [29]. Oxygen gas produced better MRR compared to liquid dielectrics [30]. Although oxygen gas performances are better, liquid dielectrics are preferred to obtain stable discharging [31]. Surface modification of titanium alloy was carried out by applying two methods such as electric discharge coating and EDM processes subjected to Nb powder mixed in dielectric fluid medium [32]. From the above literature, the electrode material, dielectric fluids, peak current, and pulse-on-time are the major EDM parameters that influence the machining performances (MRR, TWR, and SR). Although many studies aimed to determine the optimal factor setting for individual outputs, the same condition results in poor performance (quality) for the other outputs. In addition, attempts are required to optimize the multiple outputs for better quality in machining HcHcr steels.
In recent years, attempts were made to optimize multiple outputs simultaneously by identifying single factor sets by utilizing gray relational analysis (GRA) [33], desirability function approach (DFA) [34], and soft computing algorithms [35]. Although soft computing tools offer near-optimal solutions at a quick time, they require a huge database, time, and effort for precise results [36]. Such model developments for practicing engineers in industries are often found difficult due to their large practical constraints. Although optimization tools such as GRA, DFA, and technique for order performance by similarity to ideal solution (TOPSIS) use simple mathematical steps, they require assigning weight fractions for each output function. Improper choice of assigning or determining weights for each output could result in unfeasible solutions for a process. Principal component analysis (PCA) estimates weights for each response by performing complex computations involving determining the eigenvalues and eigenvectors. Furthermore, no procedure is defined yet for such a situation, wherein the eigenvalue > 1 for more than one principal component (i.e., output) [37]. If the eigenvalue of the second principal component also resulted in close to one, then the solutions might be unfeasible for a process. To overcome the said problems, an alternate method of determining weights without the requirements of eigenvalues and eigenvectors is highly desirable. To date, not much work reported has investigated the multi-input variables and their effects on the performance characteristics. In addition, optimal parameters and levels for all performance characteristics are not reported yet in literature for HcHcr steel machining with the EDM process. The optimal weight for each response is not determined effectively by applying different methods (CRITIC and PCA) in the available literature.
The present work aims to evaluate the EDM machining of HcHcr steel by performing analysis of process variables on performance characteristics (MRR, TWR, and SR). The Taguchi method and Pareto ANOVA were employed to determine the optimal levels for each of the studied responses. The practicality significance of peak current, electrode materials (graphite, copper, and brass), dielectric fluids (distilled water and kerosene), and pulse-on-time are tested on the performance characteristics. The utility concept was used to determine optimal levels for all responses. PCA and criteria importance through criteria inter-correlation (CRITIC) methods are utilized to estimate the weight factors necessary for multi-objective optimization. The optimal conditions were further analyzed using optical micrographs to study their surface characteristics. The proposed framework of the current research is shown in Figure 1.

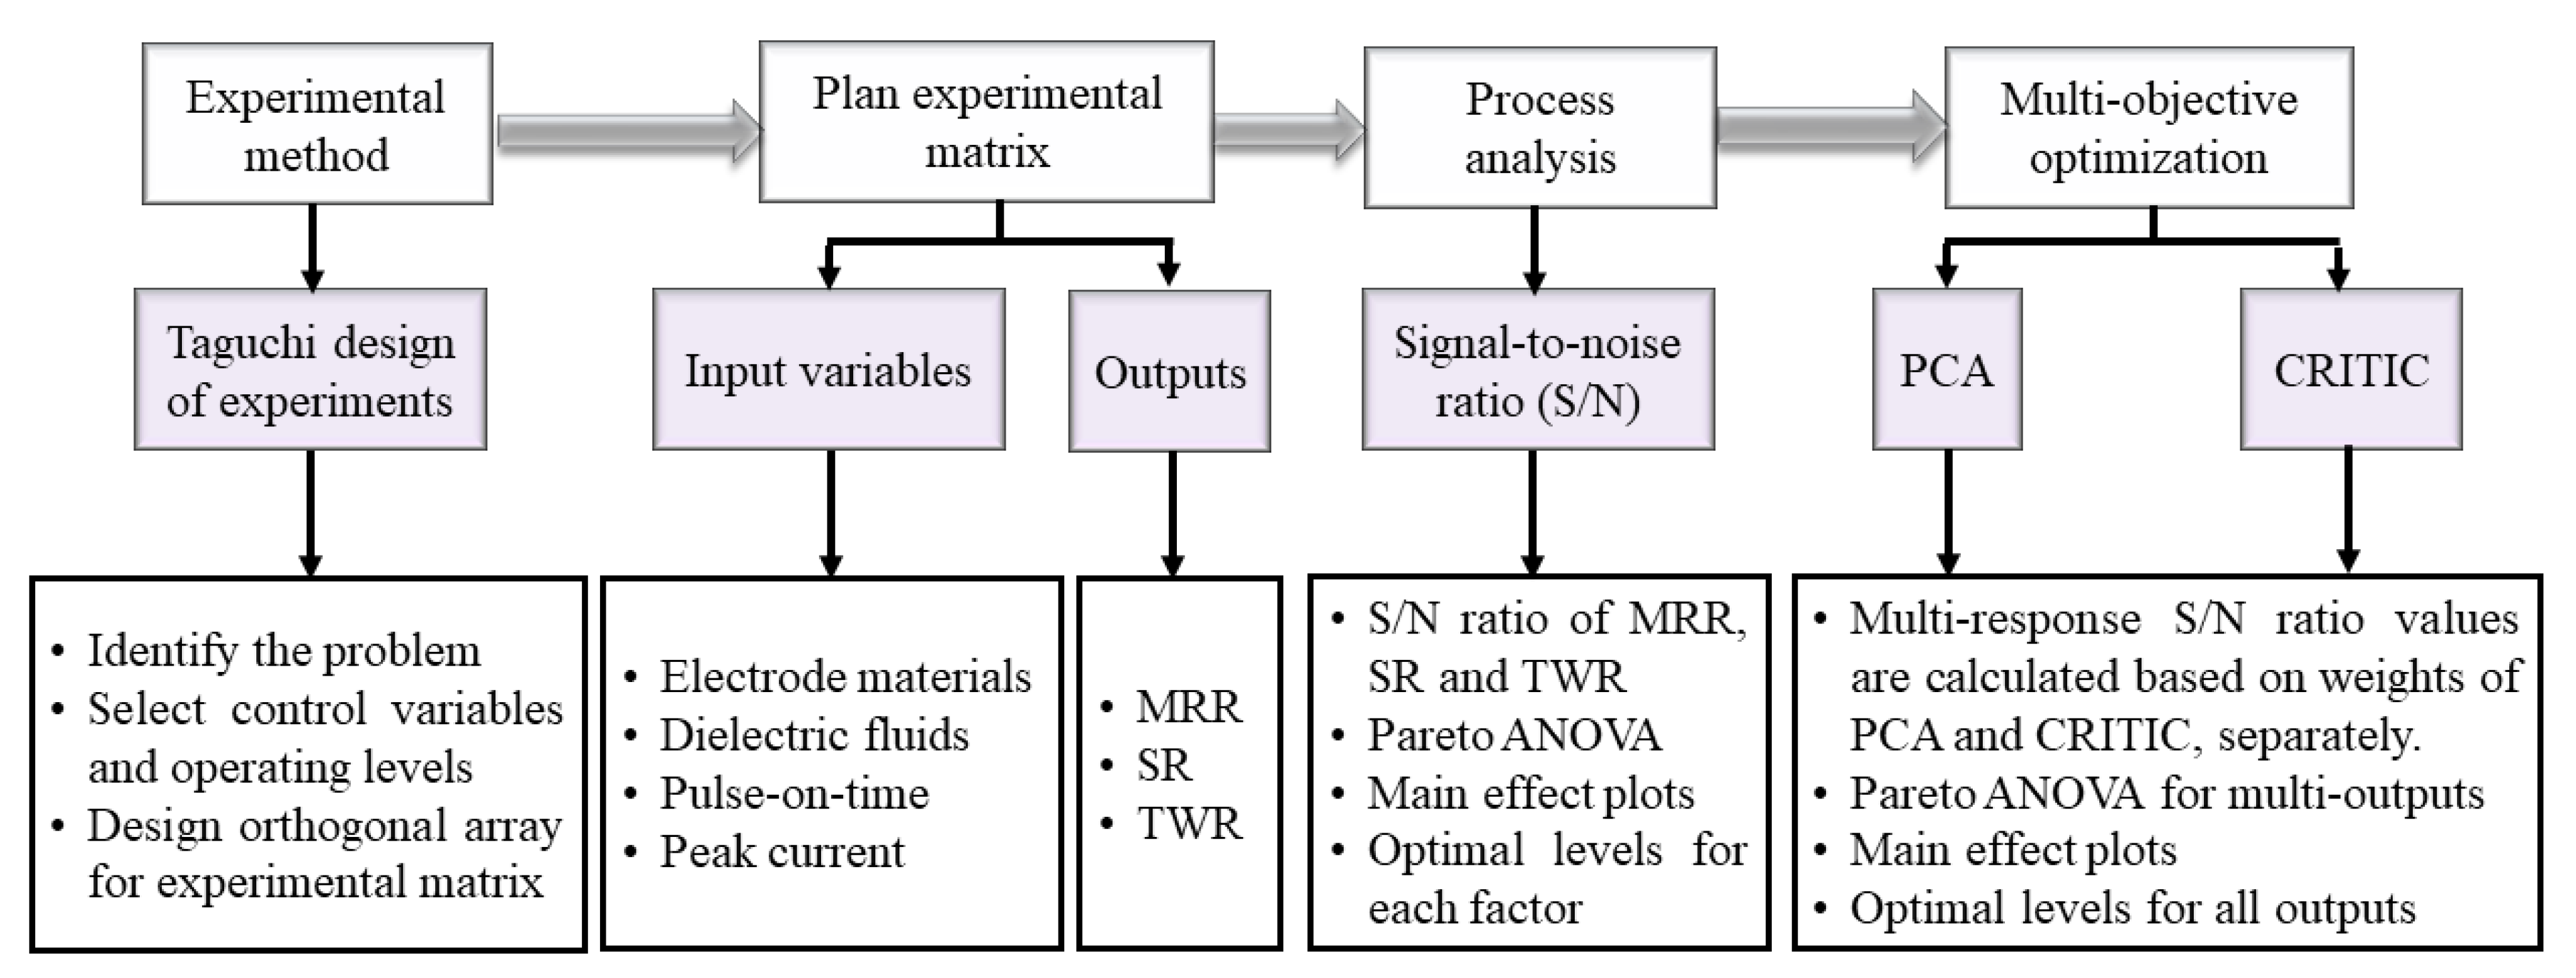
2. Materials and Methods
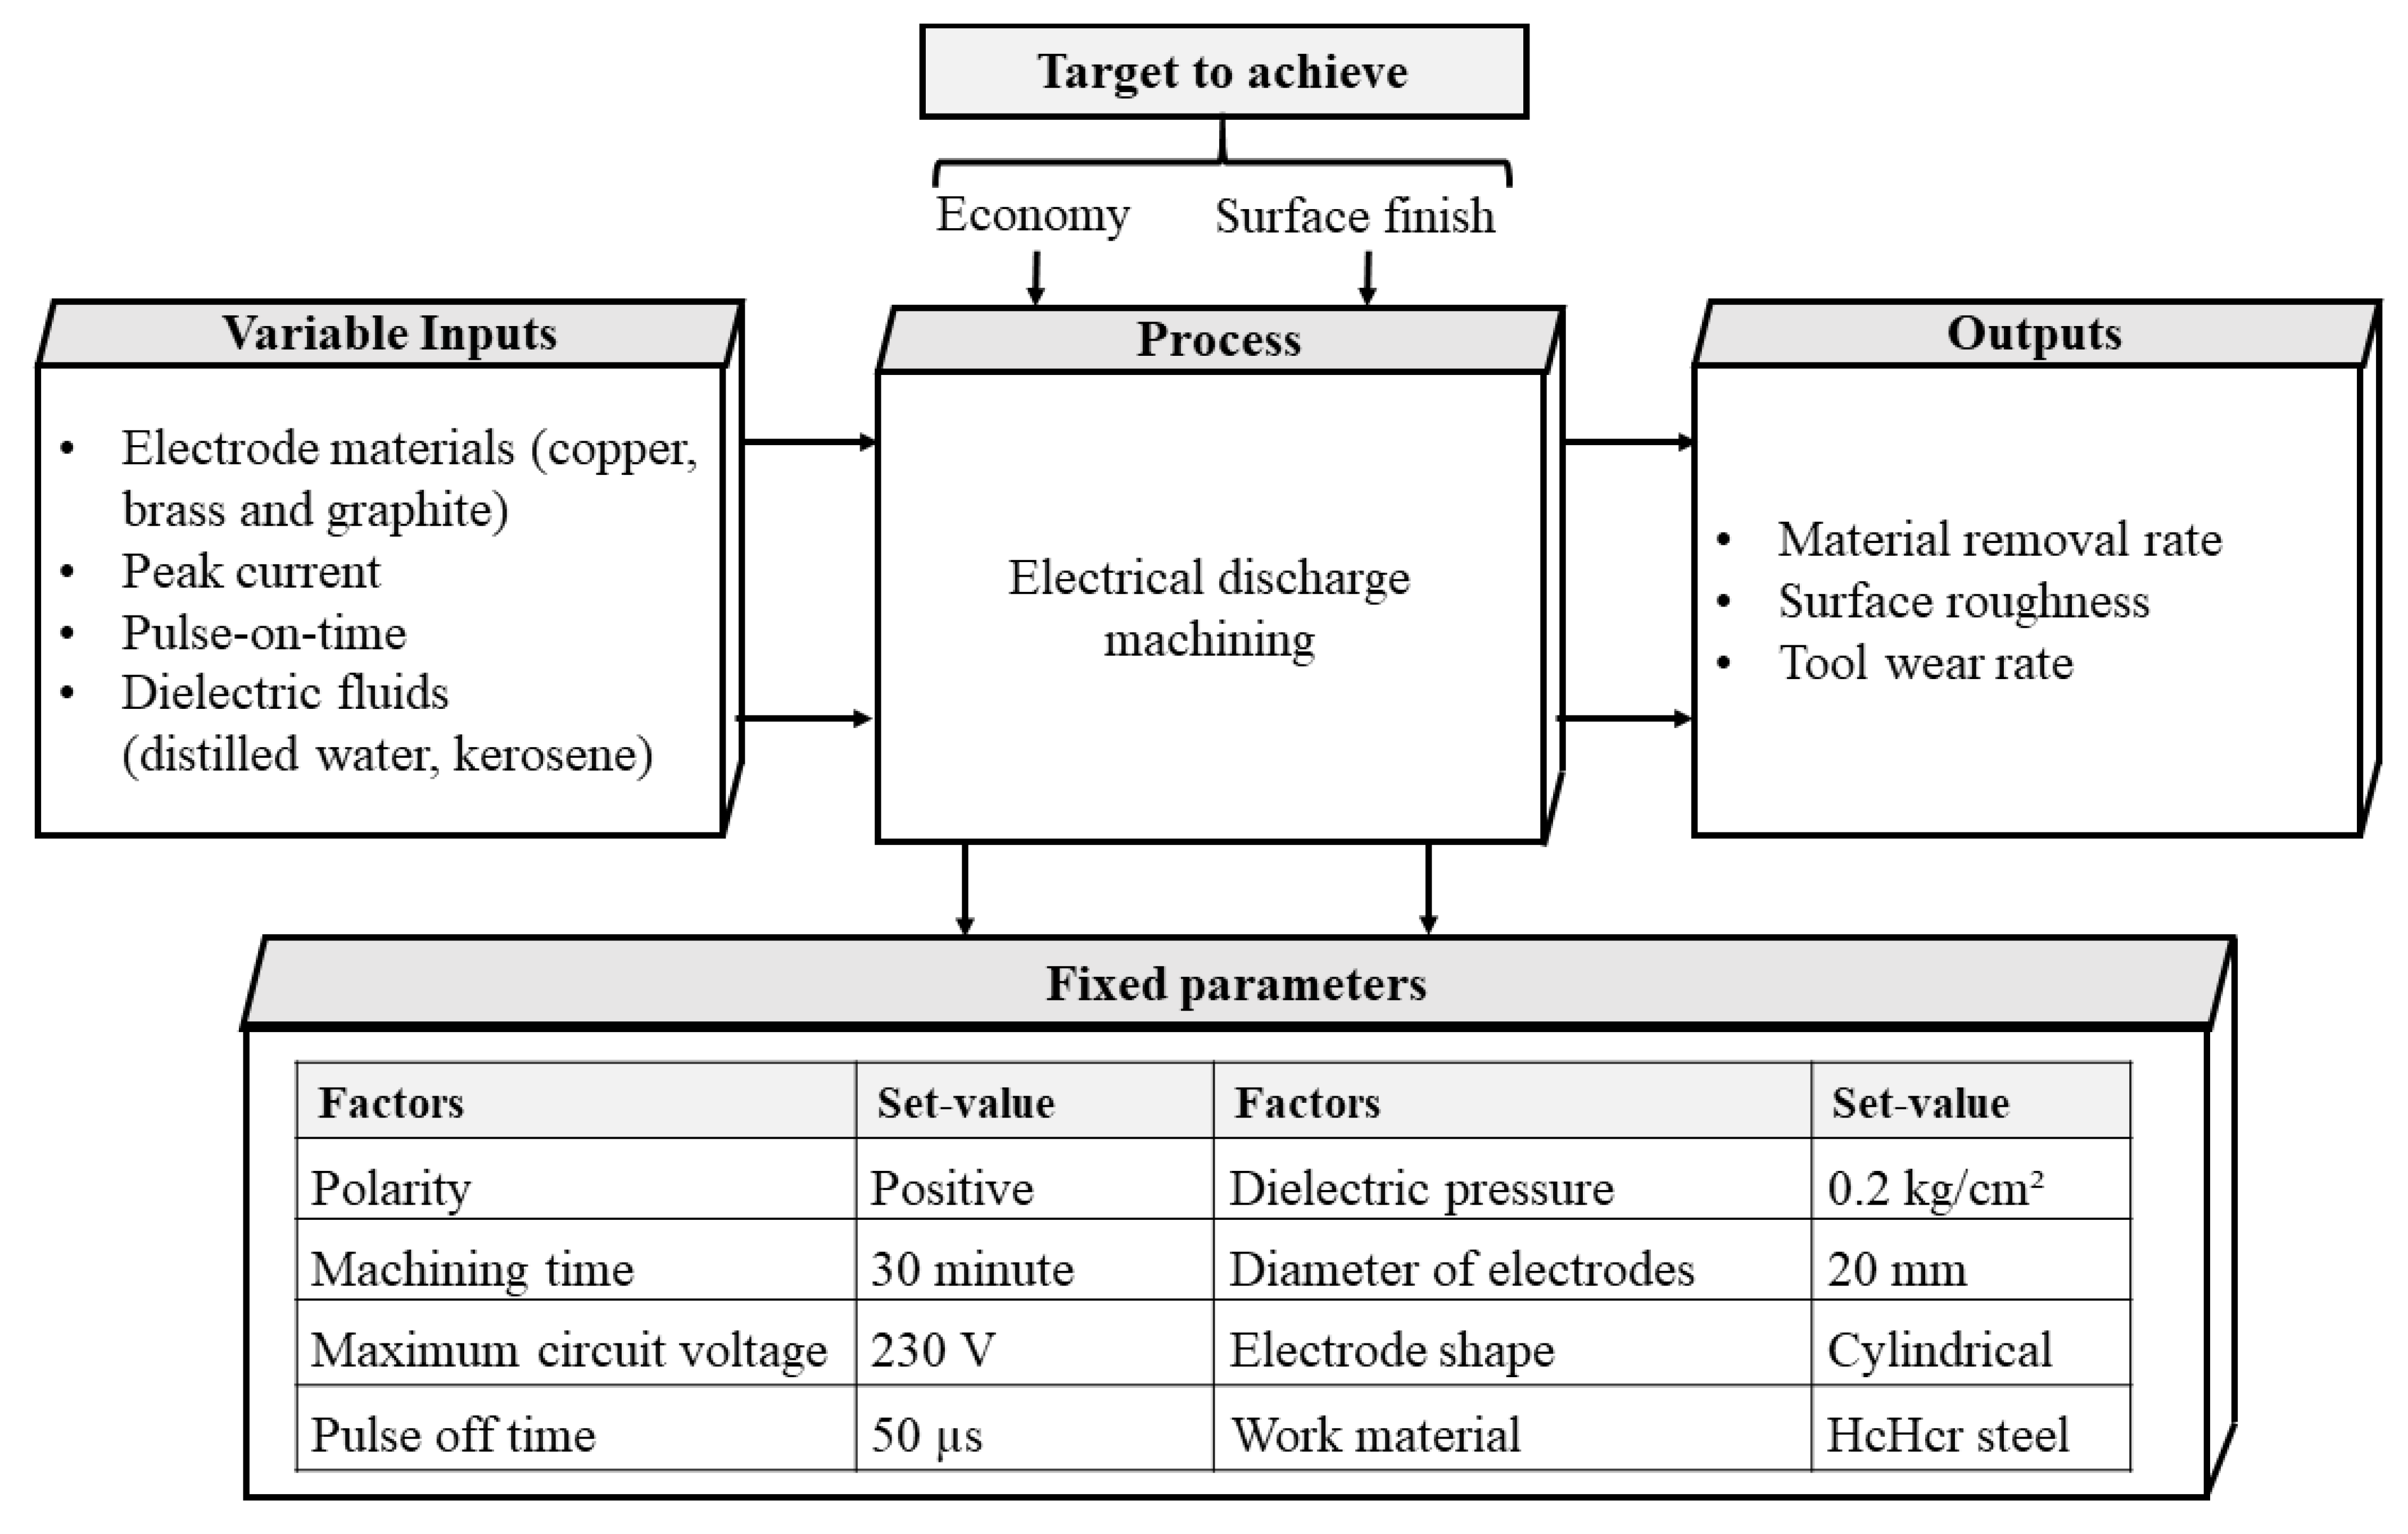
2.1. Work Materials

HcHcr D2 steel (DIN EN ISO 4957) was used as a work material possessing a hardness of about 62 HRC. For machining, the work material dimensions of 20 mm × 30 mm × 5 mm are used. Table 1 presents the chemical elements of HcHcr steel measured by optical emission spectrometer (Baird, USA) and properties of HcHcr steel. Table 2 presents the chemical elements and properties of HcHcr steel.

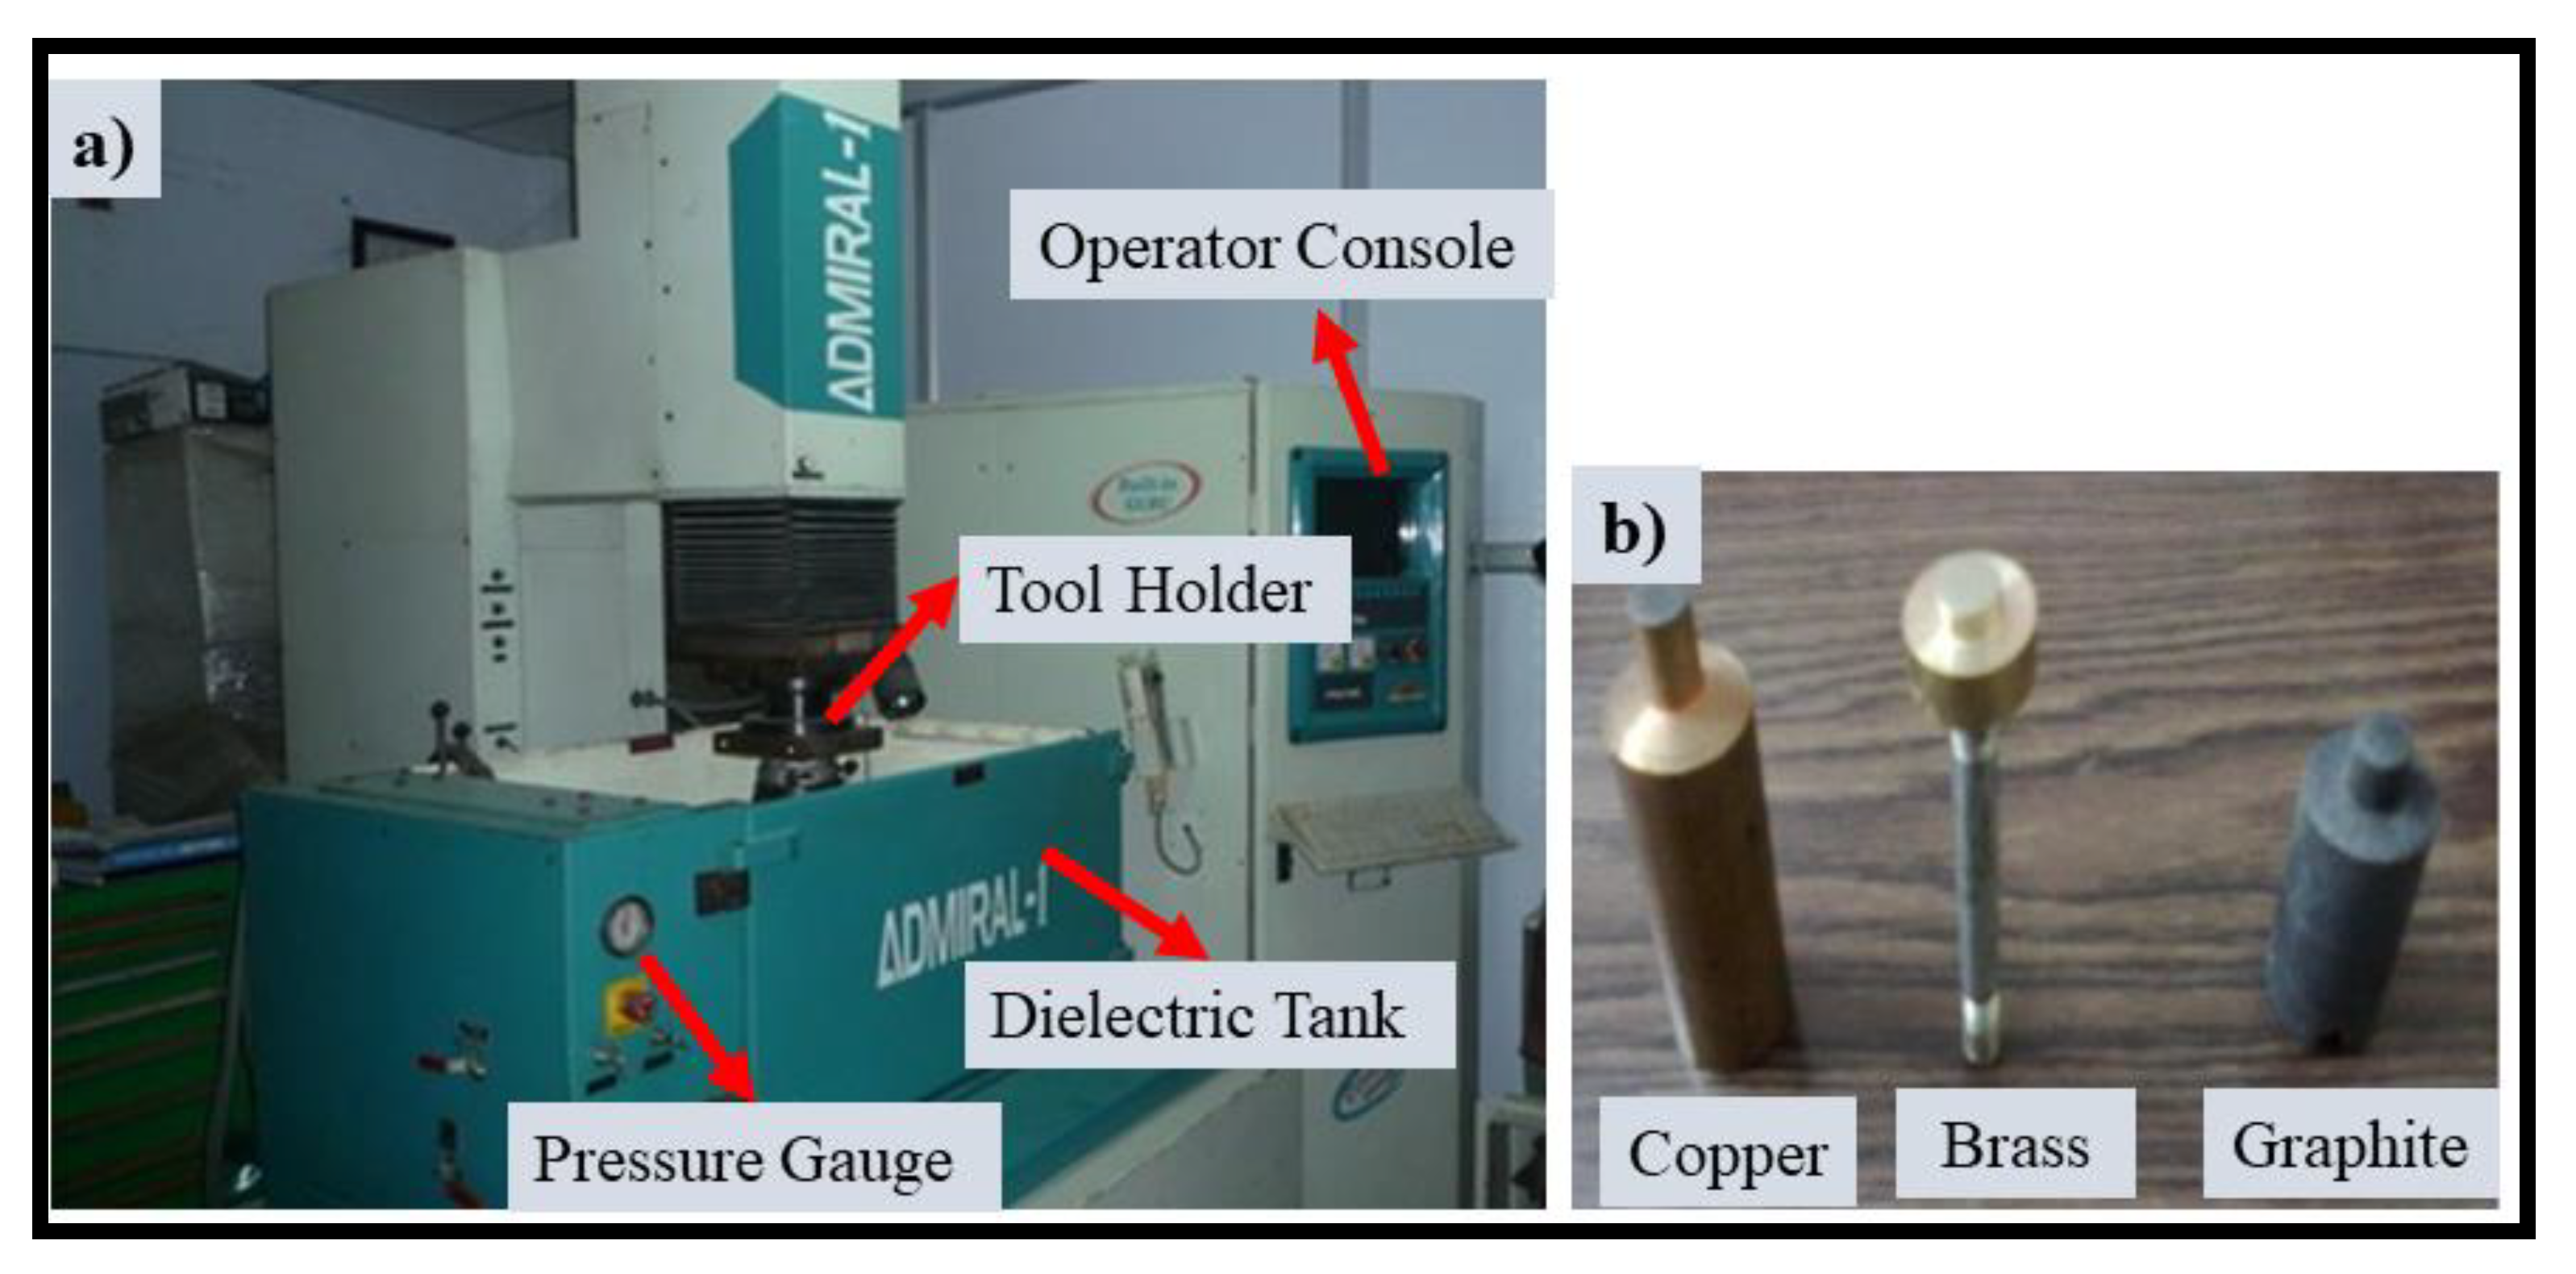
2.2. Dielectric Fluids and Electrodes Material

The function of dielectric fluids is to transfer the removed particles from the machining zone, improve the energy density, cool the electrode, stabilize dielectric strength, and act as electrically non-conducting until breakdown voltage occurs. In addition, the dielectric fluid acts as an insulator between the electrode and cavity. The dielectric fluid performance is reliant on the insulating property of a fluid. Furthermore, the performance (MRR, TWR, and SR) of machining parts is dependent on the dielectric fluid properties. The low viscosity of kerosene oil provides better flushing characteristics, but high volatility, low flash point, odor, and skin reaction are major drawbacks [25]. Machining with distilled water results in higher MRR and lower TWR but resulted in poor machining accuracy at a high energy pulse rate [39,40]. Table 3 presents the dielectric fluid properties.
Three different electrode materials performances on machined work samples are tested. The work material performances are dependent primarily on electrical conductivity, wear rate, melting point, and electrical resistance of electrode material. The electrode material possessing which has a diameter of 20 mm was used for analysis and optimization. Table 4 shows the details of the properties of the electrode material.

2.3. Experimental Details

HcHcr steel machining is performed on an EDM Machine (Model: T-3822, make Electronica Hitech machine tools Pvt. Ltd., Pune, India) possessing a separate dielectric tank and jet flushing for ease of dielectric flow towards work piece-electrode tool interface as shown in Figure 2a. Figure 2b shows the electrode materials used for the present work.
The input-output model of EDM is shown in Figure 3. Prior to experimentation, the work samples (20 mm × 30 mm × 5 mm) were ground to make them perfectly flat on both sides (top and bottom) to avoid dimensional inaccuracy and impart a good machined surface finish. Three electrode materials (graphite, copper, and brass) in cylindrical form of diameter 20 mm were used during experimentation [46]. Taguchi L18 experimental matrix was used for four input parameters operating at three levels (refer to Table 5). During experimentation, few variables were set to a fixed value for performing analysis and conducting optimization (refer Figure 3). All L18 orthogonal array experiments were repeated thrice and the mean response values are considered for precise analysis (refer to Table 6). These experiments are conducted to determine the influence of individual factors on the performances (MRR, SR, and TWR).

Response Measurements

The amount of material removed in unit time from the workpiece and tool during machining refers to MRR and TWR. The digital weights balance records the weights of the workpiece and electrode material before and after machining and stopwatch measures the machining time (Tm) for each experimental run. After machining and prior to measurement of the final weight of electrode, work materials were immersed in an acetone solution to remove any unwanted materials. The MRR and TWR computation is done using Equations (1) and (2).
M R R = ( W b W a ) T m            = Workpiece   Wt .   before   machining   -   Workpiece   Wt .   after   machining T m   =   g m min
T W R = ( E b E a ) T m            = Electrode   Wt .   before   machining   -   Electrode   Wt .   after   machining T m = g m min
The machined surface texture (i.e., centerline surface roughness, Ra) of all L18 experimental trials were examined with Mitutoyo surface roughness tester (Model: Surftest SJ-301). For each experimental trial, SR on the machined surface were recorded at different locations and the mean of a total nine (3 replicates × 3 readings on each replicate) readings were used for analysis and optimization.

2.4. Taguchi Method

Taguchi L18 (21 × 37) orthogonal array was selected for EDM experiments and to perform statistical analysis. Taguchi-recommended signal-to-noise (S/N) ratio was used for performing analysis and conducting optimization. The signal corresponds to mean values and noise depicts the standard deviation for a response function. A higher S/N ratio corresponding to three levels of response is treated as an optimal condition for machining variables. The surface roughness of the machined part must be maintained at low values for proper functioning during their service life, whereas for industrial perspectives, in terms of economical machining, the maximum values of MRR and minimum TWR are highly desirable [47]. Therefore, the S/N ratio (ηij) of higher-the-better (HTB) response characteristics was employed for MRR and lower-the-better were used for SR and TWR.

2.5. Utility Concept

In this research, improving the surface finish of the machined parts was treated as product quality, whereas reducing the machining cost can be accomplished with lower TWR and higher MRR. To solve the said problem (determining a single optimal parameter setting for all outputs), the quality characteristics of conflicting requirements must be combined to form a composite index referred to as the utility concept [48]. In general, utility refers to the product or process usefulness with reference to the level of customer expectations by examining their performances based on several discrete objective functions. To improve rational decision-making, a composite index (i.e., utility) is obtained by combining the different evaluated or quality attributes. The sum of utilities of each attribute refers to the composite utility of the product. According to utility theory, Xi refers to attribute (i.e., output), term i and n represents the number of objectives, then composite utility function is expressed as follows [49,50,51].
U ( X 1 , X 2   , X n )   = f   ( U 1   ( X 1 ) , U 2   ( X 2   ) , , U n ( X n ) ) = i   =   1 n U i ( X i )
The term, Ui (Xi) be the utility of the ith attribute.
In utility theory, the multi-response S/N ratio is computed by employing the weight fractions to each S/N ratio of a response corresponding to each experimental run of the orthogonal array (refer to Table 6).
U ( X 1 , X 2   , X n )   = f   ( U 1   ( X 1 ) , U 2   ( X 2   ) , , U n ( X n ) ) = i   =   1 n W i U i ( X i )  
Term i = 1 n W i = 1 and W i are the weight fractions of output i. Note that, the sum of all weights assigned to each output is kept fixed to 1. The higher the utility function value, the better the quality characteristics of objective function requiring optimization [52].
The S/N ratio (ηij) computation for jth output of ith experimental runs (i = 1, 2, … m; j = 1, 2, … p) for LTB and HTB quality characteristics is shown in Equations (5) and (6), the S/N ratio for response corresponds to HTB quality characteristics is shown in Equation (5),
S / N MRR = η i   j = - 10   log ( 1 n i   =   1 n 1 ( y ij ) 2 )
The term n corresponds to a number of experiments, yij is the actual experimental value of response of ith trial. S/N ratio corresponds to LTB quality characteristics is computed according to Equation (6).
S / N SR   and   TWR = η i   j = - 10   log ( 1 n i   =   1 n ( y ij ) 2 )

2.6. Principal Component Analysis (PCA)

Principal component analysis (PCA) is a mathematical tool employed to correlate huge data in a more meaningful way by establishing a linear set of actual responses [53,54]. To determine the weight of each output, the PCA is used. PCA method provides information regarding the structure of variance-covariance by treating a linear set of individual response characteristics. Steps involved in determining weights viz. PCA is described below [55,56,57],
Step 1: PCA initiates with development of multi-response array composed of n quality characteristics corresponding to m experiments. The array of multiple quality characteristics is constructed as follows,
X i ( j ) = [ X 1 ( 1 ) X 1 ( 2 ) X 1 ( n ) X 2 ( 1 ) X 2 ( 2 ) X 2 ( n ) X m ( 1 ) X m ( 2 ) X m ( n ) ]  
For the present work, the term Xi (j) corresponds to the actual values of m experiments (i.e., m = 18) and n quality characteristics (i.e., n = 3).
Step 2: The computation of the correlation coefficient array is done by using Equation (8),
R j   l   =   ( Cov ( x i ( j ) ,   x i ( l ) ) σ ( x i ) ( j ) × σ ( x i ) ( l ) )          =   ( Covariance   sequences   of   x i ( j ) ,   x i ( l )   Product   of   standard   deviation   sequences   of   σ ( x i ) ( j )   and   σ ( x i ) ( l )   )  
Step 3: The defined correlation coefficient array was used to estimate the eigenvalues and eigenvectors using Equation (9).
  ( R - λ k I m ) V i   k   =   0
The term, λk depicts the Eigen values k = 1 n λ k k = n; k = 1, 2, 3, … n; Vi k = [bk1, bk2, …, bkm]T be the eigen vectors associated to Eigen value λk.
Step 4: Estimate the principal components (Omk) according to Equation (10),
  O m   k = i   =   1 n x m ( i ) V i   k  
The present work comprises three responses and Om1, Om2, and Om3 represent the first, second, and third principal components, respectively.

2.7. Criteria Importance through Criteria Inter-Correlation (CRITIC)

There are many solutions for multiple outputs with conflicting outputs (i.e., maximize: MRR; and minimize: TWR and SR) and assigning equal importance may lead to dissatisfaction among the customers and industrialists. This occurs because the industry personnel are more concerned about the economical machining (i.e., low TWR and high MRR) which may result in rough machined surface and therefore, customer dissatisfaction. The CRITIC method was thus applied to determine weights for the objective functions (i.e., response). The CRITIC method does not require human intervention for assessment involved in a process that could result in ease of decision making [58,59]. This method estimates the weight corresponding to contrast intensity and conflict assessment involved in the decision problem [60,61]. The steps followed to determine weights viz. CRITIC method is described below [58,59,60,61,62],
Step 1: Define the decision matrix (B) which includes the quality characteristics (n) of the experimental design with respect to m evaluation criteria. Term bi j depicts the output value of ith alternative corresponds to jth criteria.
B = [ b i   j ] m   ×   n = [ b 11 b 12 b 1 m b 21 b 22 b 2 m b n 1 b n 2 b nm ] ( i = 1 ,   2 , n ;   and   j   =   1 ,   2 , m )
Step 2: Normalize the defined decision matrix to create all criteria that vary in the ranges between 0 and 1. Normalization is essential to avoid numerical overflows between very large and small values of different quality characteristics. Normalization of the decision matrix is calculated using Equation (12). Term b i   j ¯ is the normalized response value of b i   j , b j worst ,   b j best represent the worst and the best value of response correspond to jth criterion.
b i   j ¯ = b i   j - b j worst b j best - b j worst
Step 3: The contrast intensity of the criterion is estimated using the calculated values of standard deviation (σj) of each vector bj (refer to Equation (13)). Terms: m represents the number of experiments and b j ¯ refers to the mean response values of the jth criterion.
σ j = i   =   1 m ( b i   j ¯ - b j ¯ ) 2 m  
Step 4: Develop the symmetric matrix (m × m) using r jk (i.e., linear correlation coefficient between the bj and bk vectors) (refer Equation (14)).
r jk = i   =   1 m ( b i   j ¯ - b j ¯ ) ( b i   k ¯ - b k ¯ ) i   =   1 m ( b i   j ¯ - b j ¯ ) 2 i   =   1 m ( b i   k ¯ - b k ¯ ) 2  
Step 5: The criterion information (Cj) is calculated by multiplicative formulae of Equations (13) and (14).
C j = σ j   k   =   1 m 1 - r j   k  
Step 6: Calculate the weights (i.e., criterion importance) of individual output viz. normalizing with the help of Cj as shown below (Equation (16)),
W j = C j j   =   1 n C j  

3. Results and Discussions

The results of the analysis of the collected experimental data were analyzed and optimized conditions determined for the EDM process are discussed in this section.

3.1. Taguchi Method and Analysis

The L18 experimental matrix was selected for four input variables, wherein two levels were considered for one factor (i.e., dielectric fluids) and three levels for the remaining factors (peak current, electrode materials, pulse on time) for modeling and analysis of EDM process. The average response values (MRR, SR, TWR) of three replicates for each experimental trial of L18 is recorded for precise analysis and detail the process insights (refer to Table 6).
For MRR, S/N ratio computation is done using Equation (5), whereas, for TWR and SR, the S/N ratio computation is done using Equation (6). Table 7 presents the S/N ratio values of MRR, SR, and TWR.

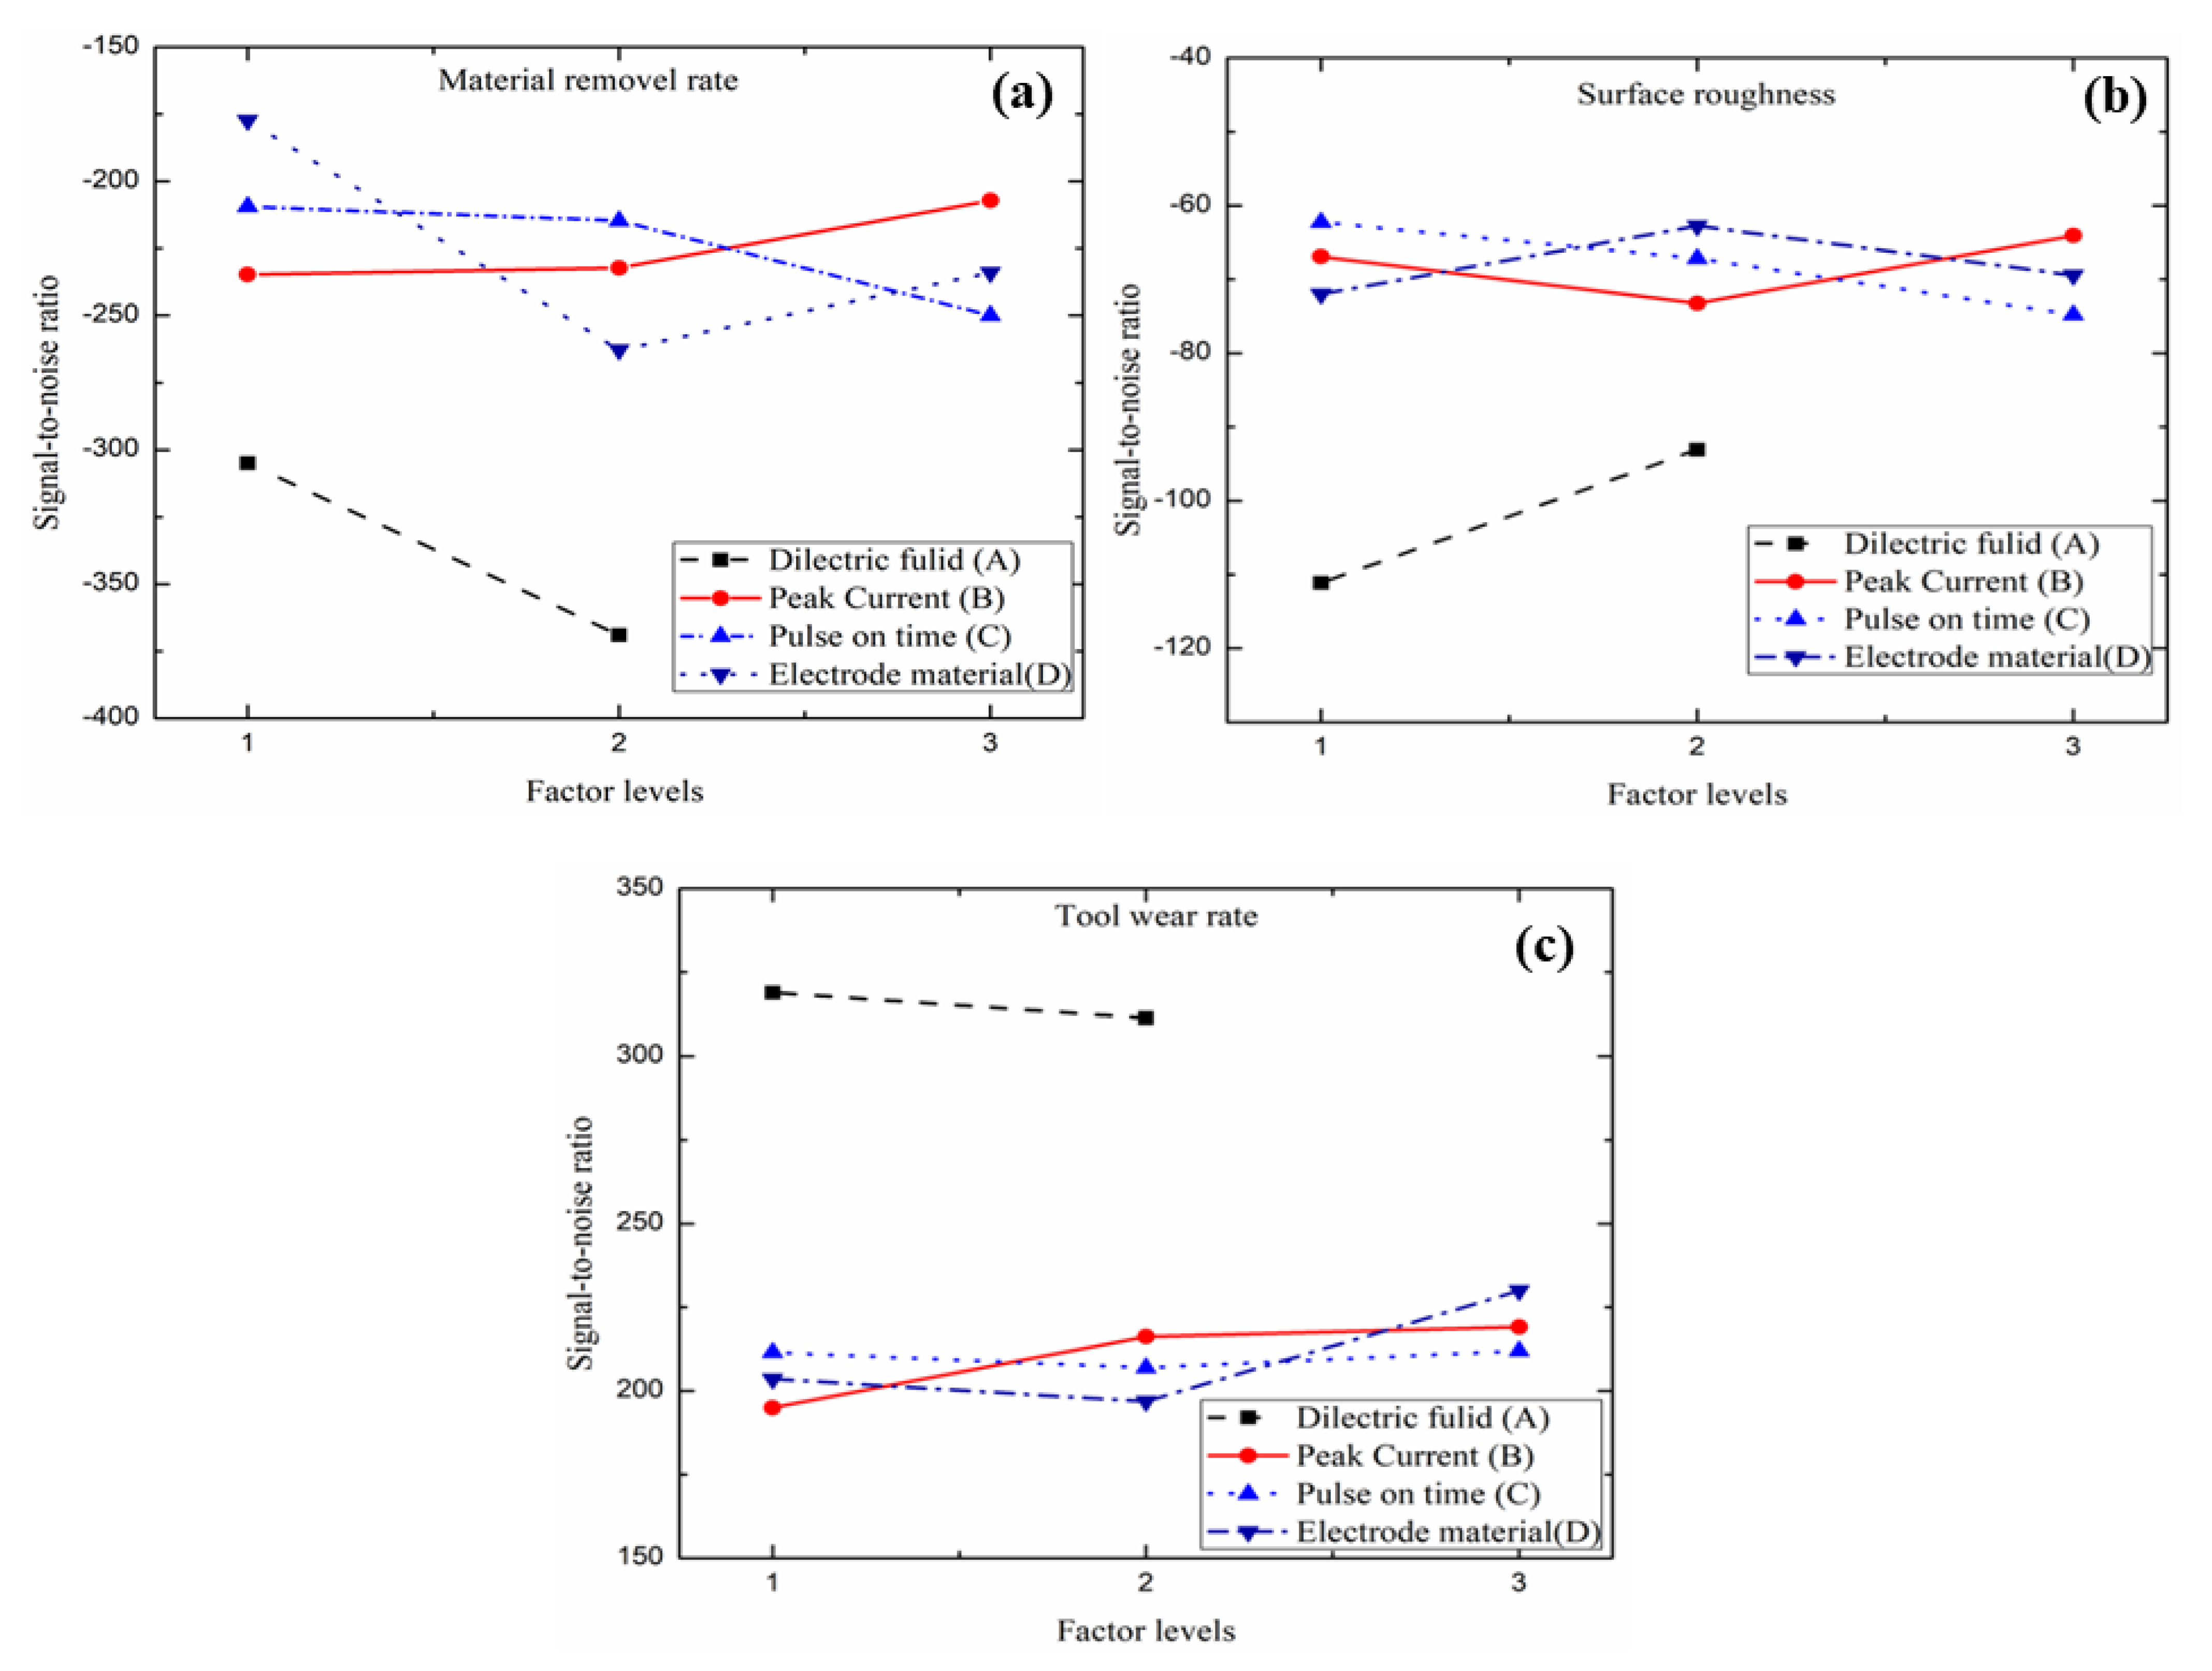
3.2. Analysis of EDM Process Variables on Different Responses

Pareto ANOVA was constructed based on the computed values of the S/N ratio of MRR, SR, and TWR. From the analysis, the percent contribution of each factor and optimal levels were determined separately for each output (refer to Table 8, Table 9 and Table 10).

3.2.1. Response: MRR

Pareto ANOVA presents the results in terms of sum at factor levels, percent contribution, and optimal levels corresponding to response (i.e., MRR) are presented in Table 8. The graphical representation (Figure 4a) shows that among the other electrode materials, graphite (electrode material: level 1) yields highest MRR. This is due the fact that graphite has greater thermal conductivity, density, and hardness values compared to brass and copper, and resulted in the highest spark during the EDM machining of HcHcr tool steel [63]. Peak current trends show negligible impact (i.e., 7.04% contribution) compared to the rest of the variables (see percent contribution in Table 8). MRR increases with peak current after crossing the mid-values of their respective levels shown in Figure 4a. This occurs due to high peak current producing the maximum amount of spark discharge energy coupled with higher impulse force in the spark gap, which tends to heat the workpiece, which causes melting and vaporization that results in high MRR. An increase in pulse-on-time proportionately increases the spark or thermal energy amount of heat transfer to the workpiece increases which causes the melting of material results in higher MRR. However, MRR decreases after crossing mid-values of pulse-on time (i.e., 75 µs) are due to the reduced energy density in electrical discharge spots instantaneously after the discharge time, as a result, the plasma channel expands continuously with pulse-on-time. Similarly, distilled water provides better MRR compared to the kerosene due to the issue of thermal conductivities of dielectric that may result in higher cooling rate and more surface cracks [64]. Note that electrode material (57.54%) followed by dielectric fluid (20.74%) and pulse-on-time (14.78%) resulted in the highest percent contribution towards MRR. A1B3C1D1 is the optimal factor levels for higher MRR. The determined optimal levels are not the set of L18 experimental matrix of Table 8 but might occur due to the multi-factor nature among the possible combination (34 = levels factors) of 81 experiments. Confirmation experiments for the results of the optimal level in high material removal rate were found equal to 0.0624 g/min.

3.2.2. Response: Surface Roughness

SR of the machined parts is of paramount importance, as it affects not only the aesthetic appearance but also their service life. The four process variables (i.e., electrode materials, peak current, pulse-on-time, and dielectric fluids) effects on the SR variations are presented in Figure 4b. Copper electrode produced a better surface finish than graphite and brass. Erosion of work material and wear occurring at the corners of graphite and brass material are observed after the mid-values of peak current and pulse-on-time. Therefore, the generated sparks are concentrated at the middle of the machined area which causes the arcing and short-circuiting. The arc sputtering of electrode materials by brass and graphite electrodes generates rough surface parts. Lower SR is the result of interaction effects of high peak current and low pulse on time. The intensity of spark energy increases with pulse-on-time, which results in large craters and recast layer formation on the machined surface tends to increase the SR. Kerosene produced a better surface finish than that of distilled water, possibly due to slow oxidation rate and fine surface morphology. Distilled water results in higher MRR with more cracks on the machined surfaces leading to higher values of SR. Peak current was found to have the least significant effect, whereas the highest contribution was found to be for dielectric fluid followed by electrode materials and pulse-on-time. The determined optimal levels for surface roughness are A2B3C1D2, which is not the combination of L18 experiments of Table 9. Confirmation experiments for the optimal levels result in desired low surface roughness values equal to 1.2 µm.

3.2.3. Response: Tool Wear Rate

The machined parts’ dimensional accuracy is reliant on the electrode TWR. The electrical erosion resistance of the tools is related to the properties of thermo-physical and mechanical characteristics. The combination of higher peak current and pulse-on-time under kerosene dielectric medium with copper as electrode tool material (i.e., A1B3C3D3) results in a low tool wear ratio (refer to Table 10 and Figure 4c). This occurs because at higher peak current and pulse-on-time both the copper and brass electrodes tend to increases (rate of heat energy increases for both the electrodes causes an increased rate of melting and evaporation) the MRR, and therefore tool wear rate also increases. It is also true that the higher the MRR, the greater the tool wear. Compared to distill water, kerosene resulted in lesser TWR. This is because the inherent properties of kerosene tend to decompose with an increase in temperature [65], thus generating carbon particles that act as a protective blanket to the tool. The significance of carbon particles adhered to the tool limit to rapid wear of a tool. However, distilled water does not generate carbon particles and hence no such protective carbon deposition appear on tool surface which results in less tool wear. Electrode materials showed a maximum contribution of 61.68%, followed by peak current of 34.86%, dielectric fluid of 1.92%, and pulse-on-time of 1.53% towards tool wear rate (refer to Table 10). For the determined optimal conditions, TWR resulted experimentally with the low values equal to 0.009 g/min.

3.3. Weight Determination for Each Response: PCA and CRITIC

To solve multi-objective optimization, assigning weights for each output is mandatory and determining weights through try-error method and experts’ suggestions results in vagueness [37,66]. Therefore, in actual practice, weights are determined by direct explication, also referring to prior weights and indirect explication (i.e., posterior weights) [67,68]. Direct explication implies the estimation of the weight based on the expert’s or engineer’s suggestion and surveys (results in uncertainty for decision-making process), where weights are estimated before the data collection of each alternative. The weights being determined based on the collected data is referred to as indirect explication. The present work uses the posterior methods in determining weights namely, PCA and CRITIC methods.

3.3.1. Principal Component Analysis:

The actual experimental values are used to determine weights by employing PCA. PCA uses actual experimental values to transform to a set of uncorrelated PCs and to select the particular PC (i.e., there are three principal components due to three responses that require optimal conditions for the present work), the eigenvalue must be greater than 1. PCA method possesses two major drawbacks, namely 1) universally acceptable methods are not derived yet to choose weights and getting the best solutions when the estimated eigenvalues > 1 for more than 1 PCs (output). The multi-performance index could not justify substituting the multi-response when the selected PC resulted with less variation (i.e., percent variation) compared to total explained variation. Table 11 shows the eigenvalues determined based on the correlation coefficient matrix of experimental output data. Note that the eigenvalues of the first principal components are greater than 1, and the second principal component (PC2) was found close to unity and the resulted explained variation of the corresponding principal components is less than 50% of the total explained variation (100%) (refer to Table 11). Since there are no standard procedures defined for the resulted eigenvalues greater than one for one response and close to unity for the other response (i.e., principal components) and less explained variations, authors followed the said literature [61,62,63,64,65,66]. Table 11 presents the eigenvectors calculated based on the eigenvalues. It is important to note that the explained variation corresponds to the highest eigenvalue (i.e., 1.15) of the first principal component (PC1) is 38.3%. The squares correspond to the eigenvector of PC1 (since the highest explained variation and eigenvalue compared to rest) represents the weight contribution of three quality characteristics (i.e., MRR, SR, TWR). The PCA-determined weight fraction for TWR, SR, and MRR is 0.1163, 0.4651 and 0.4173, respectively.

3.3.2. Criteria Importance through Criteria Inter-Correlation (CRITIC)

As an alternative to PCA, the CRITIC method also determines the weight fraction for each output. Considering all three responses, MRR is treated as beneficial criteria (towards achieving economical machining for reduced machining cost associated with industries) with high values. Conversely, SR and TWR are treated as non-beneficial criteria (achieving a target of aesthetic appearance and economical machining) with desired low values. Taguchi L18 experiments are treated as alternatives for decision-making (refer to Table 6). Table 12 shows the computed normalized output values using Equation (12), of all L18 experiments. Table 12 also presents the standard deviation values associated with each quality characteristic estimated using Equation (13). The correlation coefficient of each criterion is determined using Equation (14). Table 13 presents the correlation coefficient values associated with different responses. Table 13 values correspond to (m × m) matrix subtracted with one and the summation of different responses are presented in Table 13. The criterion information (Cj) values of each response are calculated using Equation (15). The weights of each output are determined using the Equation (16). Table 13 shows the criterion information and the corresponding weights of each output. The CRITIC method determined the weights for MRR, SR, and TWR, found to be 0.3470, 0.3067, and 0.3463, respectively (Table 13).

3.3.3. Utility Approach

The utility approach was utilized to determine the overall utility values (i.e., multiple outputs) in terms of determining the multi-objective S/N ratio (η) using Equation (17).
η = η 1 w 1 + η 2 w 2 + η 3 w 3  
Terms η 1 w 1 ,   η 2 w 2 ,   η 3 w 3   are the S/N ratio of objectives and associated weight fractions of MRR, SR, and TWR. The weight fractions determined by PCA and CRITIC methods are presented in Table 14.
Table 15 presents the values of S/N ratio of multiple responses calculated based on Equation (17). In the present work, PCA and CRITIC methods determine the weights and therefore two multiple S/N ratios (i.e., overall utility values according to Equation (17)) are determined (refer to Table 15).

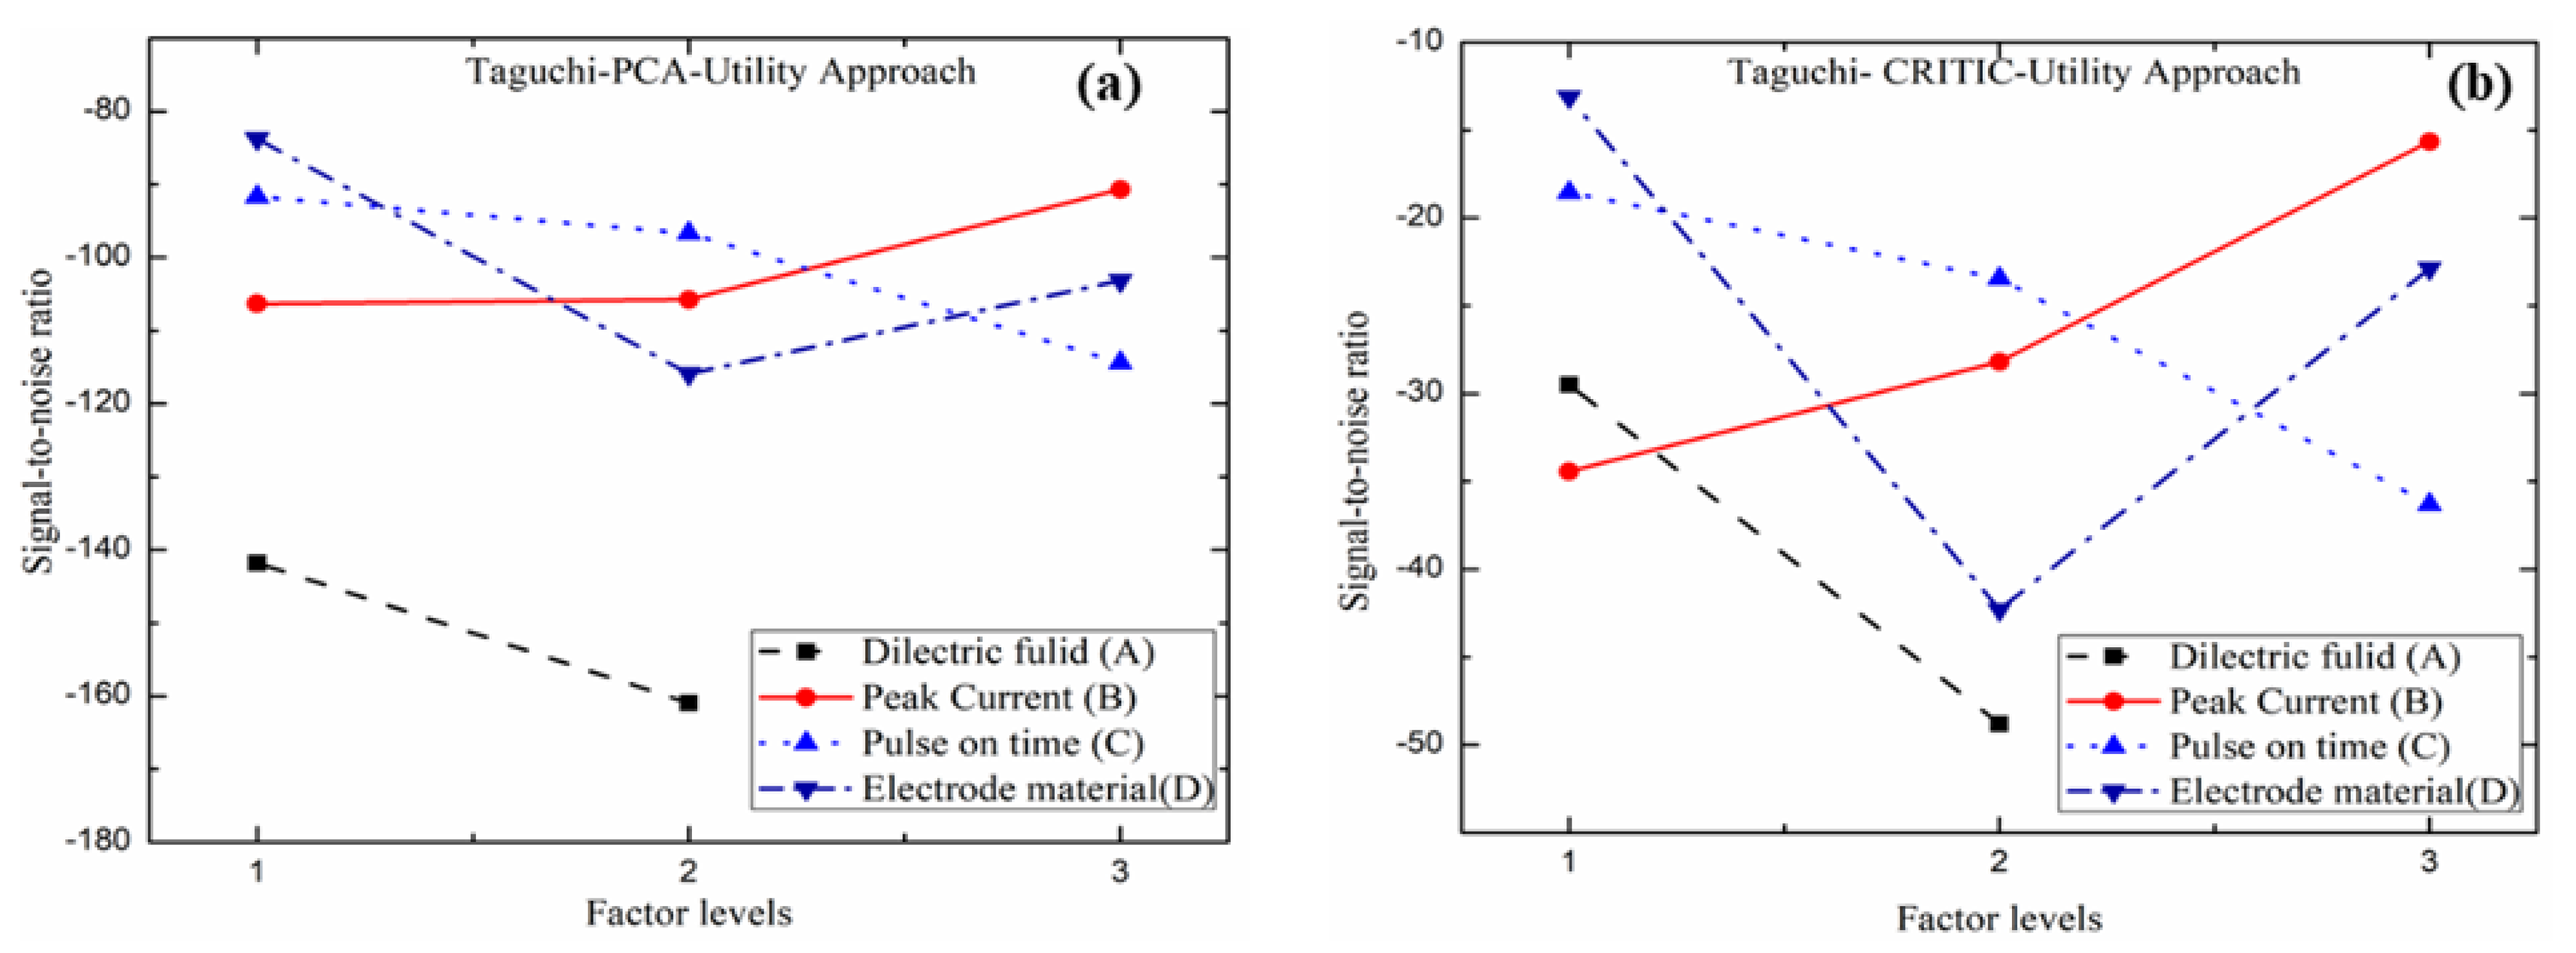
3.3.4. Multi-Objective Optimization Taguchi-PCA-Utility and Taguchi-CRITIC-Utility Approach

Two hybrid methods (Taguchi-PCA-Utility Approach and Taguchi-CRITIC-Utility Approach) were used to analyze the factor influence and determine optimal levels viz. Pareto analysis of variance. It is interesting to note that although the weights of each response determined by PCA and CRITIC were found to be different, the optimal levels determined by both methods are found to be identical as A1B3C1D1 (refer Figure 5a, Table 16 and Table 17). The difference in weightage determined for each response by two methods could result in different percent contribution of input variables towards multi-response S/N ratio. Eigenvalues of two principal components resulting from their value greater than 1 for PC1 and close to unity for PC2 and explained variation of those principal components being less than 50% are the two major drawbacks observed in the present work with PCA. Hence, for further analysis and determine optimal conditions the Taguchi-CRITIC-Utility approach is used. The optimal levels of a factor towards all outputs (multi-response S/N ratio) are found equal to A1B3C1D1 (refer Figure 5b). The percent contribution of each factor determined through Pareto ANOVA is found equal to 48.11% for electrode material, 19.96% for peak current, 18.35% for pulse-on-time, and 13.59% for dielectric fluids, respectively.

3.4. Confirmation Experiments

The optimal conditions determined viz. hybrid Taguchi-CRITIC-Utility approach and Taguchi-PCA-Utility approach are validated by conducting practical experiments. Table 18 shows the average output values correspond to three replicates of optimal conditions. Note that the values of multiple S/N ratios obtained for an optimal condition resulted better than L18 experiments. This signifies both the hybrid methods are equally capable of providing better results in responses (i.e., high MRR, low values of SR and TWR). Due to the drawbacks of PCA, the Taguchi-CRITIC-Utility approach analysis and optimal levels are considered. The signal-to-noise ratio corresponds to optimal conditions for multiple responses are 3.60 dB for Taguchi-CRITIC-Utility, and −7.63 dB for Taguchi-PCA-Utility, which are comparatively higher than the multi-response S/N ratio values presented in Table 18. Therefore, the Taguchi-CRITIC-Utility approach is considered the best optimization tool for multi-response optimization.
The Taguchi method determined separate optimal conditions (A1B3C1D1 for MRR; A2B3C1D2 for SR; A1B3C3D3 for TWR) for individual responses resulted with an MRR of 0.0624 g/min, SR of 1.24 µm, and TWR of 0.009 g/min. Although the Taguchi method determined optimal condition for single output, it may not produce better performance on other performances or output of a product [14,33,37,48]. This is because of differences in nature of influence of factor effects on multiple outputs [6,14]. However, compared to the Taguchi method, the hybrid optimization methods (Taguchi-PCA-Utility and Taguchi-CRITIC-Utility) determined single optimal conditions resulted with higher MRR, with the compromising solutions of SR and TWR (refer Table 18). Machining industries are more interested in optimizing the multiple outputs simultaneously, as higher MRR and low TWR reduce production time and cost, whereas lower SR could reduce the dependency of secondary finishing process [69].
Additionally, SEM analysis was performed to validate the optimal conditions (Table 18; A1B3C1D1: dielectric fluid: distilled water, peak current: 9 A, pulse-on-time: 50 µs, and electrode material: graphite) of CRITIC and PCA-utility method with worse conditions (refer Exp. No. 18 of Table 6; A2B3C3D2: dielectric fluid: kerosene, peak current: 9 A, pulse-on-time: 100 µs, and electrode material: copper) in terms of surface integrity on the machined surface. The worst condition was decided based on the lowest values obtained for multiple S/N ratios of Table 15 (refer Exp. No. 18). Both worst and optimal conditions SEM images are shown in Figure 6a,b.
From the SEM images in Figure 6, it was observed that the worst-case condition (Figure 6a) has many imperfections such as dark hard impression, more waviness surface, white layer with a higher thickness and deep micro-cracks, etc. The generation of higher white layer and deeper micro-cracks are mainly due to the use of higher pulse on time and peak current in EDM. Similarly, the presence of some dark spots and waviness of the surface is due to the use of hydrocarbon kerosene with a higher level of peak current and pulse on time [70]. Comparing Figure 6a (worst condition) to Figure 6b (optimal condition), white layer formation was observed a bit lower with less waviness of surface [68,70]. Similarly, very lesser micro-cracks and a hard impression due to use of lesser pulse on time and use of distilled water were observed. It is concluded that kerosene generates greater composition of carbon particles and thus deposits on the machined surface with relatively higher crack, whereas distilled water results in better surface finish and higher MRR [66]. Since Figure 6b shows a smaller number of damages and found to be smooth and uniform surface in EDM which justifies the optimal setting obtained through the CRITIC and PCA-utility method.

4. Conclusion

EDM machining of HcHcr steel under different electrodes and dielectric fluids is carried out in the present work. Taguchi L18 experiments are conducted to perform experiments, analysis, and optimization. The following conclusions are drawn:
  • The electrode material is found the most dominating factor for higher MRR, lower SR and TWR compare to the other parameters.
  • Higher MRR, lower SR and TWR are attained by graphite electrode in presence of distilled water as dielectric fluid compared to brass and copper.
  • The optimal setting obtained by both hybrid methods is the same at A1B3C1D1, (i.e., A1: DW; B3: 9 A, C1: 50 µs; D1: graphite). This signifies that both the hybrid methods are equally capable to provide better results in responses (i.e., high MRR of 0.0632 gm/min, low values of SR of 1.68 µm and TWR of 0.012 gm/min).
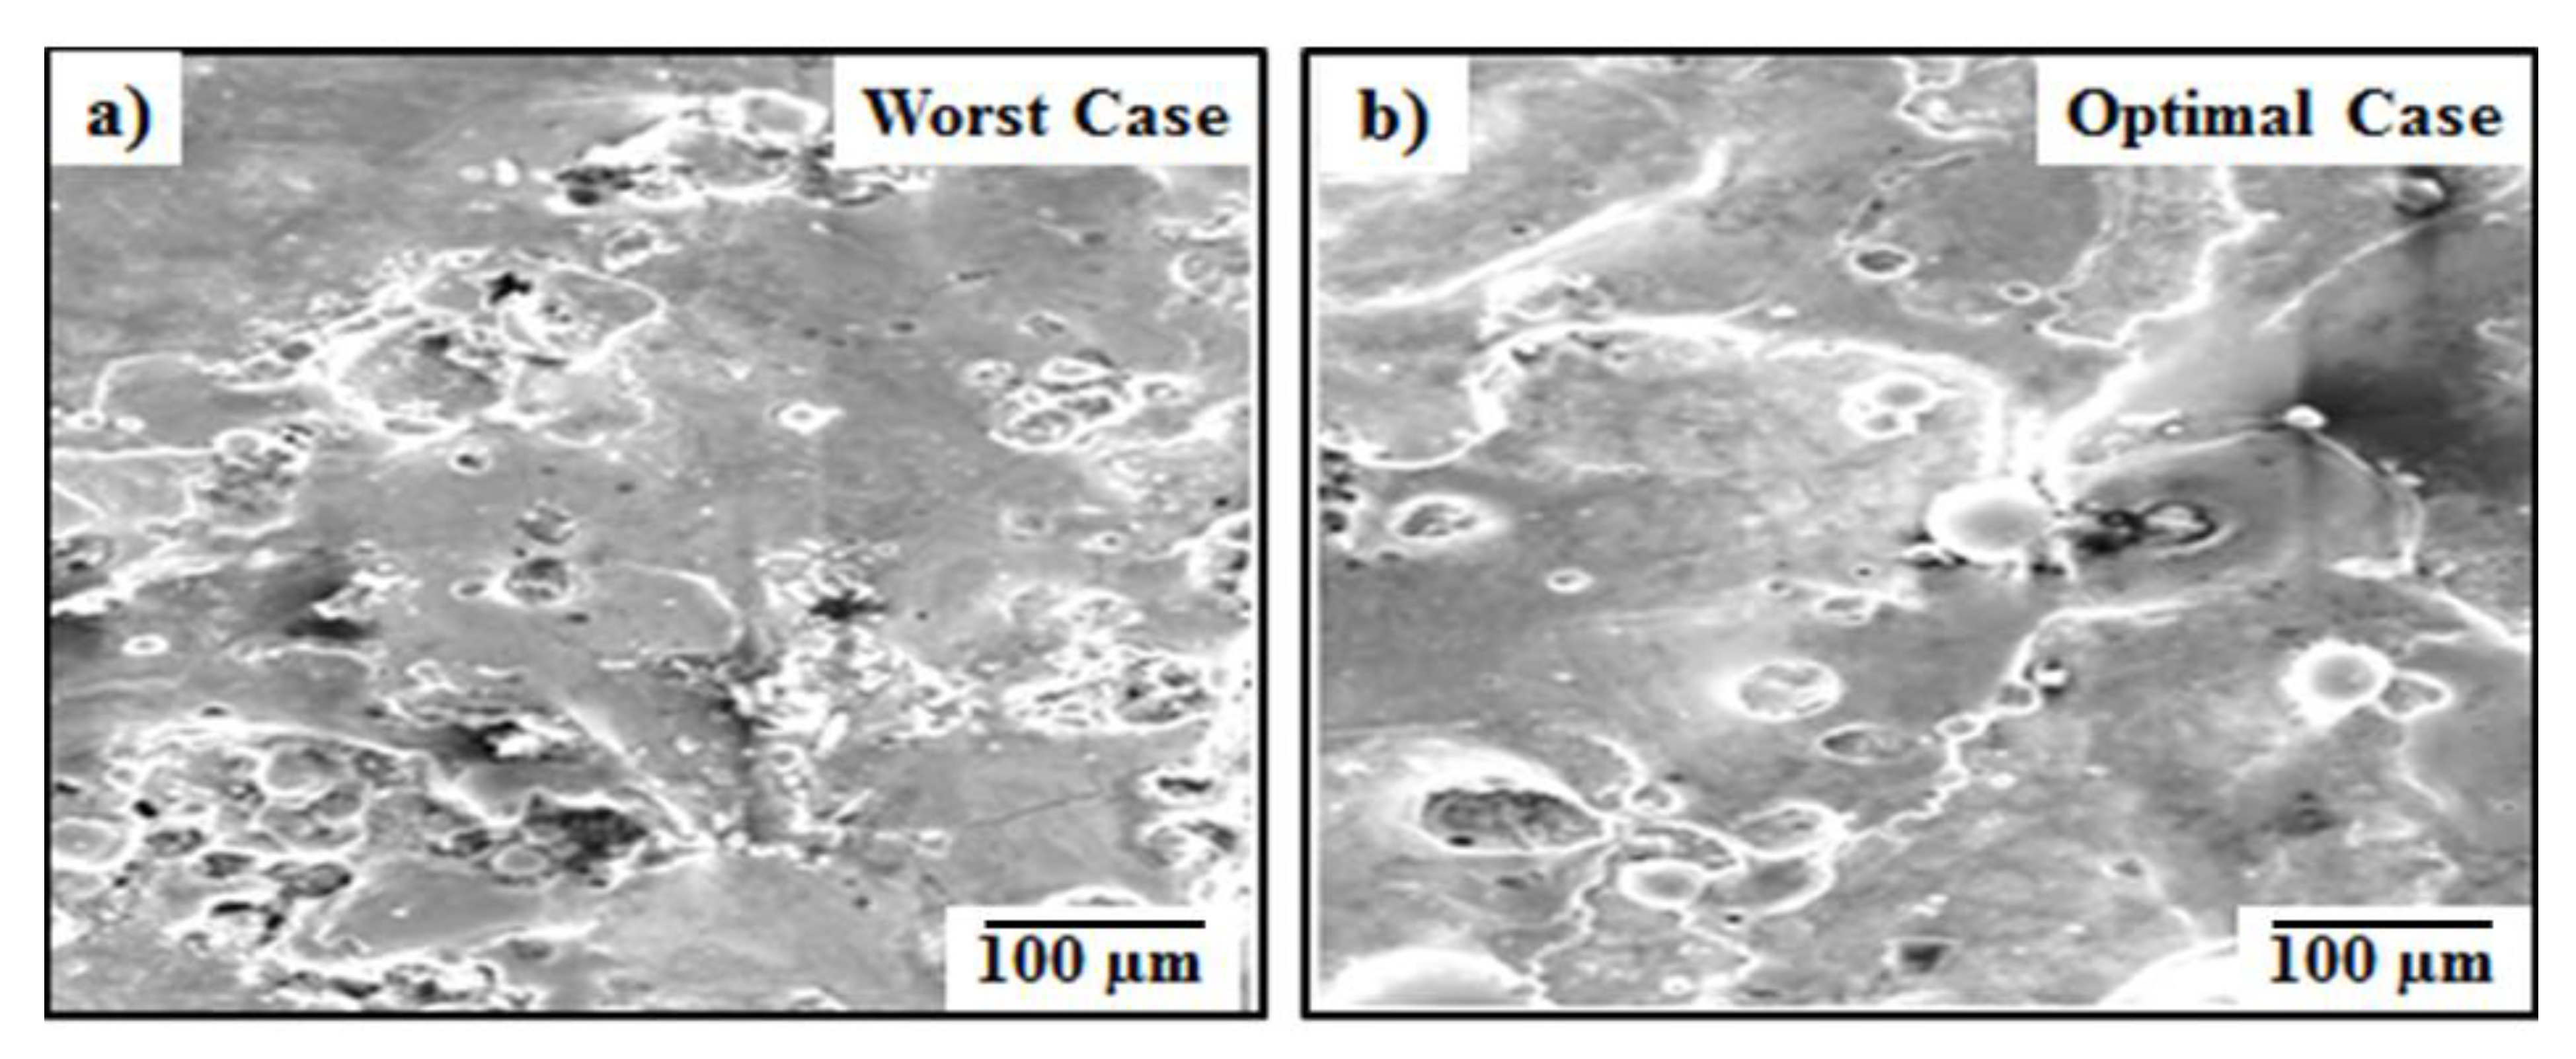
  • Micrographic analysis of the optimal conditions shows better surface and uniform distribution of surface compared to the worst conditions.
  • Interesting observation related to the weight calculation by PCA method. PCA possesses major drawbacks such as eigenvalues correspond to two PC are greater than 1 for PC1 and close to unity for PC2, and the explained variation of the first PC is less than 50%. Note that there is no universal rule defined yet to determine the weights for the said drawbacks of PCA. However, the CRITIC method determined the weights of each response are found equal to 0.3470 for MRR, 0.3067 for SR, and 0.3463 for TWR. Hence, the Taguchi-CRITIC-Utility approach is treated as the best model to optimize the multi-responses.
Hence, for better machinability of HcHcr steel, a graphite electrode with distilled water fluid medium is suggested. Furthermore, PCA possesses major drawbacks in the calculation of weights of the parameters. Therefore, hybrid methods i.e., Taguchi-CRITIC-Utility approach methods, can be employed for multi-response optimization of another machining process.

Author Contributions

Conceptualization, M.P.G.C. and J.; methodology, M.P.G.C., D.Y.P., and K.G.; software, M.P.G.C.; validation, S.K. and J.; formal analysis, M.P.G.C., J., D.Y.P., and K.G.; investigation, S.K.; resources, M.P.G.C. and S.K.; writing—original draft preparation, M.P.G.C. and J.; writing—review and editing M.P.G.C., S.K., J., D.Y.P., and K.G. All authors have read and agreed to the published version of the manuscript.

Funding

This research received no external funding.

Data Availability Statement

Data can be made available upon request.

Conflicts of Interest

There is no conflict of interest in publishing this article.

References

  1. Tripathy, S.; Tripathy, D.K. Surface Characterization and Multi-response optimization of EDM process parameters using powder mixed dielectric. Mater. Today Proc. 2017, 4, 2058–2067. [Google Scholar] [CrossRef]
  2. Konig, W.; Rummenholler, S. Technological and industrial safety aspects in milling FRP. ASME Mach. Adv. Comp. 1993, 45, 1–14. [Google Scholar]
  3. Sivapirakasam, S.P.; Mathew, J.; Suryanarayana, M. Multiattribute decision making for green electrical discharge machining. Expert Syst. Appl. 2011, 38, 8370–8374. [Google Scholar] [CrossRef]
  4. Weller, E.J. Non-Traditional Machining Process; Society of Manufacturing Engineers: Dearbom, MI, USA, 1984; pp. 15–71. [Google Scholar]
  5. Dubey, A.K.; Yadava, V. Laser beam machining—A review. Int. J. Mach. Tool Manu. 2008, 48, 609–628. [Google Scholar] [CrossRef]
  6. Gupta, V.; Pandey, P.M.; Garg, M.P.; Khanna, R.; Batra, N.K. Minimization of kerf taper angle and kerf width using Taguchi’s method in abrasive water jet machining of marble. Proc. Mat. Sci. 2014, 6, 140–149. [Google Scholar] [CrossRef] [Green Version]
  7. Bhowmik, S.; Gupta, K.J. Modeling and optimization of abrasive water jet machining process. In Modeling and Optimization of Advanced Manufacturing Processes; Springer Briefs in Applied Sciences and Technology; Springer: Hoboken, NJ, USA, 2019. [Google Scholar]
  8. Gupta, K.J. Introduction to abrasive water jet machining. In Abrasive Water Jet Machining of Engineering Materials; Springer Briefs in Applied Sciences and Technology; Springer: Hoboken, NJ, USA, 2020. [Google Scholar]
  9. Singh, R.; Khamba, J.S. Mathematical modeling of tool wear rate in ultrasonic machining of titanium. Int. J. Adv. Manuf. Tech. 2009, 43, 573–580. [Google Scholar] [CrossRef]
  10. Wang, G.Q.; Li, H.S.; Qu, N.S.; Zhu, D. Investigation of the hole-formation process during double-sided through-mask electrochemical machining. J. Mater. Process. Tech. 2016, 234, 95–101. [Google Scholar] [CrossRef]
  11. Sabyrov, N.; Jahan, M.P.; Bilal, A.; Perveen, A. Ultrasonic vibration assisted electro-discharge machining (edm)—An overview. Materials 2019, 12, 522. [Google Scholar] [CrossRef] [Green Version]
  12. Pramanik, A.; Islam, M.N.; Basak, A.K.; Dong, Y.; Littlefair, G.; Prakash, C. Optimizing dimensional accuracy of titanium alloy features produced by wire electrical discharge machining. Mater. Manuf. Process. 2019, 34, 1083–1090. [Google Scholar] [CrossRef]
  13. Tan, T.H.; Yan, J. Atomic-scale characterization of subsurface damage and structural changes of single-crystal silicon carbide subjected to electrical discharge machining. Acta Mater. 2017, 123, 362–372. [Google Scholar] [CrossRef]
  14. Priyadarshini, M.; Pal, K. Grey-Taguchi based optimization of EDM process for titanium alloy. Mater. Today Proc. 2015, 2, 2472–2481. [Google Scholar] [CrossRef]
  15. Bhattacharya, A.; Batish, A.; Kumar, N. Surface characterization and material migration during surface modification of die steels with silicon, graphite and tungsten powder in EDM process. J. Mater. Sci. Technol. 2013, 27, 133–140. [Google Scholar] [CrossRef]
  16. Abbas, N.M.; Solomon, D.G.; Bahari, M.F. A review on current research trends in electrical discharge machining. Int. J. Mach. Tool Manu. 2007, 47, 1214–1228. [Google Scholar] [CrossRef]
  17. Beri, N.; Mahajan, A. Performance evaluation of powder metallurgy electrode in electrical discharge machining of AISI D2 steel using Taguchi method. Int. J. Mech. Mechatron. Eng. 2008, 2, 167–171. [Google Scholar]
  18. Lajis, M.A.; Radzi, H.C.D.M.; Amin, A.K.M.N. The implementation of Taguchi method on EDM process of tungsten carbide. Eur. J. Sci. Res. 2009, 26, 609–617. [Google Scholar]
  19. Kumar, V.; Beri, N.; Kumar, A.; Singh, P. Some studies on Electric discharge machining of Hastalloy using powder metallurgy electrode. Int. J. Adv. Eng. Tech. 2010, 1, 16–27. [Google Scholar]
  20. Beri, N.; Kumar, A.; Maheshwari, S.; Sharma, C. Optimisation of electrical discharge machining process with CuW powder metallurgy electrode using grey relation theory. Int. J. Mach. Mach. Mater. 2011, 9, 103–115. [Google Scholar] [CrossRef]
  21. Patel, V.D.; Patel, C.P.; Patel, U.J. Analysis of different tool material on MRR and Surface roughness of mild steel in EDM. Int. J. Eng. Res. Appl. 2011, 1, 394–397. [Google Scholar]
  22. Ghewade, D.V.; Nipanikar, S.R. Experimental study of Electro discharge machining for Inconel Material. Int. J. Adv. Eng. Tech. 2011, 2, 107–112. [Google Scholar]
  23. Leão, F.N.; Pashby, I.R. A review on the use of environmentally friendly dielectric fluids in electrical discharge machining. J. Mater. Process. Tech. 2004, 149, 341–346. [Google Scholar] [CrossRef]
  24. Zhang, Y.; Liu, Y.; Ji, R.; Cai, B. Study of the recast layer of a surface machined by sinking electrical discharge machining using water-in-oil emulsion as dielectric. Appl. Surf. Sci. 2011, 257, 5989–5997. [Google Scholar] [CrossRef]
  25. Chakraborty, S.; Dey, V.; Ghosh, S. A reviews on the use of dielectric fluids and their effects in electrical discharge machining characteristics. Precis. Eng. 2015, 40, 1–6. [Google Scholar] [CrossRef]
  26. Liew, P.J.; Yan, J.; Masaki, T. Effect of different dielectric fluids on micro EDM of low conductivity ceramic material RB-SiC. Adv. Mater. Res. 2012, 565, 529–534. [Google Scholar] [CrossRef]
  27. Wang, X.; Liu, Z.; Xue, R.; Tian, Z.; Huang, Y. Research on the influence of dielectric characteristics on the EDM of titanium alloy. Int. J. Adv. Manuf. Tech. 2014, 72, 979–987. [Google Scholar] [CrossRef]
  28. Chen, S.; Yan, B.; Huang, F. Influence of kerosene and distilled water as dielectrics on the electric discharge machining characteristics of Ti-6A1-4V. J. Mater. Process. Tech. 1999, 87, 107–111. [Google Scholar] [CrossRef]
  29. Bai, C.Y.; Koo, C.H. Effects of kerosene or distilled water as dielectric on electrical discharge alloying of super alloy Haynes 230 with Al-Mo composite electrode. Surf. Coat. Tech. 2006, 200, 4127–4135. [Google Scholar] [CrossRef]
  30. Tao, J.; Shih, A.J.; Ni, J. Experimental study of the dry and near-dry electrical discharge milling processes. J. Manuf. Sci. Eng. 2008, 130, 011002. [Google Scholar] [CrossRef] [Green Version]
  31. Jeanvoine, N.; Holzapfel, C.; Soldera, F.; Muecklich, F. Microstructure characterisation of electrical discharge craters using FIB/SEM dual beam techniques. Adv. Eng. Mater. 2008, 10, 973–977. [Google Scholar] [CrossRef]
  32. Prakash, C.; Singh, S.; Pruncu, C.I.; Mishra, V.; Królczyk, G.; Pimenov, D.Y.; Pramanik, A. Surface modification of Ti-6Al-4V alloy by electrical discharge coating process using partially sintered Ti-Nb electrode. Materials 2019, 12, 1006. [Google Scholar] [CrossRef] [Green Version]
  33. Rathi, P.; Ghiya, R.; Shah, H.; Srivastava, P.; Patel, S.; Chaudhari, R.; Vora, J. Multi-response optimization of Ni55. 8Ti shape memory alloy using Taguchi-Grey relational analysis approach. In Lecture Notes in Intelligent Transportation and Infrastructure; Recent Advances in Mechanical Infrastructure; Parwani, A., Ramkumar, P., Eds.; Springer: Singapore, 2020; pp. 13–23. [Google Scholar]
  34. Sahu, A.K.; Mahapatra, S.S. Optimization of surface roughness parameters by different multi-response optimization techniques during electro-discharge machining of titanium alloy. In Non-Conventional Machining in Modern Manufacturing Systems; Kumar, K., Kumari, N., Davim, J., Eds.; IGI Global: Hershey, PA, USA, 2019; pp. 82–108. [Google Scholar]
  35. Babu, K.N.; Karthikeyan, R.; Punitha, A. An integrated ANN–PSO approach to optimize the material removal rate and surface roughness of wire cut EDM on INCONEL 750. Mater. Today Proc. 2019, 19, 501–505. [Google Scholar] [CrossRef]
  36. Das, D.; Pratihar, D.K.; Roy, G.G.; Pal, A.R. Phenomenological model-based study on electron beam welding process, and input-output modeling using neural networks trained by back-propagation algorithm, genetic algorithms, particle swarm optimization algorithm and bat algorithm. Appl. Intell. 2018, 48, 2698–2718. [Google Scholar] [CrossRef]
  37. Liao, H.C.; Chen, Y.K. Optimizing multi-response problem in the Taguchi method by DEA based ranking method. Int. J. Qual. Reliab. Manag. 2002, 19, 825–837. [Google Scholar] [CrossRef]
  38. Kumar, S.; Grover, S.; Walia, R.S. Effect of hybrid wire EDM conditions on generation of residual stresses in machining of HCHCr D2 tool steel under ultrasonic vibration. Int. J. Interact. Des. Manuf. 2018, 12, 1119–1137. [Google Scholar] [CrossRef]
  39. Jeswani, M.L. Electrical discharge machining in distilled water. Wear 1981, 72, 81–88. [Google Scholar] [CrossRef]
  40. Kumari, S.; Datta, S.; Masanta, M. Electro-Discharge Machining of Inconel 825 Super alloy: Effects of Tool Material and Dielectric Flushing. Silicon 2018, 10, 2079–2099. [Google Scholar] [CrossRef]
  41. Valaki, J.B.; Rathod, P.P. Assessment of operational feasibility of waste vegetable oil based bio-dielectric fluid for sustainable electric discharge machining (EDM). Int. J. Adv. Manuf. Tech. 2016, 87, 1509–1518. [Google Scholar] [CrossRef]
  42. Shabgard, M.R.; Najafabadi, A.F. The influence of dielectric media on nano-structured tungsten carbide (WC) powder synthesized by electro-discharge process. Adv. Powder Technol. 2014, 25, 937–945. [Google Scholar] [CrossRef]
  43. Khan, A.A. Electrode wear and material removal rate during EDM of aluminum and mild steel using copper and brass electrodes. Int. J. Adv. Manuf. Tech. 2008, 39, 482–487. [Google Scholar] [CrossRef]
  44. Khan, M.A.R.; Rahman, M.M.; Kadirgama, K. An experimental investigation on surface finish in die-sinking EDM of Ti-5Al-2.5Sn. Int. J. Adv. Manuf. Tech. 2015, 77, 1727–1740. [Google Scholar] [CrossRef]
  45. Choudhary, R.; Kumar, H.; Garg, R.K. Analysis and evaluation of heat affected zones in electric discharge machining of EN-31 die steel. Indian J. Eng. Mater. Sci. 2010, 17, 91–98. [Google Scholar]
  46. George, J.; Chandan, R.; Manu, R. Experimental Investigation of Silicon Powder Mixed EDM Using Graphene and CNT Nano Particle Coated Electrodes. Silicon 2020, 1–17. [Google Scholar] [CrossRef]
  47. Phan, N.H.; Muthuramalingam, T. Multi Criteria Decision Making of Vibration Assisted EDM Process Parameters on Machining Silicon Steel Using Taguchi-DEAR Methodology. Silicon 2020, 1–7. [Google Scholar] [CrossRef]
  48. Yuan, J.; Wang, K.; Yu, T.; Fang, M. Integrating relevance vector machines and genetic algorithms for optimization of seed-separating process. Eng. Appl. Artif. Intel. 2007, 20, 970–979. [Google Scholar] [CrossRef]
  49. Kumar, P.; Barua, P.B.; Gaindhar, J.L. Quality optimization (multi-characteristics) through Taguchi’s technique and utility concept. Qual. Reliab. Eng. Int. 2000, 16, 475–485. [Google Scholar] [CrossRef]
  50. Gaitonde, V.N.; Karnik, S.R.; Davim, J.P. Taguchi multiple-performance characteristics optimization in drilling of medium density fibreboard (MDF) to minimize delamination using utility concept. J. Mater. Process. Tech. 2008, 196, 73–78. [Google Scholar] [CrossRef]
  51. Gaitonde, V.N.; Karnik, S.R.; Davim, J.P. Multiperformance optimization in turning of free-machining steel using Taguchi method and utility concept. J. Mater. Eng. Perform. 2009, 18, 231–236. [Google Scholar] [CrossRef]
  52. Gaikwad, V.S.; Jatti, V.S.; Pawar, P.J.; Nandurkar, K.N. Multi-objective Optimization of Electrical Discharge Machining Process During Machining of NiTi Alloy Using Taguchi and Utility Concept. In Techno-Societal; Pawar, P., Ronge, B., Balasubramaniam, R., Vibhute, A., Apte, S., Eds.; Springer: Berlin/Heidelberg, Germany, 2020; pp. 479–489. [Google Scholar]
  53. Pearson, K. On lines and planes of closest fit to systems of points in space. Lond. Edinb. Dublin Philos. Mag. J. Sci. 1901, 62, 559–572. [Google Scholar] [CrossRef] [Green Version]
  54. Hotelling, H. Analysis of a complex of statistical variables into principal components. J. Educ. Psychol. 1993, 24, 417–441. [Google Scholar] [CrossRef]
  55. Chate, G.R.; Patel, G.C.M.; Kulkarni, R.M.; Vernekar, P.; Deshpande, A.S.; Parappagoudar, M.B. Study of the effect of nano-silica particles on resin-bonded moulding sand properties and quality of casting. Silicon 2018, 10, 1921–1936. [Google Scholar] [CrossRef]
  56. Nayak, C.V.; Patel, G.C.M.; Ramesh, M.R.; Desai, V.; Samanta, S.K. Analysis and optimization of metal injection moulding process. In Materials Forming, Machining and Post Processing. Materials Forming, Machining and Tribology; Gupta, K., Ed.; Springer: Berlin/Heidelberg, Germany, 2020; pp. 41–74. [Google Scholar]
  57. Patel, G.C.M.; Kumar, R.S.J.; Naidu, N.S. Optimization of abrasive water jet machining for green composites using multi-variant hybrid techniques. In Optimization of Manufacturing Processes. Springer Series in Advanced Manufacturing; Gupta, K., Gupta, M., Eds.; Springer: Berlin/Heidelberg, Germany, 2020; pp. 129–162. [Google Scholar]
  58. Kumari, M.; Kulkarni, M.S. Single-measure and multi-measure approach of predictive manufacturing control: A comparative study. Comput. Ind. Eng. 2019, 127, 182–195. [Google Scholar] [CrossRef]
  59. Adalı, E.A.; Işık, A.T. CRITIC and MAUT methods for the contract manufacturer selection problem. Europ. J. Multidiscip. Stud. 2017, 2, 93–101. [Google Scholar] [CrossRef] [Green Version]
  60. Diakoulaki, D.; Mavrotas, G.; Papayannakis, L. Determining objective weights in multiple criteria problems: The critic method. Comput. Oper. Res. 1995, 22, 763–770. [Google Scholar] [CrossRef]
  61. Slebi-Acevedo, C.J.; Pascual-Muñoz, P.; Lastra-González, P.; Castro-Fresno, D. Multi-Response Optimization of porous asphalt mixtures reinforced with aramid and polyolefin fibers employing the CRITIC-TOPSIS based on Taguchi methodology. Materials 2019, 12, 3789. [Google Scholar] [CrossRef] [Green Version]
  62. Slebi-Acevedo, C.J.; Silva-Rojas, I.M.; Lastra-González, P.; Pascual-Muñoz, P.; Castro-Fresno, D. Multiple-response optimization of open graded friction course reinforced with fibers through CRITIC-WASPAS based on Taguchi methodology. Constr. Build. Mater. 2020, 233, 117274. [Google Scholar] [CrossRef]
  63. Ali, M.M.; Laily, S.; Manshoor, B.; Syahrian, N.; Izamshah, R.; Hadzley, M.; Muhamad, M. Performance of copper, copper tungsten, graphite and brass electrode on MRR, EWR and SR of aluminium LM6 in EDM die sinking. J. Adv. Res. Appl. Mech. 2015, 6, 30–36. [Google Scholar]
  64. Ranganath, B.J. Electric Discharge Machining. In Thermal Metal Cutting Processes; International Publishing House Pvt. Ltd.: New Delhi, India, 2008; pp. 7–18. [Google Scholar]
  65. Khanra, A.K.; Pathak, L.C.; Godkhindi, M.M. Microanalysis of debris formed during electrical discharge machining (EDM). J. Mat. Sci. 2007, 42, 872–877. [Google Scholar] [CrossRef]
  66. Su, C.T.; Tong, L.I. Multi-response robust design by principal component analysis. Total Qual. Manag. 1997, 8, 409–416. [Google Scholar] [CrossRef]
  67. Kao, C. Weight determination for consistently ranking alternatives in multiple criteria decision analysis. Appl. Math. Model. 2010, 34, 1779–1787. [Google Scholar] [CrossRef]
  68. Jagadish, R.A. Optimization of process parameters of green electrical discharge machining using principal component analysis (PCA). Int. J. Adv. Manuf. Technol. 2016, 87, 1299–1311. [Google Scholar] [CrossRef]
  69. Venkata, R.R.; Kalyankar, V.D. Parameter optimization of machining processes using a new optimization algorithm. Mater. Manuf. Process. 2012, 27, 978–985. [Google Scholar] [CrossRef]
  70. Sanjeev, K.; Rupinder, S.; Singh, T.P.; Sethi, B.L. Surface modification by electrical discharge machining: A review. J. Mater. Process. Technol. 2009, 209, 3675–3687. [Google Scholar]
Figure 1. Framework of proposed research work.
Metals 11 00419 g001
Figure 2. (a) Electrical discharge machining (EDM) experimental setup; (b) tools for experimentation.
Metals 11 00419 g002
Figure 3. Experimental input-output model of EDM process.
Metals 11 00419 g003
Figure 4. Main effect plots for outputs: (a) MRR, (b) SR, and (c) TWR.
Metals 11 00419 g004
Figure 5. Main effect plots of multi-response: (a) Taguchi-PCA-Utility approach, (b) Taguchi-CRITIC-Utility approach.
Metals 11 00419 g005
Figure 6. SEM images of HcHcr tool steel in EDM at (a) worst conditions (i.e., A2B3C3D2) and (b) optimal conditions (A1B3C1D1).
Metals 11 00419 g006
Table 1. Chemical composition of high carbon high chromium (HcHcr) steel.
Elements% C% Si% Mn% Cr% Ni% Mo% Fe
Weight (%)1.830.250.6112.450.120.78Bal
Table 2. Properties of HcHcr steel [38].
PropertiesValue
Density (kg/m3)7700
Melting point (°C)1421
Hardness (HRC)62
Poisson ratio0.27–0.3
Elastic Modulus (GPa)190–210
Thermal Expansion (/°C)10.4 × 10−6
Thermal Conductivity (W/m-K)20
Table 3. Properties of dielectric fluids [41,42].
PropertiesKeroseneDistilled Water
Flash point, °C81.0100
Dielectric strength, MV/cm160229
Density (g/cm3)0.801.00
Kinematic viscosity at 40 °C, cSt2.718.01 × 106
Table 4. Details of electrode materials properties [43,44,45].
PropertiesGraphiteCopperBrass
Density (g/cm3)1.778.9048.55
Melting point (°C)33501083990
Electrical Resistivity (Ω. m)60 × 10−51.96 × 10−84.7 × 10⁻⁸
Thermal conductivity (W/m.k)160–230388159
Specific heat capacity (J/g°C)7.100.3850.380
Table 5. Machining inputs process parameter with their levels.
Input ParametersSymbolUnitsLevels (1, 2, and 3)
Dielectric fluidsA-Distilled water and kerosene
Peak current (ampere)BA3, 6, and 9
Pulse-on time (seconds)Cµs50, 75, and 100
Electrode materialsD-Graphite, copper, and brass
Table 6. L18 experimental matrix and output results of signal-to-noise (S/N) Ratio.
Exp. NoInput variablesOutputs
Dielectric
Fluids
Peak
Current, A
Pulse on Time, µsElectrode
Materials
MRR g/minSR µmTWR
g/min
1Distilled water350Graphite0.04526.890.030
2Distilled water375Copper0.01543.600.050
3Distilled water3100Brass0.00775.960.012
4Distilled water650Graphite0.03654.760.025
5Distilled water675Copper0.00405.200.012
6Distilled water6100Brass0.01534.590.010
7Distilled water950Copper0.06141.650.015
8Distilled water975Brass0.01704.480.010
9Distilled water9100Graphite0.04502.900.014
10Kerosene350Brass0.00451.340.010
11Kerosene 375Graphite0.02942.890.022
12Kerosene 3100Copper0.00263.870.045
13Kerosene 650Copper0.00492.950.017
14Kerosene 675Brass0.01462.980.019
15Kerosene 6100Graphite0.01534.590.016
16Kerosene 950Brass0.01526.060.014
17Kerosene 975Graphite0.04103.160.018
18Kerosene 9100Copper0.00153.890.021
Table 7. S/N ratio for various objectives.
Exp.
No.
S/N Ratio Value
MRR (dB)SR (dB)TWR (dB)
1−26.90−16.7630.46
2−36.25−11.1326.02
3−42.27−15.5038.42
4−28.75−13.5532.04
5−47.96−14.3238.42
6−36.31−13.2440.00
7−24.24−4.3536.48
8−35.39−13.0340.00
9−26.94−9.2537.08
10−46.94−2.5440.00
11−30.63−9.2233.15
12−51.70−11.7526.94
13−46.20−9.4035.39
14−36.71−9.4834.42
15−36.31−13.2435.92
16−36.36−15.6537.08
17−27.74−9.9934.89
18−56.48−11.8033.56
Table 8. Pareto ANOVA results for material removal rate (MRR).
FactorsLevelsABCDTotal
Sum at factor levels (SFL)1−305.00−234.69−209.38−177.27−674.07
2−369.07−232.23−214.69−262.82
3 −207.15−250.00−233.98
Sum of squares of differences (SSD) 4105.051393.592924.2611,366.2919,789.19
Percent contribution (PC) 20.747.0414.7857.44100.00
Optimal levels (OL) A1B3C1D1 (Not the combination of L18 experiments)
Table 9. Pareto ANOVA results for surface roughness (SR).
FigureLevelsABCDTotal
SFL1−111.13−66.91−62.25−72.01−204.20
2−93.07−73.23−67.17−62.75
3 −64.07−74.78−69.44
SSD 325.93131.89238.93137.33834.08
PC 39.0815.8128.6516.47100.00
OL A2B3C1D2 (Not the combination of L18 experiments)
Table 10. Pareto ANOVA results for tool wear rate (TWR).
FactorsLevelsABCDTotal
SFL1318.91194.98211.45203.54630.26
2311.35216.19206.91196.80
3 219.08211.90229.92
SSD 57.141039.0745.751838.322980.28
PC 1.9234.861.5361.68100.00
OL A1B3C3D3 (Not the combination of L18 experiments)
Table 11. Principle component analysis (PCA) analysis for weight determination.
Eigen Value1.15000.98400.8659
Principal componentsFirst principal component (PC1)Second principal component (PC2)Third principal component (PC3)
Explained variation (%)38.3032.8028.90
Cumulative proportion (%)38.3071.10100.0
Eigenvectors
(MRR, SR, TWR)
−0.646, 0.682, 0.3410.360, −0.121, −0.9250.673, 0.721, −0.168
Table 12. Normalized values of responses—criteria importance through criteria inter-correlation (CRITIC) method.
Exp. No.Outputs
MRR, gm/minSR, µmTWR, gm/min
10.7300.0000.500
20.2320.5930.000
30.1040.1680.950
40.5840.3840.625
50.0420.3050.950
60.2300.4141.000
71.0000.9440.875
80.2590.4341.000
90.7260.7190.900
100.0501.0001.000
110.4660.7210.700
120.0180.5440.125
130.0570.7100.825
140.2190.7050.775
150.2300.4140.850
160.2290.1500.900
170.6590.6720.800
180.0000.5410.725
SD0.29780.26750.2851
Table 13. Correlation coefficient, summation, and weights of different responses.
Correlation Coefficient of Different ResponsesSummation of Different ResponsesWeights of Different Responses
MRRSRTWRMRRSRTWRSummationCjWj
MRR10.13050.023300.86950.97671.84620.54980.3470
SR0.130510.05290.869500.94711.81660.48590.3067
TWR0.02330.052910.97670.947101.92380.54850.3463
Table 14. Weight fractions of different responses: PCA and CRITIC.
CriteriaPCACRITIC
MRR, W10.41730.3470
SR, W20.46510.3067
TWR, W30.11630.3463
Table 15. Multi-response S/N ratio of hybrid approaches.
Exp. No.Multi-Response S/N Ratio
(Taguchi-PCA-Utility Approach)
Multi-Response S/N Ratio
(Taguchi-CRITIC-Utility Approach)
1−15.47−3.93
2−17.27−6.98
3−20.37−6.12
4−14.56−3.04
5−22.19−7.73
6−16.65−2.81
7−7.882.89
8−16.16−2.42
9−11.220.66
10−16.11−3.22
11−13.20−1.98
12−23.90−12.21
13−19.52−6.66
14−15.71−3.73
15−17.12−4.22
16−18.13−4.58
17−12.15−0.61
18−25.14−11.60
Table 16. Pareto ANOVA for the multi-response—Taguchi-PCA-Utility approach.
FactorsLevelsABCDTotal
SFL1−141.77−106.32−91.67−83.72−302.75
2−160.98−105.75−96.68−115.90
3 −90.68−114.40−103.13
SSD 369.02472.04855.751575.373272.19
PC 11.2814.4326.1548.14100.00
OL A1B3C1D1 (Not the combination of L18)
Table 17. Pareto ANOVA for the multi-response—Taguchi-CRITIC-Utility approach.
FactorsLevelsABCDTotal
SFL1−29.48−34.44−18.54−13.12−78.29
2−48.81−28.19−23.45−42.29
3 −15.66−36.30−22.88
SSD 373.65548.75504.651322.892749.94
PC 13.5919.9618.3548.11100.00
OL A1B3C1D1 (Not the combination of L18)
Table 18. Confirmatory experiments for the optimized EDM conditions.
Models and Weights for OutputOptimal ConditionsMulti-Response S/N Ratio (dB)
LevelsInput VariablesOutput Variables and S/N Ratio
Taguchi-PCA-Utility
MRR, W1 = 0.4173
SR, W2 = 0.4651
TWR, W3 = 0.1163
A1B3C1D1A: DW
B: 9 A
C: 50 µs
D: Graphite
MRR: 0.0632 gm/min
SR: 1.68 µm
TWR: 0.012 gm/min
−7.63
Taguchi-CRITIC-Utility
MRR, W1 = 0.3470
SR, W2 = 0.3067
TWR, W3 = 0.3463
A1B3C1D1MRR: −23.986 dB
SR: −4.506 dB
TWR: 38.42 dB
3.60
Publisher’s Note: MDPI stays neutral with regard to jurisdictional claims in published maps and institutional affiliations.

