Article

Fatigue Crack Growth Characteristics of 34CrMo4 Steel for Gas Cylinders by Cold Flow Forming after Hot Drawing

1
Institute of Process Equipment and Control Engineering, Zhejiang University of Technology, Hangzhou 310032, China
2
Zhejiang Jindun Pressure Vessel Co. Ltd., Shaoxing 312300, China
3
Engineering Research Center of Process Equipment and Remanufacturing, Ministry of Education, Hangzhou 310032, China
*
Author to whom correspondence should be addressed.
Metals 2021, 11(1), 133; https://doi.org/10.3390/met11010133
Submission received: 10 December 2020 / Revised: 31 December 2020 / Accepted: 8 January 2021 / Published: 11 January 2021
(This article belongs to the Section Metal Casting, Forming and Heat Treatment)

Abstract

:
The fatigue crack growth (FCG) behavior of 34CrMo4 steel, a typical material for gas cylinders, has been investigated. Specimens were taken from the base material (BM) as well as the hot-drawn (HD) cylinder and cold-flow (CF) formed cylinder along the longitudinal and transverse directions. The FCG tests were conducted under different stress ratios for different materials and directions. The main purpose of this research was to explore the influences of the mechanical and thermal processes, sampling direction and stress ratio on the FCG behavior of 34CrMo4 steel. To further reveal the mechanism of crack propagation at different stages, the microstructures and fracture modes of FCG specimens were analyzed by scanning electron microscopy (SEM) and electron backscatter diffraction (EBSD), respectively. The results showed that HD and CF materials exhibited better resistance to fatigue crack propagation than BM. The FCG rates of investigated materials can be accelerated by the increase in stress ratio. However, the sampling direction had little effect on the FCG rate. Finally, a driving force parameter (DFP) model was used to fit the experimental FCG data of three materials with different mechanical and thermal processes. A unified transition stage between the stable and unstable FCG stages of three materials under various experimental conditions was revealed by DFP model, playing an important role on the early warning of fatigue fracture for different types of 34CrMo4 steel.

1. Introduction

Gas cylinders are often used as special equipment to provide medical oxygen or as fuel storage containers. During the manufacturing, transportation and installation of gas cylinders, there will inevitably be defects in different degrees, and new defects will arise during the reuse process due to the influence of various factors, such as load and media [1]. Studies have shown that the failure of gas cylinders is mostly directly related to these defects, especially surface crack defects. Once the failure occurs, it will cause severe economic losses and casualties. In order to prevent severe accidents as well as to enhance reliability in the usage of gas cylinder, careful analysis and accurate safety assessment of the cylinder is therefore greatly necessary [2,3].
34CrMo4 (AISI 4130) steel is one of the authorized steels for gas cylinders with excellent corrosion resistance, mechanical properties, hardenability, and deformation characteristics. Several studies have been done to describe the fatigue behavior of this steel [4,5]. Arola and Williams [6] investigated the effect of surface texture on the fatigue life of AISI 4130. The results show that fatigue life is related to surface texture, and fatigue strength decreases with increasing surface roughness. Macadre et al. [7] considered two factors: hydrogen pressure and test frequency. The propagation characteristics of cracks in hydrogen were compared with those in air. Higher hydrogen pressure and lower loading frequency would lead to faster crack growth. Additionally, the fracture observation results showed that the small number of inclusions had no effect on the fatigue crack growth (FCG) rate. Colombo et al. [8] compared FCG rates of the specimens without and with pre-charged hydrogen. AISI 4130 steel exhibited a high hydrogen embrittlement sensitivity, and the FCG rate was two or three orders of magnitude higher in specimens filled with hydrogen. There were not many research results about the fatigue performance of 34CrMo4 steel. Due to the numerous influencing factors, it was still necessary to explore the fatigue crack growth characteristics from different perspectives.
To study the fatigue crack propagation behavior of materials, other influencing factors are often considered. Cain et al. [9] researched the fatigue performance of Ti6Al4V and found that the sampling direction had the most significant effect on the fatigue crack propagation rate. Low temperature stress relief and annealing heat treatment can improve fracture toughness and fatigue crack propagation resistance. Suryawanshi et al. [10] proposed that within the crack growth region, the selective laser melting technique can slightly reduce the threshold stress intensity factor range of FCG of 316L stainless steel and increase the Paris exponent of FCG. Noroozi et al. [11] developed a uniform two-parameter fatigue crack propagation driving force model to account for the effects of residual stress and stress ratio on fatigue crack propagation. Silva [12] revealed that the cyclic plasticity was the main controlling mechanism of fatigue cracks under the conditions of negative stress ratios. Mousavinasab et al. [13] investigated the influence of different microstructures on the FCG rate of PM steel, the conclusion was drawn that reducing the formation of nickel-rich ferrite regions could make PM steel have better fatigue resistance.
In present study, the effects of the mechanical and thermal processes, stress ratio and sampling direction on the fatigue crack propagation rate of cylinder were considered. The FCG rates of the longitudinal and transverse specimens under different stress ratios were analyzed and calculated through FCG tests. Scanning electron microscopy and electron backscatter diffraction were used to explain the mechanism of FCG from a microscopic point of view. In addition, two models were adopted to fit the experimental data and the results were compared.

2. Materials and Methods

2.1. Materials

In this test, two 34CrMo4 seamless cylinders with an inner diameter of 210 mm were taken as the research object. The chemical composition of the processed billet material is given in Table 1, which meets the requirements of BS EN 10083-3: 2006 [14]. See Figure 1, two cylinders are hot-drawn (HD) cylinder and cold-flow (CF) formed cylinder. HD with a thickness of 7.94 mm was manufactured by hot stamping and drawing on a hydraulic press (Jindun Pressure Vessel Co. Ltd., Zhejiang, China) using the traditional hot billet stamping method. On the basis of HD process, CF was manufactured by three-wheel cold spinning process, and the wall thickness was reduced to 5 mm by a single-pass forming. In addition, the same post-heat treatment process was used for HD and CF cylinders after deformation, which improved the toughness of the cylinders. Both cylinders were heated to 870 °C and held for 45 min, then quenched with water. After quenching, the material became hard but brittle at the same time. To reduce brittleness, it was tempered for 1.5 h at 620 °C and then cooled in water [15].

2.2. Sampling

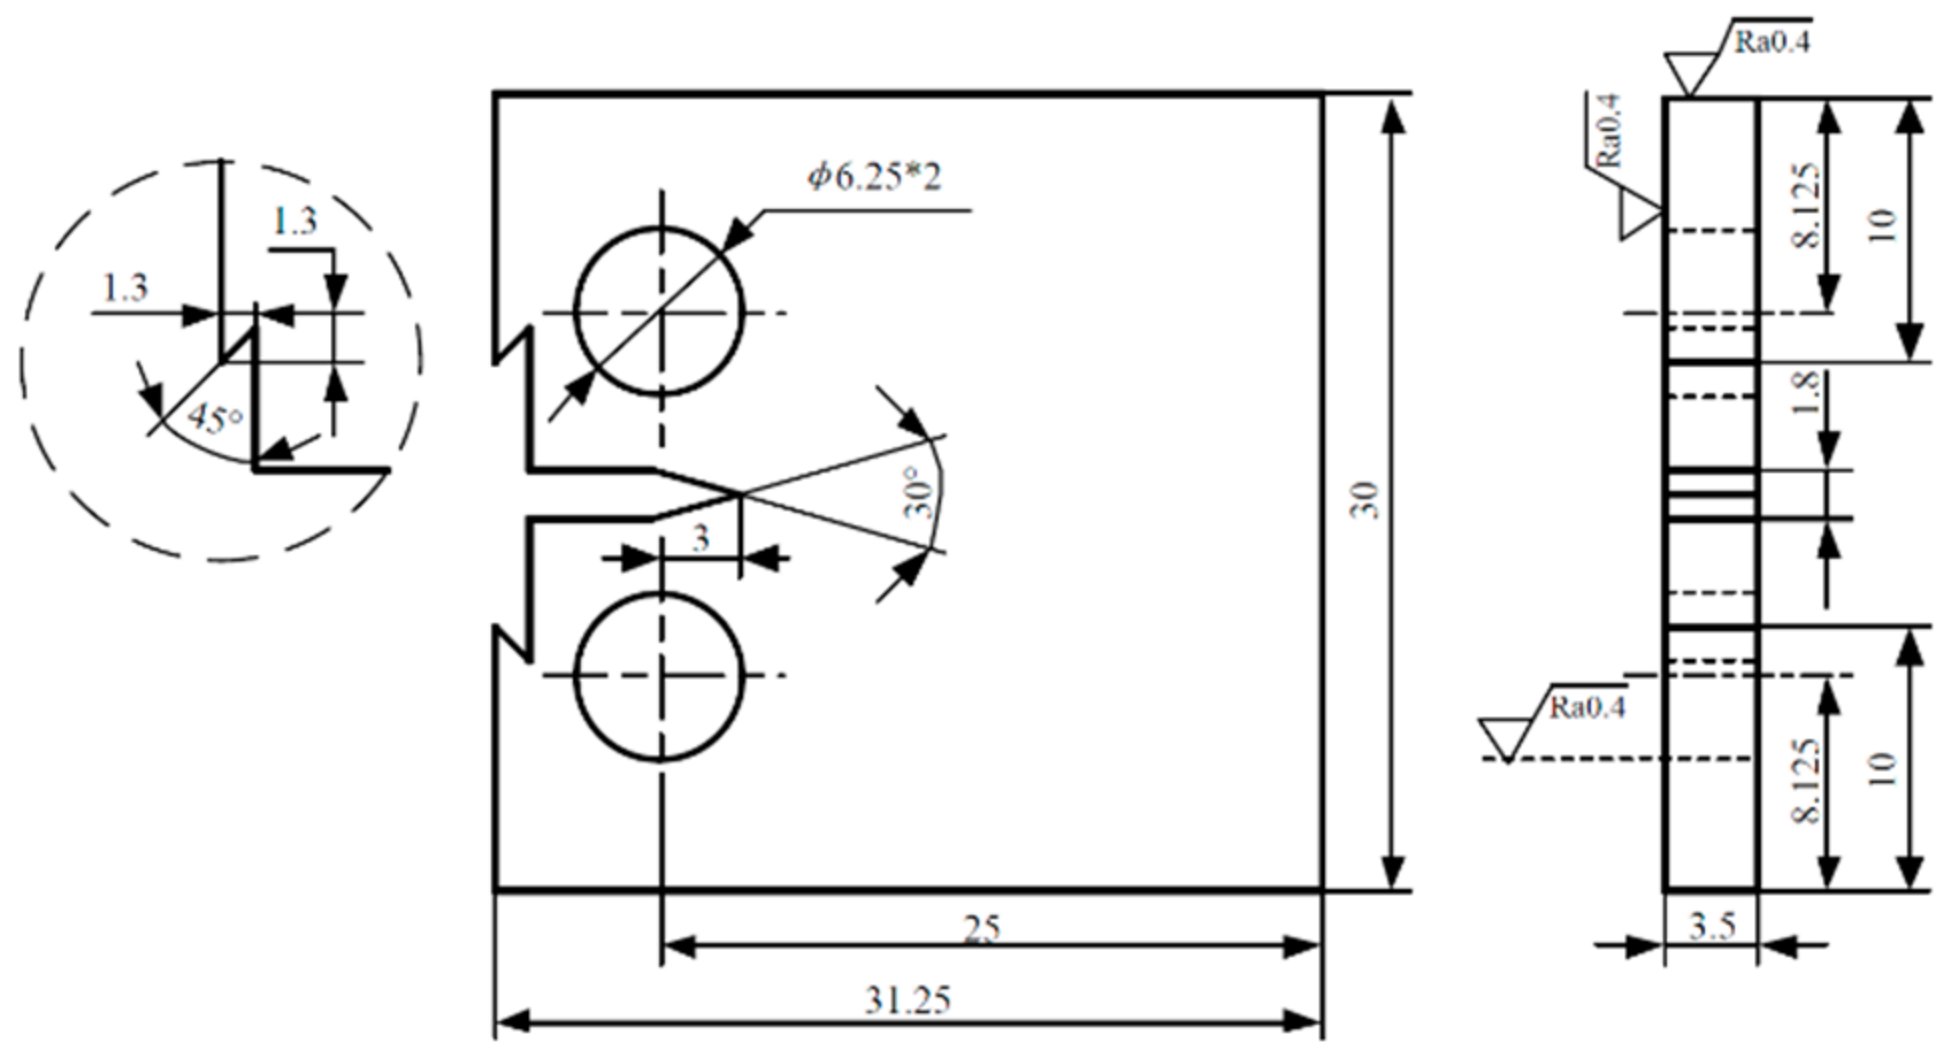
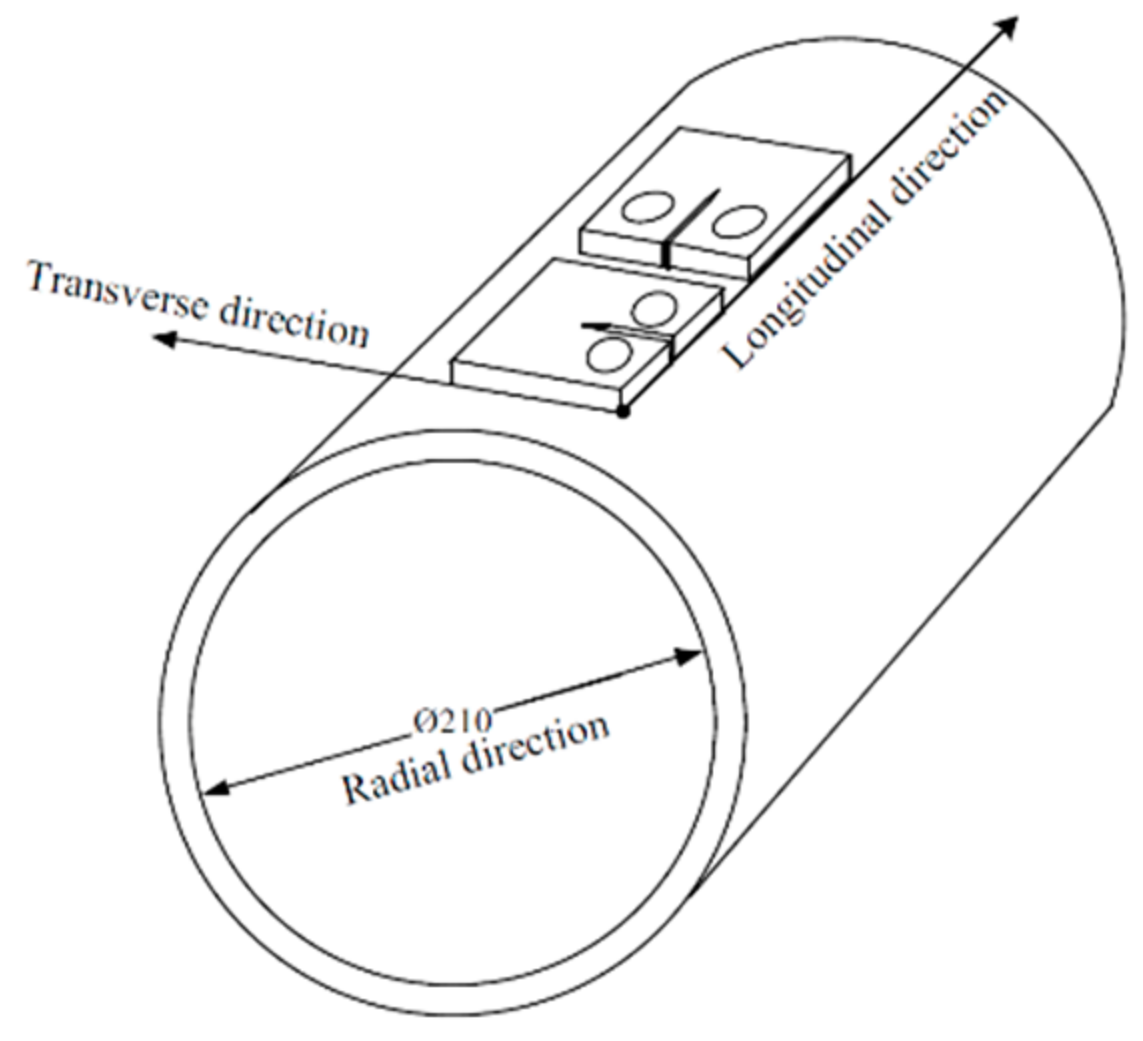
The standard compact tensile (CT) specimen of 34CrMo4 seamless cylinder was designed according to ASTM E647-15. The thickness B of the specimen is 3.5 mm and the width W is 25 mm, as shown in Figure 2. As the HD and CF cylinders used in current work are typical thin-wall cylinders, the investigated fatigue properties and microstructural characterization were mainly focused on the longitudinal and transverse directions. Therefore, the directions of FCG for CT specimens are designed to be parallel with the longitudinal and transverse directions of the cylinder, as shown in Figure 3. The longitudinal and transverse specimens of HD and CF cylinders are named HDL, HDT, CFL, CFT, respectively. Since the Base Material (BM) is isotropic, there is no need to distinguish the sampling direction. FCG rate tests with stress ratios of 0.1, 0.3, and 0.5 were conducted for specimens in each sampling direction.
In order to examine the loose material and broken surfaces, metallographic specimens were removed from HD and CF cylinders. The cutting specimen was carried out by wire electrical discharge machining (DK7720, AIER CNC Machine Tools company, Hailing, Taizhou, China), and the sampling diagram on the cylinder is shown in Figure 4. The microstructure of two sides of the specimen was observed by optical microscope (OM, ARTCAM-300MI-WCM-DS, ACH, Jinshan, Shanghai, China).
The specimen was installed on an automatic installation press (Simplimet 1000, Buehler, Bluff Lake, IL, USA) and grinded carefully with a sandpaper machine (Buehler, Bluff Lake, IL, USA). Sandpaper models ranged from 120×, 240×, to 1200×. In addition, the specimen surface was polished to 1 μm using an automatic grinding and polishing system (Baimu Metallographic Testing Technology Co. Ltd., Hangzhou, Zhejiang, China). The specimen was etched and polished with a 4% alcohol nitrate solution (Sinopharm Chemical Reagent Co. Ltd., Shanghai, China) and first observed under an OM. Then, the scanning electron microscope (SEM, ZEISS LEO 1530VP, Cari Zeiss AG, Jena, Germany) assembled with an electron back scattered diffraction (EBSD) was used to measure and analyze the microscopic information of grain, such as true size, orientation difference, and so on.

2.3. Fatigue Crack Growth Test

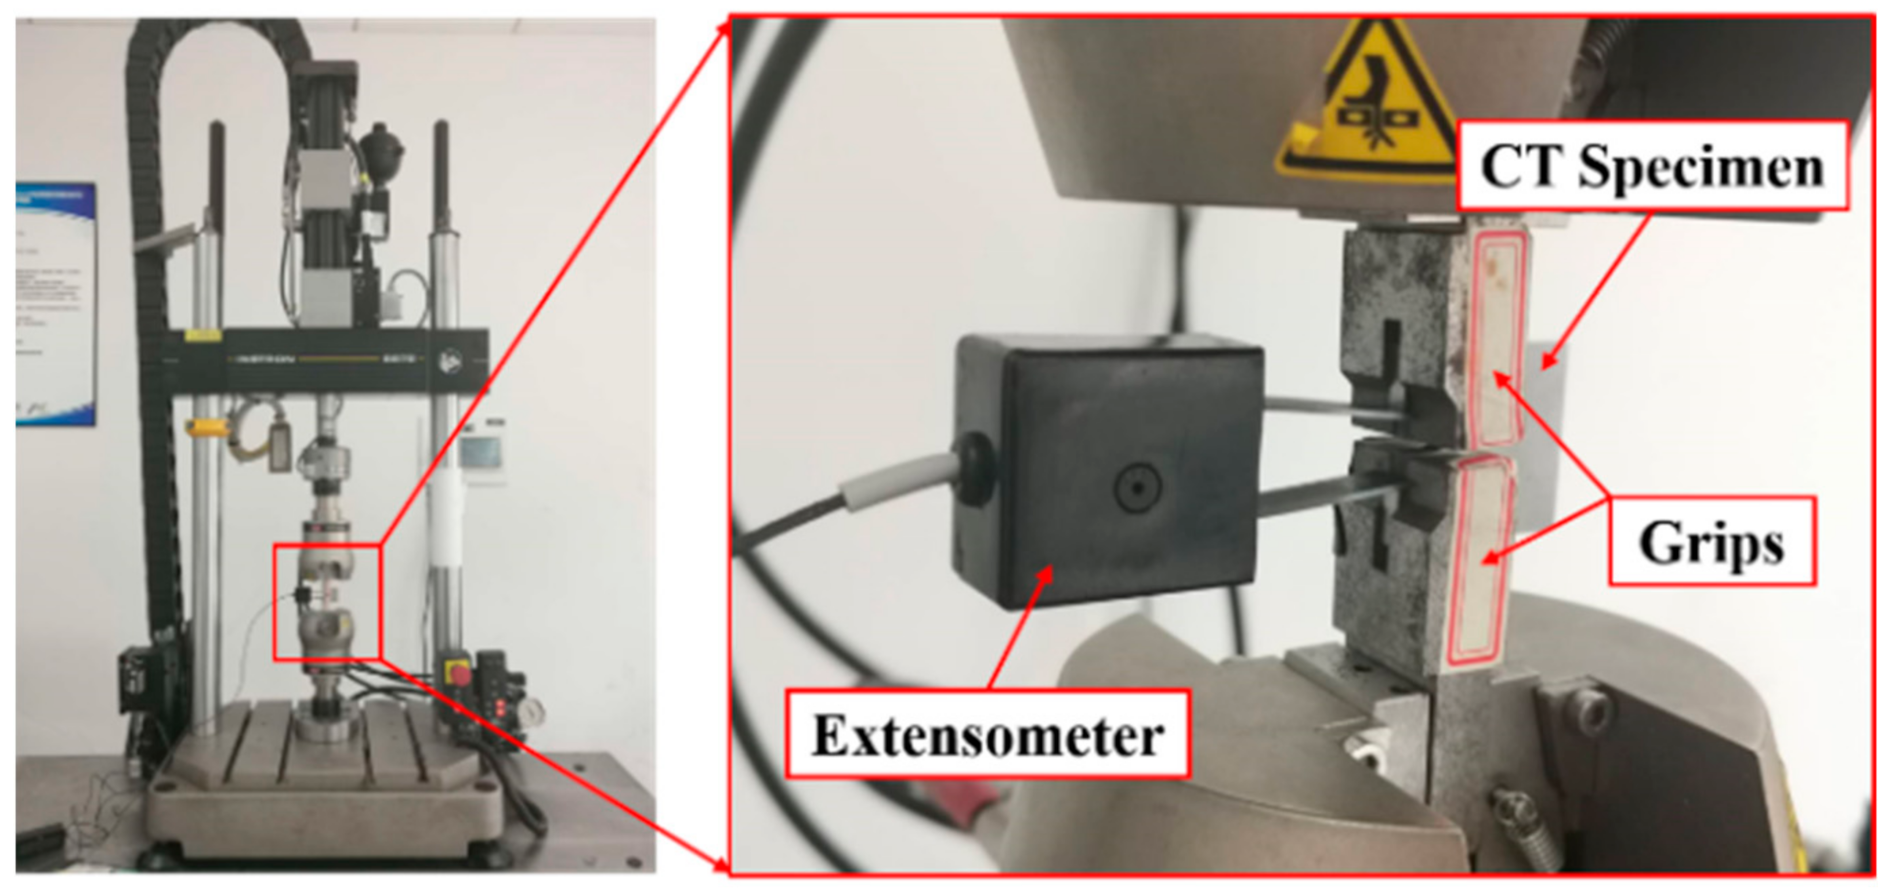
FCG test was conducted on a universal testing machine (Instron 8872, Instron, Norwood, MA, USA). The test setup is shown in Figure 5. Under the condition of room temperature, the load was carried out with the method of constant load and sine waveform. The frequency of FCG test was set to be 10 Hz. The specific information of each FCG test is listed in Table 2. The instantaneous length of fatigue crack was measured by the extensometer (Instron, Norwood, MA, USA) based on the flexibility method. The data of FCG, including the crack length, cycle number and stress intensity factor, were collected when the increase of crack length was above 0.04 mm.
Before FCG test, the crack of each CT specimen was pre-cracked to a length of about 6 mm under the same conditions of loading waveform, loading frequency, and stress ratio. After the FCG test, the specimen was stretched to fracture, in order to examine the crack length a and fracture morphology. The crack length was measured by a five-point method under an optical microscope. The FCG rate da/dN was determined by a seven-point increasing term method. The range of stress intensity factor ΔK was calculated according to Equation (1):
Δ K = Δ P B W · 2 + α 1 α 3 / 2 · 0.886 + 4.64 α 13.32 α 2 + 14.72 α 3 5.6 α 4 ,
where α = a / W , and the effective range of data is a / W 0 .
The fractured specimens were first ultrasonically cleaned in acetone for 3 min, and then dried in hot air. In order to explain the influence of sampling direction and the mechanical and thermal processes on FCG behaviors and fracture mechanisms, the fractured specimens with a stress ratio of 0.1 were selected to be analyzed using the FEI Quanta 200F SEM.

3. Results

3.1. Fatigue Crack Growth Tests

The effect of the stress ratio on the FCG rate was considered firstly. The FCG rates of different materials (BM, HD, and CF) and directions (longitudinal and transverse directions) under various stress ratios are plotted against the stress intensity factor in Figure 6. It can be seen that the five types of materials are slightly sensitive to stress ratio. The FCG rate curve was composed of three regions: the near-threshold region, the stable growth region, and the unstable region. The specimens with same mechanical and thermal processes and different stress ratios showed similar FCG behaviors in the stable region. No obvious change of FCG rate in the stable region was caused by the increase in stress ratio. Compared with the stable growth region where the da/dN and ΔK exhibit a linear relationship, the stress ratio has more significant influence on the FCG rate in the near-threshold region and unstable region. The transition points of ΔK between the near-threshold/stable regions and stable/unstable regions were significantly reduced by the increase of stress ratio, especially in the HD and CF materials. However, this phenomenon cannot be apparently observed in BM material.
The Paris model was often used to describe the FCG rate in the stable growth stage of fatigue cracks because of its simple form and high fitness. The famous Paris model is as follows:
da dN = C Δ K m ,
where a is the crack length, N is the number of fatigue load cycles, ΔK is the stress intensity factor range, C and m are material constants, and their numerical values are related to the material fatigue performance, loading environment and other factors [16].
Taking the logarithm of both sides of Equation (2) at the same time, the following linear equation can be obtained:
lg da / dN = lgC + mlg Δ K ,
According to Equation (3), the data under each working condition were analyzed by linear regression, and parameters C and m were obtained. The fitting constants and correlation coefficients of the Paris model are given in Table 3. From the fitting results, it can be found that under the condition of the same stress ratio and sampling direction, the value of the fitting constant C of the CF material is slightly larger than that of the HD material and much larger than that of the BM material. Whereas, the comparison of the fitting constant m values of the three materials has an opposite relationship with the C value. In the double logarithmic axis, m represents the slope of the fitted curve, and lgC represents the intercept of the curve on the ordinate axis.
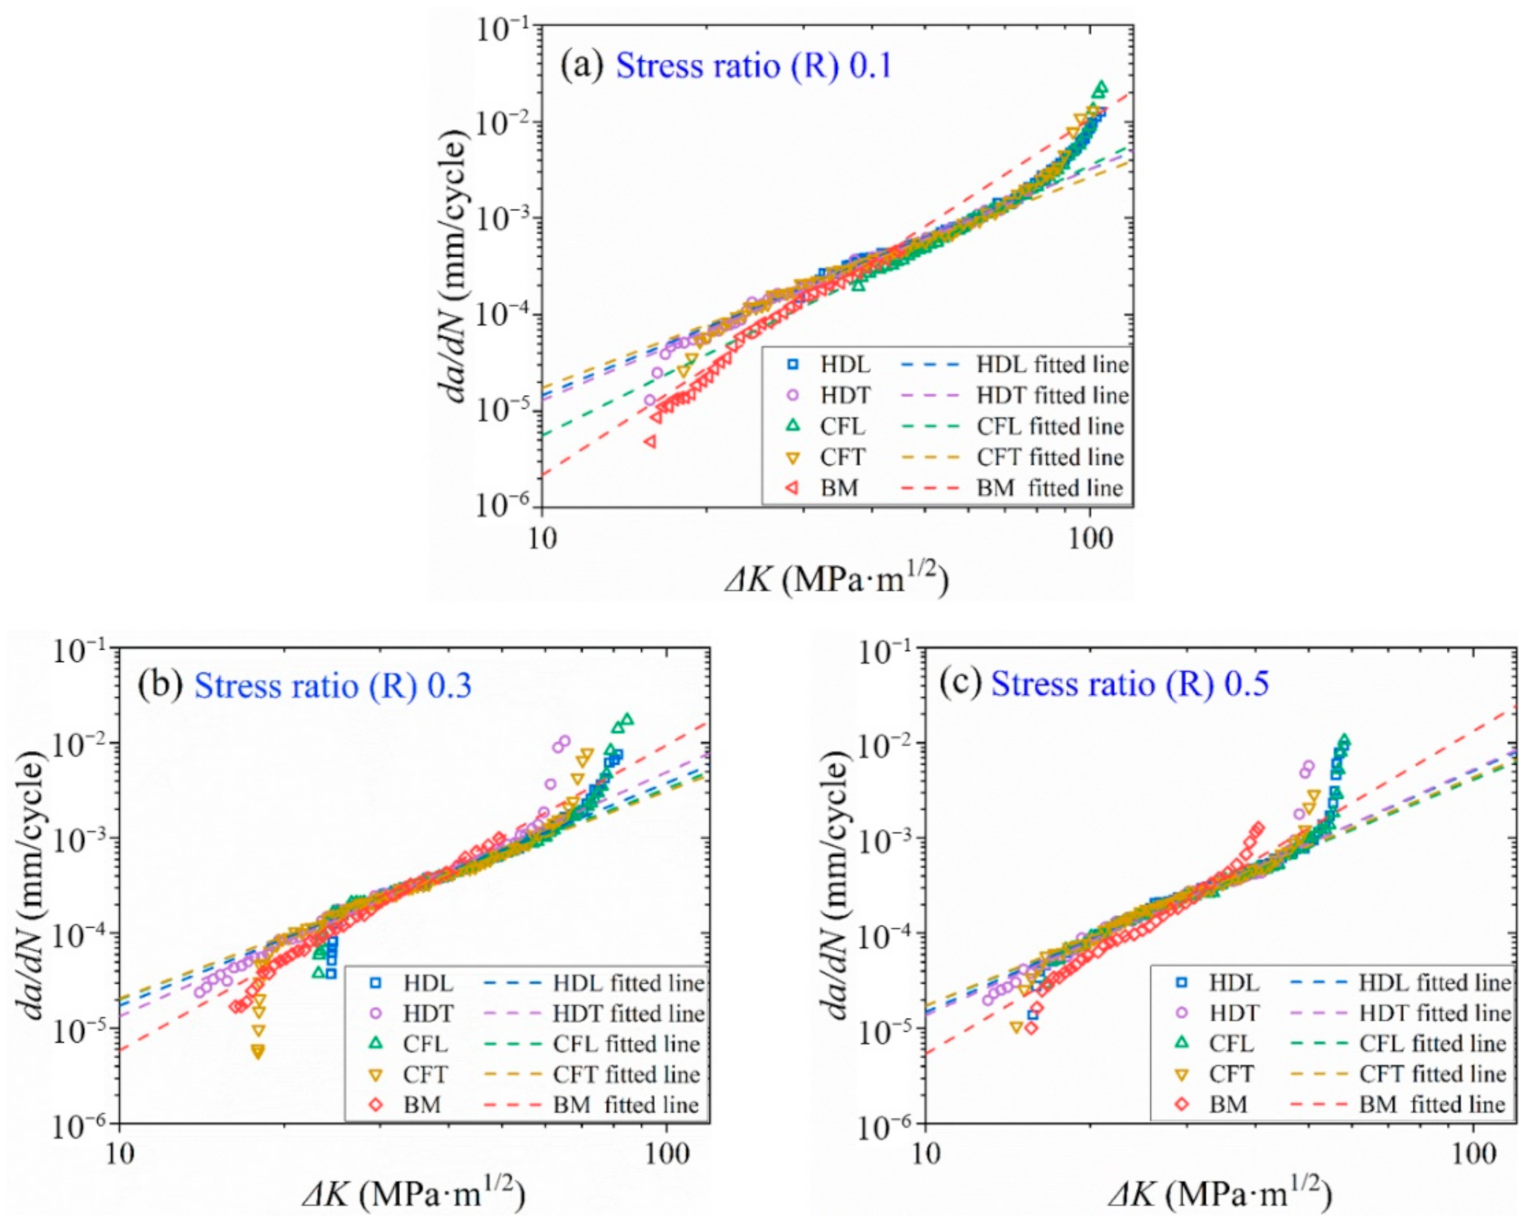
Figure 7 shows the FCG behavior of different materials under the same stress ratio (0.1, 0.3 and 0.5, respectively). For HD and CF materials, the FCG rate curves in the longitudinal and transverse directions basically coincided. Therefore, the sampling direction had little influence on the FCG rate for HD and CF materials, indicating that the HD and CF materials were almost homogeneous and isotropic [17]. It was in accord with the previous work [18]. The FCG rates of HD and CF materials were significantly different from that of BM. Taking the stress ratio of 0.3 as an example (Figure 7b), the slopes of fitting lines for stable growth region of HD, CF and BM materials are 2.3417 (HDL), 2.5643 (HDT), 2.2195 (CFL), 2.1796 (CFT), and 3.2095 (BM), respectively. It can be seen that the slope of BM material is largest, followed by HD and CF in turn. In the initial stage with relatively small ΔK, the FCG rate of BM was lower than those of HD and CF materials. With the increase in ΔK, the FCG rate of BM exceeded those of HD and CF materials. In addition, BM material had a larger threshold ΔK compared with HD and CF material. On the contrary, in the unstable region, the fracture ΔK of BM material was significantly smaller. This indicates that HD and CF materials have better resistance against the FCG than BM. The analysis results under stress ratios of 0.1 and 0.5 were also consistent with the above results.

3.2. Microstructure

3.2.1. Microstructure Analysis

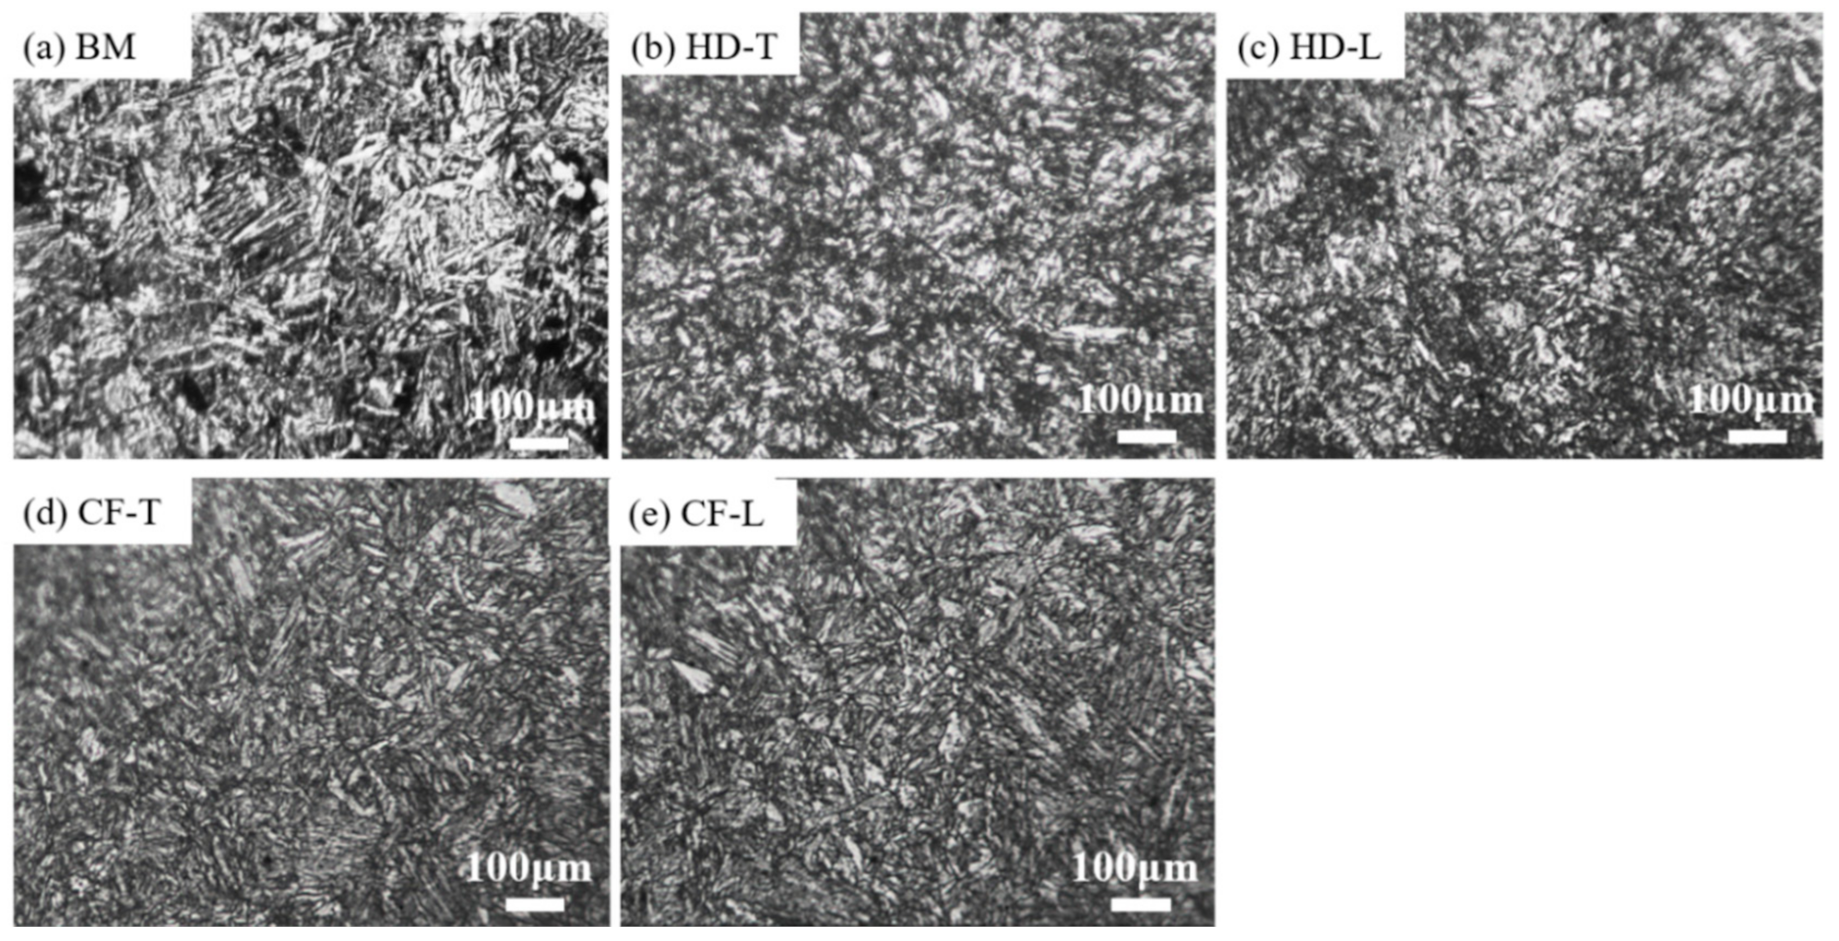
The microstructure of materials has an important influence on the FCG performance. Figure 8 shows the microstructures of HD, CF, and BM cylinder specimens after etching. As can be seen from Figure 8b–e, the microstructure are almost tempered martensite for all materials. Comparing the microstructure of HD material and CF material in longitudinal and transverse directions, it can be found that the microstructures of HD and CF materials were similar. Unlike the microstructures of HD and CF materials, the microstructure of BM material was mainly composed of lath martensite and ferrite (Figure 8a).

3.2.2. Fracture Analysis

Figure 9 displays the macroscopic fracture morphology of five specimens. According to the direction of FCG, the fracture surface can be divided into three areas along the direction of crack propagation: the pre-crack region, the stable growth region and the unstable region. The latter two regions were purposely analyzed in this paper, to clarify the FCG and fracture behaviors dependent on the mechanical and thermal processes and sampling directions. The stable growth region was also known as the stable growth region where the FCG rate was relatively stable. From a macro perspective, the fracture surface in this area was flat and basically extended perpendicular to the loading direction. The unstable region was formed because the fatigue crack was grown beyond the critical size, leading to an acceleration of FCG rate.
Figure 10 shows the fracture morphologies of five fractured specimens in stable growth region. In stable growth region, the basic feature of the microstructure was the strip pattern with certain spacing and parallel, that was, the fatigue striation. The fatigue striations were basically perpendicular to the crack growth direction. Figure 10a,b shows the crack morphology of the BM specimen. There were obvious fatigue striations and a few micro-cracks which were also perpendicular to the crack growth direction on the fracture surface of BM. Figure 10c–f presents the fracture morphology of the HDL and HDT specimens and their local magnification images. In addition to fatigue striations and micro-cracks, there were also voids on the fracture surfaces. It could be found that the fracture characteristics of the longitudinal and transverse specimens were very similar. However, compared with BM, the fracture of HD material was rougher. Moreover, the number of micro-cracks was increased with the intermittent distribution between fatigue streaks. Figure 10g–j describes the fatigue fracture characteristics of CFL and CFT specimens. Consistent with HD materials, no obvious difference in microstructure was caused by the change in sampling direction.
Figure 11 illustrates the fracture morphologies of five specimens in the unstable region. The fracture characteristics of BM specimen are mainly cleavage planes, accompanied by a small number of dimples and voids (see Figure 11a). Its material has poor plasticity and the crack propagation plastic zone is small. The fracture surfaces of HD and CF specimens are distributed with a large number of high-density dimples of different sizes, as shown in Figure 11b–e. This indicates that the fatigue fracture of HD and CF is plastic fracture, and the toughness of the material is better. It can be seen from the comparison with BM that the fatigue fracture characteristics of HD and CF materials after heat treatment process gradually change from brittleness to toughness. The plastic deformation has consumed the energy of FCG and reduced the rate of FCG. According to the above fracture morphology and FCG rate curve, it can be known that better plastic properties will increase the resistance of the material to FCG.
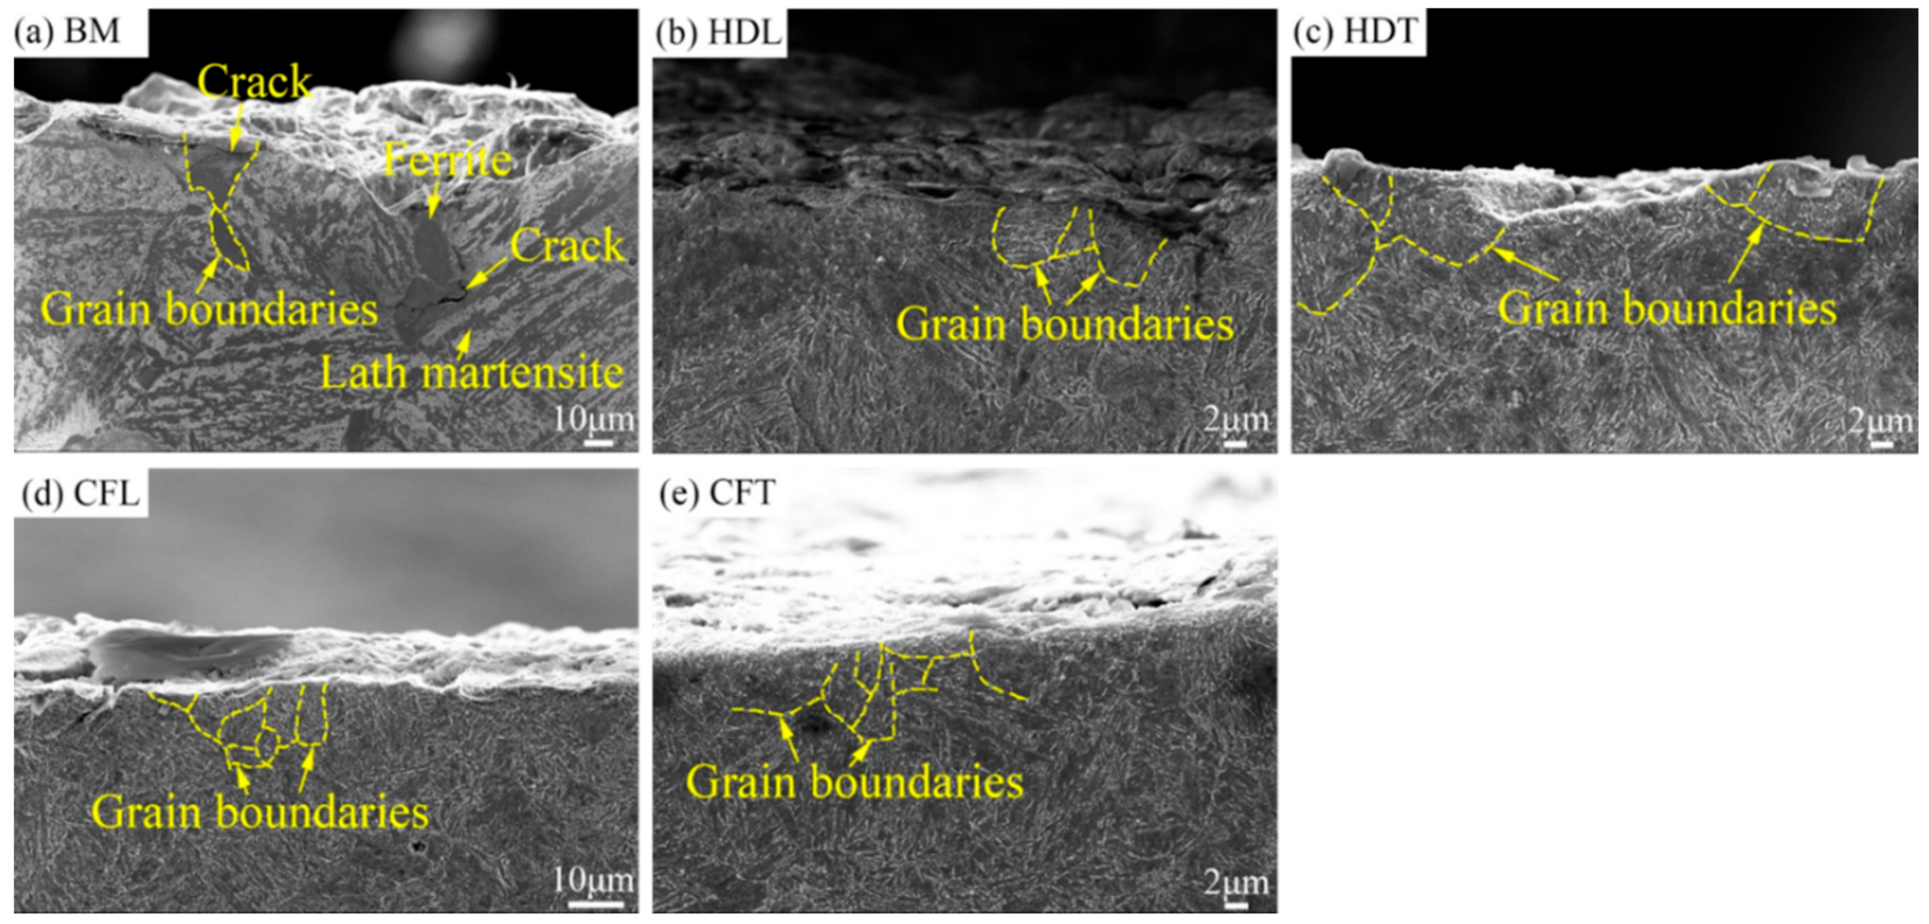
Figure 12 presents the cross-section fracture morphologies of five specimens. As mentioned before, the BM material was composed of lath martensite and ferrite. Figure 12a shows the intergranular cracks are occurred along the interfaces between the lath martensite and ferrite. Meanwhile, the transgranular cracks were also observed in both martensite and ferrite grains. In HD and CF materials, it can be seen that the cracks are propagated through the martensite grains as shown in Figure 12b–e, indicating an obvious transgranular fracture mode in those materials. It can be inferred that the predominant fracture mode was the transgranular fracture in BM, HD, and CF materials. The occurrence of intergranular cracks produced at the interfaces between the lath martensite and ferrite was the significant difference of fatigue crack propagation between the BM and HD/CF materials.

3.2.3. EBSD Analysis

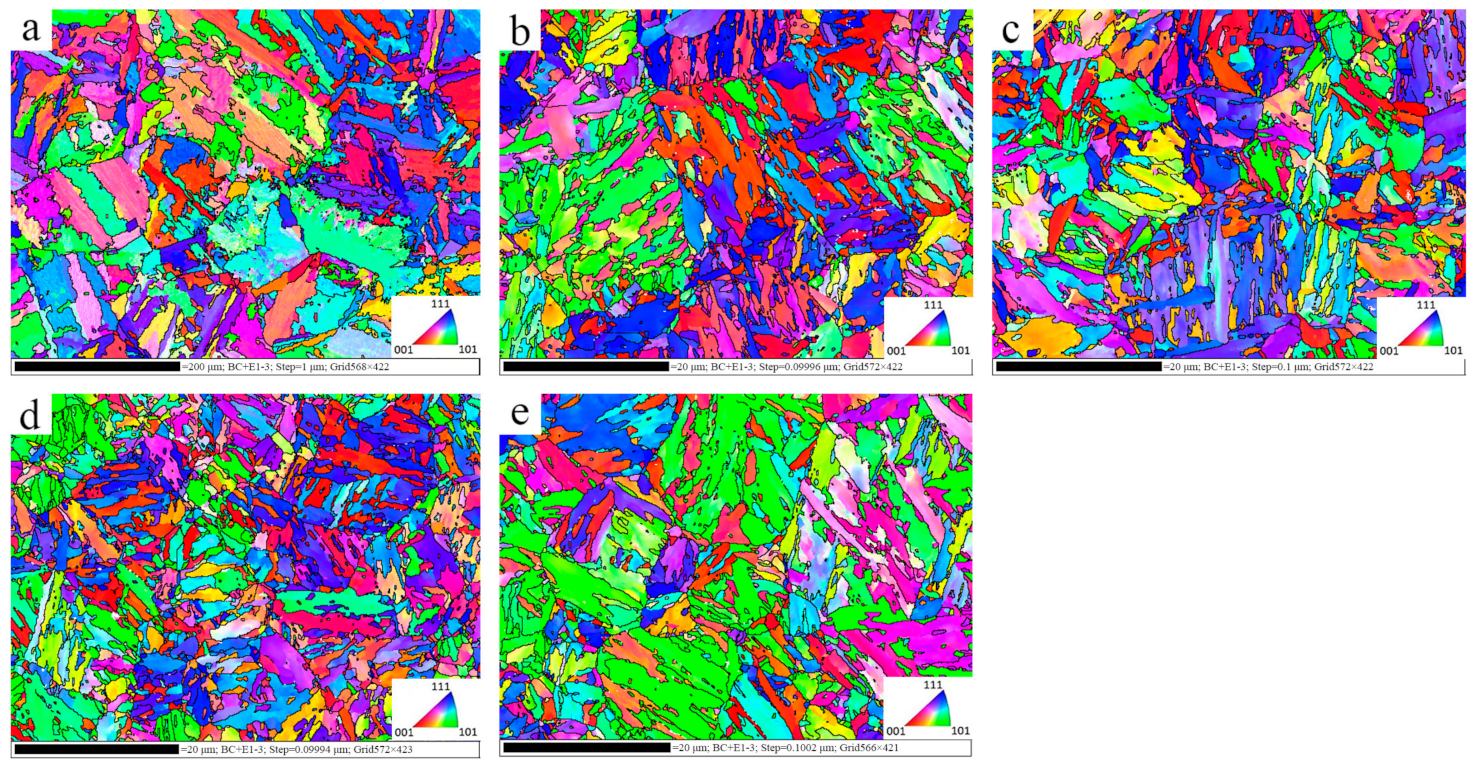
The orientation maps for the different materials in both longitudinal and transverse directions were obtained by EBSD, as shown in Figure 13. It can be seen that grain orientation is not uniquely determined in HD and CF materials as well as BM material. The average grain sizes of BM, HDL, HDT, CFL, and CFT materials are 11.48, 1.02, 1.06, 0.98 and 1.10 μm, respectively. The grain size of the HD and CF materials in both longitudinal and transverse directions is relatively close, far smaller than those of BM material. In addition, the total numbers of grains of BM, HDL, HDT, CFL, and CFT materials are 906, 1302, 1183, 1621 and 1030 in sequence.
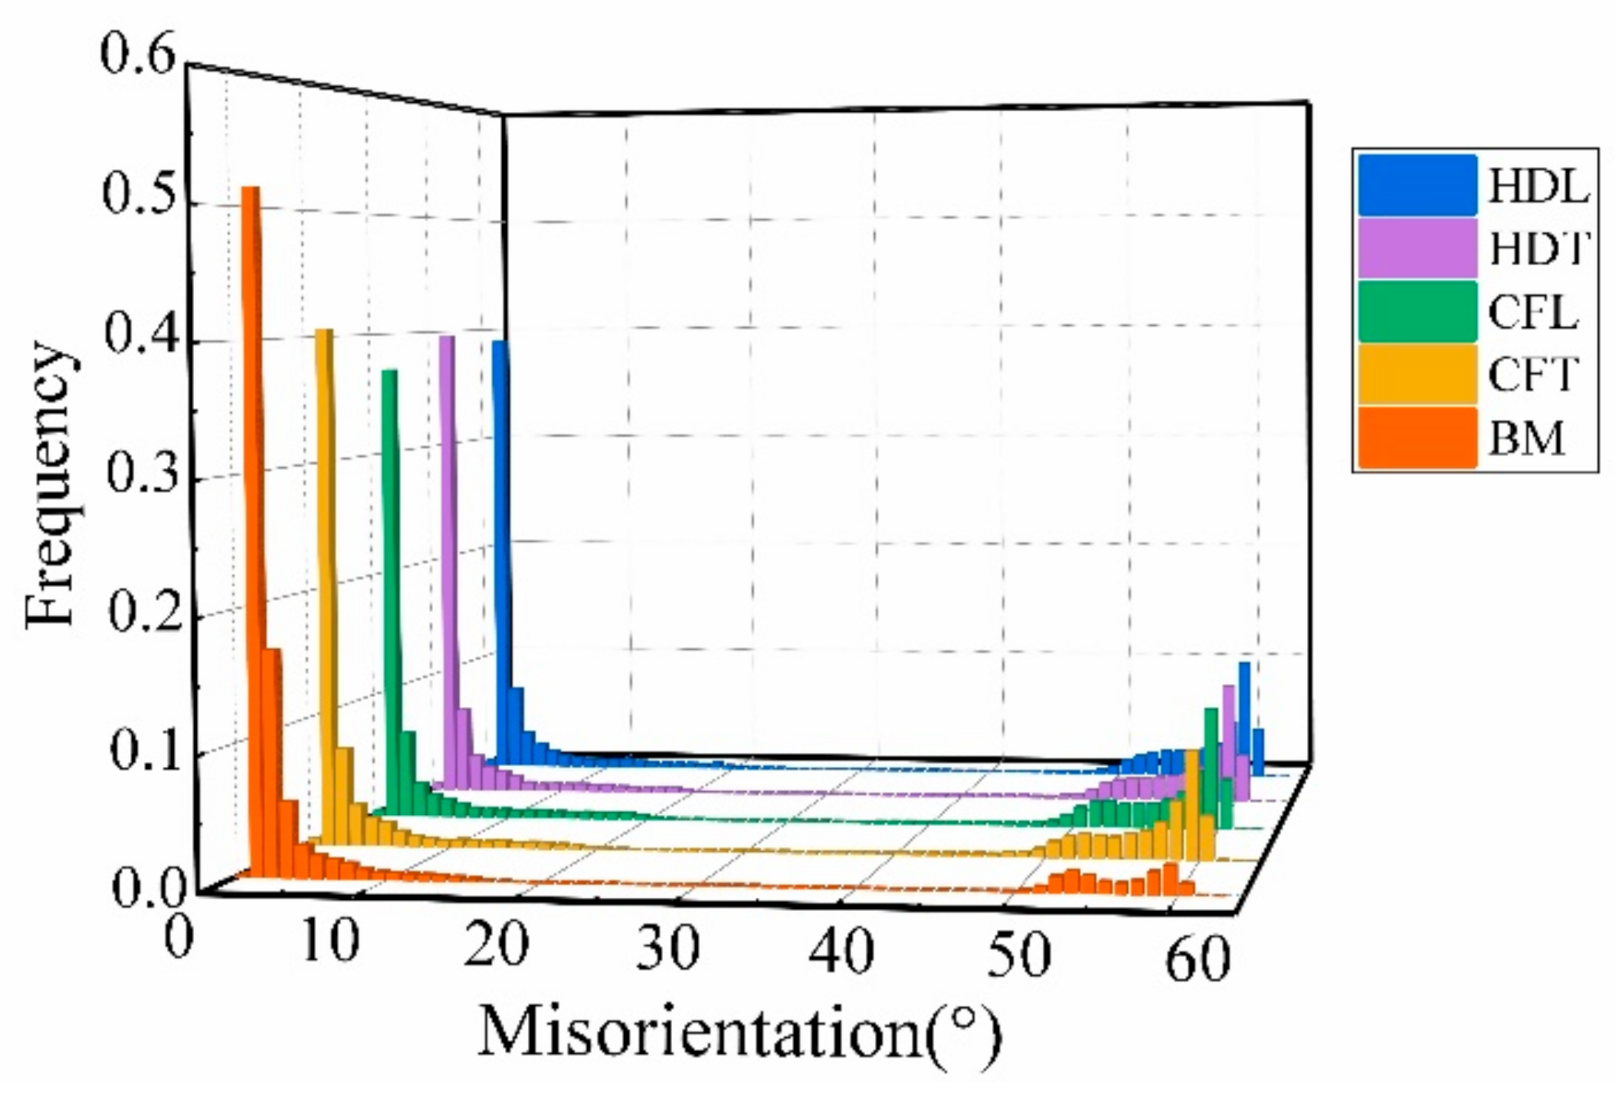
Figure 14 shows the grain boundary maps for the BM, HD and CF materials, where the green line represents low-angle grain boundaries (LAGBs) with misorientation in the range of 5–15°, while the black line represents high-angle grain boundaries (HAGBs) with misorientation exceeding 15°. Figure 15 illustrates the misorientation distributions of grain boundaries in different materials. It can be seen that BM material is mainly composed of LAGBs and a small amount of HAGBs. After processing and heat treatment, the amount of LAGBs in HD and CF materials significantly decreased, while the amount of HAGBs greatly increased. According to statistics, the HAGBs of BM, HDL, HDT, CFL, and CFT materials are about 14.8%, 41.1%, 40.4%, 43.5%, and 38.0%, respectively. It was well known that HAGBs has high grain boundary energy, which can effectively increase the crack propagation resistance and improve the material strength [19,20].
Figure 16 displays the local misorientation maps of different specimens. The gradual change from blue to red represents the change of local dislocations from small to large. It can be seen that the high local dislocations are mainly concentrated near the grain boundary. In BM materials, high local dislocations dominate, which indicates that the materials have higher residual strain and dislocation density. Whereas HD and CF materials were mainly characterized by low local dislocations, and a small amount of high local dislocations were distributed uniformly. Therefore, the residual strain and dislocation density of HD and CF materials were significantly lower than that of BM materials [21]. The grain size of HD and CF materials was refined after heat treatment. In the process of deformation, the retention of dislocations by fine grains was not high, because dislocations may be drawn from the grain boundary and then quickly disappeared in the other side of the fine grain boundary [22].

4. Discussion

The aforementioned FCG experiments revealed that the FCG rate of BM was lower than those of HD and CF materials in the initial stage with relatively small ΔK. With the increase in ΔK, the FCG rate of BM exceeded those of HD and CF materials (Figure 7). The fatigue cracks were propagated in the transgranular mode for HD and CF materials and in the mixed (transgranular and intergranular) mode for BM, as shown in Figure 12. The grain boundaries can be regarded as the barriers against the fatigue crack propagation in the transgranular mode. As the grain size was similar for the different directions of HD and CF materials (~1 μm), the FCG rates were consequently considered to be close. The grain size of BM was significantly larger than that of HD and CF materials, making the FCG resistance provided by grain boundaries was theoretically reduced in the BM. However, the FCG experimental results indicated that the FCG rates of BM were not apparently larger than those of HD and CF materials. The enhanced FCG resistance of BM was attributed to the high residual stress existed in martensite and the large number of subgrain boundaries. A volumetric expansion of martensite would be caused by the martensitic transformation during the manufacture of BM, leading to the compressive residual stress remained in the martensite as shown in Figure 16a. It is well known that the compressive residual stress can slow down the FCG rate by decreasing the actual stress intensity factor of crack tip and enhance the threshold value of crack initiation by reducing the actual stress ratio. Therefore, the FCG rate was moderated and the initiation time of fatigue crack was extended in initial FCG stage of BM. Meanwhile, the fraction of subgrain boundary is relatively high in BM (Figure 15). The subgrain boundaries were also treated as the barriers against the dislocation movements, improving the strength and fatigue resistance of BM [23,24]. However, the fatigue crack propagation was determined by a transgranular-intergranular mixed mode. The distinct difference of residual stress between the martensite and ferrite can lead to the generation of intergranular cracks at the interfaces between the martensite and ferrite. The participation of intergranular cracks at the interfaces between the martensite and ferrite can be the alternative path for the propagation of fatigue cracks, resulting in the acceleration of FCG rate in BM. The slopes of da/dN−ΔK for BM were thus lager than those for HD and CF materials.
It has been known from the previous experimental results that the FCG rate of 34CrMo4 steel cylinder has a certain degree of stress sensitivity, but the difference in sampling direction is not significant. The stress intensity factor K in Paris model does not directly reflect the relationship between the material direction and the stress ratio and da/dN. Therefore, a driving force parameter (DFP) proposed by Hu et al. [25] was adopted to replace K, and the traditional Paris model was modified by considering the influence of material direction and stress ratio. The construction of the DFP model combined the cyclic crack tip opening displacement (CCTOD, Δδ) with the stress ratio and elastic strain energy release rate criteria proposed by Griffith, which can converge the FCG data of the same material into a narrow band.
The correlation between the cyclic crack tip opening displacement and the FCG rate can be expressed as:
da / dN = f   m · Δ δ ,
where m stands for material parameter and f represents function symbol. According to Griffith’s energy release theory, the energy release rate G is equal to the surface energy of the new surface caused by FCG. As we all know, G and stress intensity factor K have the following relationship:
G = K 2 / E ,
where E′ is the equivalent modulus. In terms of plane stress and plane strain, the expression of E′ is shown in Equation (6):
E = E in plane stress E / 1 v 2 in plane strain ,
where E is young’s modulus and v represents Poisson’s ratio of the material. On the basis of the relationship between the stress ratio R and the stress intensity factor range ΔK, combined with Equation (5), the calculation equation of the energy release rate range ΔG can be obtained as follows:
Δ G =   Δ K 2 1 + R E 1 R ,
In order to solve the relationship between the CTOD and the working stress and crack size of the member under the elastic-plastic condition, Dugdale proposed the D-M model [26]. The model assumes that the plastic zone at the crack tip of an infinitely wide, thin plate with penetrating cracks is in the shape of a flat ribbon under uniaxial tensile stress. The yield stress σ s is uniformly distributed in the plastic zone. At the end of the plastic zone, the stress has no singularity and the stress intensity factor is equal to zero. J integral theory is widely used to solve the elastoplastic fracture of materials. As an important fracture parameter, J integral can reflect the singular strength of stress-strain field at the crack tip in the elastic-plastic field. In the D-M model, combined with the path independence of J integral, the J can be calculated using Equation (8):
J = σ S δ ,
If and only if under the condition of linear elastic fracture mechanics, the J integral is equal to the energy release rate G, that is, J = G. Therefore, substituting Equation (7) into Equation (8), it can be further obtained:
Δ δ = Δ J σ s = Δ K 2 1 + R E 1 R σ s ,
Since the material parameter m is closely related to the plastic zone of crack tip, m is assigned as the square root of the plastic zone size of the fatigue crack tip, that is, m = r c 1 / 2 . According to linear elastic fracture mechanics and based on the assumption of plane stress or plane strain, the calculation of r c is shown in Equation (10).
r c = 1 π Δ K σ s 2 in plane stress 1 π Δ K σ s 2 1 2 v 2 in plane strain ,
Based on the above analysis and derivation, the DFP model can be determined as follows:
da / dN = f Δ κ # Δ κ # = Δ K 2 r c 1 / 2 1 + R / E σ s 1 + R ,
Compared with the Paris model, the basic forms of the two models were consistent. The DFP model only presented a parametric expression based on the stress intensity factor K. The experimental data obtained in current work was utilized to check the fitness of DFP model for the investigated materials. Based on the previous research results, the yield stresses and the Young’s modulus of the HDL, HDT, CFL, CFT, and BM are listed in Table 4 [18]. It can be found that the yield stress of BM was obviously lower than those of HD and CF materials by 30.9–42.1% approximately. The yield stress was considered to be associated with the grain size, grain boundaries, and so on [27]. Compared with the HD and CF materials, the grain size of BM was sharply large, leading to a reduction in the yield stress of BM. At the same time, the weakened yield stress of BM was also related to the relatively large residual stress/strain in the martensite of BM as shown in Figure 16a. The interfaces of martensite and ferrite in BM became the favorable sites for the initiation and propagation of cracks. Under the plane stress condition, two models were used to fit the specimen data of different materials with different stress ratios (0.1 and 0.5) and sampling direction. The results given by Paris model and DFP model are compared in Figure 17a,b.
The three regions of FCG can be observed in both models in Figure 17. However, for Paris model, the transition point between the stable and unstable regions was dependent on the test conditions such as the mechanical and thermal processes and stress ratio. The transition points between the stable and unstable regions were of great significance for predicting fatigue fracture behaviors, indicating fatigue crack was about to enter the fracture stage with rapid growth rate. For the DFP model, there were similar transition points from stable to unstable region under different conditions (the mechanical and thermal processes and stress ratios). The transition point value was 10−6 mm. This indicates that when Δ κ # approaches 10−6 mm, the material will enter into the phase of rapid fatigue crack growth, which is of great significance for engineering applications. The experimental data of R = 0.3 of each material were fitted under the DFP model, and the results were consistent with the above conclusions, as shown in Figure 17c.

5. Conclusions

In this paper, the FCG behavior of 34CrMo4 cylinder formed by hot drawing and cold flow was studied. The effects of the mechanical and thermal processes, stress ratio and sampling direction on FCG rate were investigated by means of FCG test and microanalysis. In addition, the DFP model was compared with Paris model in terms of fitting results. Here were a summary of the following:
  • Compared with the BM, the 34CrMo4 steel cylinder after hot drawing, cold flow forming and heat treatment processes had better crack growth resistance. Among them, the CF cylinder was superior to the HD cylinder.
  • The stress ratio had a slight influence on the FCG rate of the 34CrMo4 steel cylinder. For the same material, the FCG rate increased with the increased of the stress ratio. However, under the same conditions of material and stress ratio, the FCG characteristics of the longitudinal and transverse specimens showed consistency.
  • Different from the traditional Paris model, the DFP model can provide a unified fracture failure early warning parameter for HD, CF and BM materials under different stress ratios and sampling directions. The determination of this parameter had important reference value for preventing fatigue fracture of materials in the actual engineering environment.

Author Contributions

Conceptualization: X.X. and Y.L.; methodology: X.X. and C.L.; validation: X.M. and W.J.; formal analysis: C.L.; investigation: X.X.; data curation: X.X.; writing—original draft preparation: X.X.; writing—review and editing: C.L. and W.J.; supervision: X.M.; funding acquisition: Y.L. All authors have read and agreed to the published version of the manuscript.

Funding

This research was funded by National Natural Science Foundation of China, grant number 51605435.

Institutional Review Board Statement

Not applicable.

Informed Consent Statement

Not applicable.

Data Availability Statement

The data presented in this study are available on request from the corresponding author.

Conflicts of Interest

The authors declare no conflict of interest.

References

  1. Jin, W.; Li, Y.; Zhou, M.; Gao, Z. Reliability study on a new integrity pressure relief device in nonrefillable. Steel gas cylinder. J. Press. Vessel Technol. Trans. ASME 2018, 140, 051602. [Google Scholar] [CrossRef]
  2. Kingklang, S.; Daodon, W.; Uthaisangsuk, V. Failure investigation of liquefied petroleum gas cylinder using FAD and XFEM. Int. J. Pressure Vessels Pip. 2019, 171, 69–78. [Google Scholar] [CrossRef]
  3. Mirzaei, M. Failure analysis of an exploded gas cylinder. Eng. Fail. Anal. 2008, 15, 820–834. [Google Scholar] [CrossRef]
  4. Alvino, A.; Antonini, A.; Lega, D. Failure analysis on a fractured 34CrMo4 steel high pressure cylinder filled with a mixture of inert gases. Eng. Fail. Anal. 2014, 38, 49–57. [Google Scholar] [CrossRef]
  5. Bultel, H.; Vogt, J.B. Influence of heat treatment on fatigue behaviour of 4130 AISI steel. In Proceedings of the 10th International Fatigue Conference, Prague, Czech Republic, 6–11 June 2010. [Google Scholar] [CrossRef] [Green Version]
  6. Arola, D.; Williams, C.L. Estimating the fatigue stress concentration factor of machined. Int. J. Fatigue 2002, 24, 923–930. [Google Scholar] [CrossRef]
  7. Macadre, A.; Artamonov, M.; Matsuoka, S.; Furtado, J. Effects of hydrogen pressure and test frequency on fatigue crack growth properties of Ni–Cr–Mo steel candidate for a storage cylinder of a 70MPa hydrogen filling station. Eng. Fract. Mech. 2011, 78, 3196–3211. [Google Scholar] [CrossRef]
  8. Colombo, C.; Fumagalli, G.; Bolzoni, F.; Gobbi, G.; Vergani, L. Fatigue behavior of hydrogen pre-charged low alloy Cr–Mo steel. Int. J. Fatigue 2016, 83, 2–9. [Google Scholar] [CrossRef]
  9. Cain, V.; Thijs, L.; Van Humbeeck, J.; Van Hooreweder, B.; Knutsen, R. Crack propagation and fracture toughness of Ti6Al4V alloy produced by selective laser melting. Addit. Manuf. 2015, 5, 68–76. [Google Scholar] [CrossRef]
  10. Suryawanshi, J.; Prashanth, K.G.; Ramamurty, U. Mechanical behavior of selective laser melted 316L stainless steel. Mater. Sci. Eng. Struct. Mater. Prop. Microstruct. Process. 2017, 696, 113–121. [Google Scholar] [CrossRef]
  11. Noroozi, A.; Glinka, G.; Lambert, S. A study of the stress ratio effects on fatigue crack growth using the unified two-parameter fatigue crack growth driving force. Int. J. Fatigue 2007, 29, 1616–1633. [Google Scholar] [CrossRef]
  12. Silva, F.S. Crack closure inadequacy at negative stress ratios. Int. J. Fatigue 2004, 26, 241–252. [Google Scholar] [CrossRef]
  13. Mousavinasab, S.; Blais, C. Role of microstructure heterogeneity on fatigue crack propagation of low-alloyed PM steels in the As-sintered condition. Metals 2017, 7, 60. [Google Scholar] [CrossRef]
  14. BS EN 10083-3. Steels for Quenching and Tempering—Part. 3: Technical Delivery Conditions for Alloy. Steels; British Standards Institution: London, UK, 2006. [Google Scholar]
  15. Jin, W.; Li, Y.; Gao, Z.; Yin, X.; Ma, X. Reliability analysis of integral hot deep drawing and cold flow forming process for large-diameter seamless steel gas cylinders. Int. J. Adv. Manuf. Technol. 2018, 97, 189–197. [Google Scholar] [CrossRef]
  16. Shahani, A.R.; Kashani, H.M.; Rastegar, M.; Dehkordi, M.B. A unified model for the fatigue crack growth rate in variable stress ratio. Fatigue Fract. Eng. Mater. Struct. 2009, 32, 105–118. [Google Scholar] [CrossRef]
  17. Li, L.; Yang, Y.; Xu, Z.; Chen, G.; Chen, X. Fatigue crack growth law of API X80 pipeline steel under various stress ratios based on J-integral. Fatigue Fract. Eng. Mater. Struct. 2014, 37, 1124–1135. [Google Scholar] [CrossRef]
  18. Li, Y.; Fang, W.; Lu, C.; Gao, Z.; Ma, X.; Jin, W.; Ye, Y.; Wang, F. Microstructure and mechanical properties of 34CrMo4 steel for gas cylinders formed by hot drawing and flow forming. Materials 2019, 12, 1351. [Google Scholar] [CrossRef] [Green Version]
  19. Nakanishi, D.; Kawabata, T.; Aihara, S. Brittle crack propagation resistance inside grain and at high angle grain boundary in 3% Si-Fe alloy. Acta Mater. 2018, 144, 768–776. [Google Scholar] [CrossRef]
  20. Wang, X.; Zhang, C.; Cui, X.; Zhang, S.; Chen, J.; Zhang, J. Microstructure and mechanical behavior of additive manufactured Cr–Ni–V low alloy steel in different heat treatment. Vacuum 2020, 175, 109216. [Google Scholar] [CrossRef]
  21. Sun, L.; Li, M.; Li, H. Dynamic recrystallization-related interface phase boundary migration of TC17/TC4 bond with initial equiaxed microstructure. JOM J. Miner. Met. Mater. Soc. 2019, 71, 2253–2261. [Google Scholar] [CrossRef]
  22. Wang, Y.; Ma, E. Three strategies to achieve uniform tensile deformation in a nanostructured metal. Acta Mater. 2004, 52, 1699–1709. [Google Scholar] [CrossRef]
  23. He, Y.; Lu, C.; Liu, S.; Zheng, W.; Luo, J. Interfacial incompatibility and internal stresses in all-solid-state lithium ion batteries. Adv. Energy Mater. 2019, 9, 1901810. [Google Scholar] [CrossRef]
  24. Liu, K.; Li, Y.; Yang, J.; Liu, Y.; Yao, Y. Generative principal component thermography for enhanced defect detection and analysis. IEEE T. Instrum. Meas. 2020, 69, 8261–8269. [Google Scholar] [CrossRef]
  25. Hu, X.; Xue, Z.; Ren, T.; Jiang, Y.; Dong, C.; Liu, F. On the fatigue crack growth behaviour of selective laser melting fabricated Inconel 625: Effects of build orientation and stress ratio. Fatigue Fract. Eng. Mater. Struct. 2020, 43, 771–787. [Google Scholar] [CrossRef]
  26. Dugdale, D.S. Stiffness of a spinning disc clamped at its centre. J. Mech. Phys. Solids 1966, 14, 349–356. [Google Scholar] [CrossRef]
  27. Richeton, T.; Wagner, F.; Chen, C.; Toth, L. Combined effects of texture and grain size distribution on the tensile behavior of α-titanium. Materials 2018, 11, 1088. [Google Scholar] [CrossRef] [Green Version]
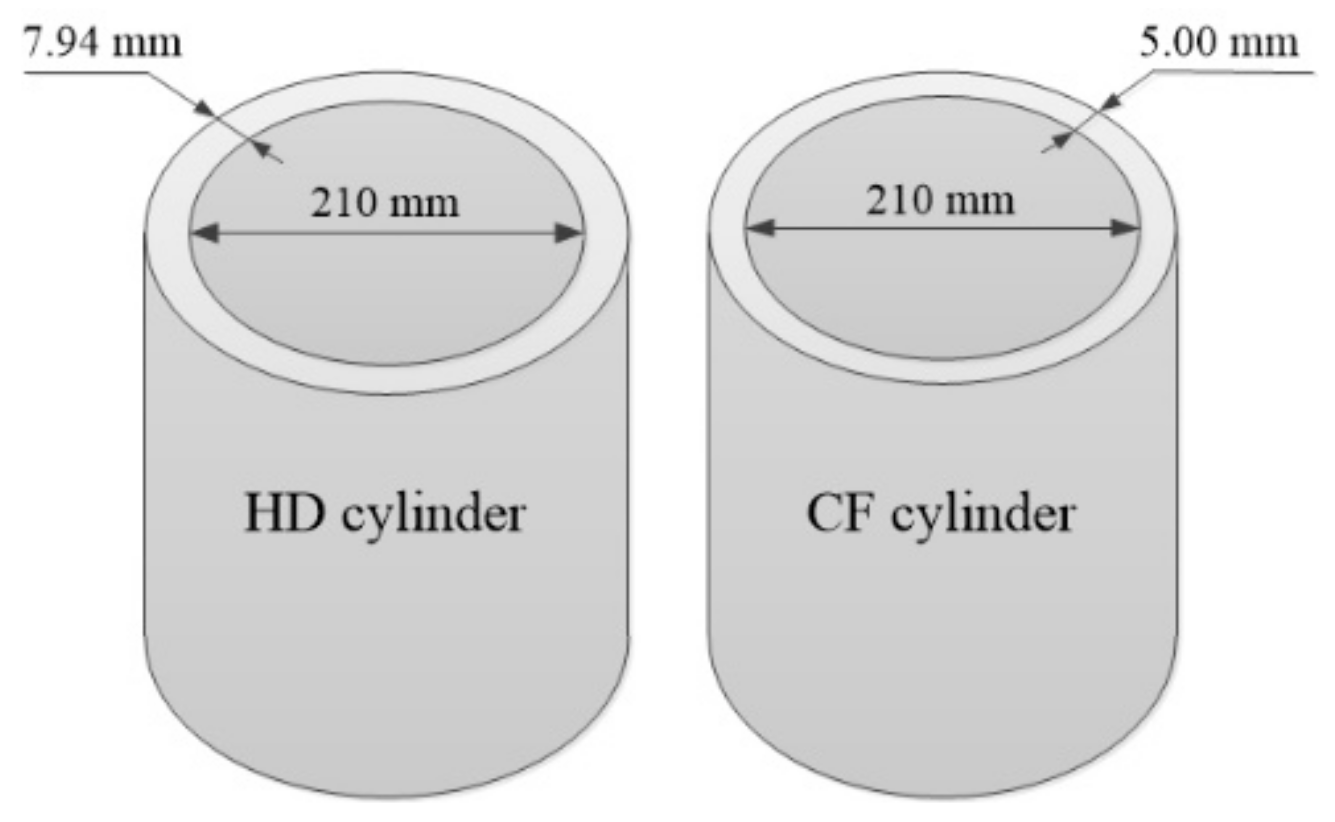
Figure 1. Gas cylinders with a diameter of 210 mm used in this work.
Metals 11 00133 g001
Figure 2. Dimensions of CT specimen (mm).
Metals 11 00133 g002
Figure 3. CT specimen sampling.
Metals 11 00133 g003
Figure 4. Metallographic structure sampling.
Metals 11 00133 g004
Figure 5. Test setup.
Metals 11 00133 g005
Figure 6. FCG rates of specimens under different stress ratios: (a) BM; (b) HDL; (c) HDT; (d) CFL; (e) CFT.
Metals 11 00133 g006
Figure 7. Comparison of FCG rates of five different specimens under the same stress ratio: (a) stress ratio is 0.1; (b) stress ratio is 0.3; (c) stress ratio is 0.5.
Metals 11 00133 g007
Figure 8. Microstructures for (a) BM, (b) HDT, (c) HDL, (d) CFT, and (e) CFL.
Metals 11 00133 g008
Figure 9. Macroscopic fracture morphology of five specimens.
Metals 11 00133 g009
Figure 10. The fracture surface microtopography in the stable growth region: (a,b) BM; (c,d) HDL; (e,f) HDT; (g,h) CFL and (i,j) CFT.
Metals 11 00133 g010
Figure 11. The fracture surface microtopography in the unstable region for (a) BM, (b) HDL, (c) HDT, (d) CFL, and (e) CFT.
Metals 11 00133 g011
Figure 12. The cross-section fracture morphologies of (a) BM; (b) HDL; (c) HDT; (d) CFL, and (e) CFT.
Metals 11 00133 g012
Figure 13. The orientation maps for (a) BM, (b) HDL, (c) HDT, (d) CFL, and (e) CFT.
Metals 11 00133 g013
Figure 14. The grain boundary maps for (a) BM, (b) HDL, (c) HDT, (d) CFL, and (e) CFT.
Metals 11 00133 g014
Figure 15. The misorientation distributions of grain boundaries of BM, HDL, HDT, CFL, and CFT.
Metals 11 00133 g015
Figure 16. The local misorientation maps for (a) BM, (b) HDL, (c) HDT, (d) CFL, and (e) CFT.
Metals 11 00133 g016
Figure 17. Fitting the FCG rate of different materials with (a) Paris model, (b) DFP model, (c) DFP model at R = 0.3.
Metals 11 00133 g017
Table 1. The chemical composition of 34CrMo4 steel (%, mass fraction).
SymbolElement
CSiMnSPCrMoNiAlFe
Measured0.360.230.710.0030.0121.060.230.0440.022Bal.
BS EN 10083-30.30~0.37Max. 0.400.60~0.90Max. 0.035Max. 0.0250.90~1.200.15~0.30---
Table 2. Test conditions.
SpecimenSerial NumberR-RatioΔP (N)Pmax (N)a0 (mm)af (mm)
BMBM10.1130014449.0016.94
BM20.2130018579.0017.39
BM30.3130026009.0016.37
HD-LHDL10.1240026679.3217.84
HDL20.2200028579.1817.70
HDL30.3130026009.1218.10
HD-THDT10.1130014449.1619.21
HDT20.2110015719.6619.23
HDT30.3105021009.2518.39
CF-LCFL10.1260028899.3917.98
CFL20.2190027149.1018.10
CFL30.3135027009.2018.20
CF-TCFT10.1150016679.0619.68
CFT20.2150021439.0718.40
CFT30.3120024009.1217.90
Note: ΔP—load range, Pmax—maximum load, a0—distance between the notch root and the line of action of the externally applied load, af—crack length measured from the notch root at the termination of test.
Table 3. Constants for the Paris model.
SpecimenSerial NumberR-RatioCmCorrelation Coefficient
BMBM10.14.4308 × 10103.68890.9849
BM20.23.5962 × 1093.20950.9980
BM30.32.1855 × 1093.39110.9973
HD-LHDL10.16.5941 × 1082.34340.9930
HDL20.27.8444 × 1082.34170.9928
HDL30.34.3638 × 1082.53250.9956
HD-THDT10.15.2208 × 1082.39480.9962
HDT20.23.6414 × 1082.56430.9950
HDT30.33.5730 × 1082.58320.9919
CF-LCFL10.13.4574 × 1093.04410.9974
CFL20.21.2096 × 1072.21950.9936
CFL30.37.1953 × 1082.37750.9963
CF-TCFT10.11.1386 × 1072.18320.9971
CFT20.21.3554 × 1072.17960.9974
CFT30.36.8393 × 1082.40130.9943
Table 4. The tensile properties of five specimens.
SpecimenBMHDLHDTCFLCFT
Yield stress σ s (MPa)67411429881164975
Young’s modulus E (GPa)200228223215211
Publisher’s Note: MDPI stays neutral with regard to jurisdictional claims in published maps and institutional affiliations.