Article

Effect of Asymmetric Material Flow on the Microstructure and Mechanical Properties of 5A06 Al-Alloy Welded Joint by VPPA Welding

1
Engineering Research Centre of Advanced Manufacturing Technology for Automotive Components Ministry of Education, Faculty of Materials and Manufacturing, Beijing University of Technology, Beijing 100124, China
2
China Academy of Space Technology Department of Spacecraft Environmental Engineering, Beijing 100094, China
3
Department of Chemical and Materials Engineering, University of Alberta, Edmonton, AB T6G 1H9, Canada
4
Laser Institute, Qilu University of Technology (Shandong Academy of Sciences), Jinan 250014, China
*
Author to whom correspondence should be addressed.
Metals 2021, 11(1), 120; https://doi.org/10.3390/met11010120
Submission received: 6 December 2020 / Revised: 2 January 2021 / Accepted: 6 January 2021 / Published: 9 January 2021
(This article belongs to the Special Issue Structure and Properties of Aluminium Alloys)

Abstract

:
The microstructure, texture, and mechanical properties of the asymmetric welded joint in variable polarity plasma arc (VPPA) welding were studied and discussed in this paper. The asymmetric welded joint was obtained through horizontal welding, where the effect of gravity caused asymmetric material flow. The results showed that the grain size and low angle grain boundary (LAGB) at both sides of the obtained welded joint were asymmetric; the grain size differed by a factor of 1.3. The average grain size of the Base Metal (BM), Lower-weld zone (WZ) and Upper-WZ were 25.73 ± 1.25, 37.87 ± 1.89 and 49.92 ± 2.49 µm, respectively. There is discrepancy between the main textures in both sides of the welded joint. However, the effect of asymmetric metal flow on the weld texture was not significant. The micro-hardness distribution was inhomogeneous, the lowest hardness was observed in regions with larger grain sizes and smaller low angle grain boundary. During tensile strength tests, the specimens fractured at the position with the lowest hardness although it has reached 89.2% of the strength of the BM. Furthermore, the effect of asymmetric metal flow and underlying causes of asymmetric weld properties in VPPA horizontal welding have been discussed and analyzed.

1. Introduction

Aluminum alloy as a high-performance metal for producing lightweight equipment is widely used in manufacturing industries to promote energy conservation, emission reduction and highly efficient production [1,2]. Variable Polarity Plasma Arc (VPPA) welding with advantages of high energy beam and variable polarity gas tungsten arc is known as a “zero-defect” process in the medium thickness welding of Al-alloys [3,4]. VPPA vertical-up welding is the most widely used method: gravity assists material flow into the keyhole pool, producing high-quality welded joints. However, in non-vertical-up welding gravity will cause asymmetric molten flow [5,6,7], resulting in an asymmetric weld which can weaken the weld quality. Variable position welding is the bottleneck of VPPA Al alloy welding; the flow of molten pool will be asymmetric because of the change of the angle between gravity direction and welding direction, resulting in the asymmetric thermal field distribution, thus affecting the mechanical properties of welding joints [2,6,7].
Recently, VPPA welding has caught wide attention in manufacturing industries [8,9,10]. In VPPA welding, an axisymmetric high-speed plasma flow can be created after being compressed by circular water-cooled nozzle in which the shrinkage of the tungsten electrode in the circular nozzle is 3.5–4.5 mm [6,7,8,9,10,11,12]. A keyhole molten pool can be formed due to the high energy density of VPPA. The welded joint of VPPA welding with a low distortion rate is benefited by the concentrated heat input and great temperature gradient [13,14]. Keyhole evolution and the metal flow of the weld pool in plasma arc welding have been studied, indicating the high-speed plasma flow benefits weld formation at the rear side [15]. The published works prove the advantages of VPPA in aluminum alloy welding. However, non-vertical-up welding of VPPA should get more attention to widen the application of this technology.
An arc with reduced arc pressure while maintaining the ability to make a stable keyhole in VPPA horizontal welding has been proposed and verified in aluminum plates [6,7]. The optimal welding method and parameters of VPPA flat welding have been analyzed by observing the metal flow using X-ray system and measuring the arc pressure [16,17]. In previous researches, the weld formation and performance during VPPA horizontal welding has been studied by monitoring filler wire positions and torch angles [8,11]. However, the microstructure, texture distribution, and mechanical behavior of non-vertical-up welding have not been studied previously. As the weld quality and properties are the key to evaluating its application value, it is important to understand asymmetric metal flow under the scheme of non-vertical-up welding.
The welded joint quality produced by arc welding depends primarily on accurate positioning of the weld pool [3]. Exploring the microstructure and mechanical properties of welded joints in non-vertical-up welding of VPPA is essential for applying this advanced technology into the manufacture of modern components. Therefore, the texture distribution and grain behavior of the weld in horizontal welding are studied. This work aims to investigate the effect of asymmetric metal flow on microstructure, texture and mechanical properties of the weld of VPPA welding. By studying the difference of the microstructure and mechanical properties of asymmetric welded joints, the influence of asymmetric molten flow on the weld formation can be clarified in this paper, providing the theoretical basis for improving the weld quality of variable position welding.

2. Materials and Methods

2.1. Materials

5xxx Al-alloys with magnesium principal alloying element give substantial increases in good corrosion resistance, machinability and weldability [12,13,14]. It is one of the mostly widely used materials for aerospace, automotive and other industries. 5A06 Al plates with the dimension of 300 mm × 150 mm × 5 mm are selected as the base material in this paper, and the compositions were provided by Weihai Jindi Non-ferrous Metals Co., Ltd. (Weihai, China) [12]. To avoid evitable error during or after the welding process, the wire ER5183 with the diameter of 1.2 mm and the same chemical composition as the base materials is used [11], and the nominal chemical compositions are shown in Table 1.

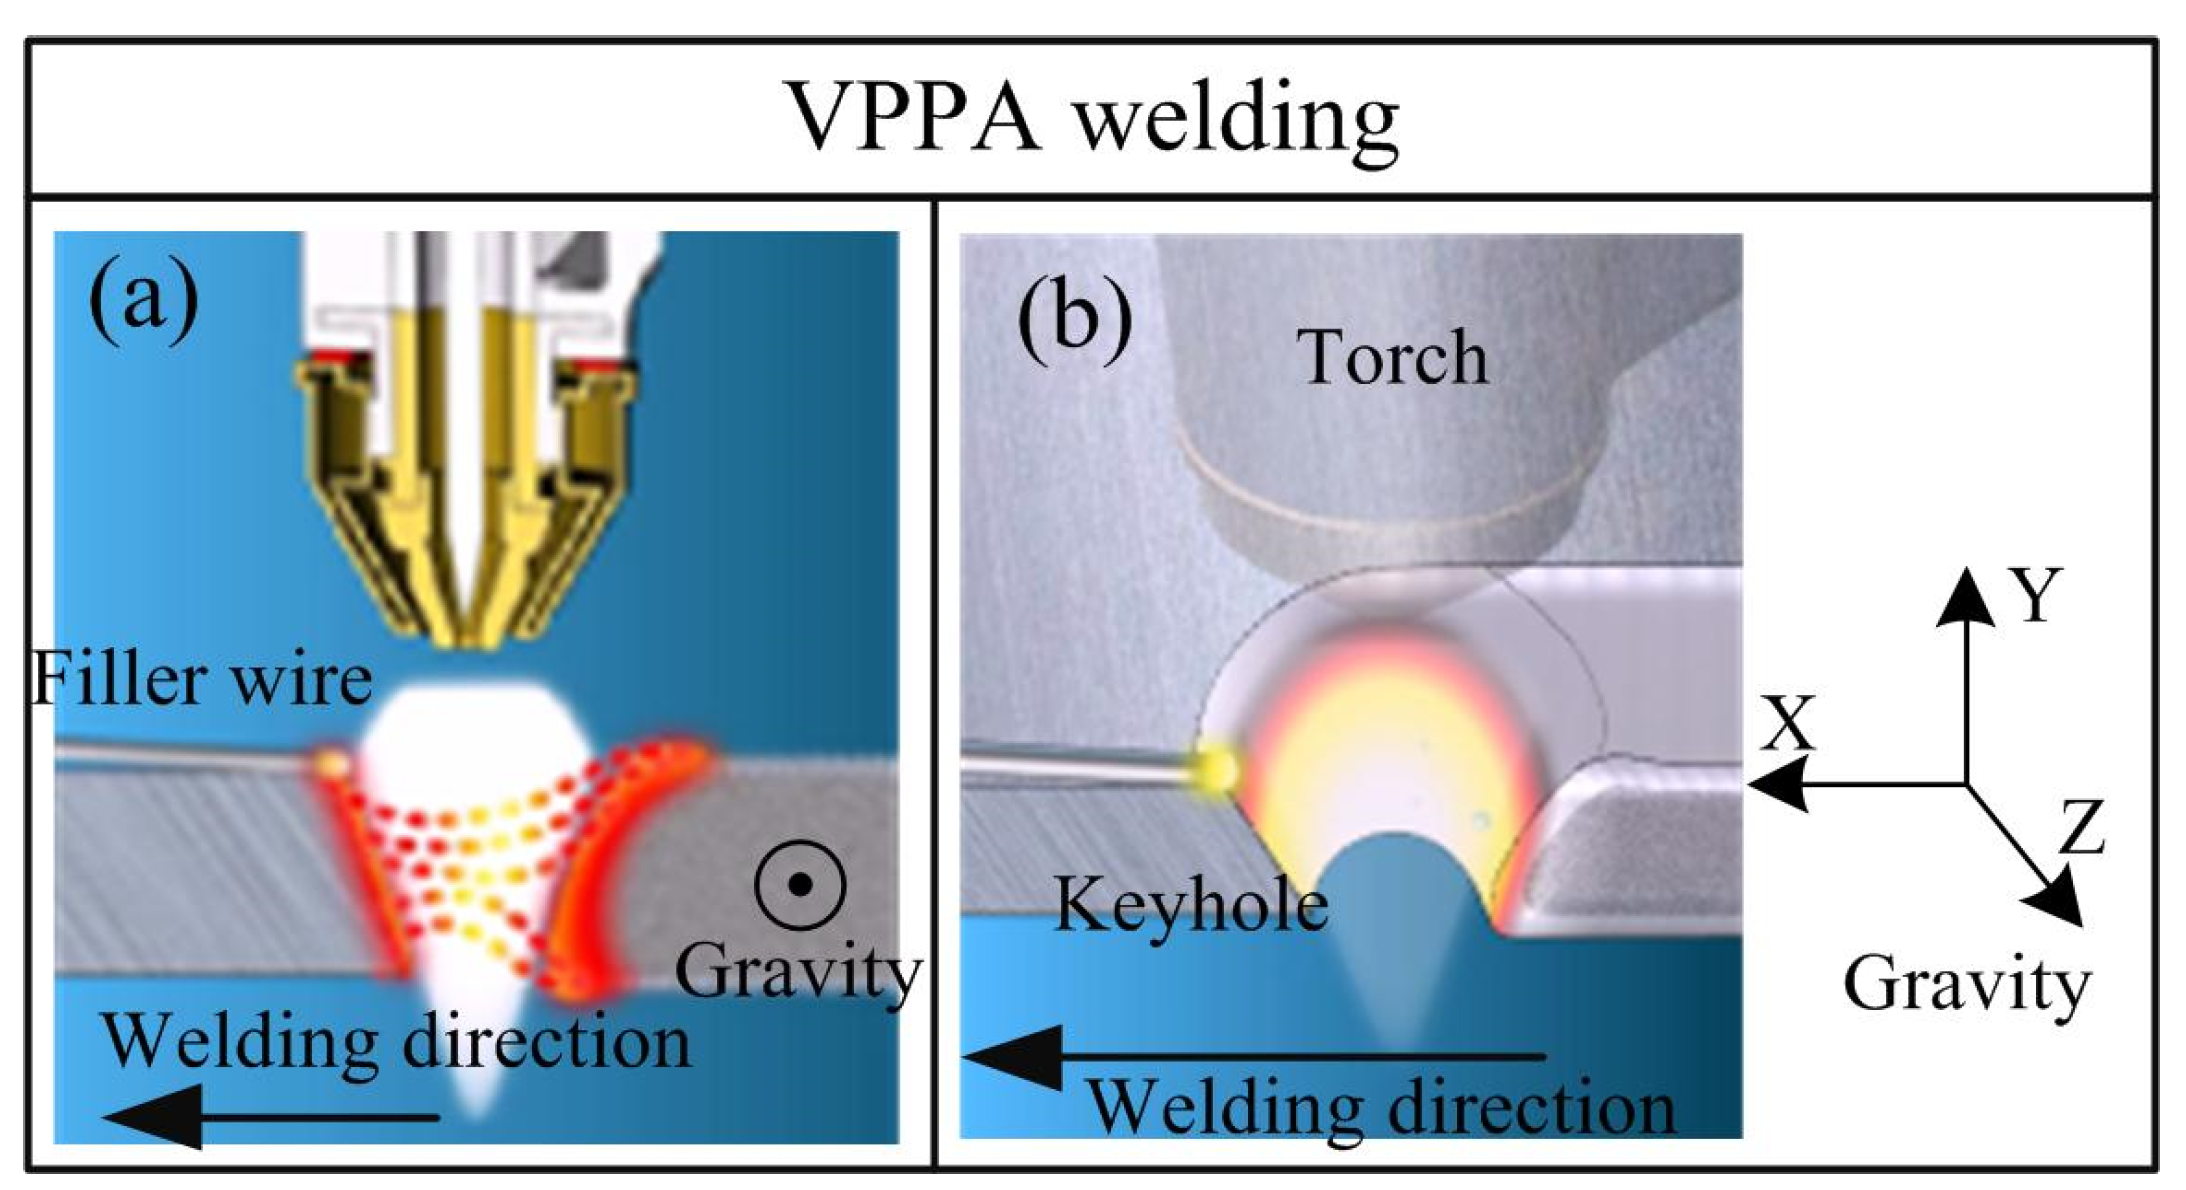
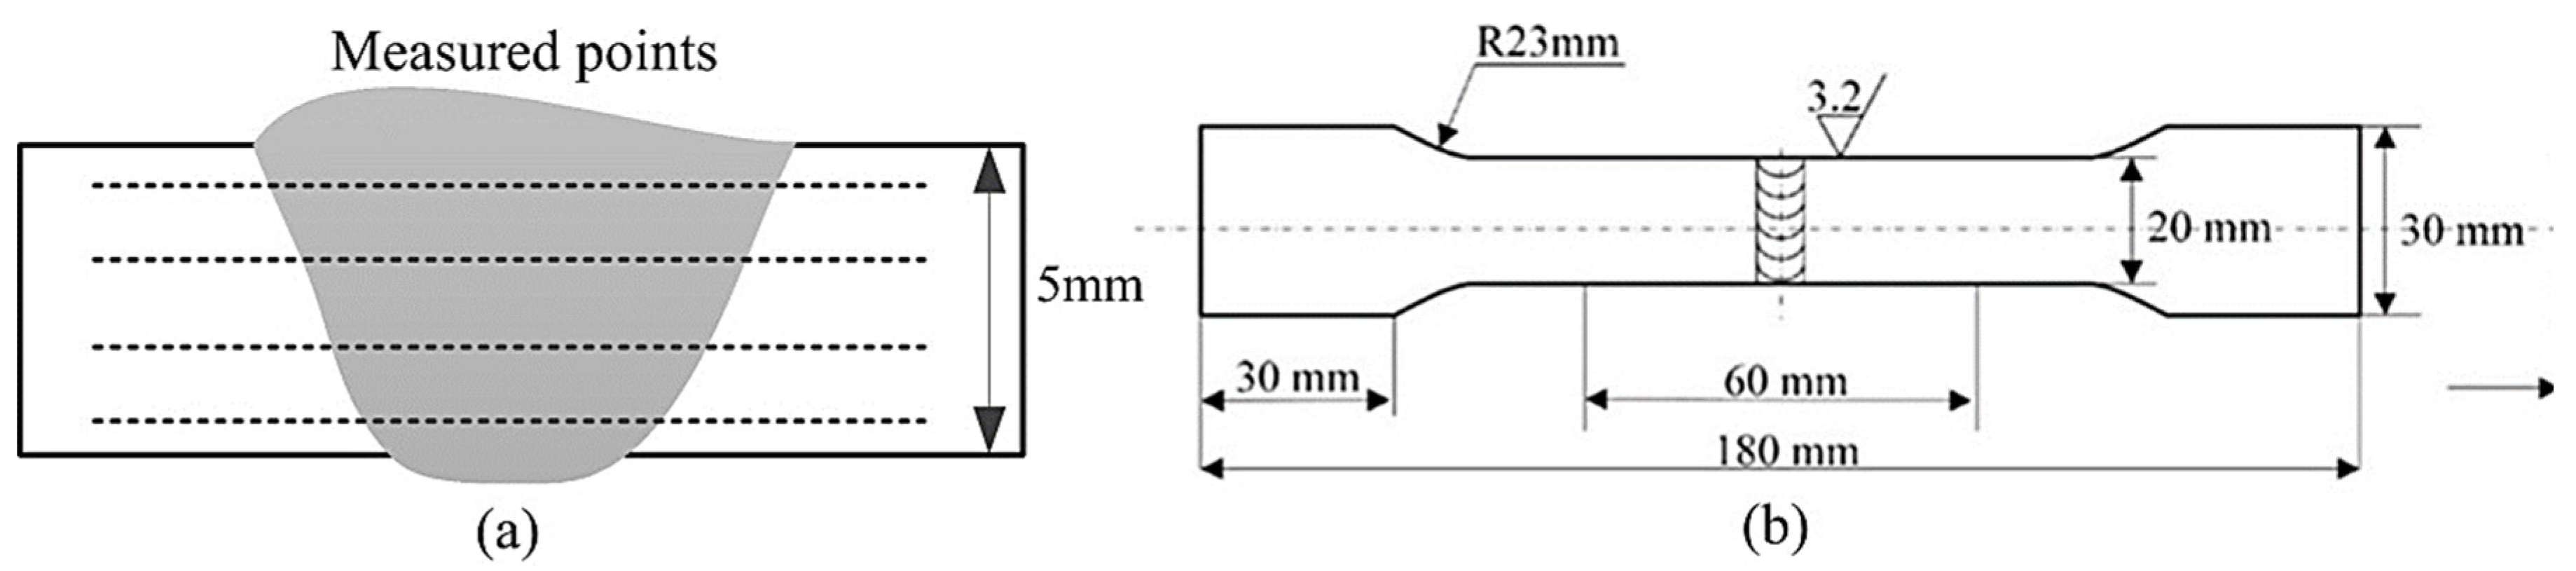
2.2. Experimental Method and Procedure

VPPA welding in horizontal way was conducted to investigate the effect of asymmetric metal flow on the microstructure of Al welded joints. The welding process is shown in Figure 1, the Z axis is the direction of gravity. Generally, the welding direction adopted by VPPA is vertical-up. In vertical-up welding, gravity results in symmetric metal flow on both sides of the keyhole. There is no asymmetry in the formation and mechanical properties of welded joints [3]. In horizontal welding, gravity pushes most of the melted metals to the lower side, resulting in uneven flow of the molten pool. This results in an asymmetric weld and microstructures in the welded joint with poor mechanical properties. To study the effect of asymmetric metal flow on the microstructure and mechanical properties of the welded joint, several steps has been carried out such as acid pickling and oxide removal to eliminate the influence of external factors on the welded joint before VPPA welding [12]. A series of orthogonal tests were performed, a group of test parameters with beautiful appearance and good formation of weld were selected. According to the determined welding parameters, five tests were carried out, and a welding seam was selected to carry out mechanical properties tests after determining the stability of the welding. The main welding parameters including welding current (Direct Current Electrode Negative: DCEN; Direct Current Electrode Positive: DCEP), travel velocity and gas flow rate are shown in Table 2.
To study the effect of asymmetric metal flow on the microstructure and mechanical properties of welded joints, an optical microscope (OM, Olympus LEXT OLS4100, Toyko, Japan) is used to capture pictures of the cross-section of welded joint. Electron Back-Scattered Diffraction (EBSD) (SEM, JSM-7900F, JEOL, Toyko, Japan) is carried out to further study the microstructure, and the weld sample is electro-polished in a solvent consisting of 30% nitric acid (Jiang Yun, Kunming, China) and 70% methanol (Jiang Yun, Kunming, China) for 60 s at a temperature and voltage of −14 °C and 12 V [14,18]. Micro-hardness and tensile strength are used to evaluate the mechanical properties. The micro-hardness is measured with Vicker’s method using a Vicker hardness tester (SCTMC DHV-1000 Hz, Hangzhou Quantum Testing Instrument Co., Ltd., Shanghai, China) with a 200 g (0.2 HV, 1.96 N) load for 15 s (the sampling points are shown in Figure 2a). There are four test lines, the distance between each test line is 1 mm, and the distance between each test point is 0.25 mm. Tensile tests were carried out at room temperature using a universal testing machine INSTRON-5569 (Norwood, MA, USA) under standard NoGBT228-2002 of P.R. China [14]. The size of the dog-bone specimen used to measure the tensile strength is shown in Figure 2b. The results are taken as the average value of three samples.

3. Results

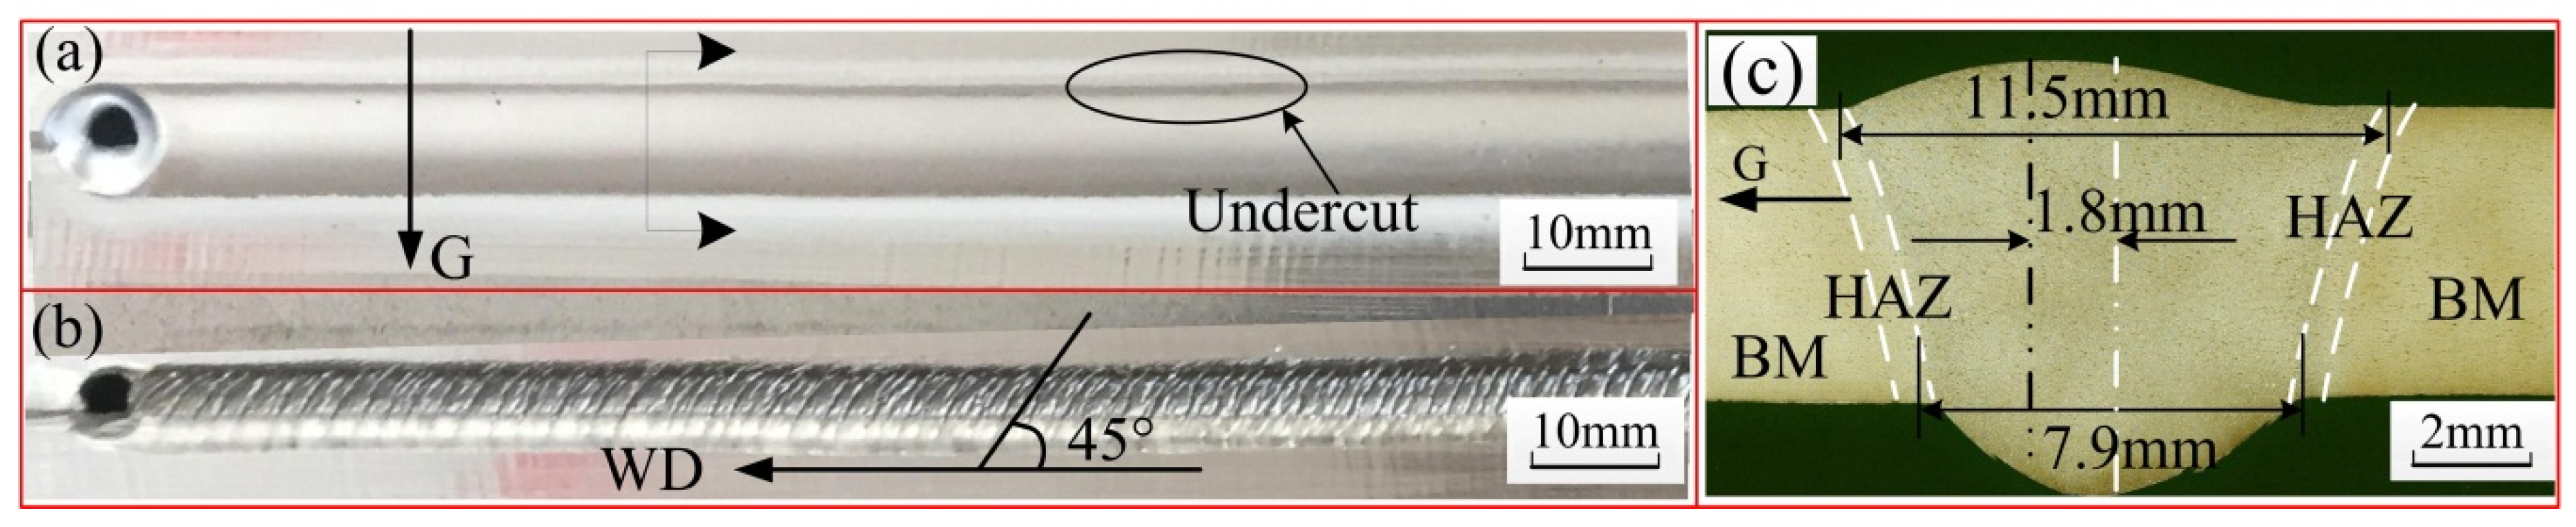
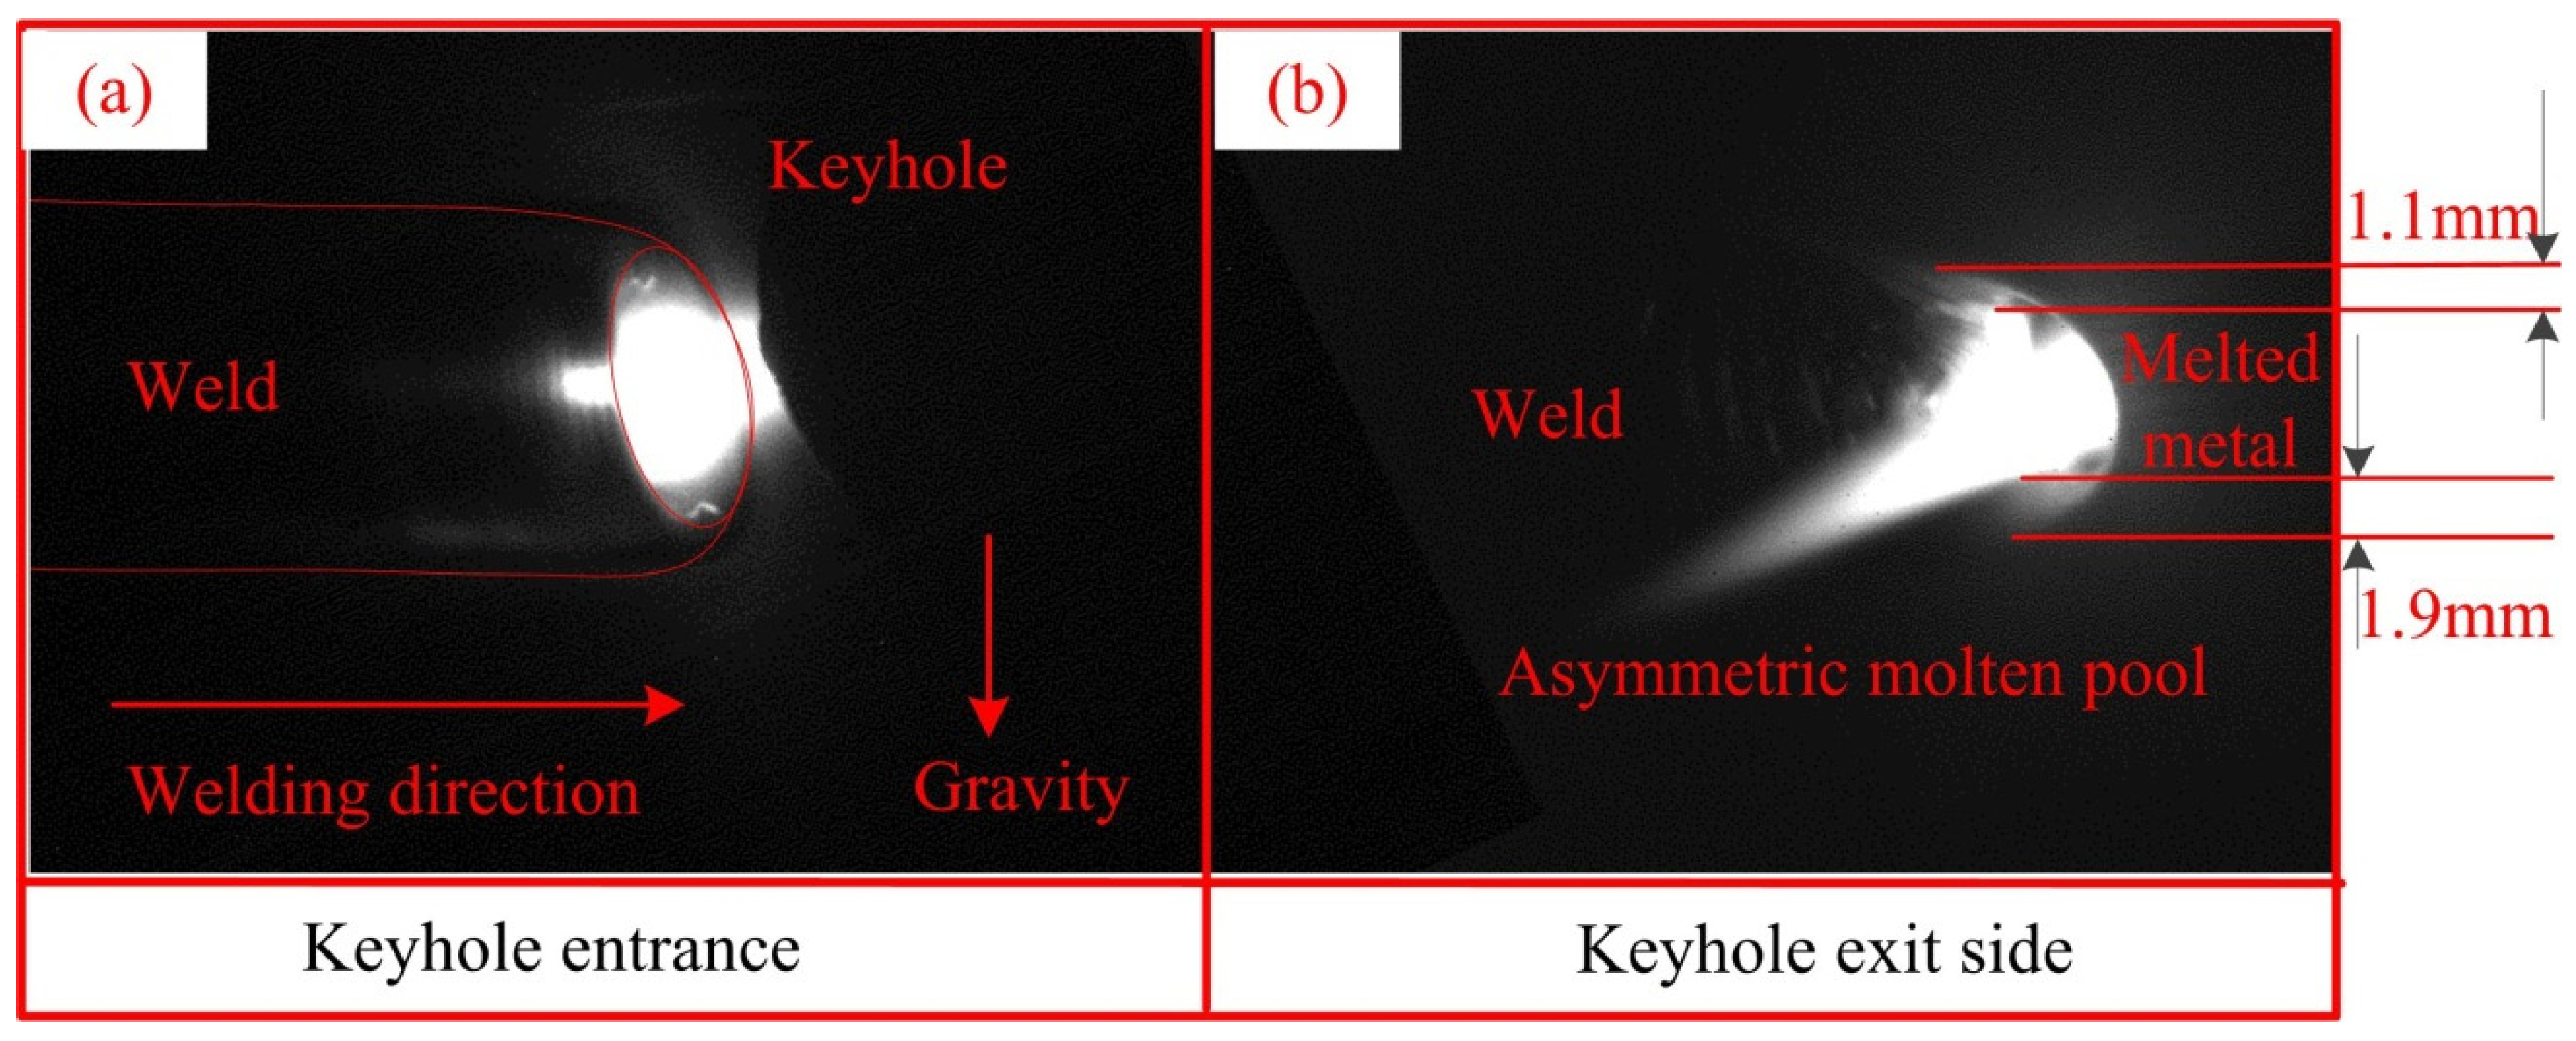
3.1. Weld Appearance

Figure 3 is the weld appearance and weld cross-section. The weld is smooth with high visual quality of the weld surface, as shown in Figure 3a. Generally, the “striae” after solidification during VPPA welding process is perpendicular to welding direction [8,11], however, in this case, the average angle between the “striae” and WD was about 45 degrees, as shown in Figure 3b. This phenomenon was caused by the asymmetric metal flow during horizontal welding. Gravity pushes most of the melted metals to the lower side (the side where the direction of gravity points to the side), resulting in uneven flow of the molten pool and asymmetric weld appearance. The obtained welded joint was asymmetric and the width of the weld surface and root surface were 11.5 and 7.9 mm, respectively. The deviation between the top and bottom center lines was 1.8 mm, as shown in Figure 3c. The deviation mainly happened at the weld surface, as shown in Figure 3c; it was indicated that gravity had little effect on the material flow on the exit side of the keyhole.

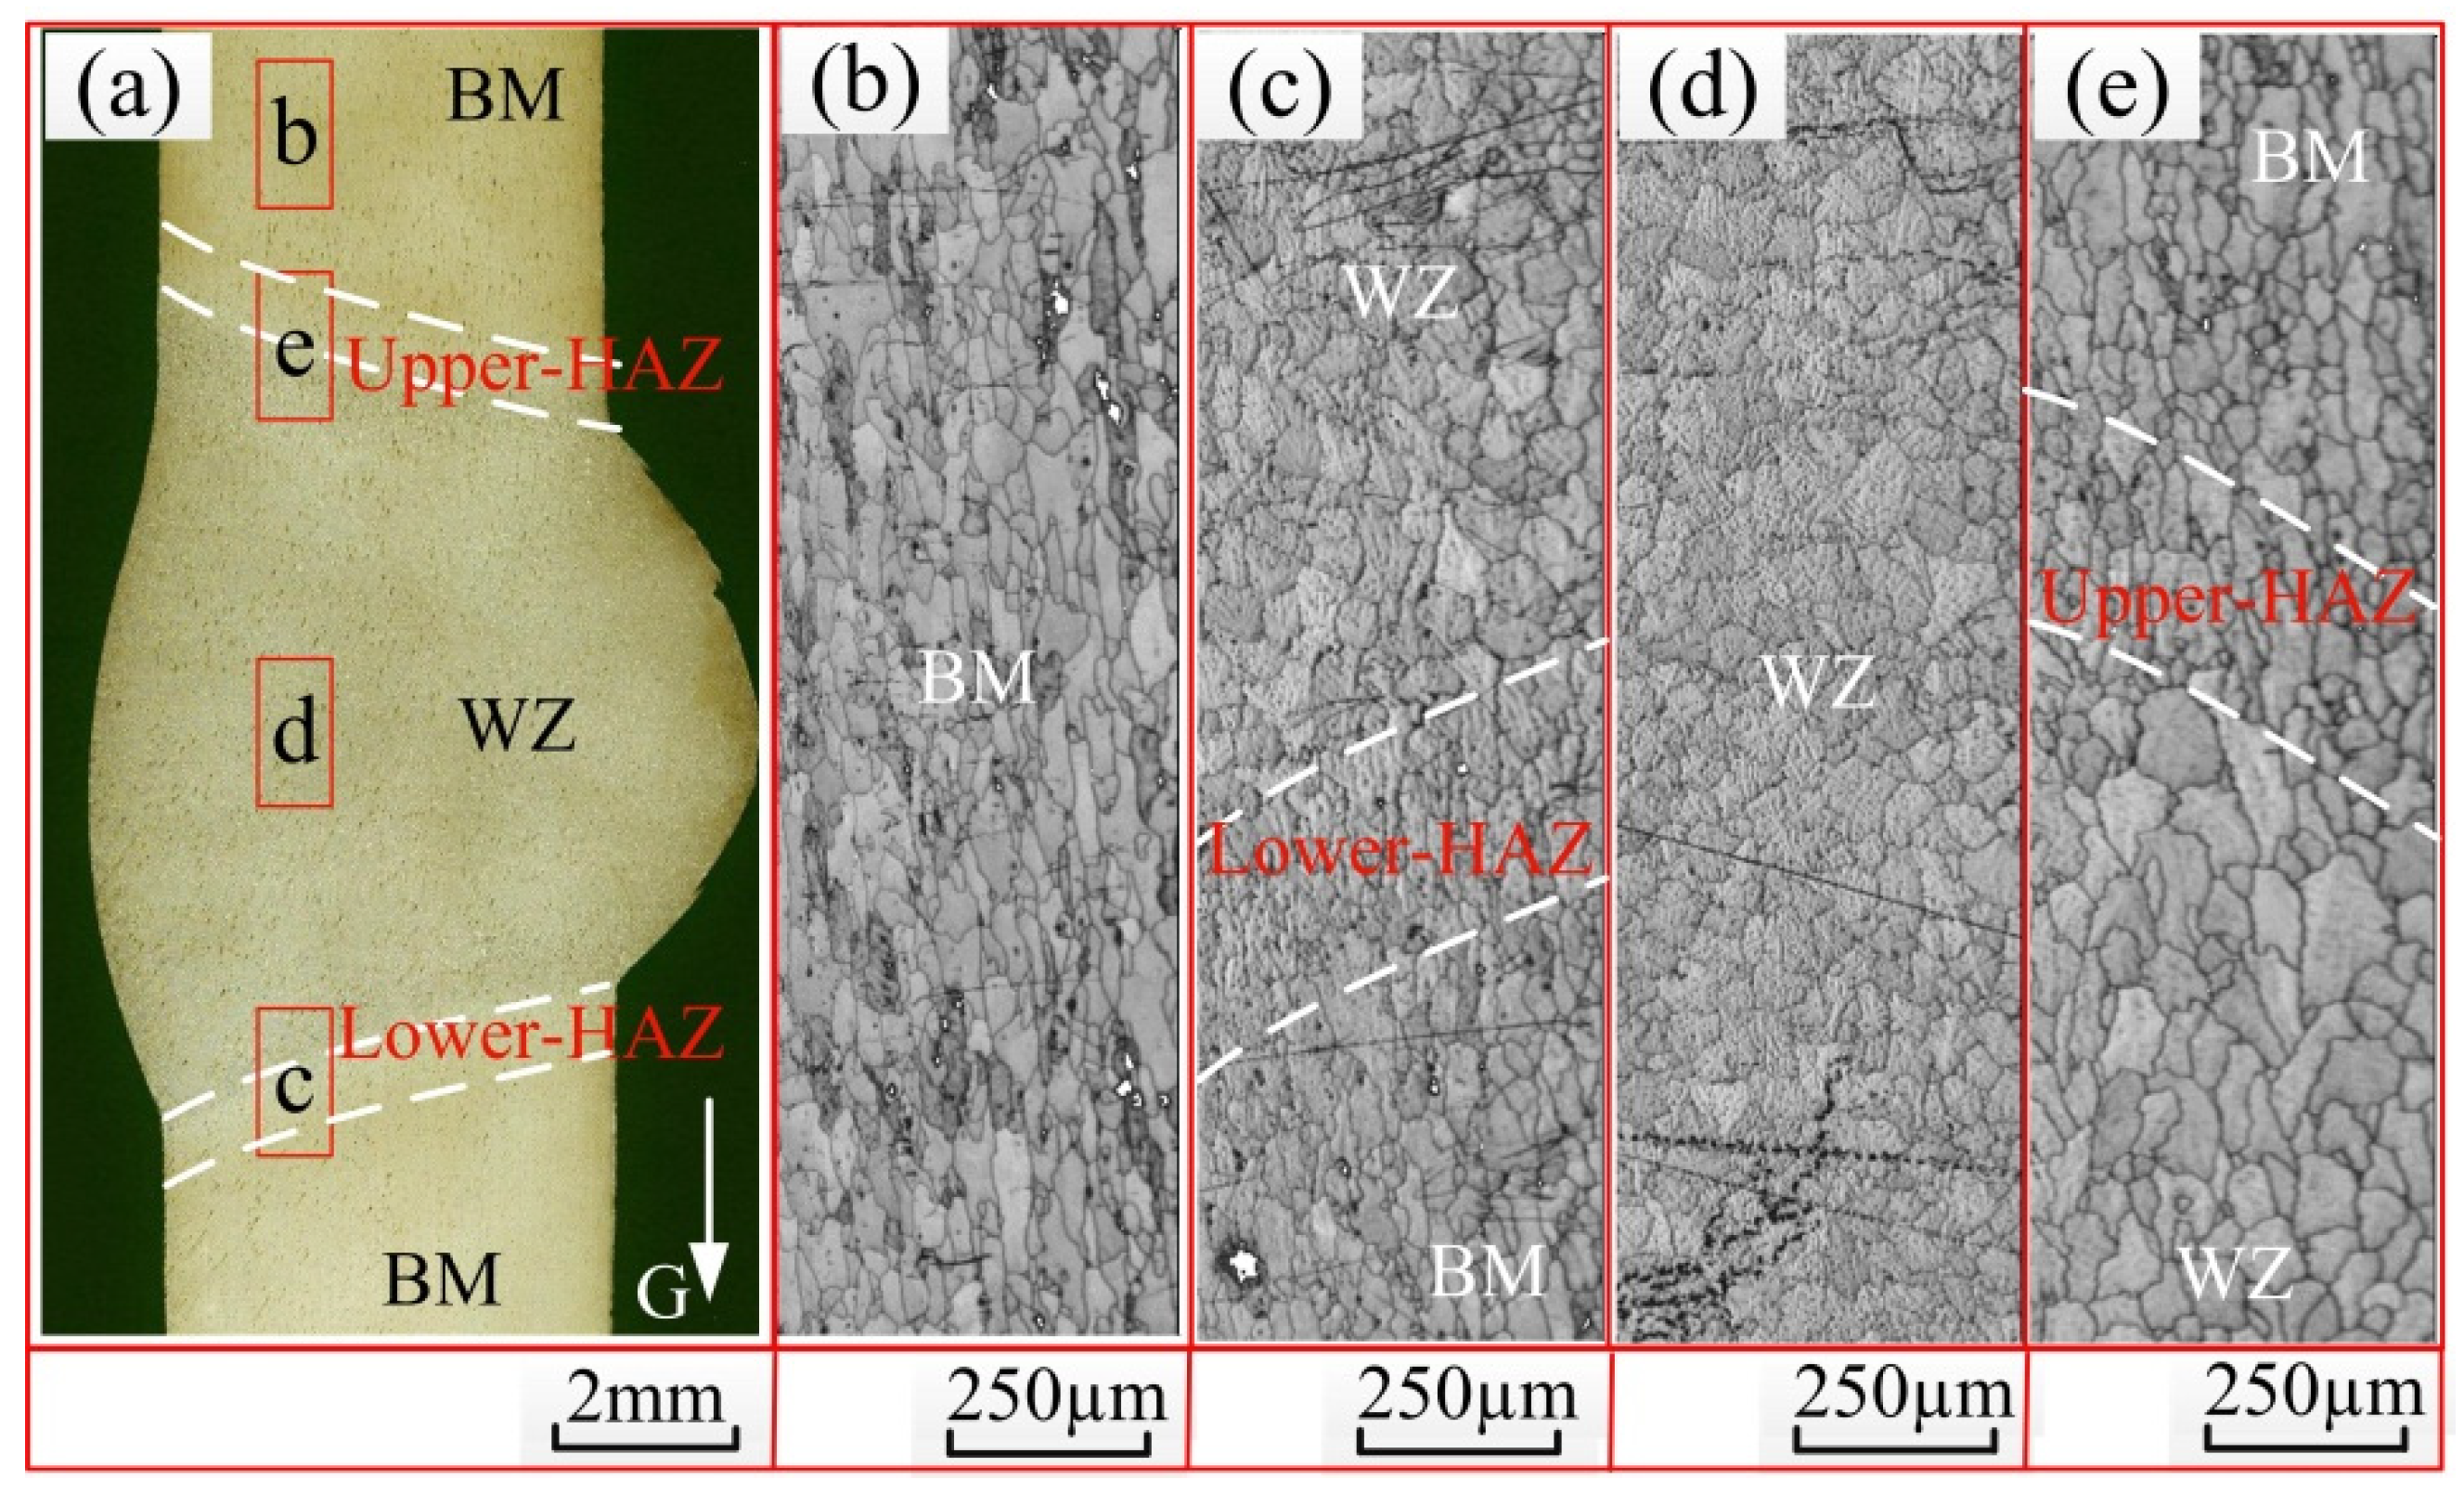
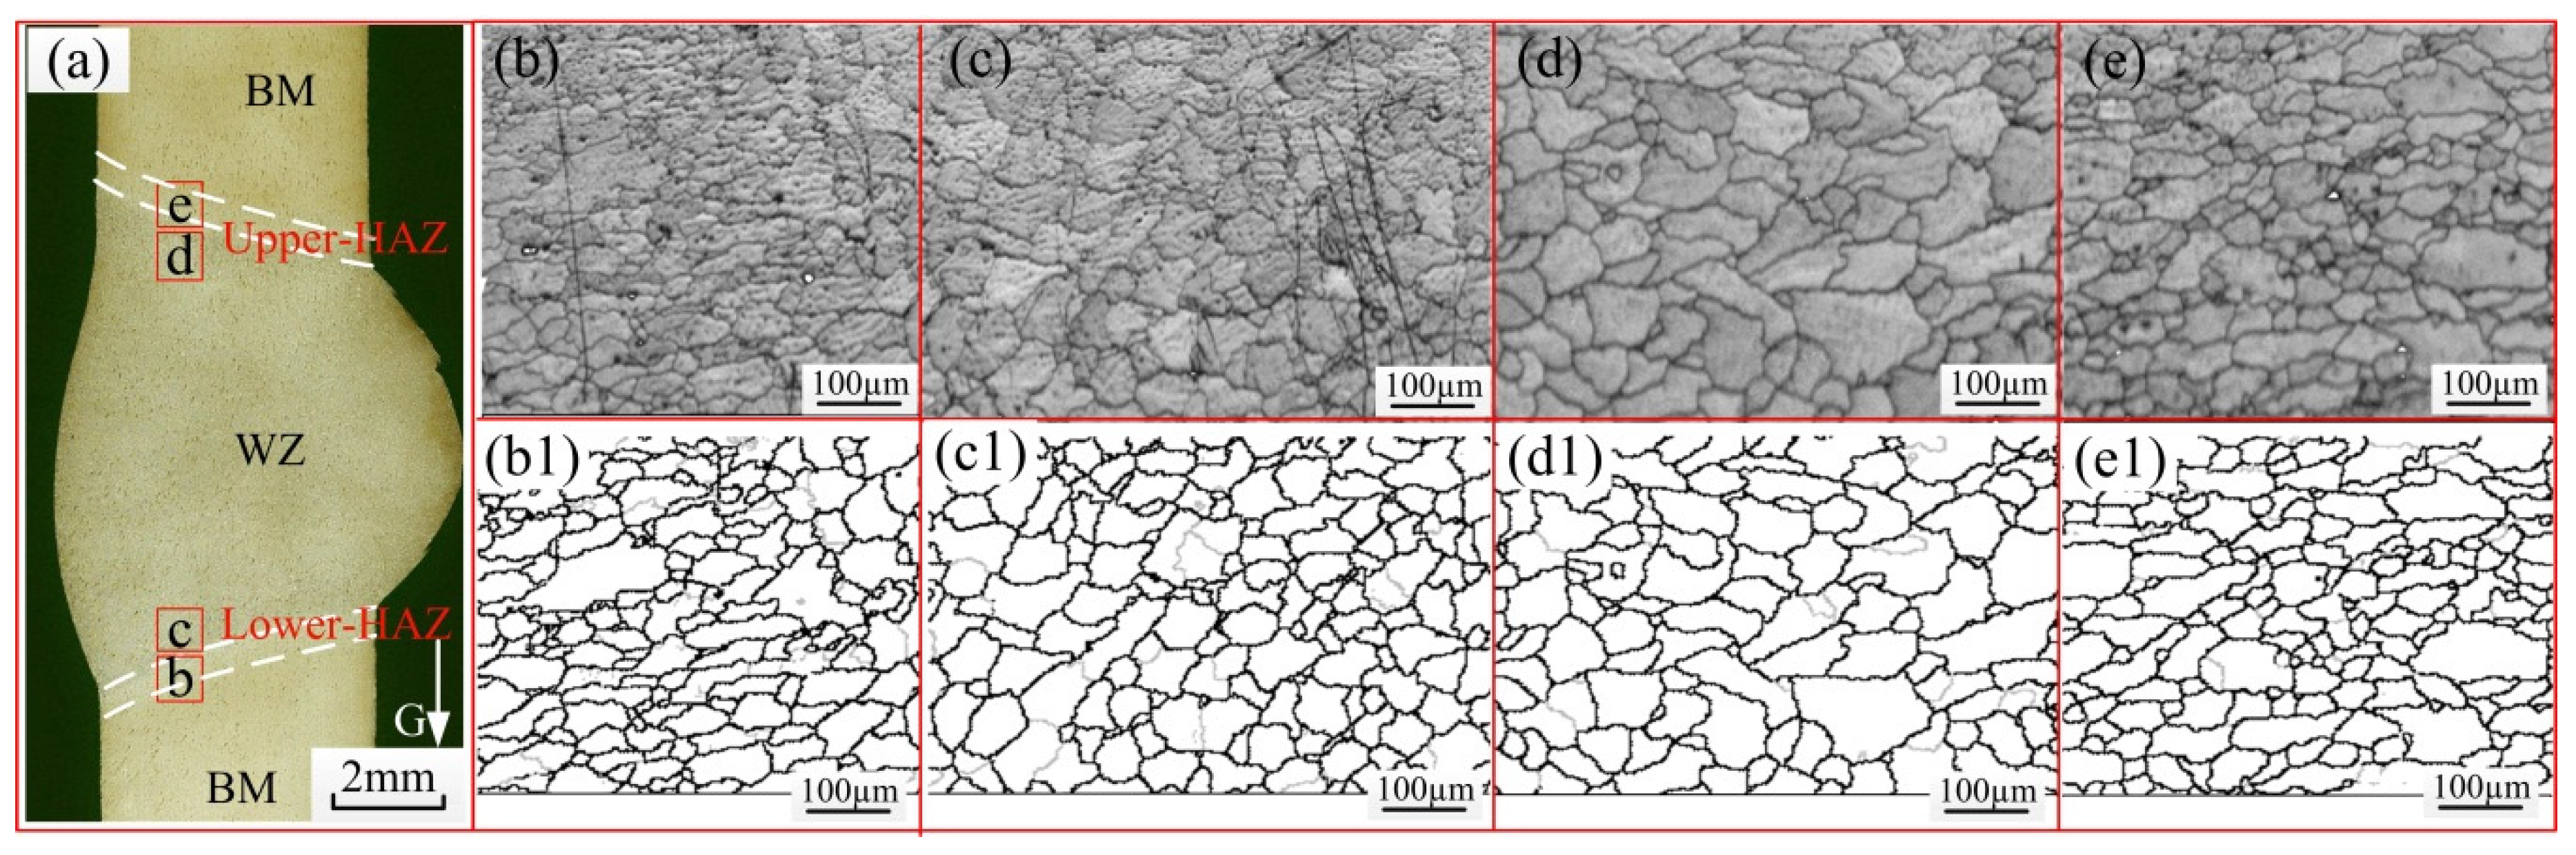
3.2. Microstructure of the Welded Joint

The welded joint was characterized into base metal (BM), weld zone (WZ) and fusion line (FL). The fusion lines can be divided into Lower-FL (the side where the gravity points to the side, in which more melted metal gathers due to the effect of gravity) and Upper-FL (the opposite side). EBSD orientation mapping was carried out on those four regions, and the selected zones are shown in Figure 4a. The heat affected zones (HAZ) are included in the zones of c and e, as shown in Figure 4c,e. BM showed a typical rolling structure with elongated gain substructures, as shown in Figure 4b. Fine equiaxed grains appeared in the WZ, which is a typical microstructure of crystallization [19], as shown in Figure 4d. The grain structure from BM to WZ in Lower-FL showed rolling, columnar and equiaxed grain. The grain structure in Upper-FL is similar to that of Lower-FL, as shown in Figure 4c,e.
Figure 5 contains the corresponding inverse pole figure of the selected regions in Figure 4a and the corresponding color key in the contours on the right side. In this study, the transverse direction (TD) was parallel to the rolling direction of BM; normal direction (ND) represent the direction of the thickness of BM; and the welding direction (WD) was perpendicular to the rolling direction of BM. The density ranges (MUD) for BM, Lower-FL, WZ, and Upper-FL were 0.65 to 1.69, 0.60 to 1.50, 0.66 to 1.49, and 0.58 to 1.99, respectively. And the main textures were {101}, {111}, {102} and {001}, respectively. In general, the texture intensity can be decreased because of crystallization during melting and solidification, which is induced by shear deformation and high temperature. Compared to the maximum texture intensity in BM of 1.69, the maximum texture intensity of Lower-FL and WZ were 1.49 and 1.50, respectively. However, the maximum texture intensity in Upper-FL was 1.99, which was higher than that of the result in BM. The texture intensity difference between the tested regions was also affected by the materials. Therefore, there is no preferred distribution of grain orientation, which indicates that the effect of asymmetric metal flow on the texture distribution is not significant at the macro level.
Figure 6 shows number fraction of the grain boundary angles of 2–15° and average grain size, the grain boundary angles between 2° and 15° were defined as low angle grain boundary (LAGB). The fraction of LAGBs decreased significantly from BM to WZ. LAGBs occupied 30.39%, 14.34%, 10.21% and 12.95% from zone b to zone e. LAGBs not only affect the plasticity, toughness, fracture and corrosion but also affect the brittleness and fatigue property of the material. In this case, the number fraction of LAGBs of the WZ reduced in comparison with the BM, indicating that significant recovery or recrystallization had occurred during welding process [20,21]. The material fluidity can be improved by heat input; it also can improve complete dynamic recrystallization [22]. The average grain sizes, which were calculated by the linear intercept method, of the selected regions were also shown in Figure 6. The average grain size in BM was 25.73 ± 1.25 µm, showing a typical rolling structure with elongated gain substructures, as shown in zone b. Fine equiaxed grains (a typical feature of dynamic recrystallization) appeared in WZ [8] with a grain size of 34.55 ± 1.72 µm, as shown in zone d. It was observed that the Upper-FL (zone d) has larger grain size than the Lower-FL (zone c) in the asymmetric welded joint. The average grain size in Lower-FL and Upper-FL were 34.33 ± 1.71 µm and 43.15 ± 2.16 µm. The average grain size, in decreasing order, is zone e (Upper-FL) > zone d (WZ) > zone c (Lower-FL) > zone b (BM). It can be concluded from this section that the average grain sizes at both side of the asymmetric welded joint were asymmetric. An asymmetric temperature distribution of the weld pool was produced by the asymmetric metal flow during the welding process, leading to the non-equilibrium nucleation of grains in the welded joint. That is, the asymmetric metal flow during VPPA horizontal welding has an influence on grain grown during the crystallization.

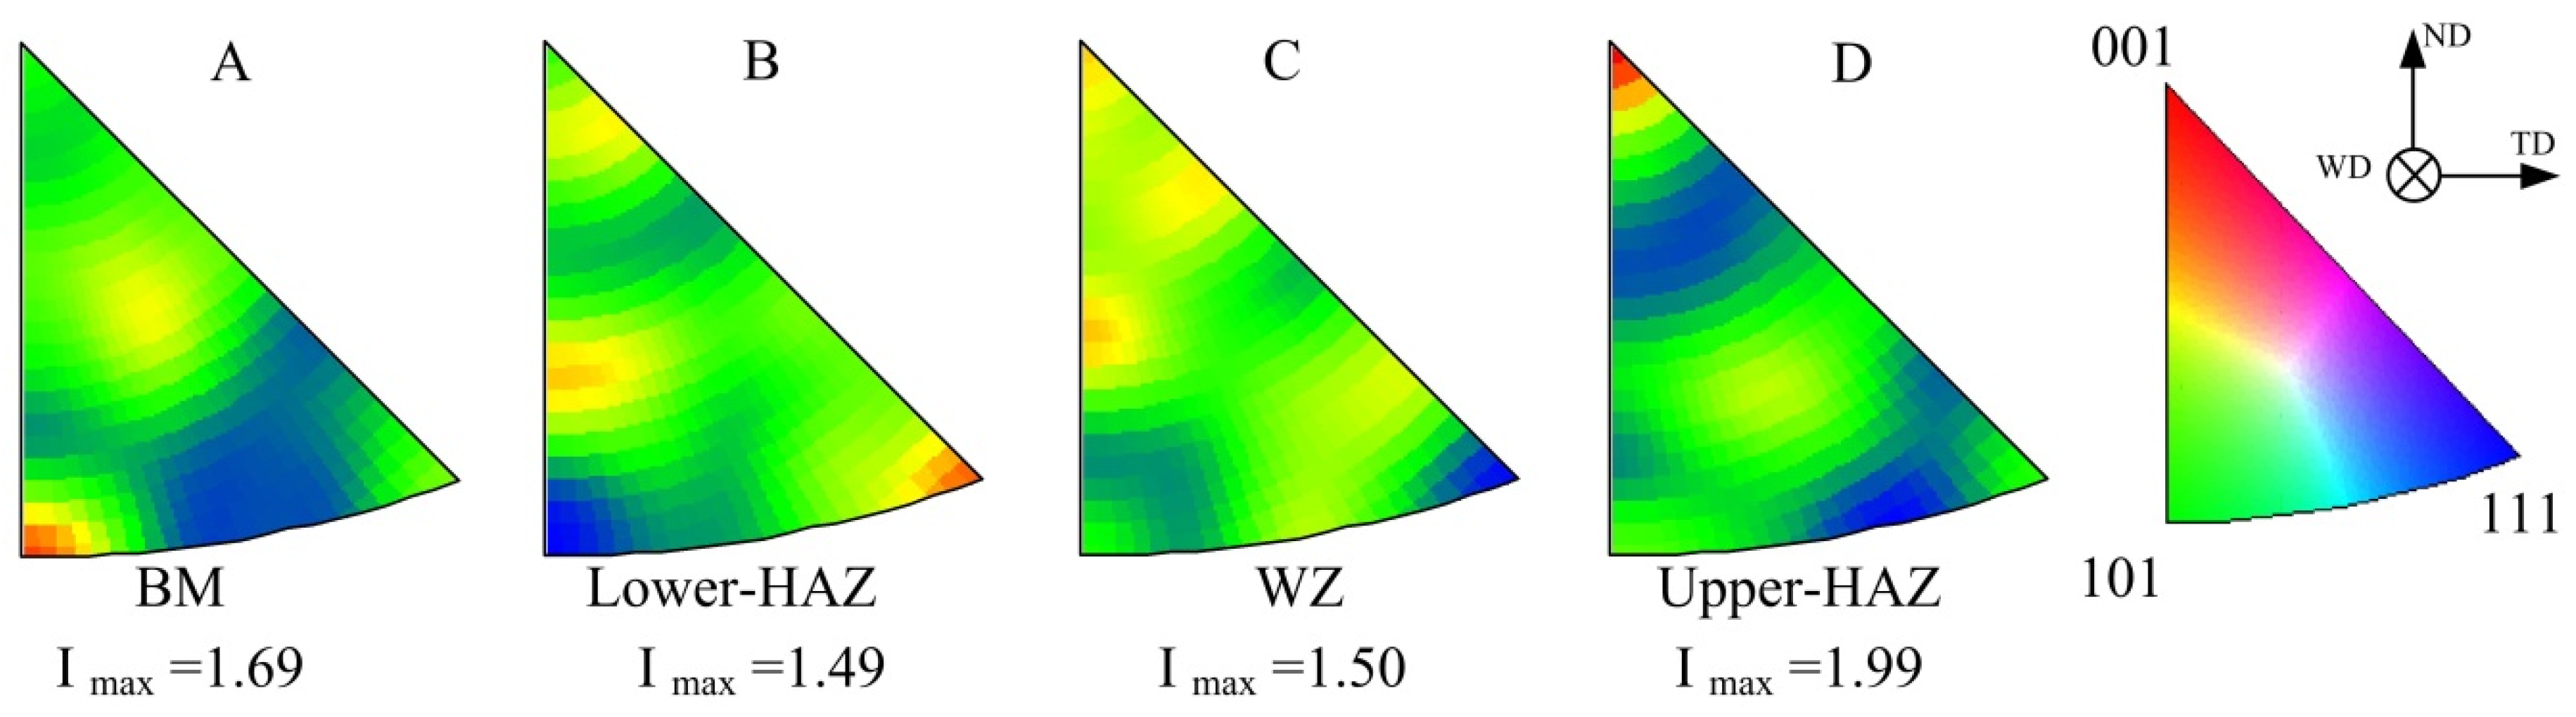
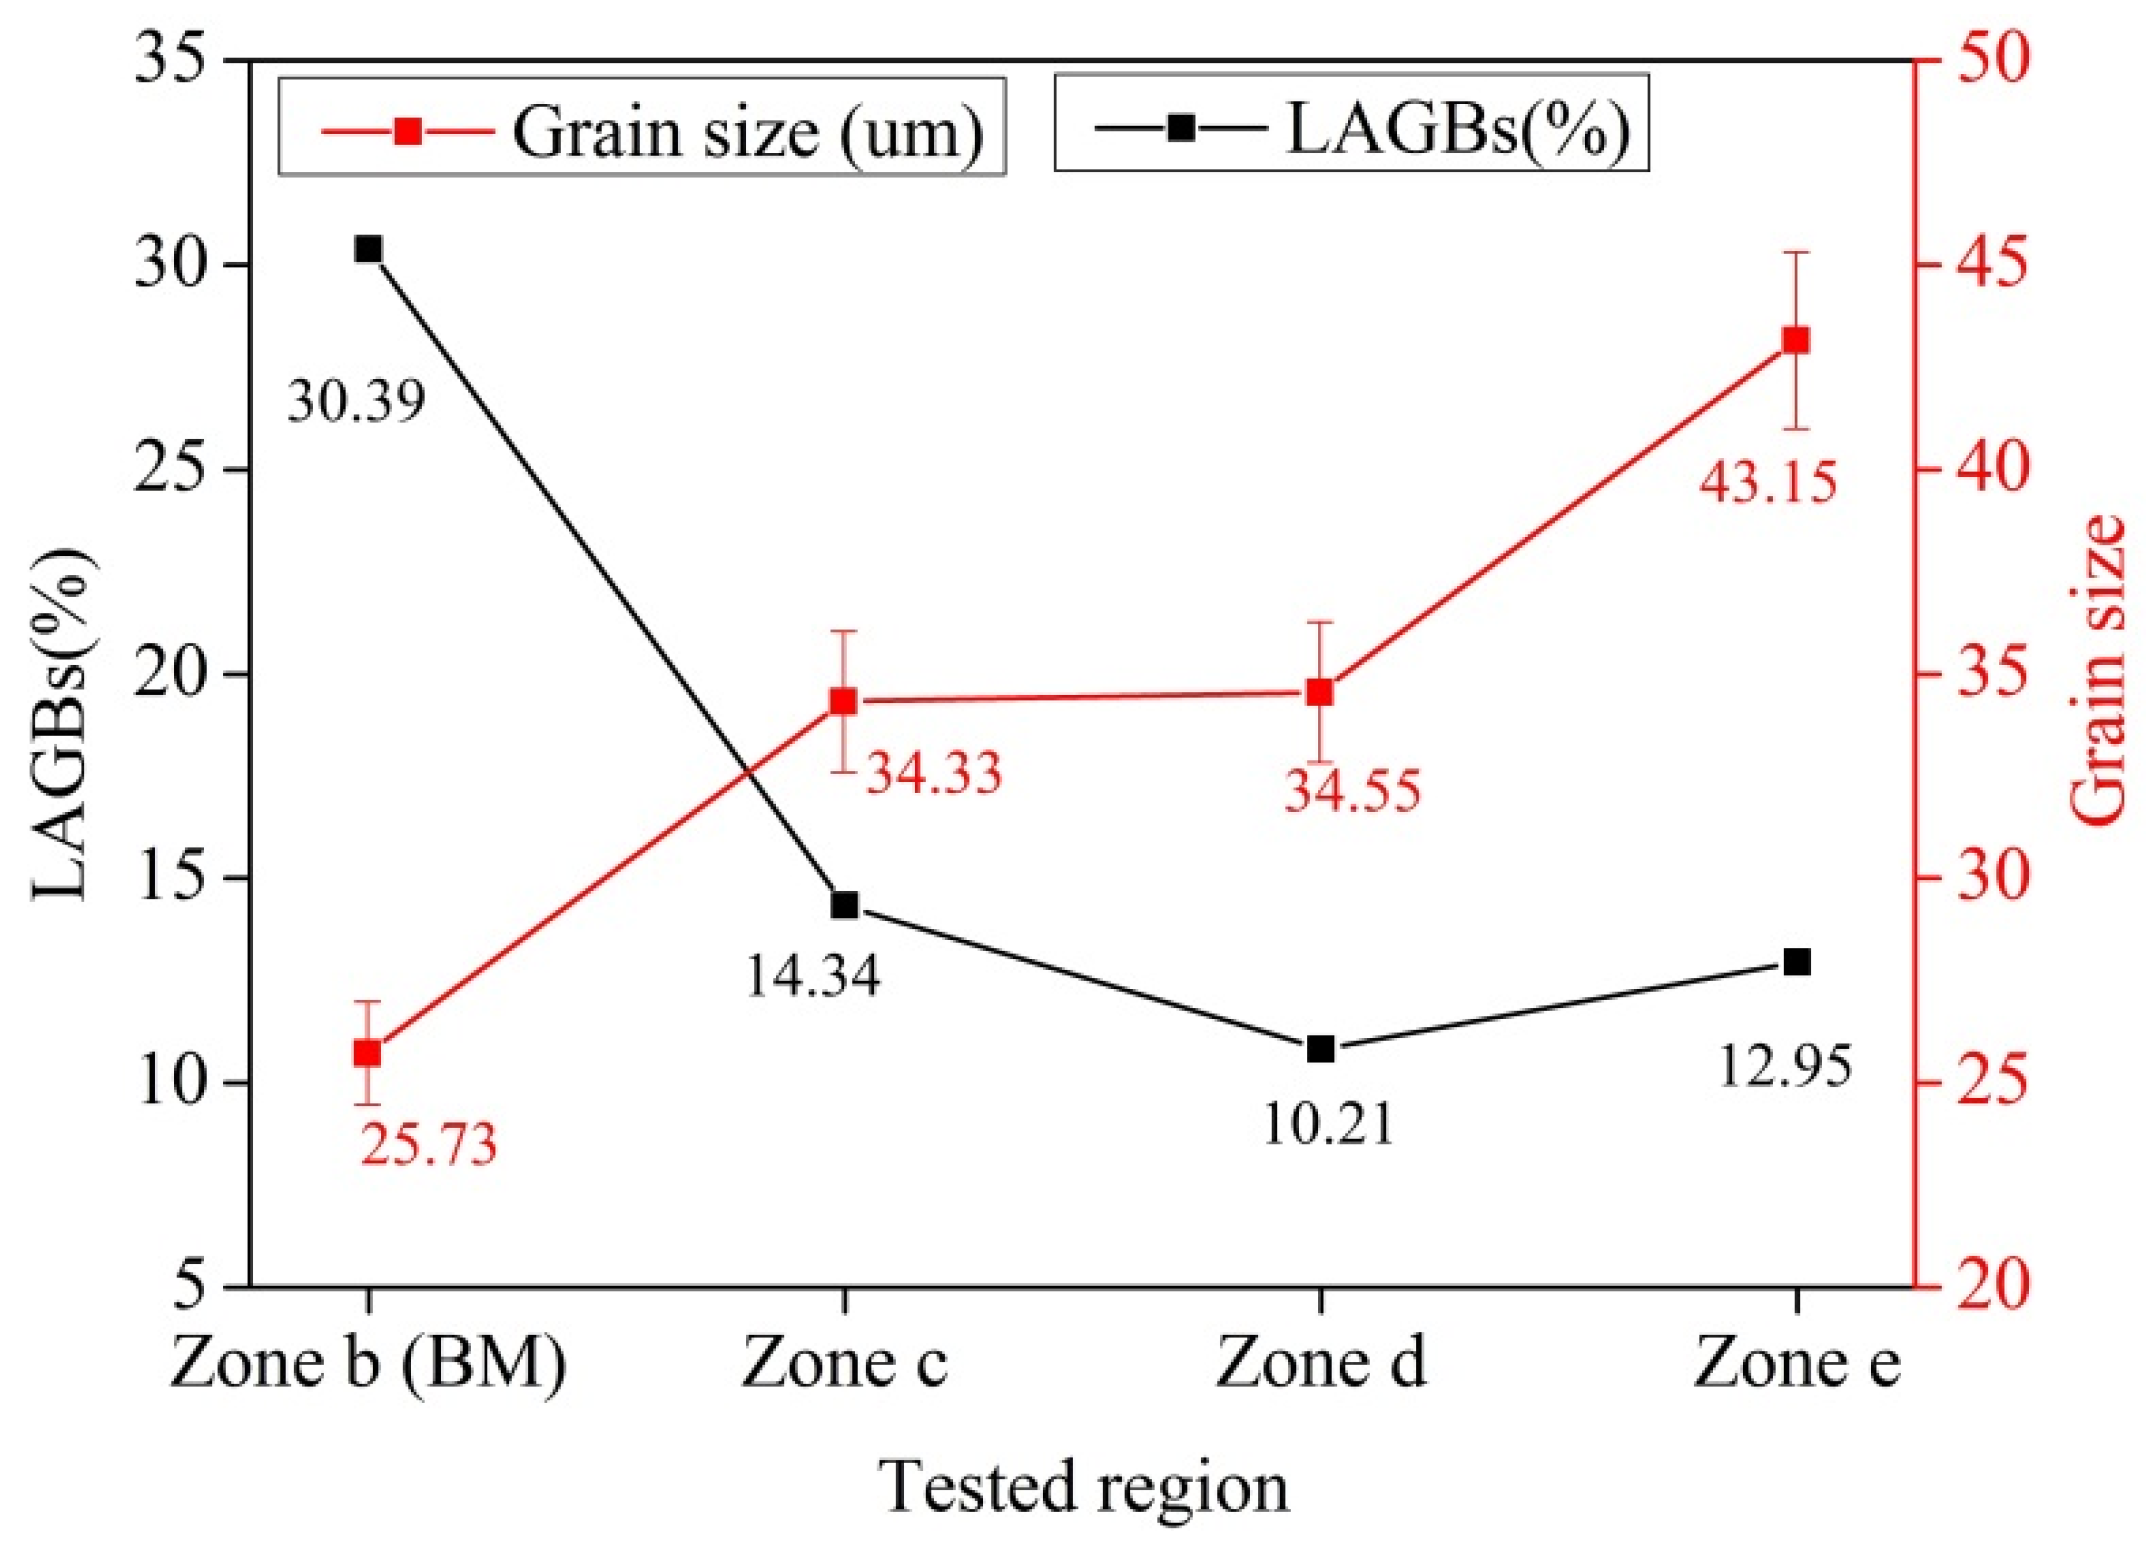
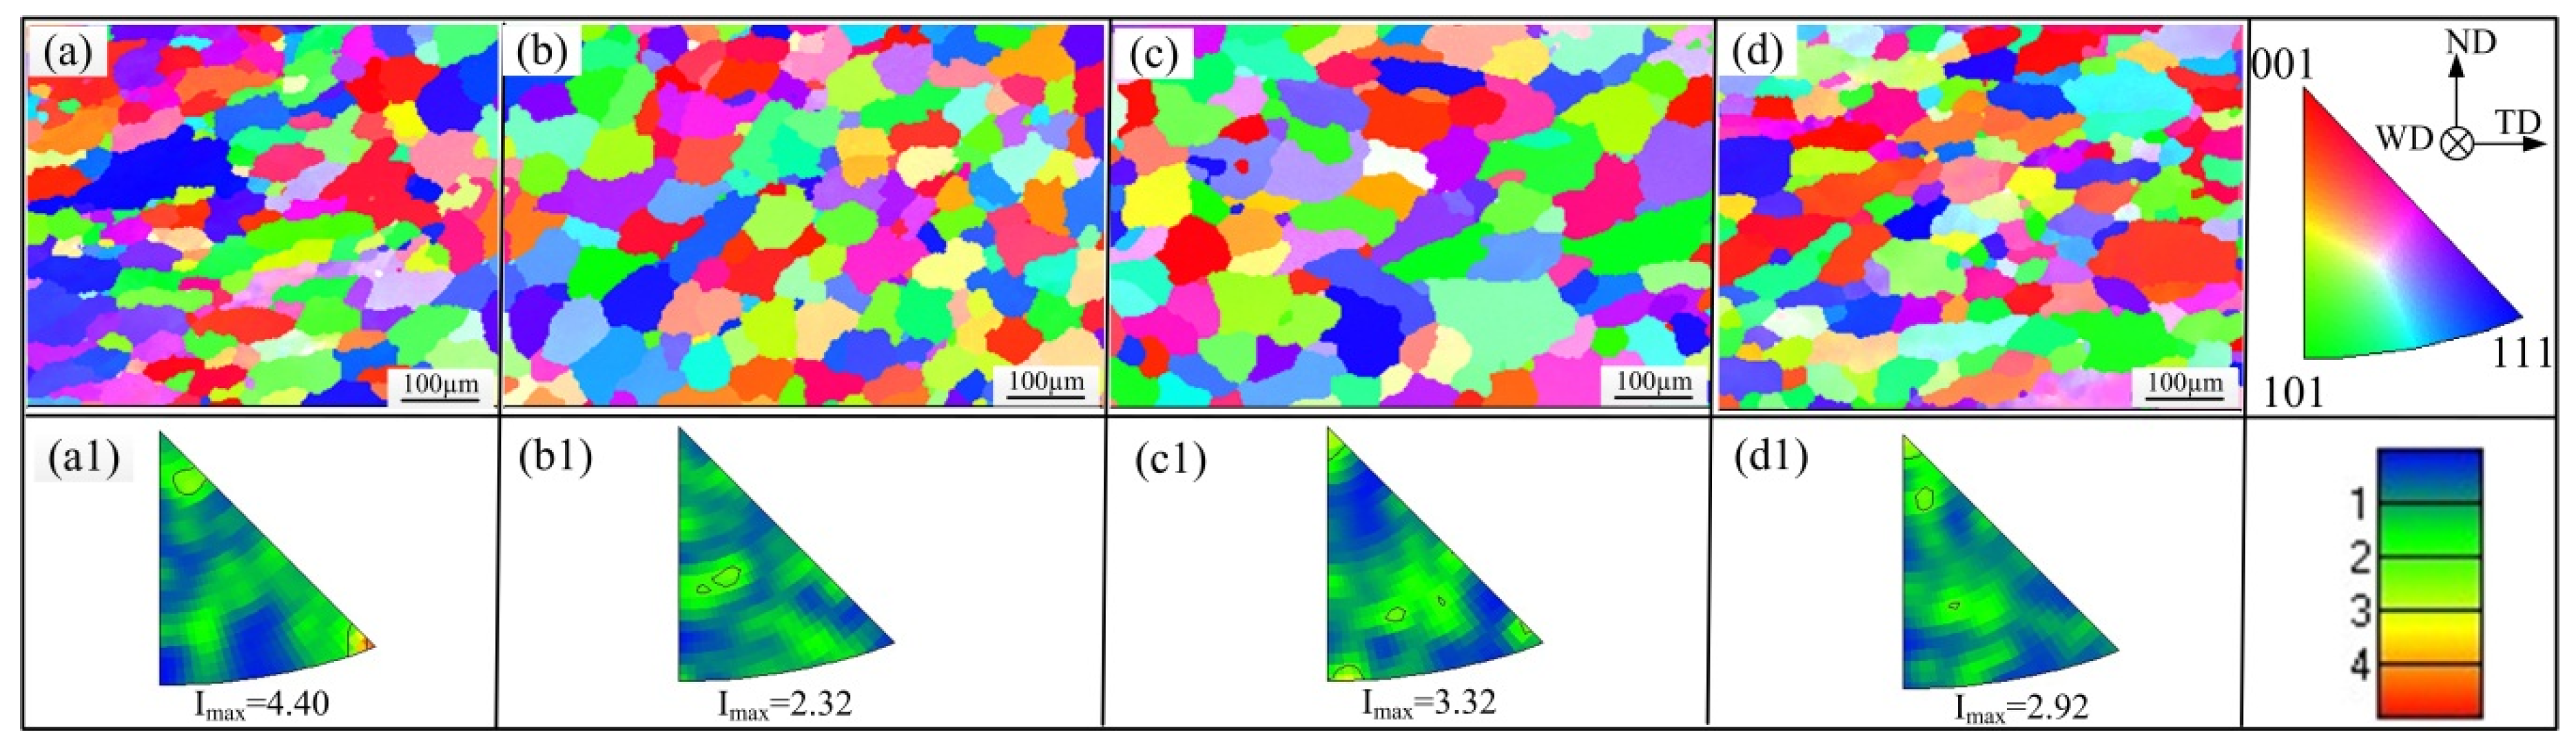
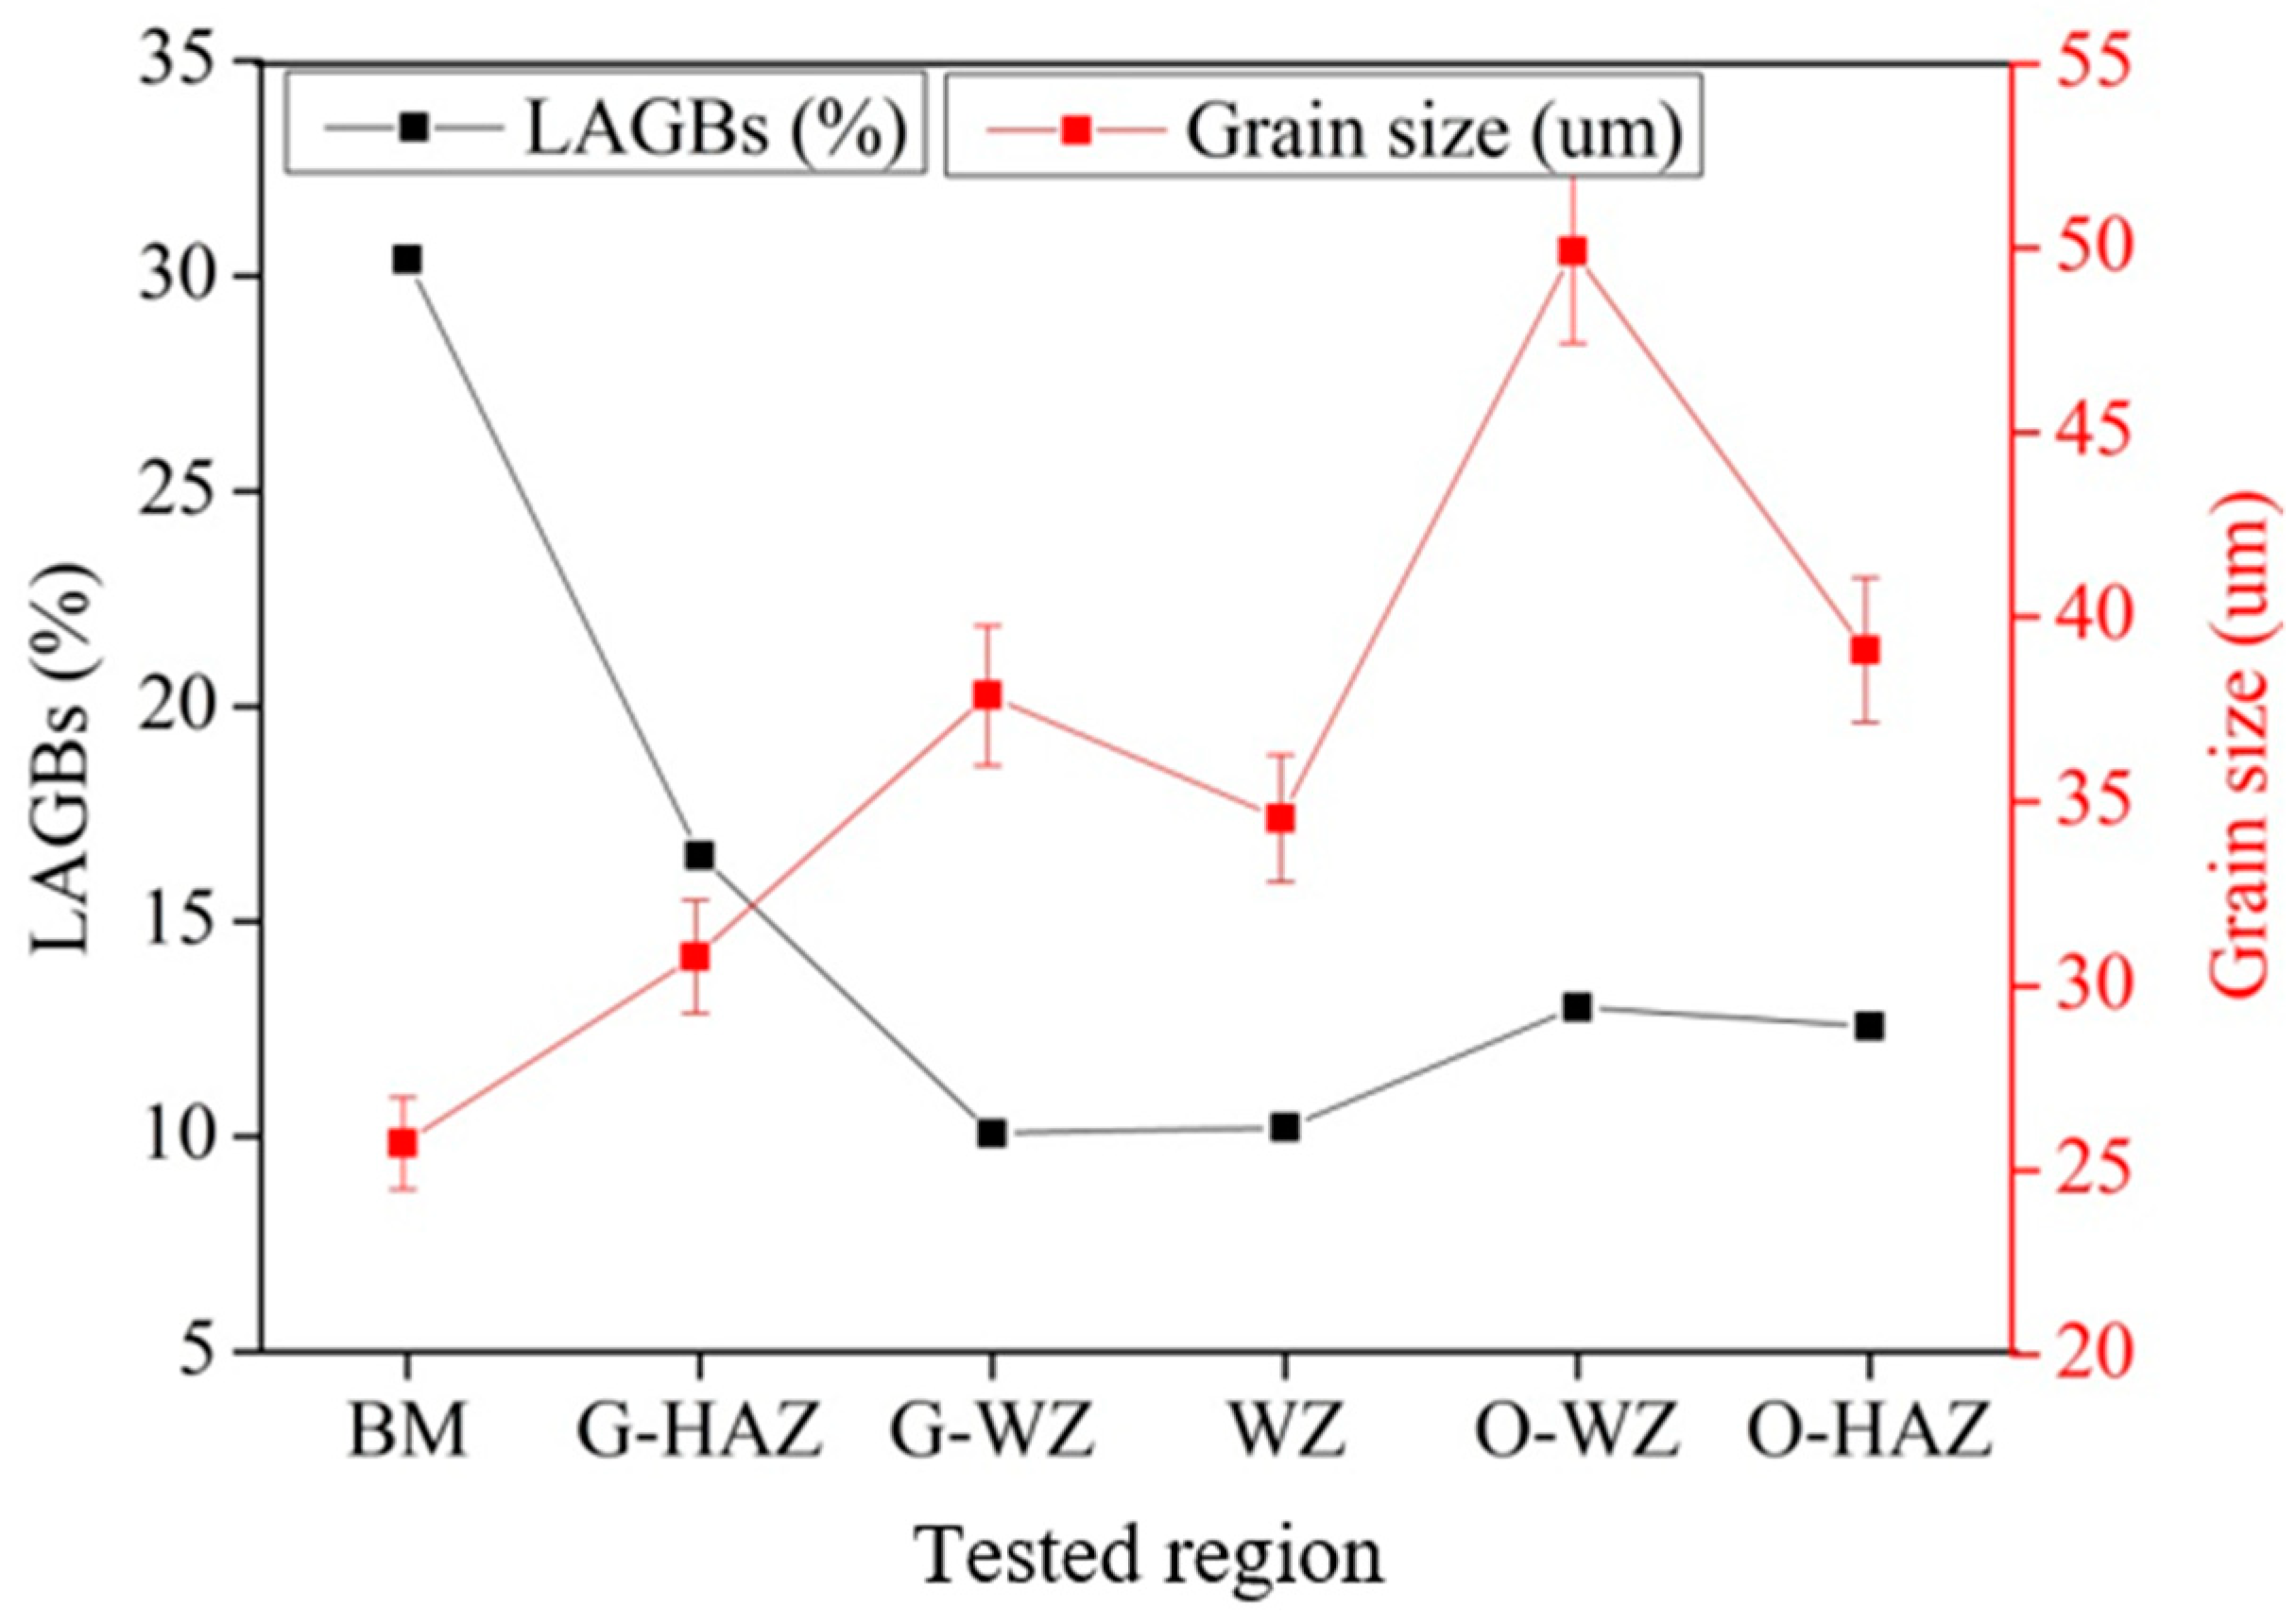
3.3. Microstructure and Texture Evolution at Both Side of the Weld

This section explores the effect of asymmetric metal flow on the microstructure, texture and mechanical properties of Al welded joint by VPPA welding. The microstructure and texture evolution on both sides of the welded joint were studied in this section, including four tested regions Lower-HAZ (heated affected zone where gravity points to the side), Lower-WZ, Upper-WZ and Upper-HAZ, as shown in Figure 7a. The corresponding band contrast results are shown in Figure 7b–e, and the corresponding grain boundaries are shown in Figure 7(b1–e1). The grain in Lower-HAZ was columnar crystal, while the grain size in Upper-HAZ was inhomogeneous. Both the Lower-WZ and Upper-WZ belong to the perfect recrystallization zone, shown in the structure of equiaxed grains, whereas, the grain size in those zones are different; the average grain size in Upper-WZ is larger than that of the size in Lower-WZ. The results were caused by the inhomogeneous crystallization temperature influenced by the asymmetric metal flow during welding.
Figure 8 shows the inverse pole Figure (IPF) color maps and IPFs of the selected zone in Figure 7a. The texture of the Upper-HAZ and Upper-WZ was {001} while that of the Lower-HAZ was {111}. The highest texture of those zones in Lower-HAZ, Lower-WZ, Upper-WZ and Upper-HAZ were 4.40, 2.32, 3.32 and 2.92, respectively. It can be obtained that the texture intensity of the HAZ and WZ was higher than that of BM. That is, the heat treatment during the welding process increased the concentration of the grain orientation distribution. In horizontal welding, melted metal gathers at the side where gravity points to the side; the dynamic recrystallization at this region was more sufficient. The texture intensity of this region was higher than that of the opposite side. Whereas, the texture intensity of those regions were not significantly different, as the range was between 2.3 and 4.4. It can be obtained that asymmetric metal flow has little effect on the texture distribution.
The average grain size and LAGB distribution at the selected zones are shown in Figure 9. The average grain size in BM was 25.73 ± 1.25 µm, which is the smallest grain in the whole welded joint. And the average grain size in the Upper-WZ was about 49.92 ± 2.49 µm, which is the biggest grain in the welded joint. The average grain sizes in Lower-HAZ and Upper-HAZ were 30.79 ± 1.54 and 39.11 ± 1.96 µm, respectively. The average grain size at the side where gravity points to the side was larger than the opposite side because the heat accumulation at the opposite reduced during welding process. Lots of heat was taken to the lower side with the melted metal flow [2]. A high heating rate is beneficial for accelerating the crystallization [14]. Meanwhile, the crystallization in the lower side was more complete than that of the opposite side. The misorientation angle distribution was shown in the black line on Figure 9. The fraction of LAGBs decreased significantly from BM to Upper-HAZ. LAGBs occupied 30.39%, 16.53%, 10.08%, 10.21%, 13.01% and 12.56%, respectively. LAGBs are primarily caused by dynamic recovery during deformation, and are mainly within large grains or along grain boundaries [14]. In this case, the range of LAGBs in WZ was between 10.08 and 13.01%, indicating that the difference of the crystallization in both sides of the welded joint was not noticeable. Whereas, a significant difference was obtained between Lower-HAZ and Upper-HAZ, indicating that material flow and thermal process were different on both sides of the HAZ. The LAGBs distribution in the whole welded joint was within 10–13%, which is acceptable within the margin of error.

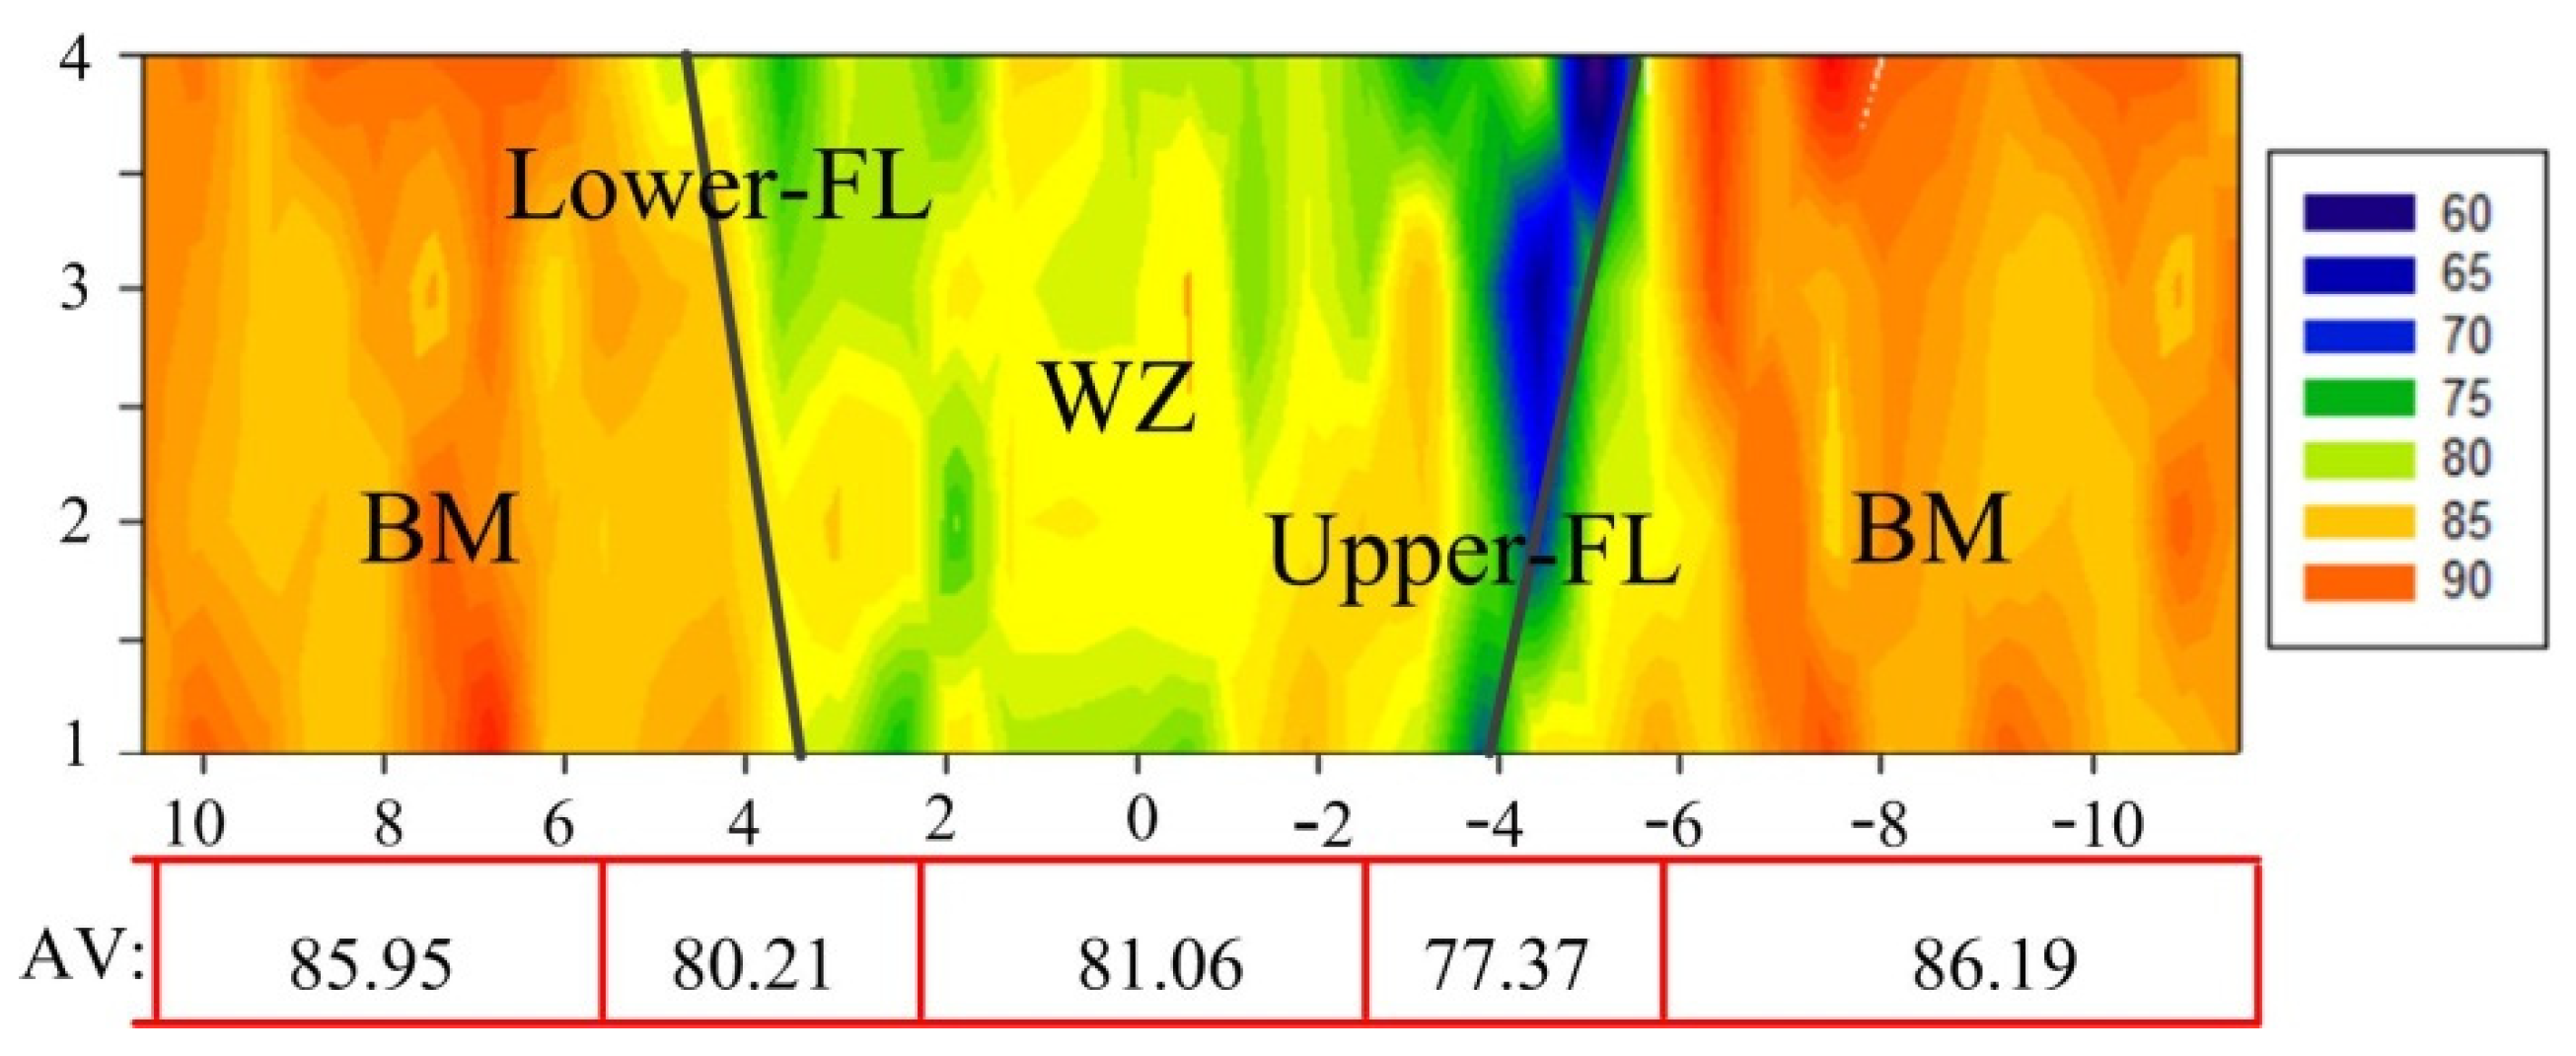
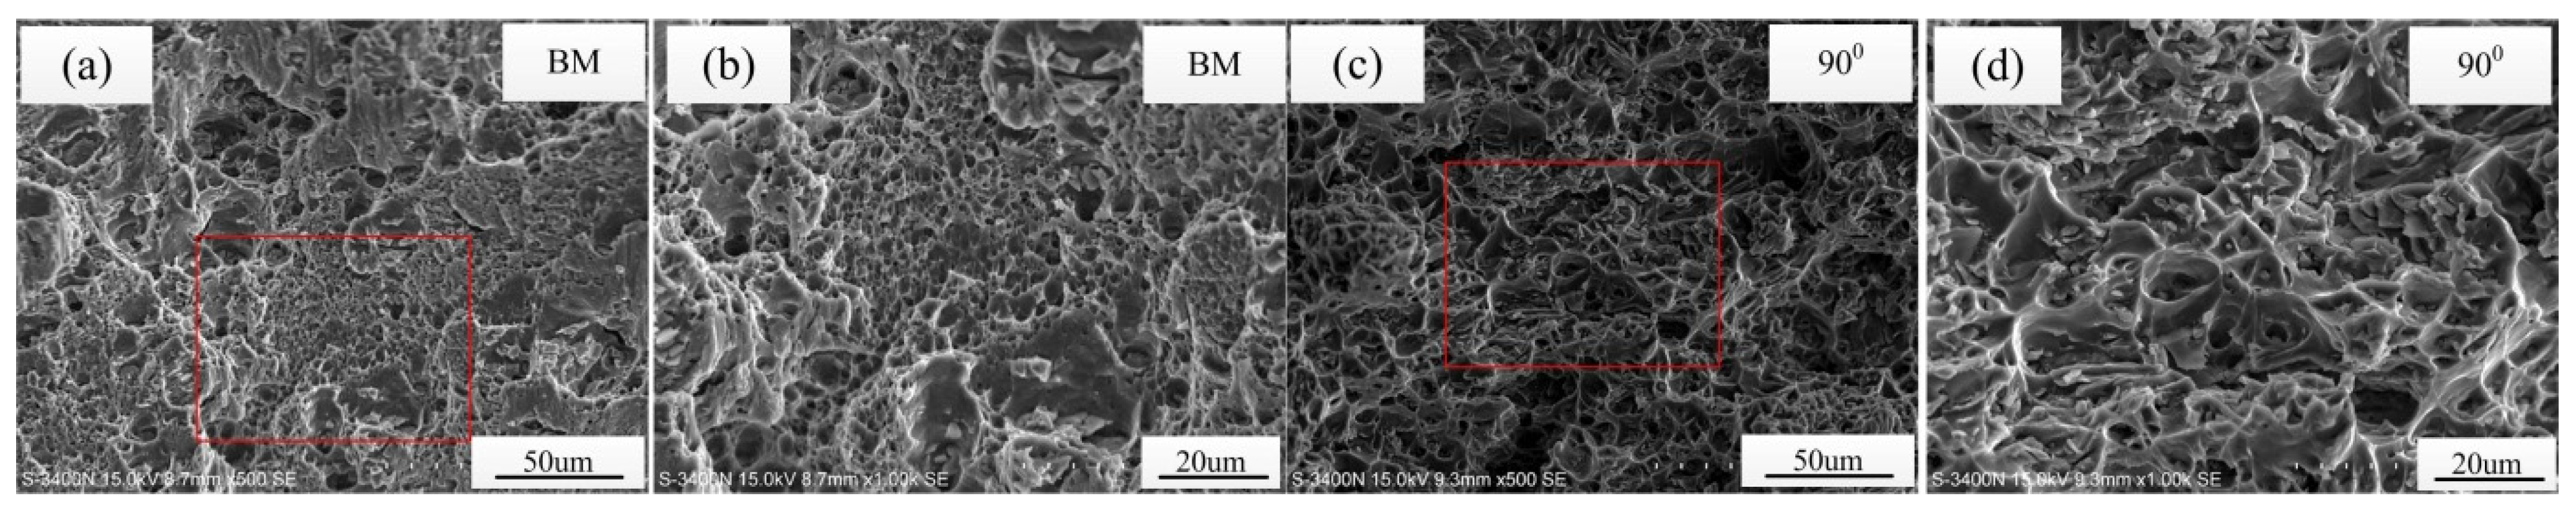
3.4. Mechanical Properties

The micro-hardness distribution of the welded joint is shown in Figure 10. Generally, the micro-hardness in the WZ, FL and HAZ are softer than that of BM in VPPA weld, and the micro-hardness nearby the FL is softer than that of the WZ and HAZ, similar to several researches [23,24]. For an overall view of the welded joint in this paper, the highest micro-hardness appeared in BM, the value was among 85 HV and 90 HV. The micro-hardness of WZ was lower than that of BM, the value was among 75 HV and 85 HV. The lowest micro-hardness appeared nearby the FL, but the value of the Upper-FL was lower than that of the Lower-FL; the micro-hardness of Lower-FL was about 70–75 HV, and that of Upper-FL was about 65–70 HV. For an analysis of the hardness, the lowest micro-hardness appeared near the Upper-FL, as shown in Figure 4. The asymmetric metal flow contributed to the inhomogeneous hardness distribution.
According to the relation between the tensile strength and micro-hardness, the tensile strength is proportional to the micro-hardness at the same welds [23]. The tensile strength and elongation of the asymmetric welded joint and BM are shown in Table 3. The results are the average value of two different tests of the same materials. The weld was tested to 319.8 ± 11.2 MPa, reaching about 89.2% of that of the BM. The value was the average value of three tests, and the specimens were all fractured at the region nearby the Lower-FL. For elongation, one of the important indexes to judge material properties, the result of the weld was about 11.4 ± 0.8%, reaching about 45.2% of the BM. Figure 11 is the SEM fractography of the fractured surfaces. Many tears and dimples appeared in the fracture surface of the BM, showing a quasi-cleavage fracture, which was one of the ductile fractures, as shown in Figure 11a,b. As for the weld, the fractured surface has the characteristics of ductile fracture-equiaxial dimples and elongation dimples, as shown in Figure 11c,d. It is worth noting that the welds fractured at the Upper-FL, indicating that the Upper-FL is the weakest link in the whole welded joint. The mechanical properties of the welded joint were significantly affected by the asymmetric metal flow during VPPA horizontal welding.

4. Discussion

From the above results, the microstructure, texture evolution and mechanical properties of the asymmetric welded joint have been obtained. The weakest zone of the welded joint appeared nearby the Upper-FL. The effect of asymmetric metal flow and underlying causes of asymmetric weld properties in VPPA horizontal welding have been discussed in this section. Figure 12 shows the keyhole molten pool of VPPA horizontal welding. There were few noticeable asymmetric phenomena in the keyhole entrance, as shown in Figure 12a. The metal was melted at the leading side and solidified at the rear side after flow around the keyhole, forming a surface weld. Figure 12b is the keyhole exit side, which is an irregular ellipse. In VPPA horizontal welding, lots of the melted metal flows to the side where gravity points, while a little stays at the opposite side [2,8]; the melting layer at the lower side was 1.9 mm, whereas, at the opposite side it was only 1.1 mm. The keyhole shapes and weld profiles are shown in Figure 13. With the accumulation of the welding process, a portion of the melted metal at the opposite side flowed to the lower side, forming an asymmetric keyhole, as shown in Figure 13a, resulting in an inhomogeneous keyhole molten pool, as shown in Figure 13c. It’s worth noting that the melted metal has a high temperature, that is, with the accumulation of the melted metal, the temperature distribution around the keyhole is also inhomogeneous. The “striae” can express the situation of solidification during the welding process, as shown in Figure 13b. The heat emission condition of the keyhole is consistent because of the same material, whereas, the initiation temperature at both sides of the pool is uneven. The temperature of the side where gravity points to the side is higher than that of the opposite side [2].
For the free-growth model, the grain size is inversely proportional to the undercooling ΔT; that is, grain grow depends only on undercooling (initial temperature) in this case. The side with high temperature obtains small grain size, which agrees with the results, as shown in Figure 9. According to the Hall-Petch relationship, the hardness increases as the grain size decreases [25], which also agrees with this work, as shown in Figure 10. The region nearby the Upper-FL has the lowest hardness distribution, and the grain size here was about 49.92 µm, which is the highest value throughout the whole welded joint. The lower hardness distribution at the Upper-FL may weaken the tensile strength. For the mechanical properties of a material, the smaller the grains, the more uniform the plastic deformation of the material is, because the plastic deformation can be dispersed among more grains. The smaller grains can enhance the dislocation among the grains, resulting in better strength and toughness. That is, materials with larger grain size have poor mechanical properties [22,26]. All this agrees with the results in this paper.
Generally, the energy of LAGBs is mainly derived from dislocation, with the density of dislocation depending on the dislocation difference between grains. The interface energy of HAGBs is higher than that of LAGBs [11]. LAGBs can prevent the crack from expanding more. The blocking effect in the grain boundary is affected by the interface energy: the smaller the energy of the grain boundary, the better its stability, and the clearer the blocking effect [12]. Thus, materials tend to fracture with high probability at the region with higher HAGBs, which is in accordance with our tensile test results. The texture component distribution in the welded joint also has an influence on properties. However, the results obtained in this paper show that the effect of the asymmetric metal flow of horizontal welding on the texture distribution is not noticeable, as stated above.
In VPPA horizontal welding, the melted metal around the keyhole flowed to the side where gravity points to the side along the keyhole boundary, causing an asymmetric metal distribution on both sides of the molten pool [2,11]. The temperature distribution around the pool was also affected by the asymmetric metal flow, which may directly affect the weld solidification process [14]. The crystallization process at both sides of the weld can be affected by the asymmetric metal flow during the welding process, resulting in an asymmetric grain size and grain-boundary angle distribution and poor mechanical properties. It is worth noting that all the mechanical properties lost from the weld of VPPA horizontal welding were lost directly due to gravity. The gravity effects on the asymmetric metal flow should be weakened to improve the mechanical properties of the asymmetric welded joint.

5. Conclusions

The effect of asymmetric material flow on the microstructure, texture and mechanical properties of Al welded joint by VPPA welding has been studied in this paper. The results obtained are as follows:
(1)
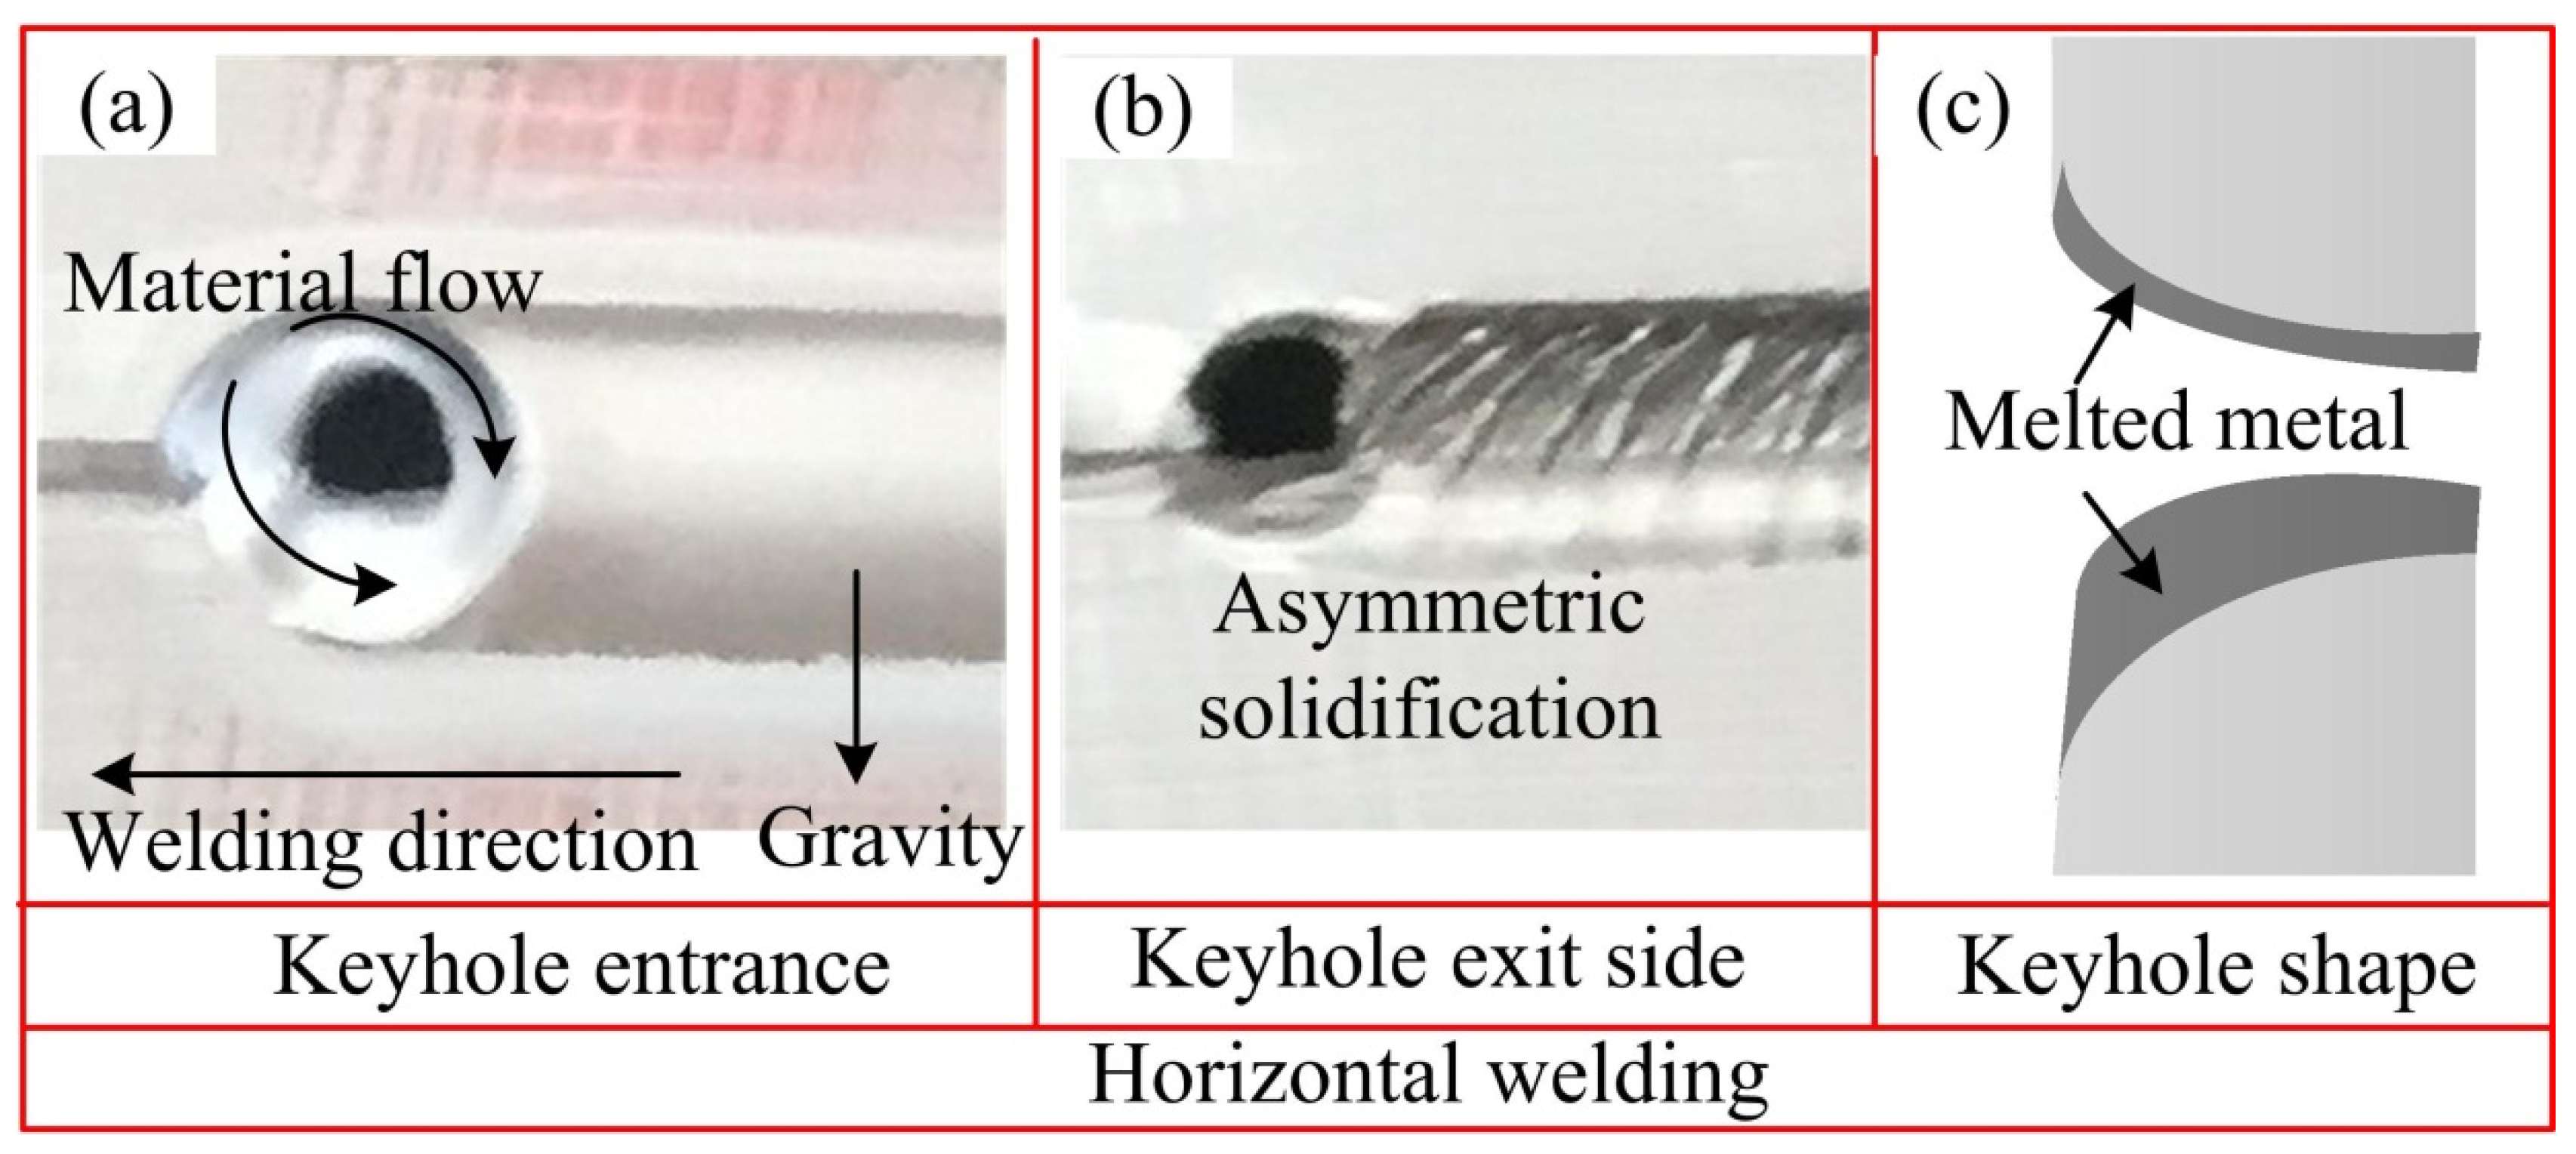
In VPPA horizontal welding, asymmetric metal flow created an asymmetric weld, resulting in asymmetric grain size, texture and GBA distribution on both sides of the welded joint.
(2)
The density ranges of texture in WZ, HAZ and BM were within 1.99, indicating the effect of asymmetric metal flow on the texture distribution was not significant.
(3)
The largest grain size appeared in the Upper-WZ, the average grain size was about 49.92 ± 2.49 µm, which was about 1.3 times than the opposite side.
(4)
The hardness near the Upper-FL was lower than that of the Lower-FL. A higher density of HAGB and lower hardness at the Upper-FL weakened the mechanical properties of the welded joint, causing the tensile specimens to break at this region.

Author Contributions

Conceptualization, Z.Y. and F.J.; methodology, S.C.; validation, Z.Y., O.T. and X.Z.; investigation, Z.Y.; resources, X.Z. and X.M.; data curation, Z.Y. and W.C.; writing—original draft preparation, Z.Y.; writing—review and editing, F.J.; visualization, F.J. and S.C.; supervision, S.C.; funding acquisition, F.J. All authors have read and agreed to the published version of the manuscript.

Funding

This work is supported by National Natural Science Foundation of China (U1937207), R&D projects in key areas of Guangdong province (2018B090906004) and Major Science and Technology Innovation Project of Shandong Province (2019JZZY010452).

Institutional Review Board Statement

Not applicable.

Informed Consent Statement

Not applicable.

Data Availability Statement

Not applicable.

Conflicts of Interest

The authors declare no conflict of interest.

References

  1. Wang, H.; Liu, X.; Liu, L. Research on Laser-TIG Hybrid Welding of 6061-T6 Aluminum Alloys Joint and Post Heat Treatment. Metals 2020, 10, 130. [Google Scholar] [CrossRef] [Green Version]
  2. Yan, Z.Y.; Chen, S.J.; Jiang, F.; Zhang, W.; Tian, O.; Huang, N.; Zhang, S.L. Weld properties and residual stresses of VPPA Al welds at varying welding positions. J. Mater. Res. Technol. 2020, 9, 2892–2902. [Google Scholar] [CrossRef]
  3. Kartal, M.E.; Liljedahl, C.D.M.; Gungor, S.; Edwards, L.; Fitzpatrick, M.E. Determination of the profile of the complete residual stress tensor in a VPPA weld using the multi-axial contour method. Acta Mater. 2008, 56, 4417–4428. [Google Scholar] [CrossRef]
  4. Liu, Z.M.; Fang, Y.X.; Cui, S.L.; Luo, Z.; Liu, W.D.; Liu, Z.Y.; Jiang, Q.; Yi, S. Stable keyhole welding process with K-TIG. J. Mater. Process. Technol. 2016, 238, 65–72. [Google Scholar] [CrossRef]
  5. Liu, Z.M.; Cui, S.L.; Luo, Z.; Zhang, C.Z.; Wang, Z.M.; Zhang, Y.C. Plasma arc welding: Process variants and its recent developments of sensing, controlling and modelling. J. Manuf. Process. 2016, 23, 315–327. [Google Scholar] [CrossRef]
  6. Zhang, Q.L.; Yang, C.L.; Lin, S.B.; Fan, C.L. Novel soft variable polarity plasma arc and its influence on keyhole in horizontal welding of aluminium alloys. Sci. Technol. Weld. Join. 2014, 6, 493–499. [Google Scholar] [CrossRef]
  7. Zhang, Q.L.; Yang, C.L.; Lin, S.B.; Fan, C.L. Soft variable polarity plasma arc horizontal welding technology and weld asymmetry. Sci. Technol. Weld. Join. 2015, 4, 296–306. [Google Scholar] [CrossRef]
  8. Yan, Z.Y.; Chen, S.J.; Jiang, F.; Zhang, W.; Huang, N.; Chen, R. Control of gravity effects on weld porosity distribution during variable polarity plasma arc welding of aluminum alloys. J. Mater. Process. Technol. 2020, 282, 116693. [Google Scholar] [CrossRef]
  9. Vyskoč, M.; Sahul, M.; Dománková, M.; Jurči, P.; Sahul, M.; Vyskočová, M.; Martinkovič, M. The Effect of Process Parameters on the Microstructure and Mechanical Properties of AW5083 Aluminum Laser Weld Joints. Metals 2020, 10, 1443. [Google Scholar] [CrossRef]
  10. Yang, B.; Tan, C.W.; Zhao, Y.B.; Wu, L.J.; Chen, B.; Song, X.G.; Zhang, H.; Feng, J. Influence of ultrasonic peening on microstructure and surface performance of laser-arc hybrid welded 5A06 aluminum alloy joint. J. Mater. Res. Technol. 2020, 9, 9576–9587. [Google Scholar] [CrossRef]
  11. Kalenda, M.; Madeleine, D.T. Corrosion fatigue behaviour of aluminium alloy 6061-T651 welded using fully automatic gas metal arc welding and ER5183 filler alloy. Int. J. Fatigue 2011, 33, 1539–1547. [Google Scholar]
  12. Yan, Z.Y.; Chen, S.J.; Jiang, F.; Huang, N.; Zhang, S.L. Material flow in variable polarity plasma arc keyhole welding of aluminum alloy. J. Manuf. Process. 2018, 36, 480–486. [Google Scholar] [CrossRef]
  13. Tian, Z.; Zhou, Q.; Du, Y.; Ma, Y.; Wang, W. Study of weld process and distortion control on VPPA welded laminose aluminium alloy. New Technol. New Process. 2015, 11, 104–106. [Google Scholar]
  14. Jiang, X.Q.; Chen, S.J.; Gong, J.L. Effect of non-axisymmetric arc on microstructure, texture and properties of variable polarity plasma arc welded 5A06 Al alloy. Mater. Charact. 2018, 139, 70–80. [Google Scholar] [CrossRef]
  15. Li, T.Q.; Chen, L.; Zhang, Y.; Yang, X.M.; Lei, Y.C. Metal flow of weld pool and keyhole evolution in gas focusing plasma arc welding. Int. J. Heat Mass Transf. 2020, 150, 119296. [Google Scholar] [CrossRef]
  16. Xu, B.; Chen, S.J.; Tashiro, S.; Fan, J.; Văn, A.N.; Tanaka, M. Material flow analyses of high-efficiency joint process in VPPA keyhole flat welding by X-ray transmission system. J. Clean. Prod. 2020, 250, 119450. [Google Scholar] [CrossRef]
  17. Xu, B.; Chen, S.J.; Jiang, F.; Phan, H.L.; Tashiro, S.; Tanaka, M. The influence mechanism of variable polarity plasma arc pressure on flat keyhole welding stability. J. Manuf. Process. 2019, 37, 519–528. [Google Scholar] [CrossRef]
  18. Ahmed, M.M.Z. The Development of Thick Section Welds and Ultra-Fine Grain Aluminum Using Friction Stir Welding and Processing. Ph.D. Thesis, The University of Sheffield, Shaffield, UK, 2009. [Google Scholar]
  19. Monajati, H.; Zoghlami, M.; Tongne, A.; Jahazi, M. Assessing Microstructure-Local Mechanical Properties in Friction Stir Welded 6082-T6 Aluminum Alloy. Metals 2020, 10, 1244. [Google Scholar] [CrossRef]
  20. Jazaeri, H.; Humphreys, F.J. The transition from discontinuous to continuous recrystallization in some aluminium alloys. Acta Mater. 2004, 52, 3239–3250. [Google Scholar] [CrossRef]
  21. Chen, H.Y.; Fu, L.; Liang, P. Microstructure, texture and mechanical properties of friction stir welded butt joints of 2A97 Al Li alloy ultra-thin sheets. J. Alloys Compd. 2017, 692, 155–169. [Google Scholar] [CrossRef]
  22. Song, Y.B.; Yang, X.Q.; Cui, L.; Hou, X.P.; Shen, Z.K.; Xu, Y. Defect features and mechanical properties of friction stir lap welded dissimilar AA2024–AA7075 aluminum alloy sheets. Mater. Des. 2014, 55, 9–18. [Google Scholar] [CrossRef]
  23. Cahoon, J.R.; Broughton, W.H.; Kutzak, A.R. The determination of yield strength from hardness measurements. Metall. Trans. 1971, 2, 1979–1983. [Google Scholar]
  24. Han, J.H.; Kim, D.Y. Determination of three-dimensional grain size distribution by linear intercept measurement. Acta Mater. 1998, 46, 2021–2028. [Google Scholar] [CrossRef]
  25. Hemmesi, K.; Mallet, P.; Farajian, M. Numerical evaluation of surface welding residual stress behavior under multi axial mechanical loading and experimental validations. Int. J. Mech. Sci. 2020, 168, 105127. [Google Scholar] [CrossRef]
  26. Sato, Y.S.; Urata, M.; Kokawa, H.; Ikeda, K. Hall-Petch relationship in friction stir welds of equal channel angular-pressed aluminium alloys. Mater. Sci. Eng. A 2003, 354, 298–305. [Google Scholar] [CrossRef]
Figure 1. Schematic drawing of the VPPA welding process, (a) cross-section, (b) keyhole.
Metals 11 00120 g001
Figure 2. Schematic diagram for testing, (a) micro-hardness, (b) tensile strength.
Metals 11 00120 g002
Figure 3. Weld appearance and macrostructure, (a) weld surface; (b) weld root surface; (c) weld cross-section.
Metals 11 00120 g003
Figure 4. Macro- and Micro-structure of the welded joint, (a) welded joint; (b) BM; (c) Lower-FL; (d) WZ; (e) Upper-FL.
Metals 11 00120 g004
Figure 5. Inverse pole Figures, (A) BM; (B) Lower-HAZ; (C) WZ; (D) Upper-HAZ.
Metals 11 00120 g005
Figure 6. Number fraction of the LAGBs and grain size.
Metals 11 00120 g006
Figure 7. Microstructures at both side of the weld, (a) welded joint; (be) microstructure of the selected regions in (a); (b1e1) grain boundary of (be).
Metals 11 00120 g007
Figure 8. Inverse pole Figure color maps, (ad) the selected zone shown in Figure 7a, (a) zone b; (b) zone c; (c) zone d; (d) zone e; (a1d1) the corresponding IPF of (ad).
Metals 11 00120 g008
Figure 9. Number fraction of the LAGBs and grain size.
Metals 11 00120 g009
Figure 10. Microhardness distribution of the welded joint.
Metals 11 00120 g010
Figure 11. SEM of the fractured surfaces, (a,b) BM; (c,d) weld.
Metals 11 00120 g011
Figure 12. Keyhole molten pool of VPPA horizontal welding, (a) keyhole entrance, (b) keyhole exit.
Metals 11 00120 g012
Figure 13. Material flow and weld formation of VPPA horizontal welding, (a) keyhole entrance, (b) keyhole exit, (c) welded joint.
Metals 11 00120 g013
Table 1. Chemical composition of 5A06 and ER5183 (wt.%) [11,12].
MaterialsMg%Mn%Cr%Fe%Si%Zn%Cu%Al%
5A06 plate5.80~6.800.50~0.80-<0.40≤0.40≤0.20≤0.10Bal.
ER51834.30~5.000.50~1.00≤0.1≤0.40≤0.40≤0.25≤0.10Bal.
Table 2. Welding parameters.
ParametersValue/Units
Welding currentsDCEN135 A
DCEP165 A
Welding directionHorizontal welding
Travel velocity0.14 m/min
Welding power≈4.5 KW
Wire feed speed0.8 m/min
Wire diameter1.2 mm
Shielding gas flow ratePure argon with 15 L/min
Plasma gas flow ratePure argon with 3.0 L/min
Table 3. Tensile strength of the welded joint and BM.
Tested SpecimenFractured PositionTensile Strength/MPaElongation/%
Base metal-358.7 ± 9.325.2 ± 1.4
Welds Upper-FL319.8 ± 11.211.4 ± 0.8
Publisher’s Note: MDPI stays neutral with regard to jurisdictional claims in published maps and institutional affiliations.

