Article

Intrinsic Fatigue Crack Growth in Al-Cu-Li-Mg-Zr Alloys: The Effect of the Iron Constituent Particles

1
Beijing Institute of Aeronautical Materials, Beijing 100095, China
2
Beijing Engineering Research Center of Advanced Aluminum Alloys and Application, Beijing 100095, China
*
Author to whom correspondence should be addressed.
Metals 2021, 11(1), 110; https://doi.org/10.3390/met11010110
Submission received: 27 November 2020 / Revised: 28 December 2020 / Accepted: 30 December 2020 / Published: 7 January 2021

Abstract

:
The influence of iron (Fe)-containing constituent particles on the behavior of fatigue crack initiation and propagation of Al-Cu-Li-Mg-Zr alloys has been studied using fatigue crack growth (FCG) tests and in-situ fatigue testing and detailed metallographic examination based on scanning electron microscopy. Experimental results show that the alloy with a low level of Fe content (2A97-T3 sheet) exhibited a lower density, accompanying equivalent tensile strength and FCG rate compared to the damage-tolerant 2524-T3 sheet. It was found that the fatigue b growth of both alloys is dominated by transgranular mode, accompanied by intergranular expansion, and the high level of Fe content alloy presents more characteristics of intergranular. Coarse constituent particles were detrimental to the resistance against FCG. It is postulated here that the micro-cracks formed around the coarse Fe-containing particles are merged with the primary crack to produce a bridging effect, accelerating the growth of fatigue cracks in the alloy with a high level of Fe content.

1. Introduction

The reduction in aircraft metallic structures’ weight is a current problem that the aerospace industry has to address. The use of aluminum (Al)-lithium (Li) alloys offers an alternative solution to the precedented high strength Al alloys due to their balanced combination of low density, high stiffness, and excellent strength [1,2,3,4]. The modern Al-Li alloys were developed in the 1990s as the 3rd generation alloys added with alloying elements, including Cu and Mg. Among these alloys, the 2A97-T3 (Al-3.8 Cu-1.5 Li-0.4 Mg-0.11 Zr) sheet is one of the most promising candidates for fuselage skin applications. The fatigue crack growth (FCG) behavior of metallic materials used to construct structural components is crucial for aircraft design [5,6,7,8].
Several factors are highlighted to have a significant impact on the FCG resistance of Al alloys, including the condition of applied loading, the size of plastic zone ahead of crack tip, and metallurgical factors such as constituent particles, precipitates, grain boundary characteristics, and crystal orientation [9,10,11,12,13]. With respect to the metallurgical factors, the presence of constituent particles often triggers and/or promotes FCG in aluminum alloys [14,15]. Intermetallic constituent particles are formed during the solidification of as-cast ingots. Some of these phases, including Al2Cu, Mg2Si, and Al2CuMg, are normally dissolved during the subsequent heat treatment. However, the others containing Fe and Si, such as Al7Cu2Fe, Al12Fe3Si, and Al3Fe [16,17], are preserved after heat treatment. These constituent particles distributed on grain boundaries have minor effects on strength but are deleteriously affecting ductility and fracture toughness [18,19]. For instance, Morris et al. [20,21] reveal that fatigue cracks are normally originated close to the constituent particles on the outer surface of samples with their sizes above a critical threshold in 2219-T851 alloy.
On the other hand, fatigue cracks are induced due to the fracture of constituent particles or emerged from the micro-cracks formed at the interface between particles and the surrounding matrix. Specifically, Nakai et al. [22] found that at a larger amplitude of the stress intensity factor ∆K, the constituent particles have a significant effect on the FCG rate of the 2024 alloy. The research conducted by Staley [23] indicates that for 2XXX series aluminum alloys, reducing the volume fraction of the Fe and Si impurities can improve the FCG resistance and reduce the fatigue crack growth rate in the alloy. In addition, Manabu et al. [24] conducted comparative studies on the influence of coarse constituent particles on fracture toughness, suggesting that fracture toughness increases proportionally to the square root of inter-spacing distance of the Al7Cu2Fe constituent phases.
Numerous experiments were conducted to identify the factors affecting the Al-Cu-Mg alloy’s fatigue properties [25,26,27,28,29,30,31]. However, the research on the recently developed 2A97 Al-Cu-Li-Mg-Zr Alloy is comparatively limited [32,33,34,35,36,37,38], and correspondingly the FCG behavior of this alloy is poorly understood. The FCG behavior of the 2A97-T3 sheet is not entirely understood. In particular, the effect of the Fe containing constituent particles on FCG behavior needs to be further clarified. In the present study, a comparative study is conducted between two alloys designed to have different Fe contents based on the nominal composition of the 2A97-T3 alloy. Therefore, it is of interest to investigate the Fe constituent particles’ effect on the intrinsic fatigue crack growth in Al-Cu-Li-Mg-Zr alloys in detail by using FCG tests and in-situ fatigue scanning electron microscopy (SEM) observations.

2. Materials and Methods

The materials used for this study were Al-Cu-Li-Mg-Zr alloys. The compositions of the alloys with different levels of Fe content are present in Table 1. In addition to the major alloying elements such as Cu, Li, and Mg, both alloys contain comparable amounts of solute elements such as Si and Zr. The alloys were designated as the ‘High Fe alloy’ and the ‘Low Fe alloy’ based on Fe content level.
The material was received as a 1.5 mm sheet formed by cold rolling and followed by solution heat treatment, water quenching, and stretching to achieve the T3 state. The constituent particles in the High Fe and Low Fe alloys were imaged using backscattered electron imaging in a scanning electron microscopy (SEM, JSM-7900F, JEOL, Toyko, Japan) with an accelerating voltage of 20 kV. The distribution characteristics of the particles were further measured by using the Image-Pro Plus software (6.0, Media Cybernetics, Rockville, MD, USA). Electron back scatter diffraction (EBSD) maps were performed on the 800 μm × 400 μm area with a step size of 1 μm in the longitudinal–short transverse (L–ST) plane. The EBSD data were post-processed using the orientation imaging microscopy (OIM) analysis software (OIM 5.1, EDAX, Inc., Mahwah, NJ, USA). To minimize the error of measurements, the grains that are less than 3 pixels in size were excluded for the analysis. Specimens were prepared by electropolishing in a mixture of 90% mL ethanol and 10% mL perchloric acid at a temperature less than −20 °C.
Tensile testing was carried out on an Instron 5887mechanical tensile machineInstron, Norwood, MA, USA) with a load cell of 30 kN. The dog-bone tensile specimen with the gauge measuring 55 mm in length and 15 mm in diameter was machined from the long transverse (LT) direction and tested in the same direction following the procedure described in the ASTM E8 standard [39]. FCG tests were performed by using the MTS 810 testing machine (MTS 810, Eden Prairie, MN, USA) with the center-cracked M(T) specimens notched in the transverse–longitudinal (T–L) orientation (shown in Figure 1a). All the tests were conducted at the constant amplitude of loading with constant stress ratios (R = Kmax/Kmin) of 0.1. The loading stress was applied with a frequency of 3 Hz in a sinusoidal waveform. During testing, the crack length was measured using the compliance method. All of the experimental procedures were conducted in line with the ASTM E647 standard [40]. The following equation was used to determine the stress intensity factor, ∆K.
Δ K = Δ P B π α 2 w sec π α 2
where P is the load; B and w are the thickness and width of the specimen, respectively; α = 2a/w; and a is the half-crack length. Representative fractography specimens were sectioned from fractured FCG tests samples and mounted for examination by using scanning electron microscope (SEM, JSM-7900F, JEOL, Toyko, Japan).
In-situ SEM fatigue tests were carried out using an SS-550 SEM with an electro-hydraulic servo system (SEM, SS-550, shimadzu, Tokyo, Japan) operating at 10 Hz with a maximum applied stress of about 75% of the yield stress at load ratio R of 0.1. The double edge notch specimen used for the in-situ SEM fatigue test was taken from the High Fe and Low Fe alloy sheet, parallel to the longitudinal–long transverse (L–LT) plane with the loading axis along the LT direction, shown in Figure 1b. The initial notches were created by spark machining a through slit. Specimens were etched in a solution of 1.0%HF, 1.5%HCl, 2.5%HNO3, and 95% H2O, so the crack path with respect to the microstructure could be examined in-situ. The grain boundaries etch deeper than the grains due to their higher reaction rates and are thus clearly visible.

3. Results

3.1. The Starting Microstructure

EBSD analyses were performed for the Low Fe sample, shown in Figure 2. The rolling process introduced a high degree of crystallographic anisotropy to the resultant microstructure. It was clear that the grains are highly elongated in the rolling direction in the sheet made from the Low Fe alloy, shown in Figure 2a. Significant variation in grain size was also obtained between individual measurements. Detailed EBSD analysis has further revealed that one population of the grains are relatively polygonized in shape and measuring 10–300 µm along the L direction, while the other grains are smaller and less than 10 µm along the L direction. As displayed in Figure 2b, the alloy exhibited a strong deformation texture containing brass {110} <112> and S {123} <634> components. The <111> pole figure and orientation distribution function (ODF) analysis revealed that the brass texture was a predominant component. Figure 2c reveals the average grain size of the alloy of 25 μm, processed by the OIM software. The difference in grain size between the Figure 2a,c is contributed to the different calculation methods.
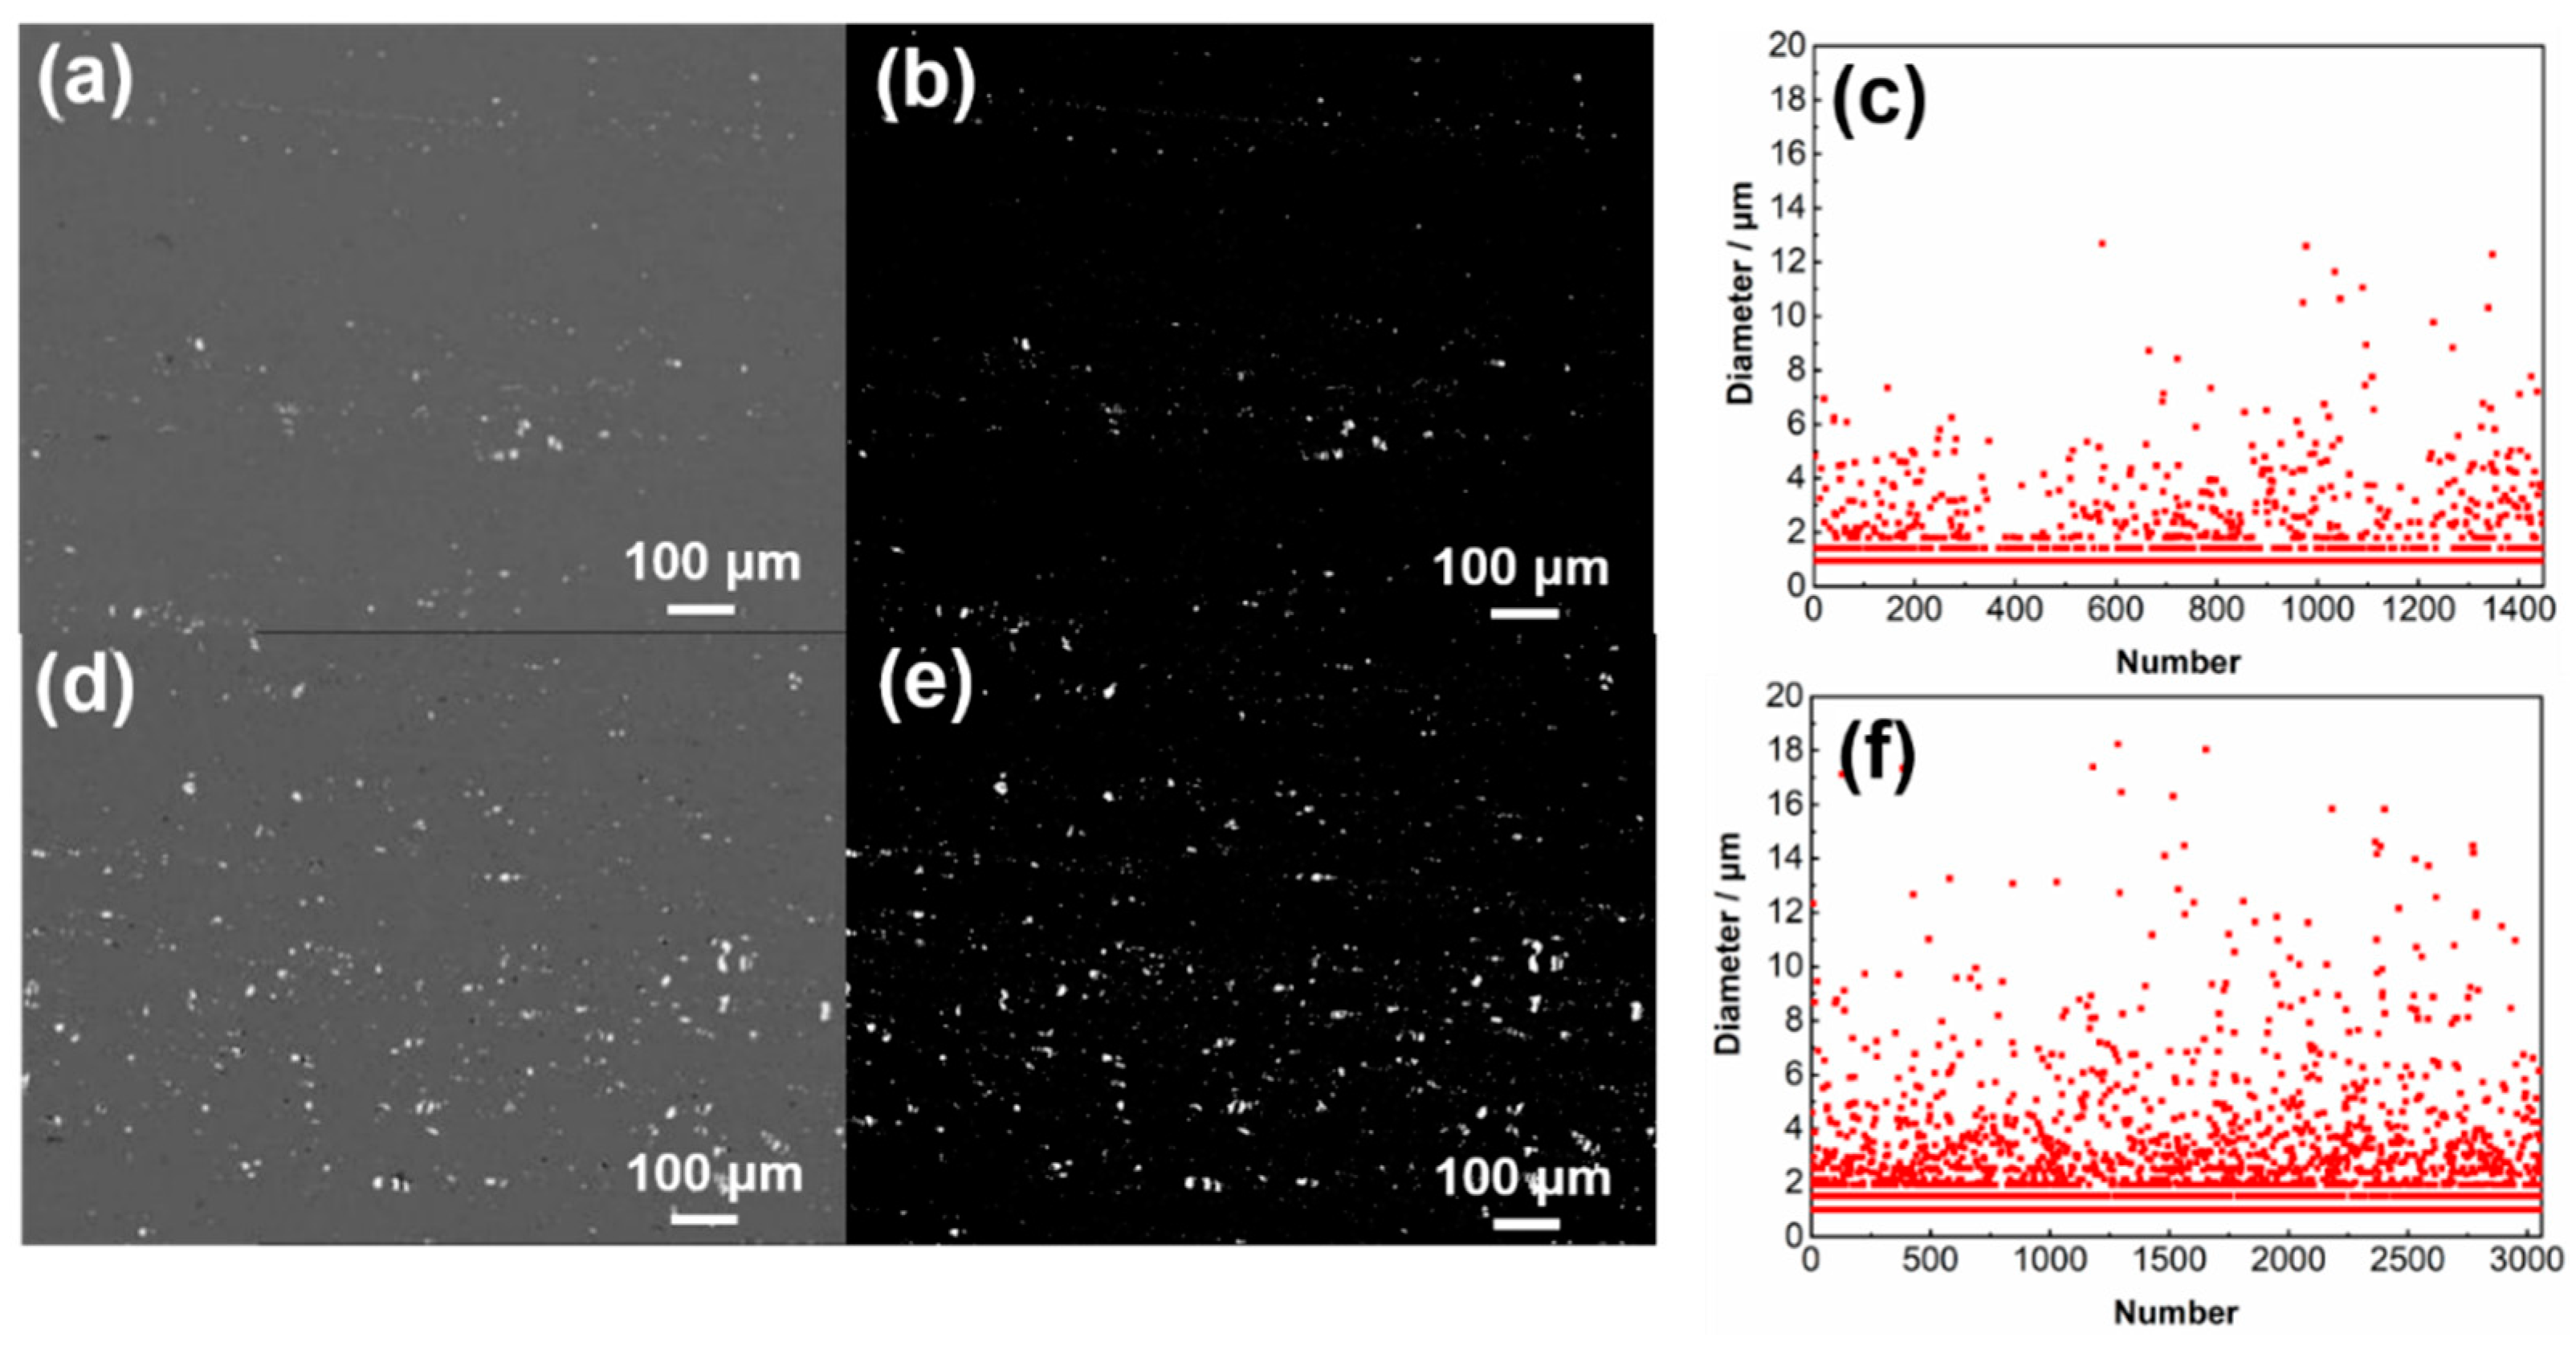
The High Fe and Low Fe alloys were analyzed using backscattered electron imaging to identify the intermetallic particles showing sufficient contrast differential from the surrounding matrix, shown in Figure 3a,d. The constituent particles’ size was further measured from the micrographs by using a greyscale segmentation method, Figure 3b,e. The results of quantitative measurement are present in Figure 3c,f. Decreasing the Fe element’s content produced a significant reduction in both the size and number density of the intermetallic particles. In the observation area, the number of intermetallic particles decreased from 3059 to 1449, a reduction of about 53%. In High Fe alloy, the maximum size of the intermetallic particles is 24 μm, while only 13 μm in low Fe alloy.

3.2. Mechanical Properties

The mechanical properties and density of the materials are listed in Table 2. It is evident that the Low Fe alloy (2A97-T3) exhibits a higher ultimate tensile strength (UTS), tensile yield strength (TYS), and elongation compare to the High Fe alloy. Moreover, these properties have also been shown that the Low Fe alloy had a 20% decrease in FCG rate when ∆K is 33 MPa⋅m1/2. Combine the properties of the damage tolerant 2524-T3 alloy [27,41], the Low Fe alloy (2A97-T3) exhibited a lower density, accompanying with equivalent tensile strength and FCG rate compared to the 2524-T3 alloy. 2A97-T3 is a novel material for use in fuselage skin that offers improved performance due to a combination of low density and high resistance to FCG.
The experimental points, da/dN versus nominal, for High Fe and Low Fe alloys are plotted in Figure 4 for T–L crack orientation on a log-log scale. The da/dN versus curves of both alloys show the three typical fatigue cracking stages (labeled as stages I, II, and III) from the fatigue crack propagation threshold (ΔKth) to the critical amplitude of stress intensity, which final fatigue fracture occurs. It can be observed that, in the near-threshold regime (stage I), the FCG rate of the alloys are almost identical. When ΔK is 8.8 MPa⋅m1/2, the da/dN of the High Fe and Low Fe alloys are 2.32 × 10⁻⁵ mm/cycle and 2.50 × 10⁻⁵ mm/cycle, respectively. In the intermediate-∆K region (stage II), referred to as the Paris regime, the crack length was short. No significant difference in FCG rates was identifiable between the High Fe and Low Fe alloys. When the ΔK is 11.0 MPa⋅m1/2, the FCG rates are 4.88 × 10⁻⁵ mm / cycle and 5.22 × 10⁻⁵ mm/cycle, and the crack size is 6.2 mm and 7.2 mm, respectively. Note that when the ΔK is higher than 11.0 MPa⋅m1/2, the crack growth rates of High Fe and Low Fe alloys gradually differ. The da/dN of High Fe alloy ascended faster than that of Low Fe Alloy with increasing levels of ΔK. Furthermore, it is demonstrated that the High Fe alloy first enters the third stage of crack propagation (stage III). When ΔK is 33 MPa⋅m1/2, the da/dN of Low Fe alloy is 1.8 × 10⁻³ mm/cycle. Nevertheless, the da/dN of High Fe alloy is only 1.4 × 10⁻² mm / cycle. As the fatigue cracks propagate, the specimen eventually fractures.
Figure 5a illustrates the relationship between the High Fe and Low Fe alloys’ crack length and fatigue life. It can be observed that the trend of crack length as a function of life is consistent with that of Figure 4. Initially, both alloys’ crack length is less than 5 mm, and the fatigue cracks propagate slowly. With the increase in the number of cycles, the crack length gradually increases with an increase in FCG rate. When the number of cycles is more than 1.6 × 10⁵ cycles, the High Fe alloy’s crack length starts to exceed Low Fe alloy. However, the crack lengths in the two alloys are similar to the final fracture occurred. Low Fe alloy’s fatigue life reached 2.4 × 10⁵ cycles, with the High Fe alloy exhibiting that of 2.1 × 10⁵ cycles.
The relationship between fatigue crack length and stress intensity factor is demonstrated in Figure 5b. It can be seen that when ΔK is less than 9 MPa⋅m1/2, the variation in crack length is negligible between the two alloys. However, it can be found that with the increase of ΔK, the crack length of high Fe alloy exceeds that of Low Fe alloy. It is reasonable to expect a higher fraction of constituent particles accounted for a higher propagation rate of fatigue crack during stages II and III.
Figure 5c conveys the quantified fatigue life percentage of the two alloys at different stages. The fatigue life fraction of the Low Fe alloy is higher than that of the High Fe alloy during the near-threshold regime and steady-state expansion stage.

3.3. FCG Tests Fractography

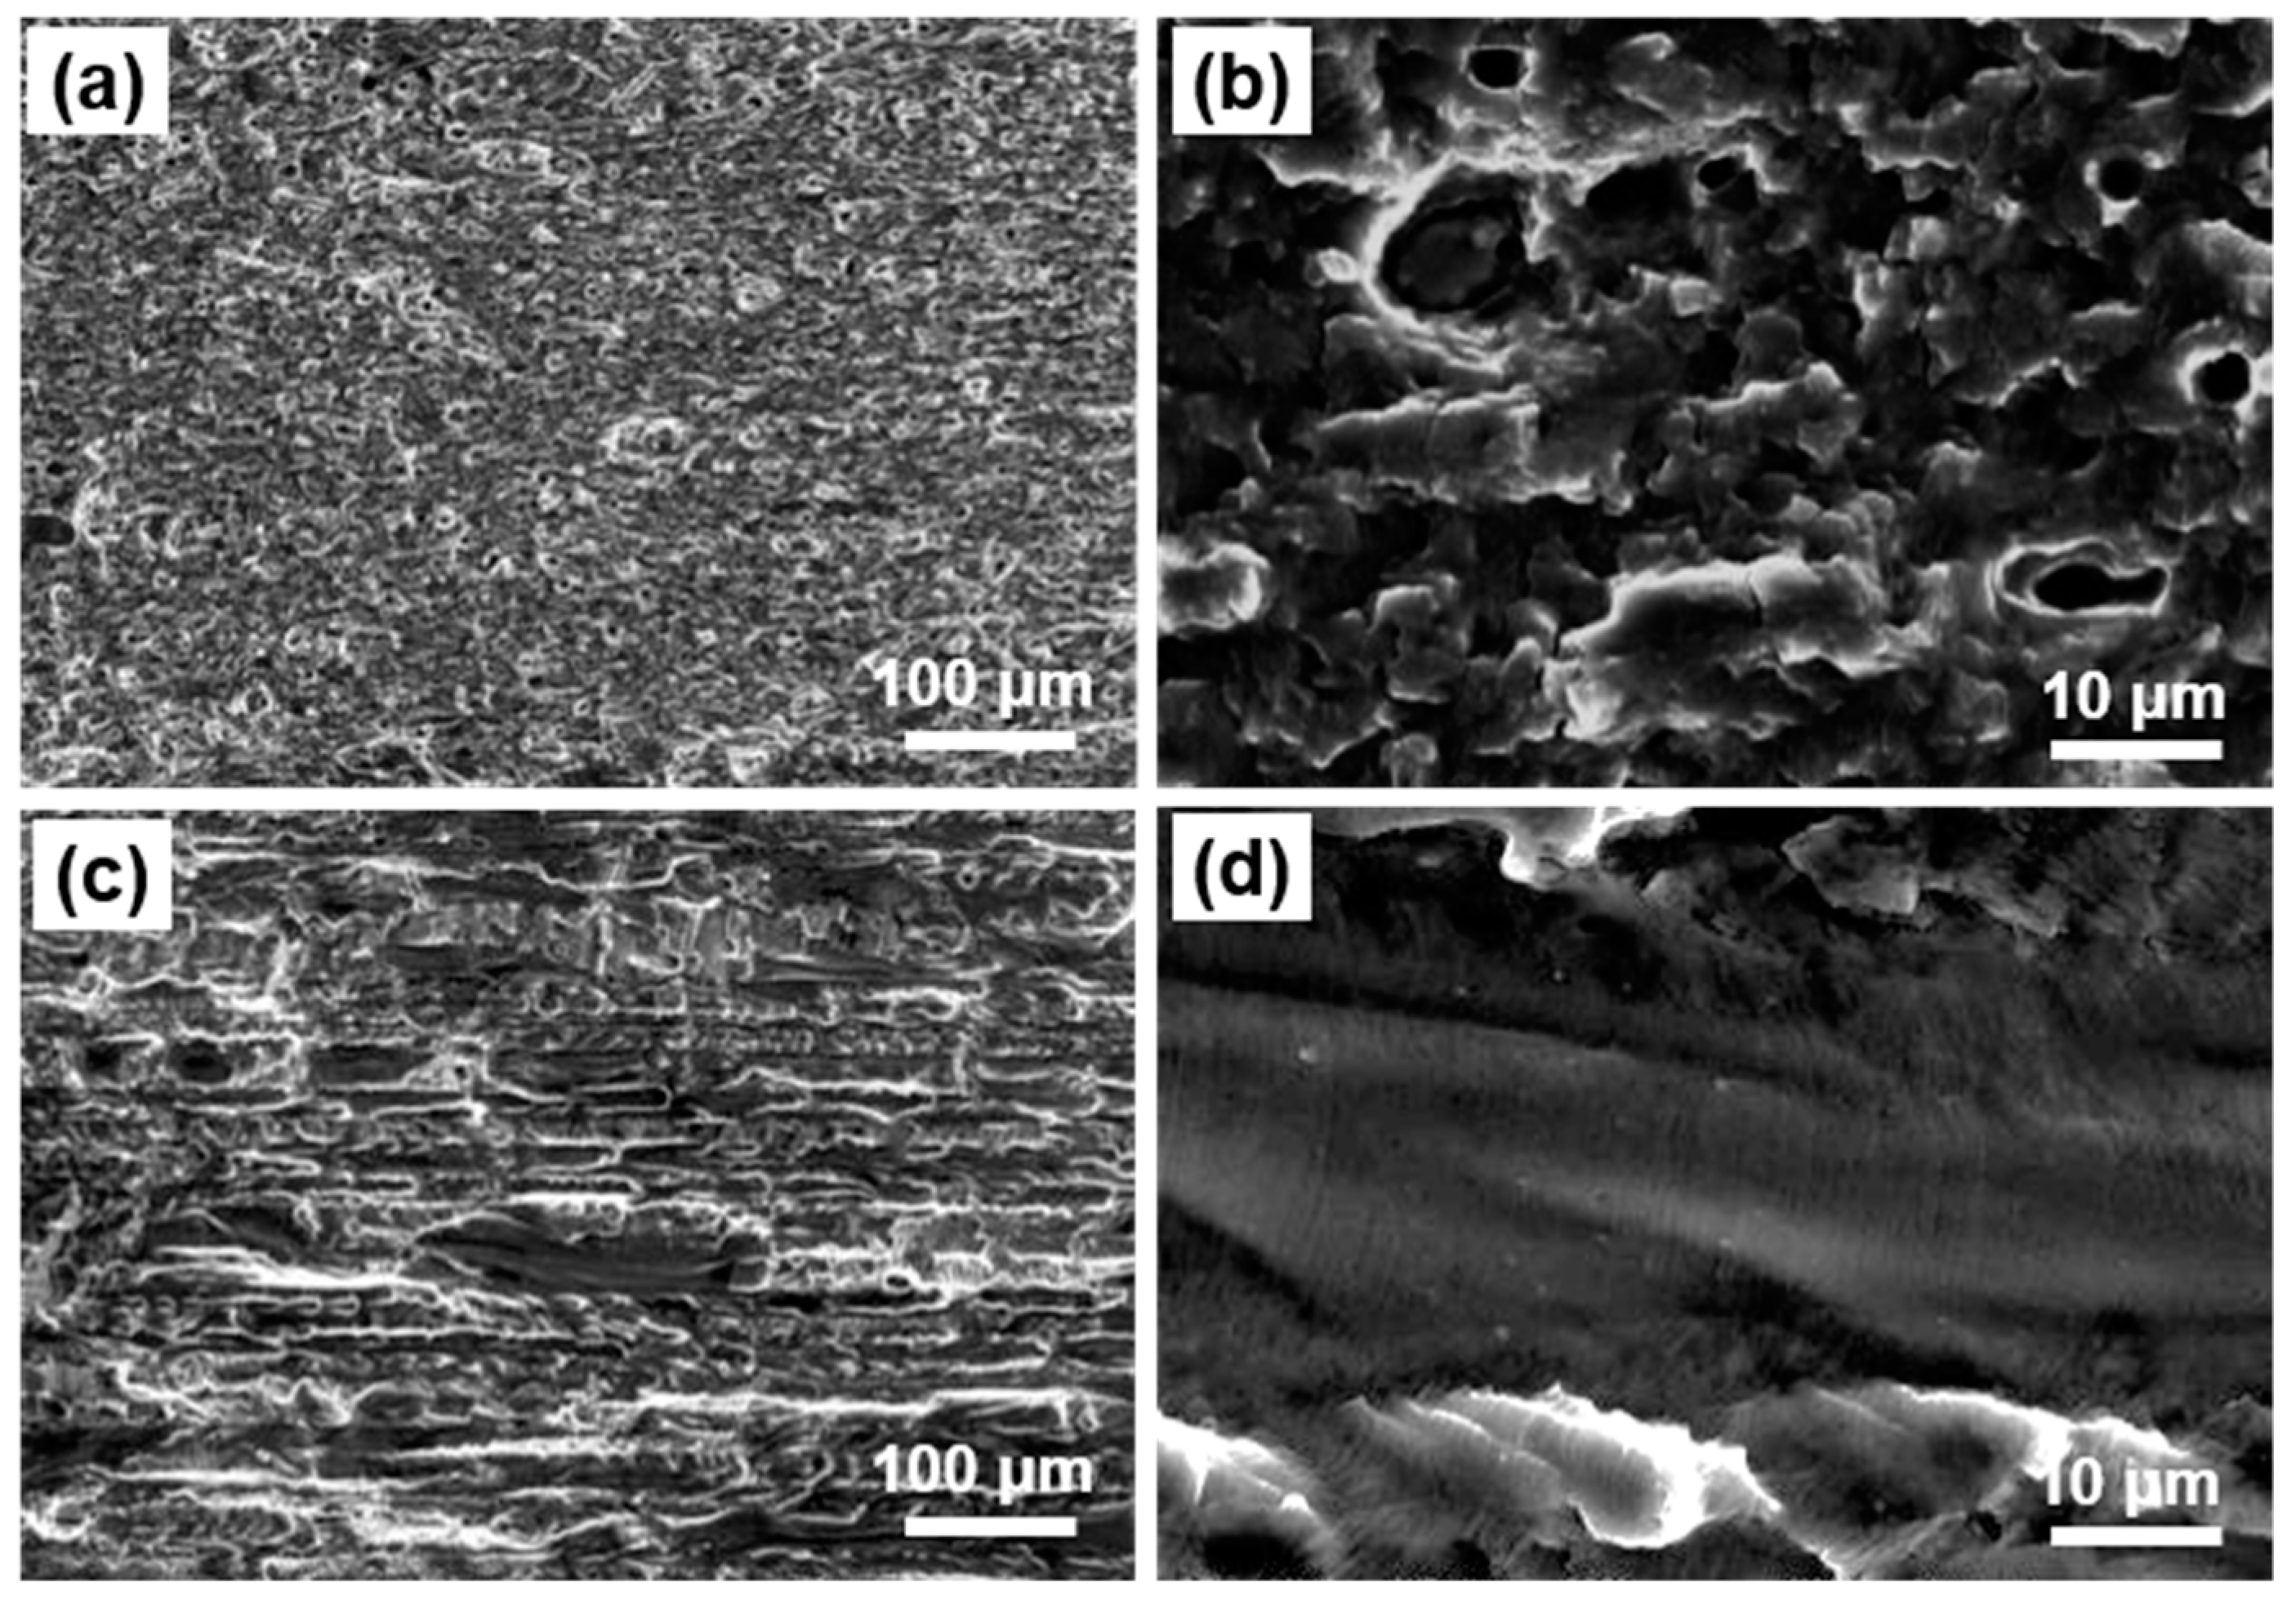
The topography of the fracture surface is significantly varied between stages I, II, and III. Fractography examination was conducted in the regions corresponding to each of the stages based on the experimentally measured crack length values, as shown in Figure 5b. For the intermediate-∆K region, select the crack length region corresponding to ΔK at 10 MPa·m1/2 and 20 MPa·m1/2 for observation. Typical micrographs of the High Fe and Low Fe alloys are present in Figure 6, Figure 7, Figure 8 and Figure 9. The crucial observations are summarized as follows.

3.3.1. The Near-Threshold Regime (Stage I)

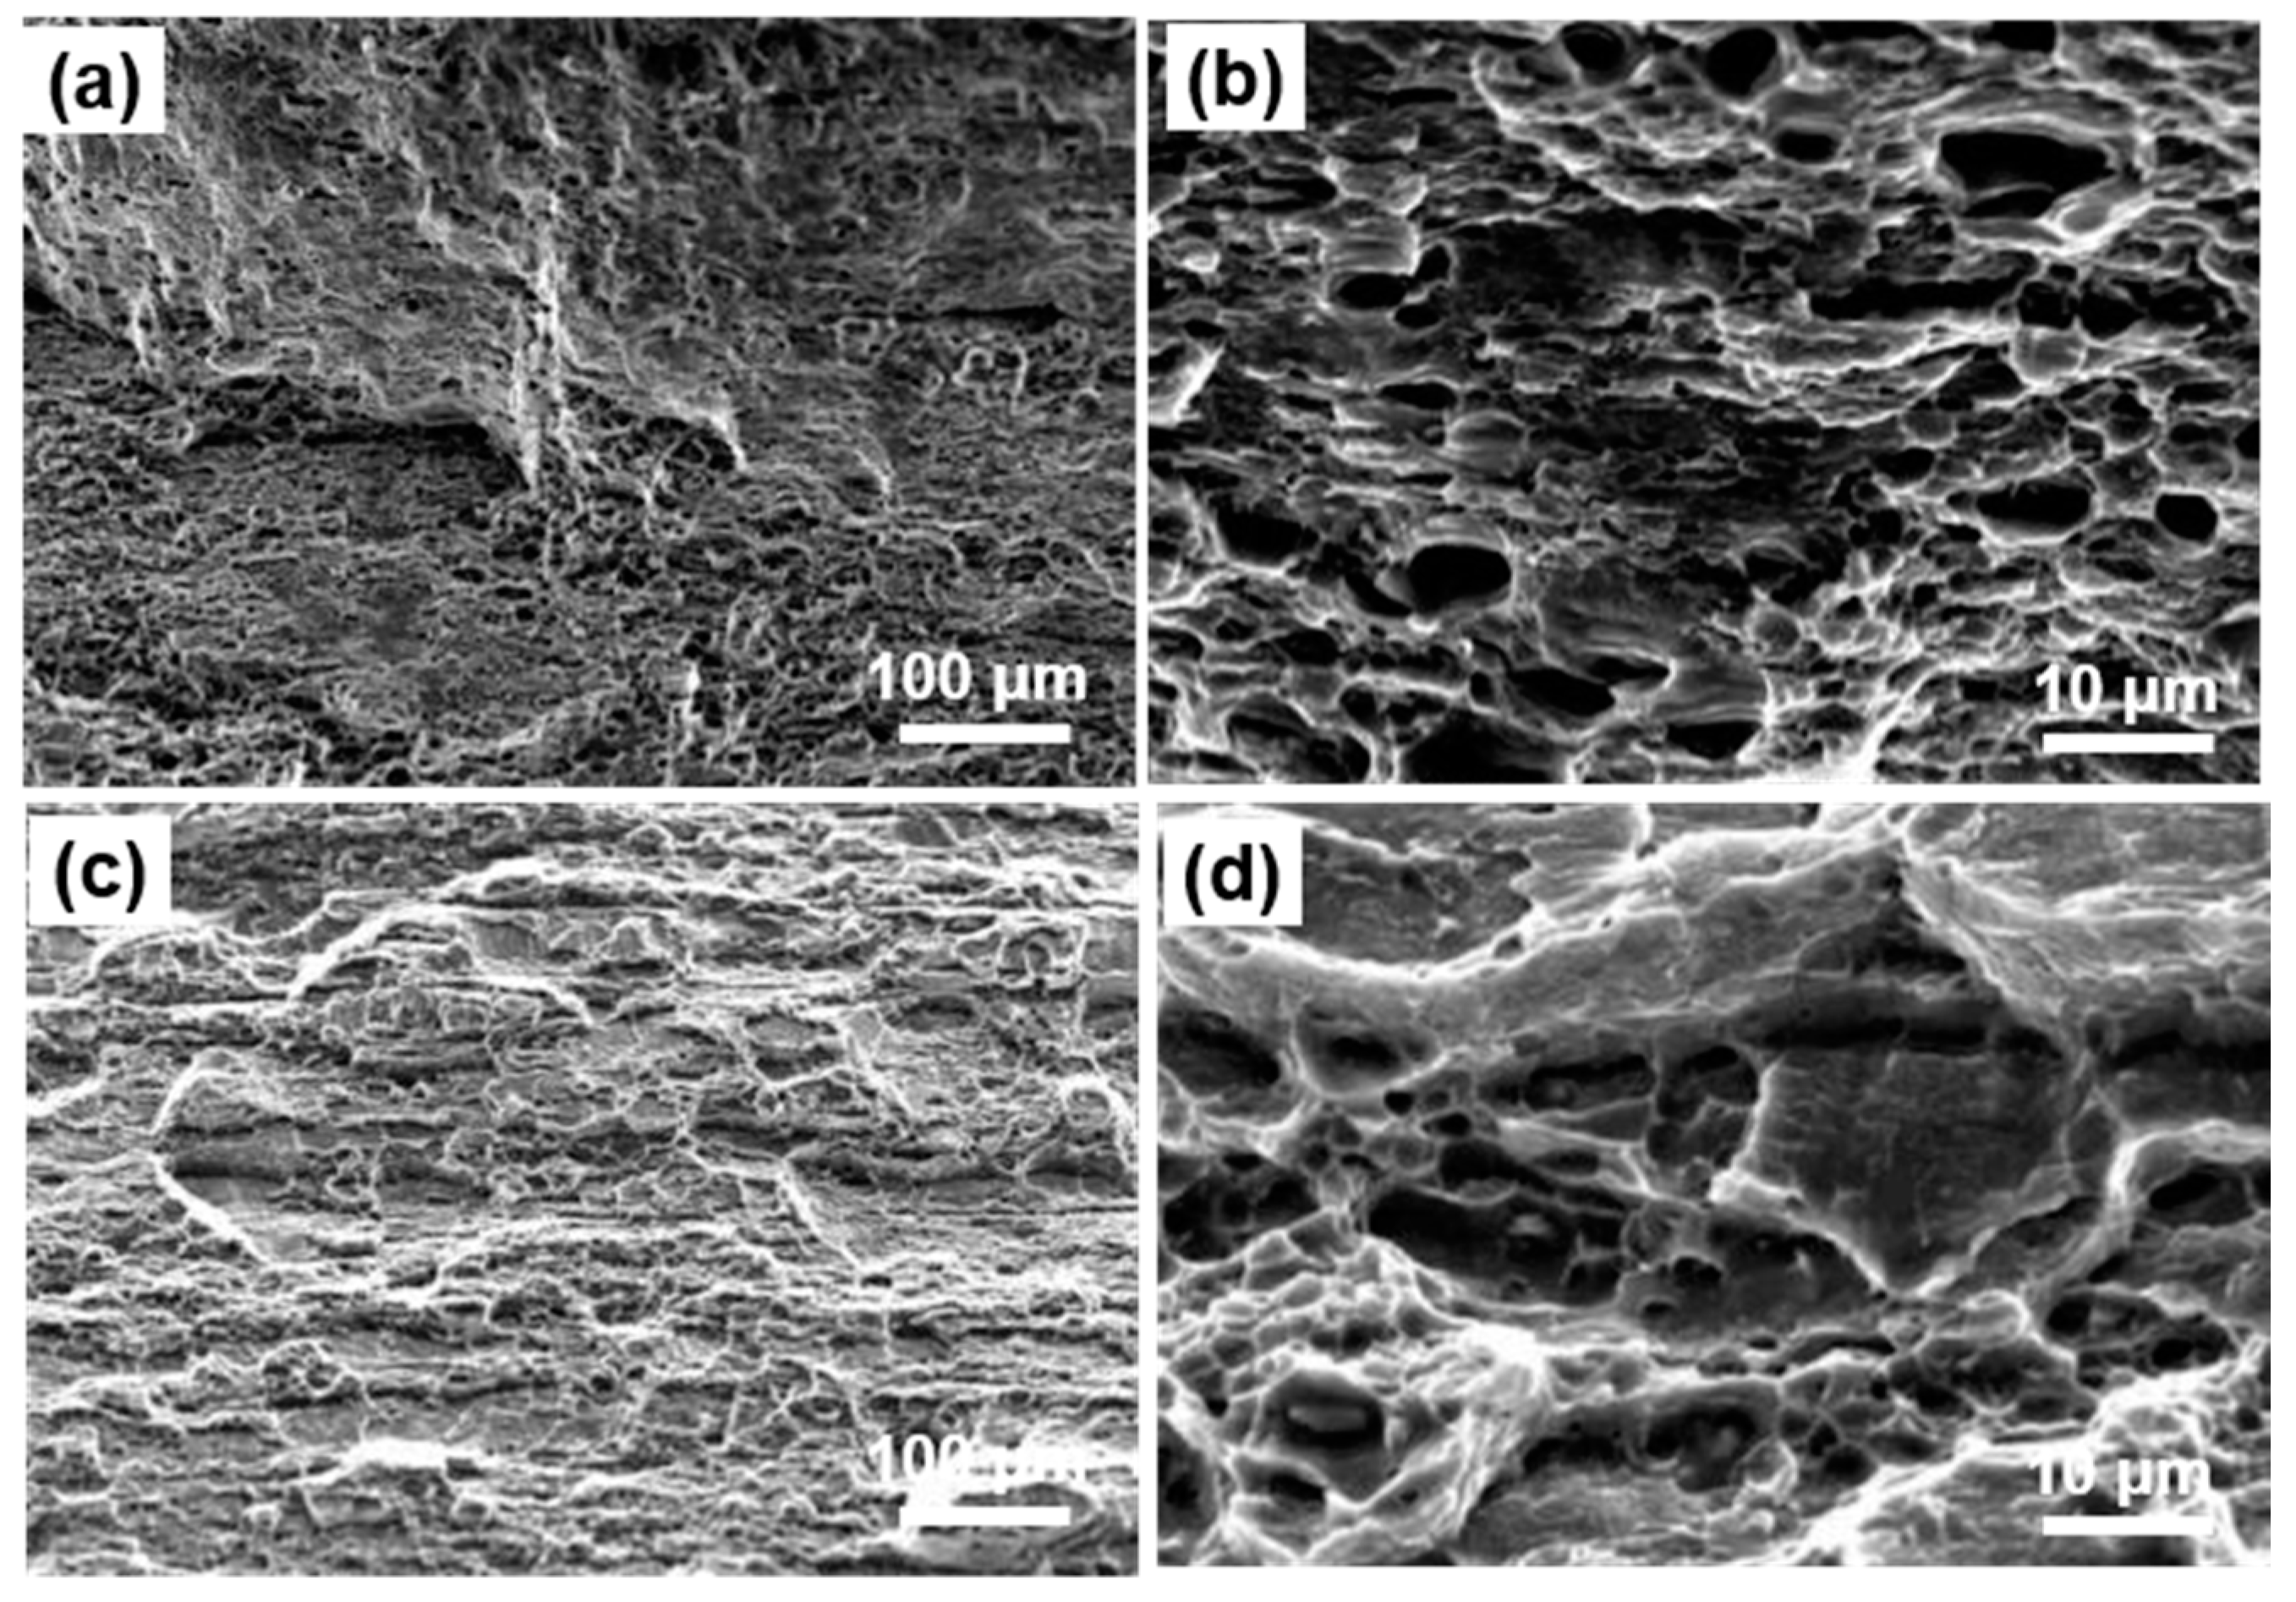
Figure 6a shows the topography of the fracture surface in the High Fe alloy. Fracture surfaces exhibited the typical characteristics resulting from a ductile fracture characterized by small tearing edges and dimples. From the micrographs collected at high magnification (Figure 6b), the dimples with their diameters in the order of 5–10 μm were observed. The aggregates of intermetallic and voids were commonly observed within the dimples. The dimples were also surrounded by the tearing ribs, which were closely spaced, the larger of the intermetallic and the higher of the tearing edges. Figure 6c shows that Low Fe alloy’s fracture surface was predominantly composed of ductile features with some degrees of grain boundary delamination. The tearing ridges were elongated and distributed along the grain boundary. It was also important to note that no dimples were observed, probably due to the small size and intermetallic size. Figure 6d further details the fatigue striations with a width of fewer than 1 μm on the fracture surface.

3.3.2. The Intermediate-∆K Region (Stage II)

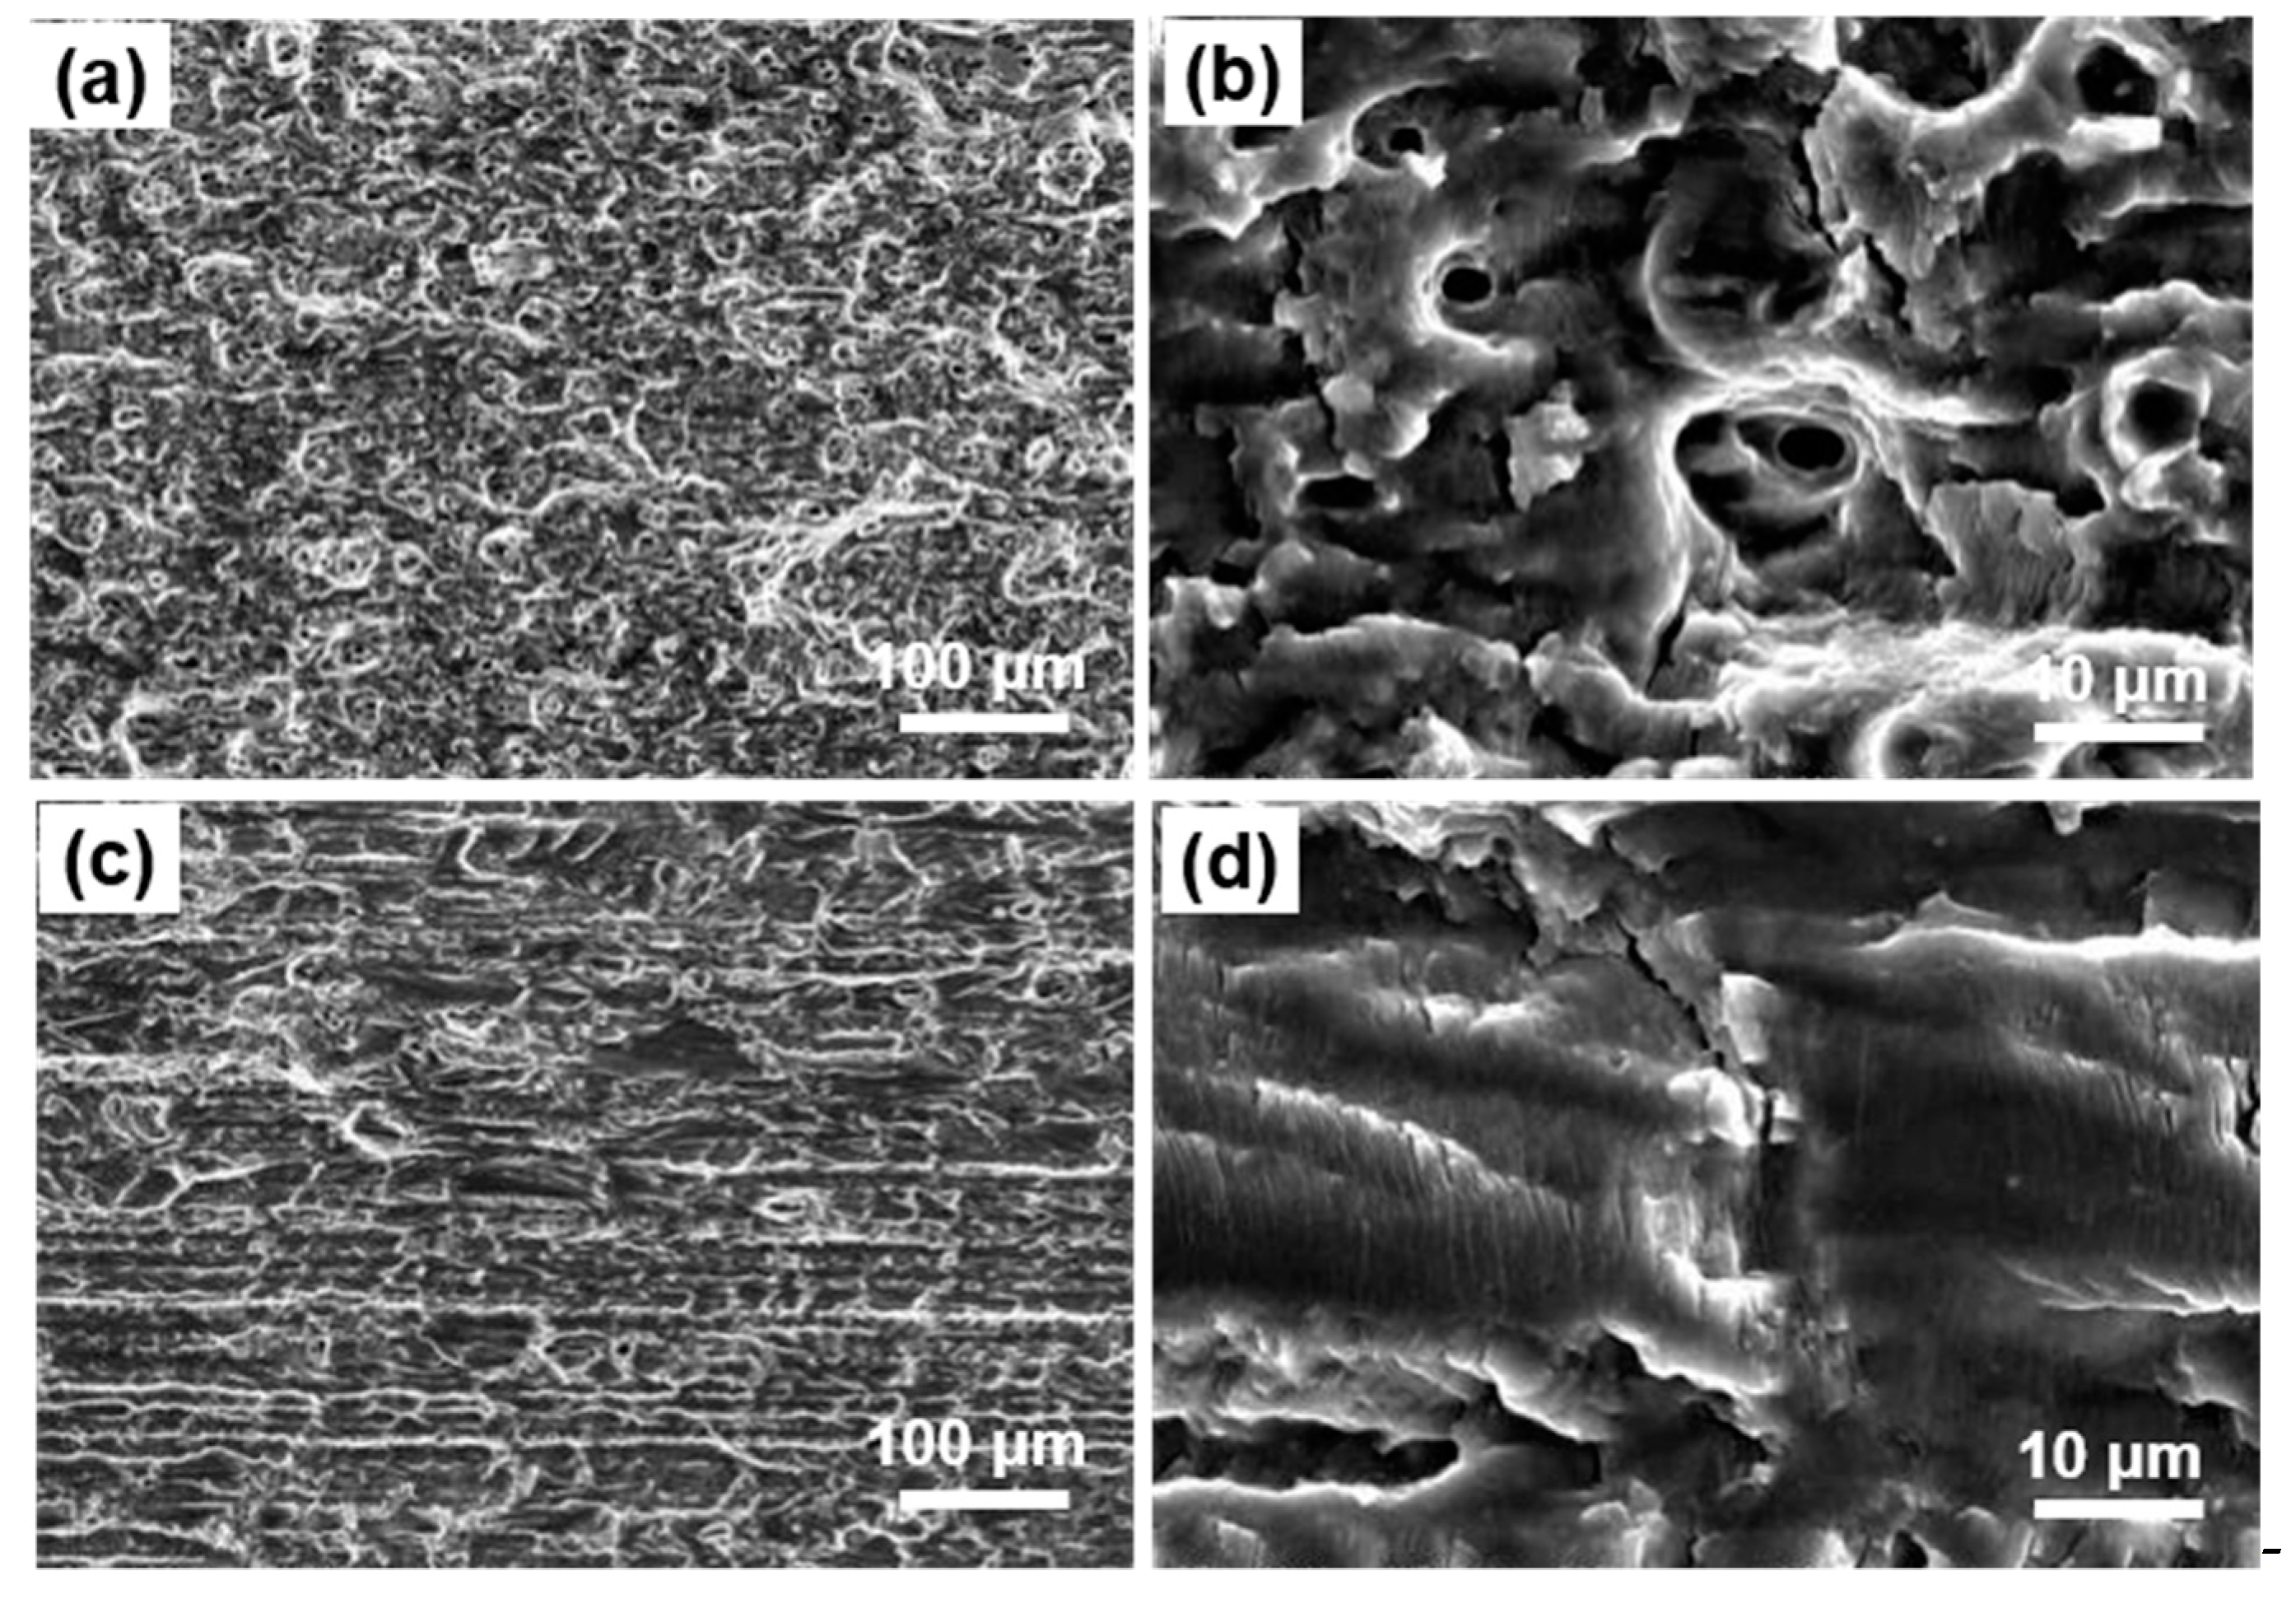
The SEM micrographs in Figure 7 and Figure 8 illustrate the fracture morphology of High Fe and Low Fe alloys upon an amplitude of ΔK at 10 MPa⋅m1/2 and 20 MPa⋅m1/2, respectively. While ΔK was 10 MPa⋅m1/2, the fracture surfaces were more topographic with a higher area fraction of tearing ridges as compared to the High Fe alloy in stage I (Figure 6a). This observation indicated that the material was subjected to a higher stress level and fractured via a multi-slip mechanism. Figure 7b further exhibits evident fatigue bands and secondary cracks in the same region. Figure 7c shows that the height of tearing ridges was increased in Low Fe alloy, with the majority of them being elongated along the grain boundary. Figure 7d shows that the width of fatigue striations is approximately 1 μm. In particular, the fracture surface corresponding to transgranular fracture revealed ripples as formed via a mechanism of multi-slip. In addition, secondary cracks were also noted.
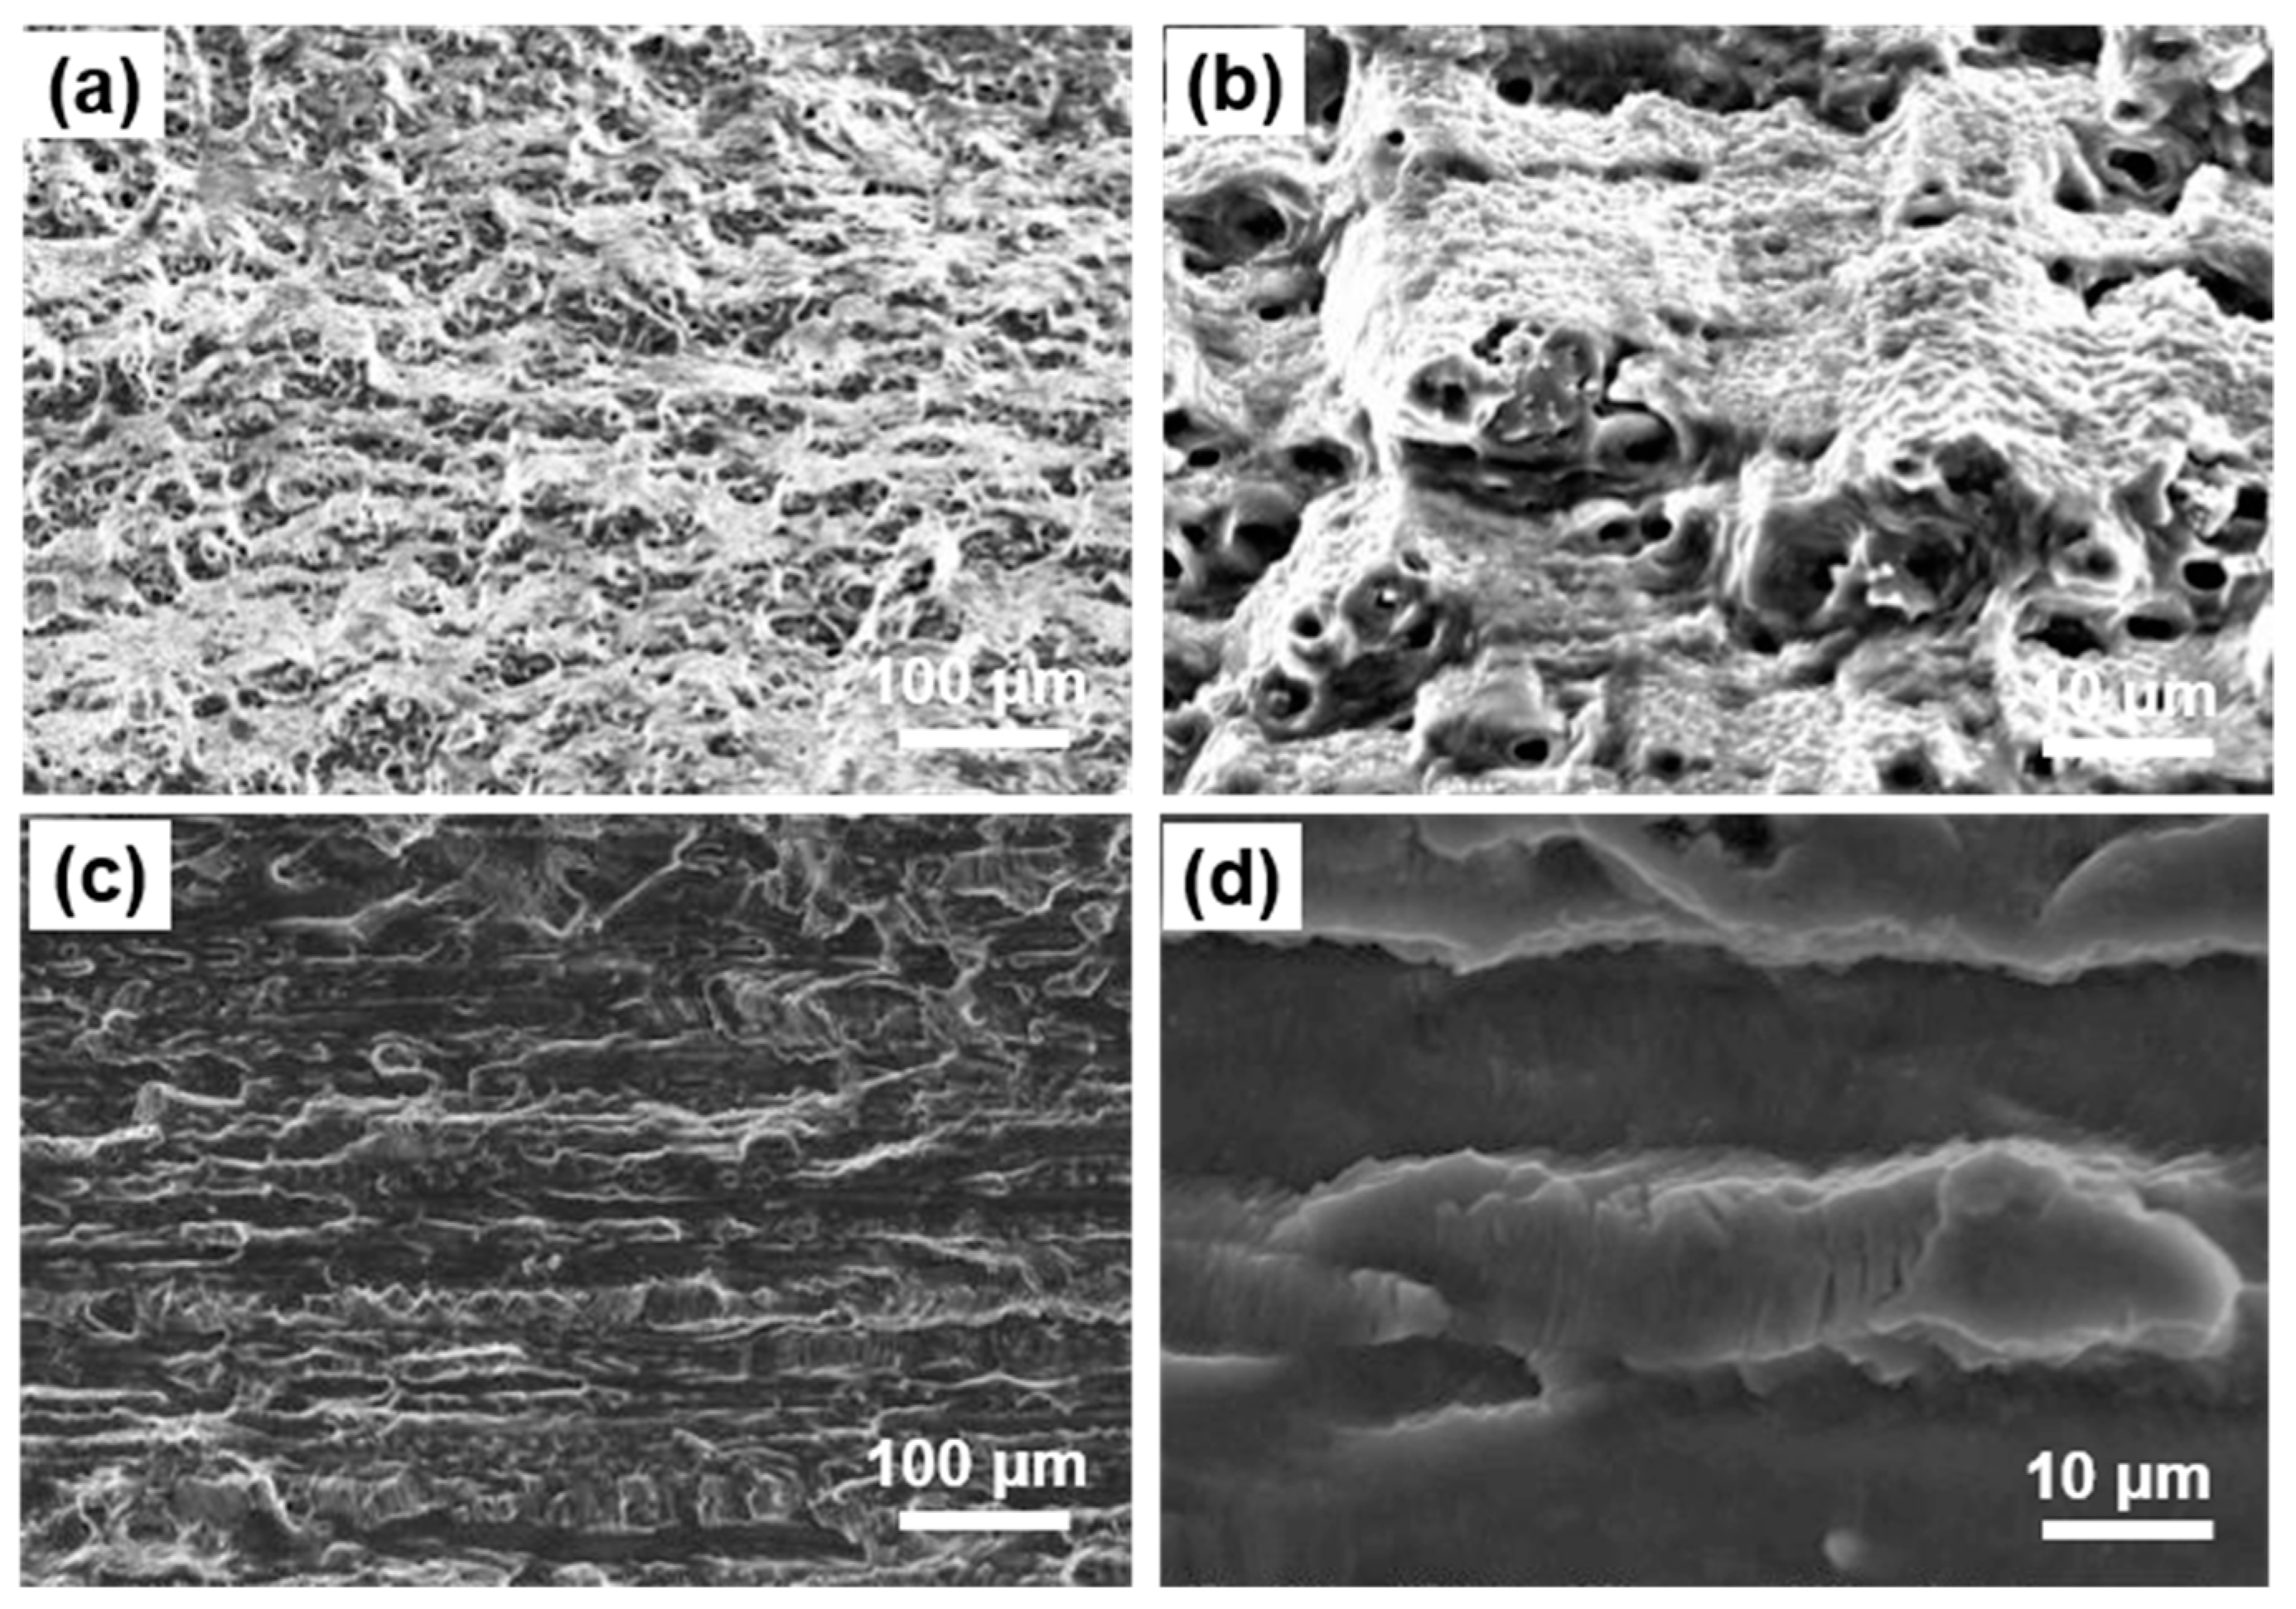
The topography of fracture surface for High Fe alloy was varied compared to the Low Fe alloy upon a value of ΔK at 20 MPa⋅m1/2. Figure 8a and c show a fracture surface composed of dimples with a tilt angle at 45°. This observation indicated that the High Fe alloy had entered the rapid expansion region. However, fatigue striations were observed on the Low Fe alloy’s fracture surface, indicating that the major crack was in a steady-state propagation region.

3.3.3. The High-∆K Region (Stage III)

The SEM micrographs in Figure 9 illustrate the fracture morphology of High Fe and Low Fe alloys at the high ∆K region. Fracture surfaces of both alloys exhibited the most evident ductile features characterized as the dimples with a close association with intermetallic particles. The fracture surface of High Fe alloy also included tearing ridges and slip shear fracture facets.

3.4. In-Situ SEM Fatigue

In order to investigate the fatigue crack evolution under cyclic tress loading in High Fe and Low Fe alloys, the non-notched sample were used for the in-situ SEM observation. The fatigue crack length versus the number of load cycles curve for High Fe alloy and Low Fe alloy is plotted in Figure 10a. Since the crack was deflected during the propagation process, the crack length was calculated based on its projection distance in the horizontal direction. It could be seen that the crack length of the both alloys had the same trend with the number of loading cycles. No obvious crack was observed at the initial loading stage, which termed as the no-crack stage or the microcrack propagation stage (stage I). In the present study, the microcrack length less than 20 μm was defined as the microcrack propagation stage. When the detectable crack appeared, the crack length changed slowly with the number of cycles, which could be regarded as the steady-state crack propagation stage (stage II). When the crack length exceeded a certain value, the crack length increased rapidly with the number of load cycles until it collapsed, regarding as a rapid crack propagation stage (stage III). Meanwhile, it also could be seen that the fatigue life of Low Fe alloy was higher than that of Low Fe alloy. The measurement showed that the crack lengths of the Low Fe and High Fe alloys in stage I and stage II were 20–213 μm and 20–132 μm, respectively.
Figure 10b illustrates the quantified fatigue life percentage of both alloys at different stages. The fatigue life fraction of the Low Fe alloy in stage I and stage II were 29.45% and 54.96%, while only 45.79% and 41.13% for the High Fe alloy, indicating that the coarse constituent particles seriously reduces the ability of the Al-Cu-Li-Mg-Zr alloy to resist fatigue crack initiation and propagation, which was consistent with the results in the FCG tests (shown in Figure 5c).
Figure 11a provides the in-situ observation of fatigue crack initiation of Low Fe alloy. It was seen that a large number of slip bands appeared near the notch position and no evidence for the crack after loading 10,544 cycles, shown in Figure 11a. Note from Figure 11b that the crack nucleated at the notch position is about 19 μm after High Fe alloy was loaded for 6738 cycles. It was observed that a large number of constituent particles of different sizes were distributed both inside the grains and grain boundaries. Slip zones were included, and there was evidence that the cracks sprouted from the notch and extended along the grain boundaries. Figure 11c shows the stress concentration caused by the falling of the constituent particles, leading to crack initiation. It was to be expected that the crack initiation of the Low Fe alloy was late, and initiation at the slip zone. Conversely, the cracks in High Fe alloy initiated faster and propagated along the grain boundaries.
Figure 12 represents the micrographs for crack growth evolution under different loading cycles of Low Fe alloy. As shown in Figure 12a, after 29,523 loading cycles, a large number of slip bands were generated at the notch, resulting in a transverse crack, with a crack length of 40 μm. Figure 12b shows that the main crack crossed the grain boundary into the next grain along the deflection direction of the slip plane. It showed that the crack propagated in the direction of the slip system in an entirely shear mode. Figure 12c–e show the crack propagation behavior when passing through the constituent particles. It was observed that when the crack expanded along with the slip bands, the constituent particles would guide the crack propagation to it indicated that the stress concentration around the constituent particles was relatively large. Before the crack expanded to the constituent particles, the constituent particles had debonded from the matrix to form microcracks, causing the cracks to expand to the constituent particles’ weak interface. Figure 12f shows that the crack deflection spread along with the grain boundary and the crack bifurcates. Figure 12g is the crack’s morphology before the sample fractured, indicating that fatigue crack growth occurred in Low Fe alloy in a transgranular mode, combined with a minimal intergranular feature.
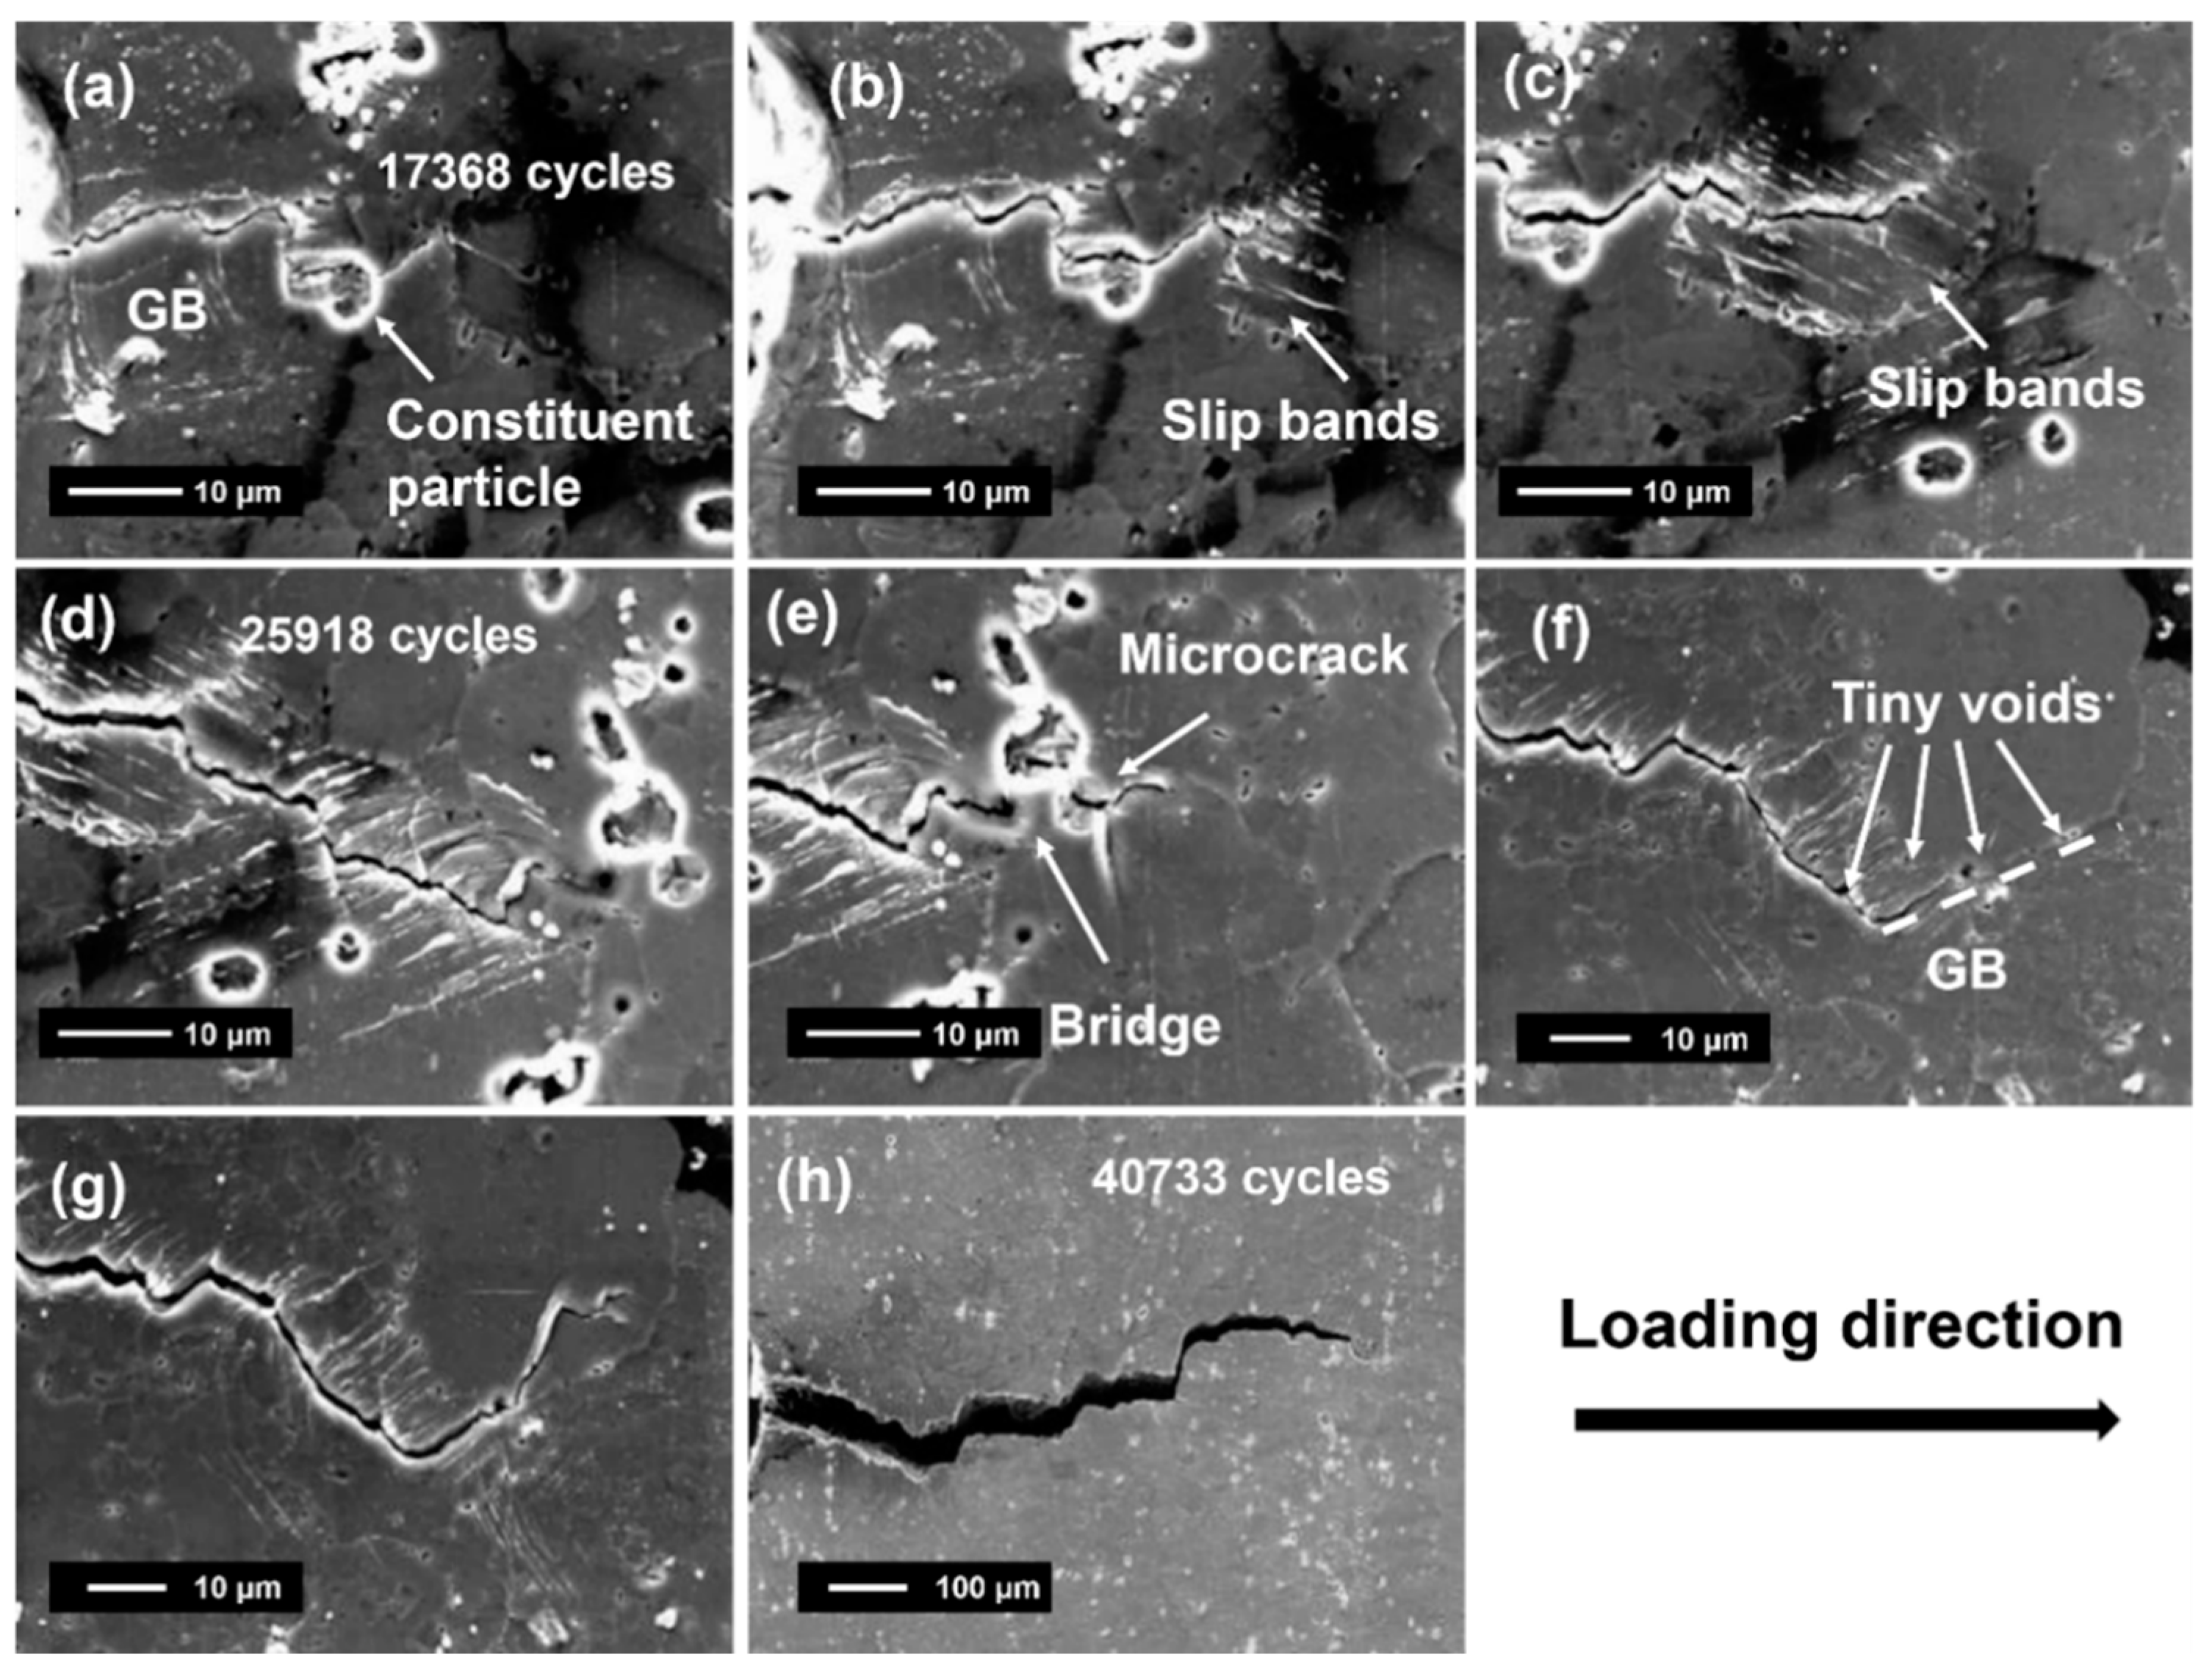
Figure 13 represents the micrographs for crack growth evolution under different loading cycles of High Fe alloy. As shown in Figure 13a, the crack length was about 35 μm after 17,368 loading cycles. It could be observed that the crack propagated along the grain boundary, and the crack deflects the constituent particles. A small amount of slip band appeared in the front grain. With the increase of the number of loading, it is observed from Figure 13c that the slip bands within the grain in front of the crack are increasing. Similar to the transgranular propagation of Low Fe alloy, the cracks in the alloys were also dominated by the propagation mechanism along with the shear slip band.
Figure 13d,e show the interaction of the crack with the large-sized constituent particles. The length of the crack was about 86.7 μm after 25,918 loading cycles. It could be seen that the crack was deflected due to the constituent particles in the front, shown in Figure 13d. It also could be seen from Figure 13e that the crack continuously cut through the constituent particles and bridged with the main crack after it encountered the constituent particles. Meanwhile, the crack length and life curve displayed a sudden increase in the crack length (shown in Figure 10a).
Figure 13f shows the interaction between the crack and the small-sized constituent particles. It could be seen that there were a large number of tiny voids left by the constituent particles shedding at the grain boundary in front of the crack, with a size of about 1 μm. The micron-level constituent particles of the grain boundary had fallen off to form a cavity, which reduced the grain boundary’s strength, and the crack propagated along the grain boundary. At the same time, it was observed that multiple slips have sprouted from the cavity. These slip bands and voids worked together to reduce the grain boundary’s strength and the intragranular strength, promoting cracks.
Figure 13g,h show the morphology of the crack propagating rapidly before it fractured. The behavior contrasted with that observed in the Low Fe alloy in which still dominated by the transgranular mode; nevertheless, due to the high level of the Fe element, the intergranular propagation has increased obviously.

4. Discussion

In order to investigate the whole progress of fatigue crack evolution under cyclic tress loading in High Fe and Low Fe alloys, the non-notched sample was used for the in-situ SEM observation. The fatigue crack length versus the number of load cycles curve for High Fe and Low Fe alloys is plotted in Figure 10a. Since the crack was deflected during the propagation process, the crack length was calculated based on its horizontal direction’s projection distance. It could be seen that the crack length of both alloys had the same trend with the number of loading cycles. No obvious crack was observed at the initial loading stage, termed as the no-crack stage or the microcrack propagation stage (stage I). The microcrack length of less than 20 μm was defined as the microcrack propagation stage in the present study. When the detectable crack appeared, the crack length changed slowly with the number of cycles, which could be regarded as the steady-state crack propagation stage (stage II). When the crack length exceeded a specific value, the crack length increased rapidly with the load cycle number until it collapsed, regarding a rapid crack propagation stage (stage III). Meanwhile, it also could be seen that the Low Fe alloy’s fatigue life was higher than that of Low Fe alloy. The measurement showed that the Low Fe alloy and High Fe alloy’s crack lengths in stage I and stage II were 20–213 μm and 20–132 μm, respectively.
Figure 10b illustrates the quantified fatigue life percentage of both alloys at different stages. The fatigue life fraction of the Low Fe alloy in stage I and stage II were 29.45% and 54.96%, while only 45.79% and 41.13% for the High Fe alloy, indicating that the coarse constituent particles seriously reduces the ability of the Al-Cu-Li-Mg-Zr alloy to resist fatigue crack initiation and propagation, which was consistent with the results in the FCG tests (shown in Figure 5c).
In Figure 11, the fatigue crack initiation of 2A97-T3 alloy is observed in addition to the slip band’s initiation and the crack initiation caused by the constituent particles. There are two ways for the constituent particles to induce crack initiation: Firstly, cracks initiate the interface between the constituent particles and the matrix. Due to the difference in elastic modulus between constituent particles and the matrix, stress concentration is likely to occur locally at the interface of particles with the surrounding matrix. This stress concentration leads to cracking or sticking to the matrix, making the particles preferred locations for fatigue crack initiation. With the increase of the number of load cycles, cyclic softening occurs at the interface. When the stress exceeds the yield strength of the matrix, cracks are formed.
Secondly, cracks are initiated in the cavities formed by the shedding of the constituent particles. Moreover, it usually occurs on the surface of the material. Figure 11 shows the crack initiation caused by the constituent particle shedding. When the constituent particle shedding, stress concentration is formed near the cavities. The dislocations continue to gather around the cavities, thereby initiating cracks.
As discussed in Figure 6, it is noticed that the fracture topography in the High Fe alloy includes a large number of voids formed on the intermetallic particles shedding in the near-threshold region. Therefore, the coarse Fe constituent particles accelerate the initiation of fatigue crack of the Al-Cu-Li-Mg-Zr alloys.
It can be seen from Figure 5c and Figure 10b that the fatigue life percentage for the fatigue crack propagation stage (stage II and stage III) of High Fe alloy is lower than that of Low Fe alloy. In terms of the coarse Fe constituent particles’ effect on the fatigue crack propagation behavior, intergranular propagation and bridging effect were two main Intrinsic mechanisms. Figure 14 is the schematic diagrams illustrating the constituent particles’ effect on the FCG behavior in High Fe and Low Fe alloys. For the High alloy, when the main crack propagates to the grain boundary distributed with a large number of coarse constituent particles, it will reduce the strength of the grain boundary and promote the crack to choose low energy to propagate along the grain boundary (shown in Figure 14a). Meanwhile, the fatigue life is reduced, especially the fatigue crack’s life in the steady-state propagation stage.
More importantly, coarse particles’ effect is mostly conveyed through the formation of secondary micro-cracks around the coarse constituent particles. As demonstrated in Figure 14b,d, compared to the Low Fe alloy, these micro-cracks in the High Fe alloy are merged with the major crack (macro-crack); once the bridging effect occurs, fatigue crack growth will be accelerated, which has significantly shortened the length of the Paris regime zone, leading to the early fracture of the specimen.

5. Conclusions

Sheets of Al-3.8 Cu-1.5 Li-0.4 Mg-0.11 Zr alloy with different Fe contents were prepared by cold rolling and followed by solution heat treatment, water quenching, and stretching. A combination of fatigue testing and systematic metallographic examination has facilitated an evaluation of Fe element content’s effect containing constituent particles on FCG behavior in the Al-3.8 Cu-1.5 Li-0.4 Mg-0.11 Zr alloys. The results are summarized as follows:
  • Compared to the alloy with a high Fe content level, the alloy with a low Fe content level exhibits a higher ultimate tensile strength, tensile yield strength, and elongation. Especially when ∆K is 33 MPa⋅m1/2, the FCG rate decreases by 20%. Moreover, the alloy with a low Fe content level (2A97-T3) exhibited a lower density, accompanying equivalent tensile strength and FCG rate compared to damage-tolerant 2524-T3 alloy.
  • The coarse Fe constituent particles accelerate the initiation and propagation of fatigue crack of the Al-3.8 Cu-1.5 Li-0.4 Mg-0.11 Zr alloys. The fatigue crack growth of both alloys is dominated by transgranular expansion, accompanied by intergranular expansion. The alloy with a high level of Fe content alloy presents more characteristics of intergranular expansion.
  • It is postulated here that the micro-cracks formed around the coarse Fe-containing particles are merged with the primary crack to produce a bridging effect, accelerating the growth of fatigue crack in the alloy with a high level of Fe content.

Author Contributions

Conceptualization, G.-A.L. and J.-Z.C.; Data curation, M.H. and R.W.; Formal analysis, L.W.; Funding acquisition, J.-Z.C.; Investigation, M.H.; Methodology, M.H. and L.W.; Supervision, G.-A.L.; Writing—original draft, M.H. All authors have read and agreed to the published version of the manuscript.

Funding

This work was financially supported by the National Natural Science Foundation of China (No. 51474195).

Institutional Review Board Statement

Not applicable.

Informed Consent Statement

Not applicable.

Data Availability Statement

Not applicable.

Conflicts of Interest

The authors declare no conflict of interest.

References

  1. Gayle, F.W.; Heubaum, F.H.; Pickens, J.R. Structure and properties during aging of an ultra-high strength Al-Cu-Li-Ag-Mg alloy. Scr. Metall. Mater. 1990, 24, 79–84. [Google Scholar] [CrossRef]
  2. Starke, E.A.; Staley, J.T. Application of modern aluminum alloys to aircraft. Prog. Aerosp. Sci. 1996, 32, 131–172. [Google Scholar] [CrossRef]
  3. Rioja, R.J. Fabrication methods to manufacture isotropic Al-Li alloys and products for space and aerospace applications. Mater. Sci. Eng. A 1998, 257, 100–107. [Google Scholar] [CrossRef]
  4. Araullo-Peters, V.; Gault, B.; Geuser, F.D.; Deschamps, A.; Cairney, J.M. Microstructural evolution during ageing of Al–Cu–Li–x alloys. Acta Mater. 2014, 66, 199–208. [Google Scholar] [CrossRef] [Green Version]
  5. Dong, Y.H.; He, X.F.; Sun, X.N.; Li, Y.H. Fatigue crack growth of a corner crack at the edge of a hole. Int. J. Fatigue 2020, 139, 105699. [Google Scholar] [CrossRef]
  6. Rocha, M.M.; Schuëller, G.I. A probabilistic criterion for evaluating the goodness of fatigue crack growth models. Eng. Fract. Mech. 1996, 53, 707–731. [Google Scholar] [CrossRef]
  7. Lados, D.A. Chapter 17—Design for fatigue crack growth resistance in aluminum alloys. In Fundamentals of Aluminium Metallurgy, 1st ed.; Lumley, R., Ed.; Woodhead Publishing: Cambridge, UK, 2011; pp. 504–537. [Google Scholar]
  8. Wanhill, R.J.H.; Bray, G.H. Chapter 12—Fatigue Crack Growth Behavior of Aluminum–Lithium Alloys. In Aluminum-Lithium Alloys Processing, Properties, and Applications, 1st ed.; Prasad, N.E., Gokhale, A., Wanhil, R.J.H., Eds.; Butterworth-Heinemann: Oxford, UK, 2014; pp. 381–413. [Google Scholar]
  9. Shou, W.B.; Yi, D.Q.; Liu, H.Q.; Tang, C.; Shen, F.H.; Wang, B. Effect of grain size on fatigue-crack growth in 2524 aluminium alloy. Int. J. Fatigue 2016, 84, 9–16. [Google Scholar]
  10. Rioja, R.J.; Liu, J. The evolution of Al-Li base products for aerospace and space applications. Metall. Mater. Trans. A 2012, 43A, 3325–3337. [Google Scholar] [CrossRef]
  11. Li, F.D.; Liu, Z.Y.; Wu, W.T.; Xia, P.; Ying, P.Y.; Zhao, Q.; Li, J.L.; Bai, S. On the role of texture in governing fatigue crack propagation behavior of 2524 aluminum alloy. Mater. Sci. Eng. A 2016, 669, 367–378. [Google Scholar] [CrossRef]
  12. Zhang, Z.F.; Wang, Z.G. Dependence of intergranular fatigue cracking on the interactions of persistent slip bands with grain boundaries. Acta Mater. 2003, 51, 347–364. [Google Scholar] [CrossRef]
  13. Estrin, Y.; Vinogradov, A. Fatigue behaviour of light alloys with ultrafine grain structure produced by severe plastic deformation: An overview. Int. J. Fatigue 2010, 32, 898–907. [Google Scholar] [CrossRef]
  14. Cauthen, C.; Anderson, K.V.; Avery, D.Z.; Baker, A.; Williamson, C.J.; Daniewicz, S.R.; Jordon, J.B. Fatigue Crack Nucleation and Microstructurally Small Crack Growth Mechanisms in High Strength Aluminum Alloys. Int. J. Fatigue 2020, 140, 105790. [Google Scholar] [CrossRef]
  15. Harlow, D.G.; Nardiello, J.; Payne, J. The effect of constituent particles in aluminum alloys on fatigue damage evolution: Statistical observations. Int. J. Fatigue 2010, 21, 505–511. [Google Scholar] [CrossRef]
  16. Soni, K.K.; Williams, D.B.; Chabala, J.M.; Levi-Setti, R.; Newbury, D.E. Electron and ion microscopy studies of Fe-rich second-phase particles in Al-Li alloys. Acta Metall. Mater. 1992, 40, 663–671. [Google Scholar] [CrossRef]
  17. Tiryakioglu, M.; Staley, J.T. Physical Metallurgy and Processes. In Handbook of Aluminum; Totten, G.E., Mackenzie, D.S., Eds.; Marcel Dekker: New York, NY, USA, 2003; Volume 1, p. 123. [Google Scholar]
  18. Lin, F.S. Effect of intermetallic particles on the fracture behavior of aluminum alloy 2020. Metallurgical 1983, 16, 361–373. [Google Scholar] [CrossRef]
  19. Lynch, S.P.; Wanhill, R.J.H.; Byrnes, R.T.; Bray, G.H. Chapter 13: Fracture Toughness and Fracture Modes of Aerospace Aluminum–Lithium Alloys. In Aluminum-Lithium Alloys Processing, Properties, and Applications, 1st ed.; Prasad, N.E., Gokhale, A., Wanhil, R.J.H., Eds.; Butterworth-Heinemann: Oxford, UK, 2014; pp. 415–455. [Google Scholar]
  20. Buck, O.; Marcus, H.L. Fatigue crack initiation and early propagation in Al 2219-T851. Metall. Trans. A 1976, 1, 1161–1165. [Google Scholar]
  21. Morris, W.L. The effect of intermetallics composition and microstructure on fatigue crack initiation in A1 2219-T85l. Metall. Trans. A 1978, 9, 1345–1348. [Google Scholar] [CrossRef]
  22. Nakai, M.; Eto, T. Effect of Constituents and Dispersoids Morphology on Fracture Toughness and Fatigue Crack Propagation in 2024 Aluminum Alloys. Mater. Sci. Forum 1996, 217–222, 1517–1522. [Google Scholar]
  23. Staley, J.T. Influence of Microstructure on Fatigue and Fracture of Aluminum Alloys. Int. J. Fatigue 2003, 24, 244–246. [Google Scholar]
  24. Nakai, M.; Eto, T. New aspect of development of high strength aluminum alloys for aerospace applications. Mater. Sci. Eng. A 2000, 285, 62–68. [Google Scholar] [CrossRef]
  25. Rojas, J.I.; Crespo, D. Onset Frequency of Fatigue Effects in Pure Aluminum and 7075 (AlZnMg) and 2024 (AlCuMg) Alloys. Metals 2016, 6, 50. [Google Scholar] [CrossRef] [Green Version]
  26. Yan, L.; Fan, J.K. In-situ SEM study of fatigue crack initiation and propagation behavior in 2524 aluminum alloy. Mater. Des. 2016, 110, 592–601. [Google Scholar] [CrossRef]
  27. Golden, P.J.; Grandt, A.F.; Bray, G.H. A comparison of fatigue crack formation at holes in 2024-T3 and 2524-T3 aluminum alloy specimens. Int. J. Fatigue 1999, 21 (Suppl. 1), S211–S219. [Google Scholar] [CrossRef]
  28. Bray, G.H.; Glazov, M.; Rioja, R.J.; Li, D.; Gangloff, R.P. Effect of Artificial Aging on the Fatigue Crack Propagation Resistance of 2000 Series Aluminum Alloys. Int. J. Fatigue 2001, 23, 264–276. [Google Scholar] [CrossRef]
  29. Liu, Y.B.; Liu, Z.Y.; Li, Y.T.; Xia, Q.K.; Zhou, J. Enhanced Fatigue Crack Propagation Resistance of an Al-Cu-Mg Alloy by Artificial Aging. Mater. Sci. Eng. A 2008, 492, 333–336. [Google Scholar]
  30. Rozumek, D.; Faszynka, S. Surface cracks growth in aluminum alloy AW-2017A-T4 under combined loadings. Eng. Fract. Mech. 2020, 226, 106896. [Google Scholar] [CrossRef]
  31. Rozumek, D.; Marciniak, Z. Fatigue crack growth in AlCu4Mg1 under nonproportional bending with torsion loading. Mater. Sci. 2011, 46, 685–694. [Google Scholar] [CrossRef] [Green Version]
  32. Yuan, Z.S.; Lu, Z.; Xie, Y.H.; Dai, S.L.; Liu, C.S. Effects of RRA Treatments on Microstructures and Properties of a New High-strength Aluminum-Lithium Alloy-2A97. Trans. Nonferrous Met. Soc. China 2007, 20, 87–192. [Google Scholar] [CrossRef] [Green Version]
  33. Zhang, X.F.; Li, G.A.; Lu, Z.; Yu, J.; Hao, M. Effect of preaged stretch after quenched on the properties and microstructure of a naturallyaged Al-Li alloy. Acta Metall. Sin. 2016, 52, 1497–1502. [Google Scholar]
  34. Lin, Y.; Zheng, Z.Q.; Zhang, H.F.; Han, Y. Effect of heat treatment process on tensile properties of 2A97 Al-Li alloy: Experiment and B.P. neural network simulation. Trans. Nonferrous Met. Soc. China 2013, 23, 1728–1736. [Google Scholar] [CrossRef]
  35. Chen, H.Y.; Fu, L.; Liang, P. Microstructure, texture and mechanical properties of friction stir welded butt joints of 2A97 Al-Li alloy ultra-thin sheets. J. Alloys Comp. 2017, 692, 155–169. [Google Scholar] [CrossRef]
  36. Yu, W.C.; Li, H.Y.; Du, R.; You, W.; Zhao, M.C.; Wang, Z.A. Characteristic constitution model and microstructure of an Al-3.5Cu-1.5Li alloy subjected to thermal deformation. Mater. Charact. 2018, 145, 53–64. [Google Scholar] [CrossRef]
  37. Zhang, X.X.; Zhou, X.R.; Teruo, H.; Liu, B.; Chen, L.; Sun, Z.H.; Tang, Z.H.; Lu, F.; Ma, Y.L. Corrosion behaviour of 2A97-T6 Al-Cu-Li alloy: The influence of non-uniform precipitation. Corros. Sci. 2018, 132, 1–8. [Google Scholar] [CrossRef]
  38. Zhong, J.; Zhong, S.; Zheng, Z.Q.; Zhang, H.F.; Luo, X.F. Fatigue crack initiation and early propagation behavior of 2A97 Al–Li alloy. Trans. Nonferrous Met. Soc. China 2014, 24, 303–309. [Google Scholar] [CrossRef]
  39. ASTM E8. Standard test methods for tension testing of metallic materials. In Annual Book of ASTM Standards; ASTM E8; ASTM: West Conshohocken, PA, USA, 2001. [Google Scholar]
  40. ASTM. Standard test method for measurement of fatigue crack growth rates. In Annual Book of ASTM Standards; ASTM E647; ASTM: West Conshohocken, PA, USA, 2001. [Google Scholar]
  41. Chapter 3 Aluminum. In Materials Properties Development and Standardization (MMPDS-11); Battelle Memorial Institute: Columbus, OH, USA, 2016; pp. C3-348–C3-350.
Figure 1. (a) The M(T) fatigue crack propagation test sample. M(T) specimen, transverse–longitudinal (T–L) orientation, W = 100 mm, 2a0 = 6 mm. (b) In-situ SEM fatigue specimen (all dimensions in mm).
Metals 11 00110 g001
Figure 2. (a) An EBSD orientation map showing grain structure in the Al-Cu-Li-Mg-Zr alloys added with a low level of Fe content. (b) A <111> pole figure showing the distribution of crystal orientation. (c) A graph showing the size distribution of grains.
Metals 11 00110 g002
Figure 3. (a,d) Backscattered electron micrographs and (b,e) the corresponding superimposed images showing the intermetallic particles in the Low Fe (a,b) and High Fe alloys (d,e). The graphs showing the size distribution of intermetallic particles in the Low Fe (c) and High Fe alloys (f).
Metals 11 00110 g003
Figure 4. Fatigue crack growth rate versus ΔK curves for High Fe and Low Fe alloys.
Metals 11 00110 g004
Figure 5. (a) Fatigue crack length versus number of cycle curves, (b) fatigue crack length versus ΔK curves, and (c) fatigue life fraction at different stages of High Fe and Low Fe alloys.
Metals 11 00110 g005
Figure 6. SEM fractography of near-threshold region in Al-Cu-Li-Mg-Zr alloys: (a) low magnification and (b) high magnification of High Fe alloy; (c) low magnification and (d) high magnification of Low Fe alloy.
Metals 11 00110 g006
Figure 7. SEM fractography of Al-Cu-Li-Mg-Zr alloys upon a value of ΔK at 10 MPa⋅m1/2. The micrographs collected at (a,c) a lower magnification and (b,d) a higher magnification for (a,b) High Fe and (c,d) Low Fe alloys.
Metals 11 00110 g007
Figure 8. SEM fractography of Al-Cu-Li-Mg-Zr alloys upon a value of ΔK at 20 MPa⋅m1/2. The micrographs collected at (a,c) a lower magnification and (b,d) a higher magnification for (a,b) High Fe and (c,d) Low Fe alloys.
Metals 11 00110 g008
Figure 9. SEM fractography of Al-Cu-Li-Mg-Zr alloys in high growth rate regime. The micrographs collected at (a,c) a lower magnification and (b,d) a higher magnification for (a,b) High Fe and (c,d) Low Fe alloys.
Metals 11 00110 g009
Figure 10. (a) Fatigue crack length versus the number of load cycles for High Fe alloy and Low Fe alloys, (b) in-situ fatigue life fraction of High Fe alloy and Low Fe alloy at different stages.
Metals 11 00110 g010
Figure 11. Micrographs for (a) the Low Fe alloy at loading of 10,544 cycles and (b,c) the High Fe alloy loading of 6738 cycles.
Metals 11 00110 g011
Figure 12. SEM micrographs for the evolution of crack growth of Low Fe alloy (a) after 29,523 loading cycles, (b) slip bands generated, (ce) the crack propagation behavior when passing through the constituent particles, (f) the crack deflection, and (g) the overall morphology of crack growth.
Metals 11 00110 g012
Figure 13. SEM micrographs for the evolution of crack growth of High Fe alloy (a) after 17,368 loading cycles, (b,c) slip bands generated, (d,e) after 17,368 loading cycles, (f) the interaction between the crack and the small-sized constituent particles, (f) the crack deflection, and (g,h) morphology of the crack propagating rapidly.
Metals 11 00110 g013
Figure 14. Schematic diagrams illustrating the effect of the constituent particles on the fatigue crack growth (FCG) behavior in (a,c) High Fe and (b,d) Low Fe alloys.
Metals 11 00110 g014
Table 1. Nominal composition of the Al-Cu-Li-Mg-Zr alloys (wt. %).
AlloyFeSiCuLiMgZrAl
Low Fe alloy0.070.053.781.470.460.11Balance
High Fe alloy0.200.043.781.470.390.11Balance
Table 2. Typical mechanical properties and density for Al-Cu-Li-Zr alloys and the 2524-T3 alloy.
AlloyLow Fe Alloy (2A97-T3)High Fe Alloy2524-T3 [27]
Thickness (mm)1.51.50.81–1.59
UTS (MPa)320310303
TYS (MPa)426405420
Elongation (%)18.413.619.0
da/dN (mm/cycle) ∆K = 33 MPa⋅m1/21.8 × 10–31.4 × 10−22.3 × 10⁻³
Density (g/cm3)2.672.672.77 [41]
Publisher’s Note: MDPI stays neutral with regard to jurisdictional claims in published maps and institutional affiliations.