Article

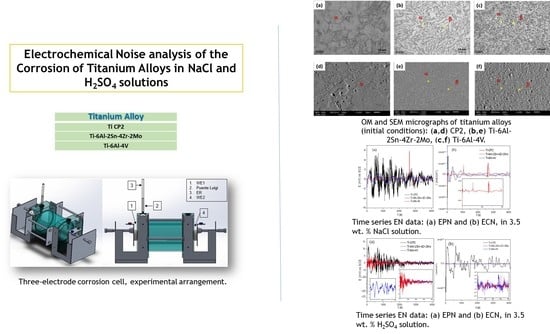
Electrochemical Noise Analysis of the Corrosion of Titanium Alloys in NaCl and H2SO4 Solutions

by
Jesús Manuel Jáquez-Muñoz
1,
Citlalli Gaona-Tiburcio
1,*,
Jose Cabral-Miramontes
1,
Demetrio Nieves-Mendoza
2,
Erick Maldonado-Bandala
2,
Javier Olguín-Coca
3,
Luis Daimir López-Léon
3,
Juan Pablo Flores-De los Rios
4 and
Facundo Almeraya-Calderón
1,*
1
FIME-Centro de Investigación e Innovación en Ingeniería Aeronáutica (CIIIA), Av. Universidad s/n, Ciudad Universitaria, Universidad Autonoma de Nuevo Leon, 66455 San Nicolás de los Garza, Mexico
2
Facultad de Ingeniería Civil, Universidad Veracruzana, 91000 Xalapa, Mexico
3
Grupo de Investigación DICSO, Instituto de Ciencias Básicas e Ingeniería, UAEH, 42082 Hidalgo, Mexico
4
Tecnológico Nacional de Mexico-Instituto Tecnológico de Chihuahua, Av. Tecnologico 2909, 31130 Chihuahua, Mexico
*
Authors to whom correspondence should be addressed.
Metals 2021, 11(1), 105; https://doi.org/10.3390/met11010105
Submission received: 29 November 2020 / Revised: 25 December 2020 / Accepted: 29 December 2020 / Published: 7 January 2021
(This article belongs to the Special Issue Corrosion and Tribocorrosion Behavior of Ti Alloys)

Abstract

:
Titanium alloys have been used in aerospace, aeronautic, automotive, biomedical, structural, and other applications because titanium alloys have less density than materials like steel and support higher stress than Al-alloys. However, components made of titanium alloys are exposed to corrosive environments, the most common being industrial and marine atmospheres. This research shows the corrosion behavior of three titanium alloys, specifically Ti-CP2, Ti-6Al-2Sn-4Zr-2Mo, and Ti-6Al-4V with α, near α, and α + β alloys phases. Alloys were exposed in two electrolytes to a 3.5 wt. % H2SO4 and NaCl solution at room temperature, and their electrochemical behavior was studied by electrochemical noise technique (EN) according to ASTM ASTM-G199 standard. EN signal was filtered by three different methods, and the polynomial method was employed to obtain Rn, kurtosis, skew, and the potential spectral density analysis (PSD). The wavelets method was used, from which energy dispersion plots were obtained. The last method was Hilbert–Huang Transform (HHT), where Hilbert Spectra were analyzed. Results indicated that Rn compared with PSD showed that Ti-6Al-2Sn-4Zr-2Mo presented less dissolution in both electrolytes. Statistical methods showed that the passive layer created on Ti alloys’ surfaces is unstable; this condition is notable for Ti-6Al-2Sn-4Zr-2Mo in NaCl solution.

Graphical Abstract

1. Introduction

Titanium alloys were developed in the mid-1940s for the aviation industry. Two post-World War II alloys, commercially pure titanium (CPTi) and Ti-6Al-4V, remain the two dominant titanium alloys used in applications in aerospace, aeronautics, biomedical and automotive industries due to the density and mechanical and corrosion resistance properties being higher in comparison with competing materials such as aluminum, steels, and superalloys [1,2]. The use of these alloys increased significantly in the 1980s, particularly in aircraft combat construction as opposed to transport aircraft. This increase continued in the 1990s to the stage when, for combat aircraft, the percentage of titanium alloy as a fraction of the structural weight was the same order as that of aluminum alloy. The aviation industry demands improvements in the characteristics of the structural and functional materials components of aircraft based on scientific research conducted on new materials [1,2,3,4].
The aeronautical industry has an important role in the development and application of new materials and technologies because damage tolerance is especially low in this industry. For this reason, materials should present excellent properties for service conditions, and constants optimization processes should be carried out to increases mechanical, fatigue, corrosion, and oxidation resistance, which should be certificated and satisfy security standards [3,4].
Titanium alloys (Ti-alloys) can be divided into four types, Ti α, near to α, α + β, and metastable β, where the microstructure depends on the β stabilizer (Mo, V, Cr, Ni, Fe, Ta) [5]. α-Ti alloys are denominated as commercially pure (CP) and highly pure titanium, and these alloys could have interstitial elements such as oxygen and nitrogen, which increase the mechanical resistance of titanium but decrease the ductility; for some cryogenic or high-temperature applications, α alloys add Al, Zr, or Sn as α stabilizers [6]. If near α alloys combine α and α + β alloys properties, high temperature resistance, and high mechanical resistance, they would have a 2% β stabilizer. Some new generations add Si (0.1–0.5%) to improve their properties at high temperatures [7,8,9]. α + β alloys have more than one stabilizer α-phase (such as interstitial) and β-phase until 6%, and this type of phase is the most common, Ti-6Al-4V is the most used Ti-alloy in the world, with almost 50% of production [7]. β-Ti alloys have a high percentage of β stabilizers, and these alloys can present a martensitic microstructure. For this reason, the microstructure could be more complex [8,9,10].
Titanium and its alloys present a high corrosion resistance, making them a good option for many applications such as those in the biomedical, aerospace, aeronautic, and chemical industries. The corrosion resistance of Ti alloys is due to the formation of an oxide film on the surface. This is because these kinds of alloys are reactive with oxygen, and in air or aqueous media, the layer’s reaction is spontaneous [11,12]. Although a passive layer can protect the titanium surface, the quality of this one will depend on factors such as the temperature and pH of the electrolyte in the redox reaction. A correct combination of these factors could create layers that are stable, continuous, and with good surface adherence [13,14]. If the oxide layer is penetrated or presents damage, it can regenerate in the presence of oxygen by repassivation. Titanium’s active condition cannot be maintained, and a process of mass transference in the exposed zone occurs due to the pH difference, oxygen admission, or change potential in the metal/electrolyte, provoking the repassivation [14,15]. However, ions of Cl or Br can penetrate and create an unstable layer, making the repassivation process more difficult [16,17,18]. Further, the difference between titanium phases creates a difference in the homogeneity of oxide layer growth [19].
Different conventional electrochemical techniques such as linear polarization resistance (LPR), potentiodynamic polarization (PP), and electrochemical impedance spectroscopy (EIS) have been implemented to determine the corrosion and kinetic mechanisms of the reactions. However, these techniques can alter the electrochemical system with external signals in electrochemical measurements [20,21,22,23,24,25]. The use of the electrochemical noise (EN) technique for investigation and monitoring of corrosion has allowed many advances in recent years that are interesting for corrosion science. A special advantage of EN measurements is the possibility to detect and analyze the early stages of localized corrosion.
Electrochemical noise describes spontaneous low-level potential and current fluctuations that occur during an electrochemical process. During the corrosion process, predominantly electrochemical cathodic and anodic reactions can cause small transients in electrical charges on the electrode. These transients manifest in the form of potential and current noise that can be exploited in a corrosion map [25,26,27,28]. Transients are linked to anodic and cathodic reactions as a result of stochastic processes (rupture and re-passivation of the passive film) and deterministic processes (formation and propagation of pitting) [29,30]. Potential and/or current transients in time series are associated with initiation and re-passivation of metastable pitting, which provides useful information on the initial process of localized corrosion. EN data can be analyzed by several methods. Perhaps the most used are those related to the frequency domain (power spectral density), time domain (statistical methods such as skewness, kurtosis, localization index (LI), and the variation of in the signal amplitude with time), and time-frequency domains [31,32,33,34]. LI, skewness, and kurtosis values have been reported as values related to different corrosion types and values referring to the asymmetry of distribution and shape of EN data [31,35,36].
Research has found that statistical analysis has limitations in determining the corrosion type presented in the system. To reduce the uncertainty of statistical methods, it is necessary to employ different and new analysis methods to determine the corrosion mechanism. Wavelet and Hilbert–Huang Transform (HHT) methods are employed in EN chaotic signals analysis. Wavelets help in removing the DC signal from EN data without affecting the original signal (as a polynomial filter that can remove corrosion data) and can establish the corrosion type that occurs on the material surface. HHT can remove the DC signal without affecting the corrosion data and additionally localize the moment systems demand more energy, and the frequency which occurs can be determined by the corrosion mechanisms based on time–frequency–energy analysis [23,37,38,39,40,41,42].
For the corrosion behavior of Ti-alloys in an NaCl electrolyte, it has been reported that corrosion resistance increases when the passive layer is present because it is difficult for Cl ions to pass through when studied by potentiodynamic polarization [42]. EIS results indicate that it is the same behavior, namely that Cl ions have difficulty penetrating the passive layer, which could create instability on the layer, but it will show repassivation because it can present a diffusion process [43]. In electrolytes of chlorides of Na, Ca, and Mg, titanium presents a growth-passive layer; these electrolytes present instability of Ti-alloys near α, α + β and β, and phases differences [44,45,46]. In H2SO4 electrolytes, Ti-alloys have shown a noble behavior by PP and a passivation system [47].
The aim of this research was to study the corrosion behavior of three Ti-alloys, Ti CP2, Ti-6Al-2Sn-4Zr-2Mo, and Ti-6Al-4V, immersed at 3.5 wt. % in H2SO4 and NaCl solutions at room temperature by electrochemical noise technique. Characterization by electrochemical techniques of titanium alloys could find potential applications in the aeronautical industry as in turbine blades and aircraft landing gear.

2. Materials and Methods
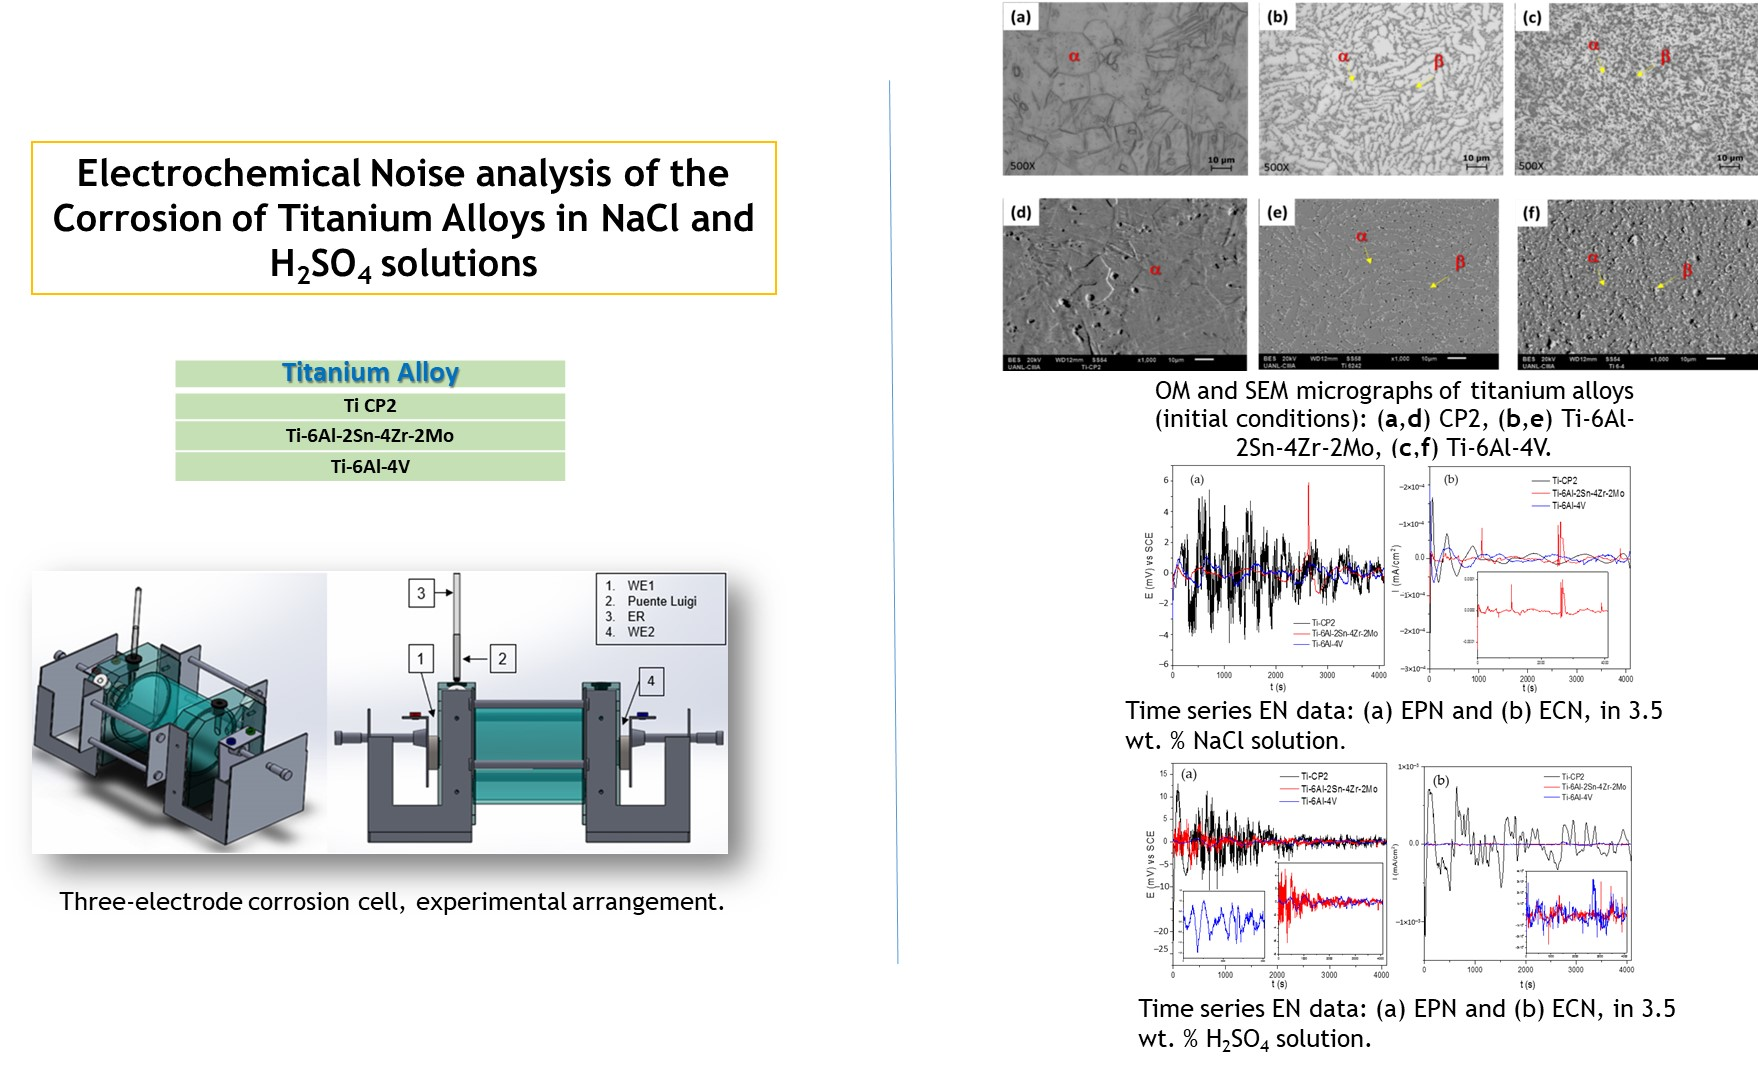
2.1. Materials

The Materials used in this work were Ti CP2, Ti-6Al-2Sn-4Zr-2Mo, and Ti-6Al-4V, used in the received condition. The chemical composition of these Ti-alloys was obtained by X-ray fluorescence (Olympus DELTA XRF. Richmond, TX, USA). Table 1 shows the chemical composition of each Ti-alloy.

2.2. Microstructural Characterization

The specimens were polished using metallographic techniques. The polishing was done using different SiC grit papers until 4000 grades, followed by ultrasonic cleaning in ethanol (C2H5OH) and deionized water for 10 min each. Etching of polish samples was elaborated with Kroll solution composed of 3 mL HF, 5 mL HNO3, and 100 mL water, based on ASTM E 407 [48,49].
The microstructural analysis was carried out by optical microscopy (OM, Olympus, Hamburg, Germany) and scanning electron microscopy (SEM, JEOL-JSM-5610LV, Tokyo, Japan) for identifying the microstructure of samples a magnification of 500× and 1000× operating at 20 kV, WD = 14 mm. The chemical composition of these alloys was obtained by energy-dispersive X-ray Spectroscopy (EDS, JEOL-JSM-5610LV, Tokyo, Japan).

2.3. Electrochemical Techniques

EN measurements were carried out according to ASTM G199-09 standard, which allows the noise resistance (Rn) and corrosion rate evaluation to be determined in a corrosive medium. For each experiment, two nominally identical specimens were used as the working electrodes (WE1 and WE2) and a saturated calomel electrode as the reference electrode (RE) [50]. Electrochemical current noise (ECN) was measured with galvanic coupling current between two identical working electrodes; simultaneously, electrochemical potential noise (EPN) was measured linking one of the working electrodes and reference electrode. The current and potential electrochemical noise was monitored with respect to time for each electrode–electrolyte combination under open-circuit condition. For each set of EN measurements, 4096 data points were obtained with a scanning rate of 1 datum/s. The current and potential time series were visually analyzed to interpret the signal transients and define the behavior of the frequency and amplitude of fluctuations as a function of time [51]. The electrochemical noise measurements were recorded simultaneously using a Gill-AC potentiostat/galvanostat/ZRA (Zero Resistance Ammeter) from ACM Instruments (Manchester, UK).
DC trend signal was removed from the original EN signal by the polynomial method, from signal without DC statistical data (Rn, Kurtosis, and skewness) was obtained. For PSD (power spectral density) data, a Hann window was applied before being transformed to the frequency domain by an FFT (fast Fourier transform). To make an energy-disperse plot (EDP), an orthogonal wavelet transform was applied to the original signal (with DC) because this method separates DC from EN signal. EN analysis with Hilbert–Huang transform (HHT) was necessary to obtain the intrinsic functions (IMF) of EN signal by an empirical decomposition method (EMD), and finally, the instantaneous frequencies were plotted with a Hilbert spectrum. Data analysis was processed with a program made in MATALB 2018a software (Math Works, Natick, MA, USA).

3. Results

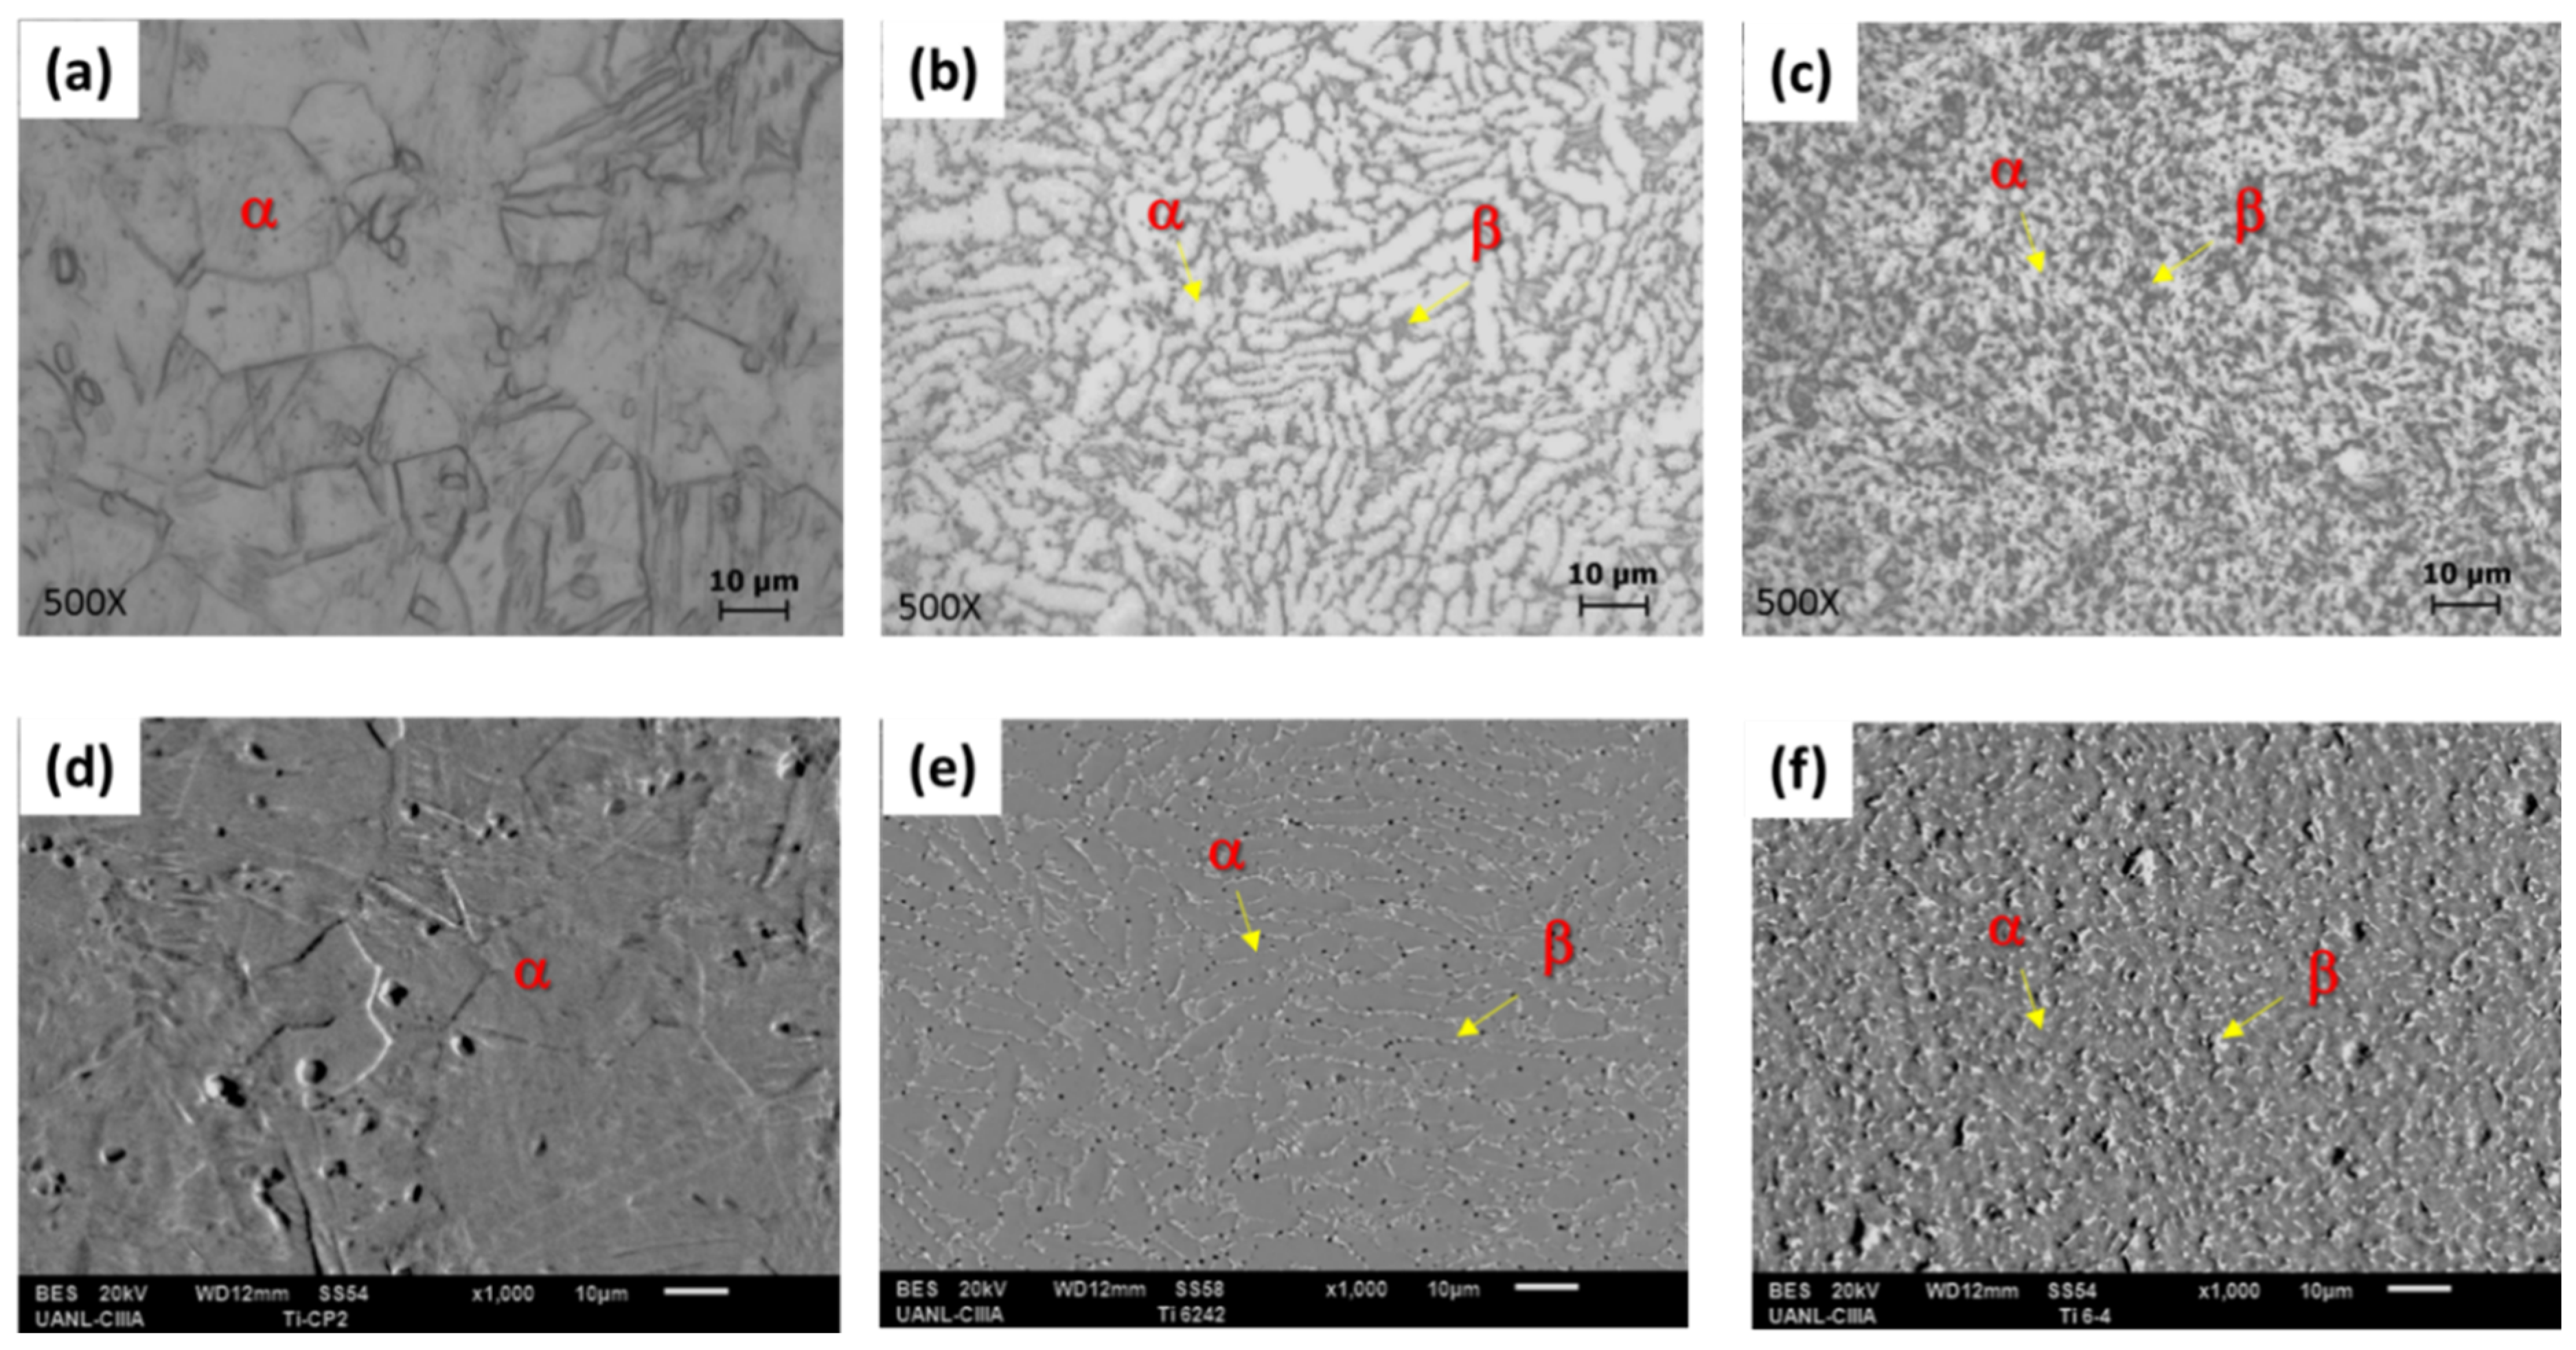
3.1. OM-SEM Microstructural Analysis

The microstructures of the initial samples were analyzed by optical microscope (OM) and were corroborated by SEM. Figure 1a shows a matrix of α phase microstructure for Ti CP2, with large size grain, typical of α-Ti alloys. Figure 1b presents the microstructure of Ti-6Al-2Sn-4Zr-2Mo; this alloy has α-phase grains, with a light-appreciable deformation and angular shapes located at triple point unions and corresponding to the β phase. Figure 1c shows the Ti-6Al-4V microstructure, this one is fine and equiaxial because cooling was slow in the recrystallization alloy. α and β phases are marked with yellow arrows. This phase presents spherical shapes and α phases. The distribution of β increases in Ti-6Al-4V due to vanadium retained in β, so when V or Mo wt. % increases in Ti-alloys, β is going to increase. By scanning electron microscopy using backscattered electrons, microstructures obtained were corroborated, having α and β phases. In Ti CP2, Ti-6Al-2Sn-4Zr-2Mo, and Ti-6Al-4V samples, porosity (approximately 1 to 2 µm in diameter) was observed in the material from the manufacturing process. Porosity is presented in 1.68%, 2.87%, and 1.75% for Ti CP2, Ti-6Al-2Sn-4Zr-2Mo, and Ti-6Al-4V respectively.

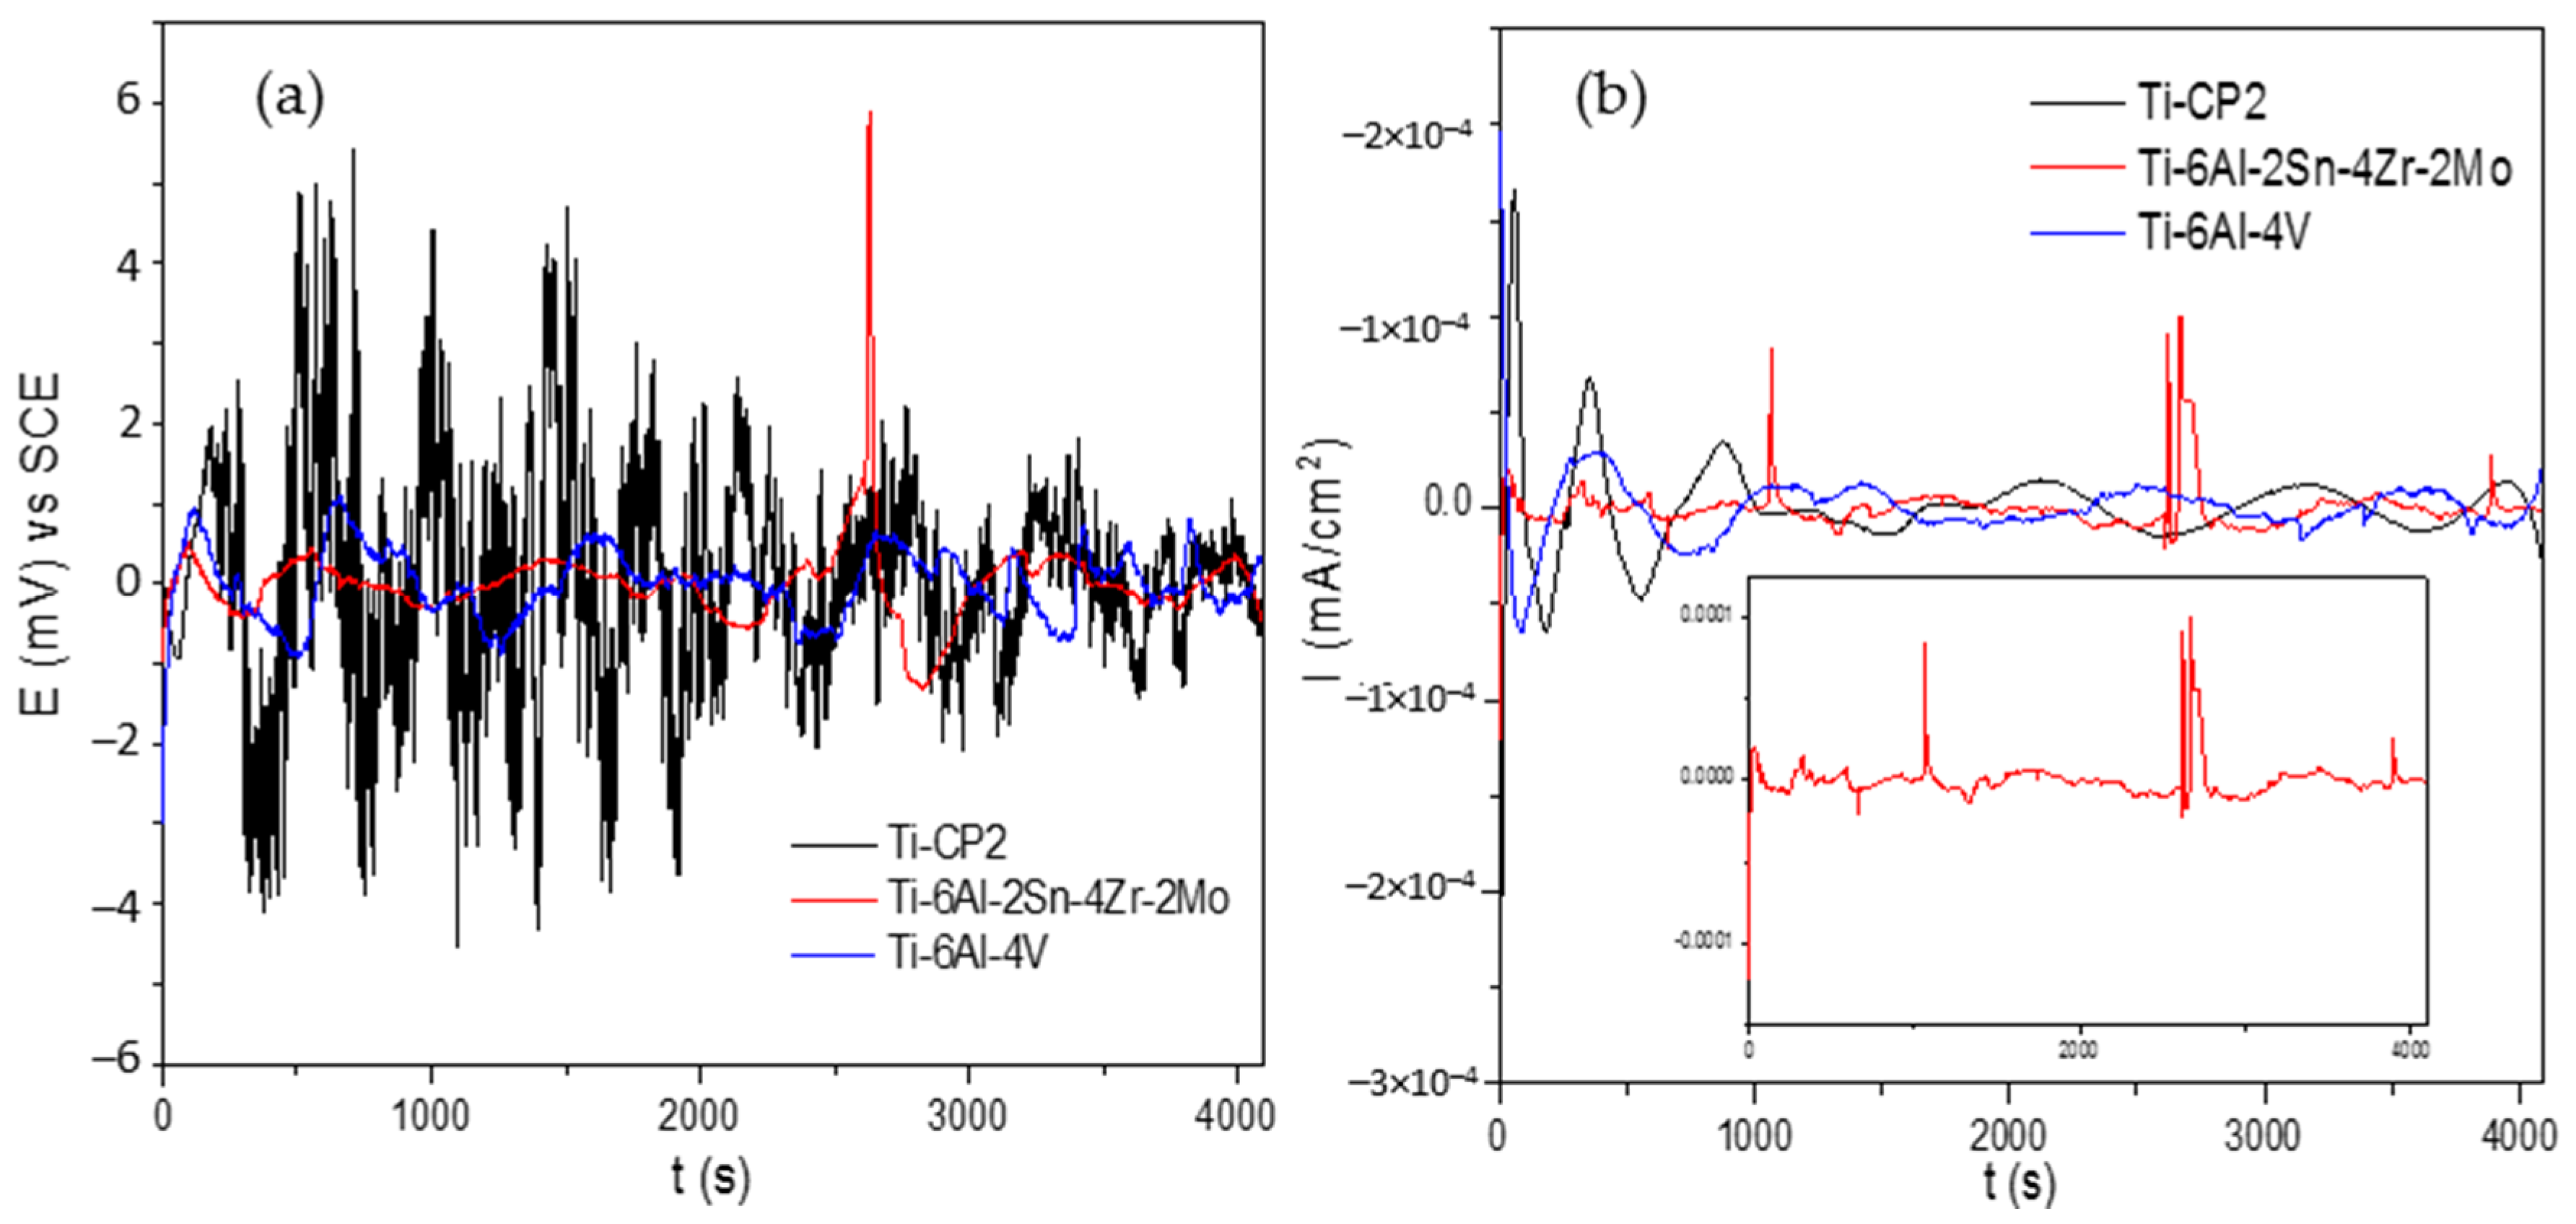
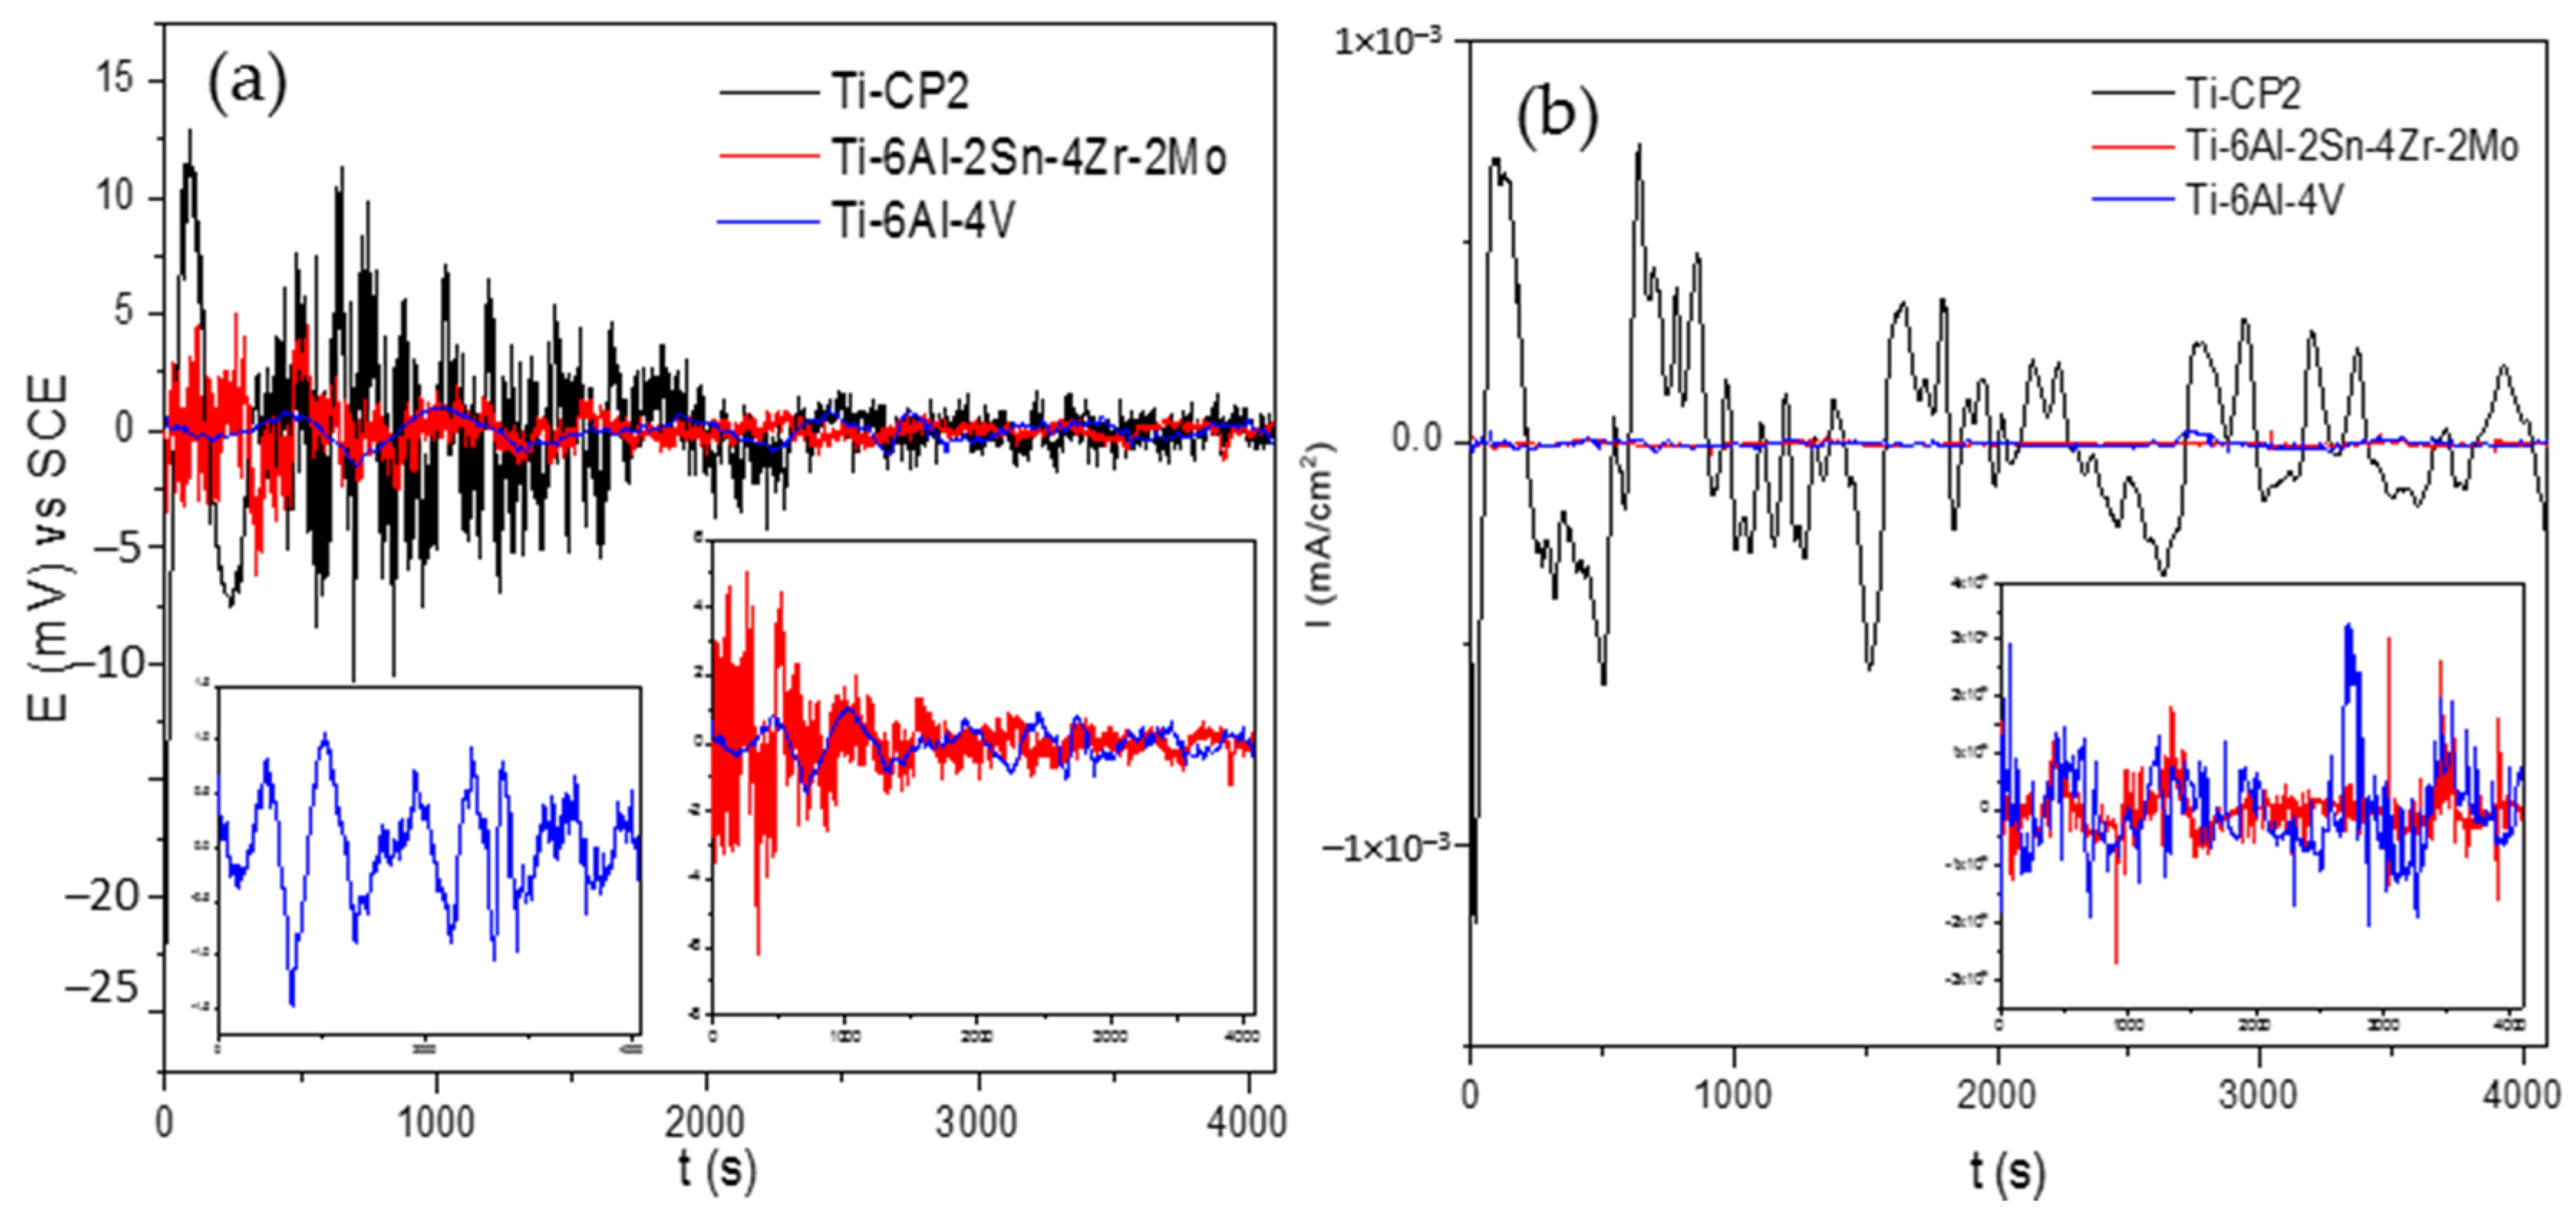
3.2. Electrochemical Noise

The EN signal was composed of random, stationary, and DC variables. To analyze EN data, it is necessary to separate DC from random and stationary components because DC creates false frequencies and interferes in visual, statistical, and PSD analysis. In this way, when DC is removed, corrosion data presented at low frequencies are conserved [48]. EN can be represented by Equation (1) [34,52,53]:
x ( t ) = m t + s t + Y t
where x(t) is the EN time series, mt is the DC component, st is the random component, and Yt is a stationary component. The latter two are the functions that define the corrosion system [34]. The polynomial method, as defined in Equation (2), defines noise signal (xn) and polynomial of “n” grade (po) at n-th term (ai) in “n” time to obtain a signal without trend (yn) [34,39,52,53]:
y n = x n i = 0 p o a i n i
Figure 2a shows EN signal in 3.5 wt. % NaCl solution after DC was removed by the polynomial method. The time series shows Ti-alloys, EPN signal, where amplitude decreases as a function of time. This behavior is attributed to a protective layer growth. Ti-6Al-2Sn-4Zr-2Mo presents a cathodic transient of 6 mV from 2500 to 2600 s, which occurs because the passive layer is unstable. For the ECN signal, Ti CP2 and Ti-6Al-4V current demand decreases with time, meaning that electrons transference decreases as a function of time. Ti-6Al-2Sn-4Zr-2Mo, presents anodic transients in time series of 10−4 mA/cm2 order, indicating a low electrons flow.
Figure 3a shows EPN signal with a similar behavior than that in Figure 2a, this signal presents 20 mV of maximum amplitude, but it finished with 1 mV of amplitude for Ti alloys, meaning that ion change decreases as a function of time and the passive layer generated is more stable in H2SO4 than NaCl. The highest potential amplitude in EPN was presented in Ti CP2, indicating more interaction between metal-electrolyte, and a higher mass transfer. In Figure 3b for ECN, Ti CP2 reveals a random behavior, but amplitude decreases over time. Further, the amplitude is on the order of 10−4, while for the other two Ti alloys, the amplitude is on the order of 10−6, meaning that corrosion kinetic is higher in Ti CP2 than the other two alloys. Windowing made in Ti-6Al-2Sn-4Zr-2Mo and Ti-6Al-4V corroborates the presence of low magnitude transients, which occurs due to a non-uniform passive layer growing on the surface.

3.2.1. Statistical Analysis
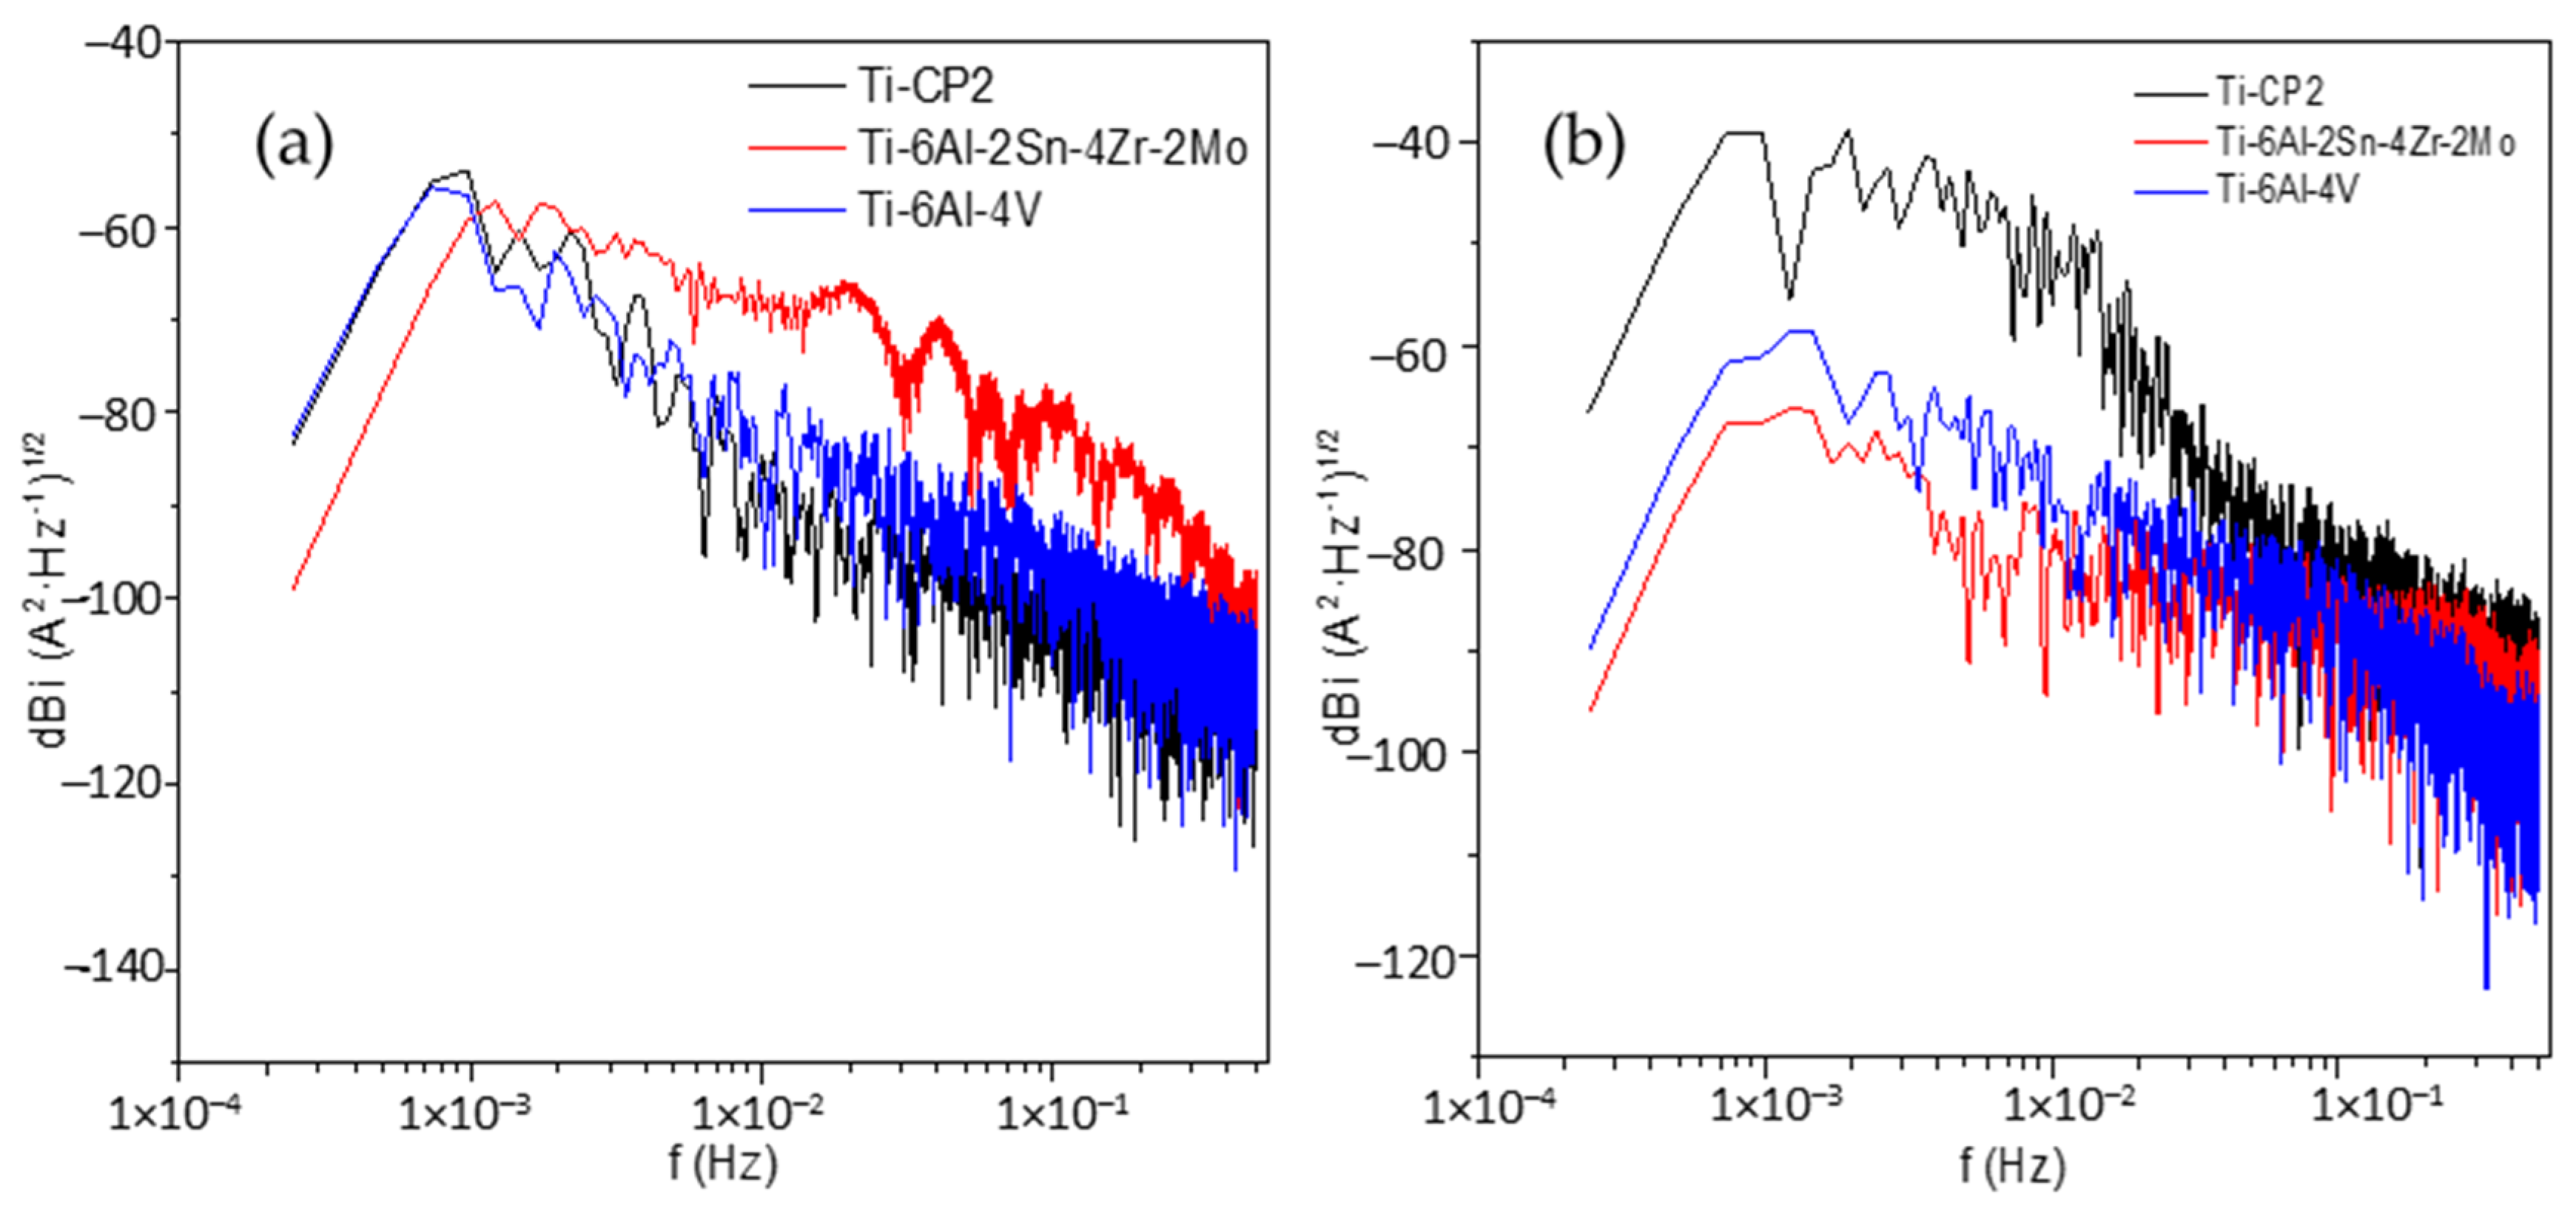
To determine noise resistance (Rn), it is necessary to obtain standard deviation from time series values; these statistical values give information about corrosion kinetics and mechanism. Turgoose and Cottis [39] found a relationship between the increase of variance and standard deviation with an increase in corrosion rate. For standard deviation (σ) evaluation applying Equation (3) is required, by which Rn can be obtained (Equation (4)) from EN time series (EPN and ECN):
σ x = x 2 ¯ = 1 N ( x i x ¯ ) 2 N
R n = σ v σ I A
Rn and Rp are related, and the Stern–Geary equation (Equation (5)) can be applied as an analog relation between them to determine corrosion kinetic. B is a constant with a recommended value of 0.026 V for active and 0.052 V for the passive corrosion [20,54]:
i c o r r = Β R n
This research employed kurtosis and skewness to try to define the corrosion type. Localization index (LI) was not considered because Mansfeld and Sun [55] in 1995 concluded that LI can present limitations and should be used with discretion. In 2001, Reid and Eden [56] developed a patent where they identified corrosion type based on statistical moments with skewness and kurtosis (Equations (6) and (7)), which are the 3rd and 4th statistical moments [57]:
s k e w n e s s =   1 N i = 1 N ( x i x ¯ ) 3 σ 3
k u r t o s i s =   1 N i = 1 N ( x i x ¯ ) 4 σ 4
Statistical calculations have a standard error (SE) that generates uncertainty in the results. SE can be provided by the next equation, where N is the number of data studied [58]. Hence, when the data number is big, the standard error will be lower than when the number of data is high.
S E = 24 N
SE is 0.077, values obtained will take SE as a parameter of uncertainty. Corrosion type determined by kurtosis and skewness is shown in Table 2.
Kurtosis and skewness were applied to ECN signal, to determine the corrosion mechanism based on corrosion kinetic. Table 2 shows Rn, icorr, skewness, and kurtosis from EN signal that was filtered with a 9th-grade polynomial to remove DC signal.
Rn values of Ti-6Al-2Sn-4Zr-2Mo (see Table 3) present higher resistance than Ti CP2 and Ti-6Al-4V in H2SO4. Ti CP2 presents a lower Rn in H2SO4 than NaCl solution; meanwhile, the other two alloys have a higher Rn in H2SO4 solution. icorr results are reciprocates to Rn values. By kurtosis analysis, all samples presented localized corrosion. Considering SE of ±0.077, skew could have had uncertain data because results obtained could correspond to uniform or pitting, especially in H2SO4 solution for Ti-alloys. This discordance in statistical results could be attributed to method analysis limitations when phenomena of passivation, repassivation, or diffusion occur on the metal surface. This indicates a double process occurring on the alloy surface: a layer is created but is unstable, and ions penetrate the layer surface to break it down, but it regenerates again. For these samples, the ions that provoke this variation in the statistical methods are Cl and H+ in their respective electrolytes.

3.2.2. PSD Analysis

For PSD analysis, it is necessary to transform the time-domain EN to frequency-domain by applying FFT, since there is a correlation with EN signal (with polynomial filter applied), after which spectral density is calculated with Equations (9) and (10) [59].
R x x ( m ) = 1 N n = 0 N m 1 x ( n ) · x ( n + m ) ,   when   values   are   from   0 < m < N
Ψ x ( k ) = γ · t m N · n = 1 N ( x n x ¯ n ) · e 2 π k n 2 N
The interpretation of PSD is based on limit frequency to cut frequency, with the cut frequency being indicative of when to began and end a slope. Slope could be helpful to find the corrosion mechanism. Cut frequency gives information about sample representation after pitting [29]. Slope is defined by βx and is represented by Equation (11):
log Ψ x = β x log f
The frequency zero limit (Ψ0) gives material dissolution information because the power PSD is related to total energy present in the system [26]. Is important to clarify that material dissolution is only present in the current PSD [57,59,60]. The next table was proposed by Mansfeld et al. [60] in 1998 to determine the corrosion phenomena occurring on the material surface; this table is adapted to decibels (see Table 4) [61].
It is important to emphasize that some values are the same for two types of corrosion; this could create another way to study the slope along frequencies [62].
As shown in Figure 4a, Ti-6Al-4V and Ti CP2 have similar values of Ψ0 (see Table 5), Ti-6Al-2Sn-4Zr-2Mo have a lower Ψ0 value (−138 dBi) presented in Table 5, indicating a less material dissolution than Ti CP2 and Ti-6Al-4V with −122 and 121 dBi. The slope of Ti alloys indicates pitting corrosion (see Table 4), but to make a more correct analysis, it is necessary, based on Dawson and Uruchurtu’s interpretation [63], to mention that when slope is lower than 20 dB/decade, a pitting is beginning, not being developed. Further, Uruchurtu mentioned that is necessary to evaluate the change of slope along frequencies, like in Ti-6Al-2Sn-4Zr-2Mo, where the slope is not continuous and presents fluctuations. This change occurs due to a repassivation process, where fluctuations mean a break of passive layer but regenerate again. Figure 4b shows that Ti CP2 has the highest Ψ0 at −104.95 dBi, and the lowest value is presented by Ti-6Al-2Sn-4Zr-2Mo with −134 dBi, meaning than in both electrolytes, Ti-6Al-2Sn-4Zr-2Mo presents the highest resistance to material dissolution. For slope, three of them present pitting corrosion. However, Ti-6Al-2Sn-4Zr-2Mo and Ti-6Al-4V present a change of slope at a final frequency, which could mean a change to passivity mode according to Legat and Uruchurtu [62,64].
The results concerning type and corrosion mechanisms presented some uncertainty, and some authors consider slope values ineffective and recommend employing other mathematical methods because EN signal presents a chaotic behavior [63,65].

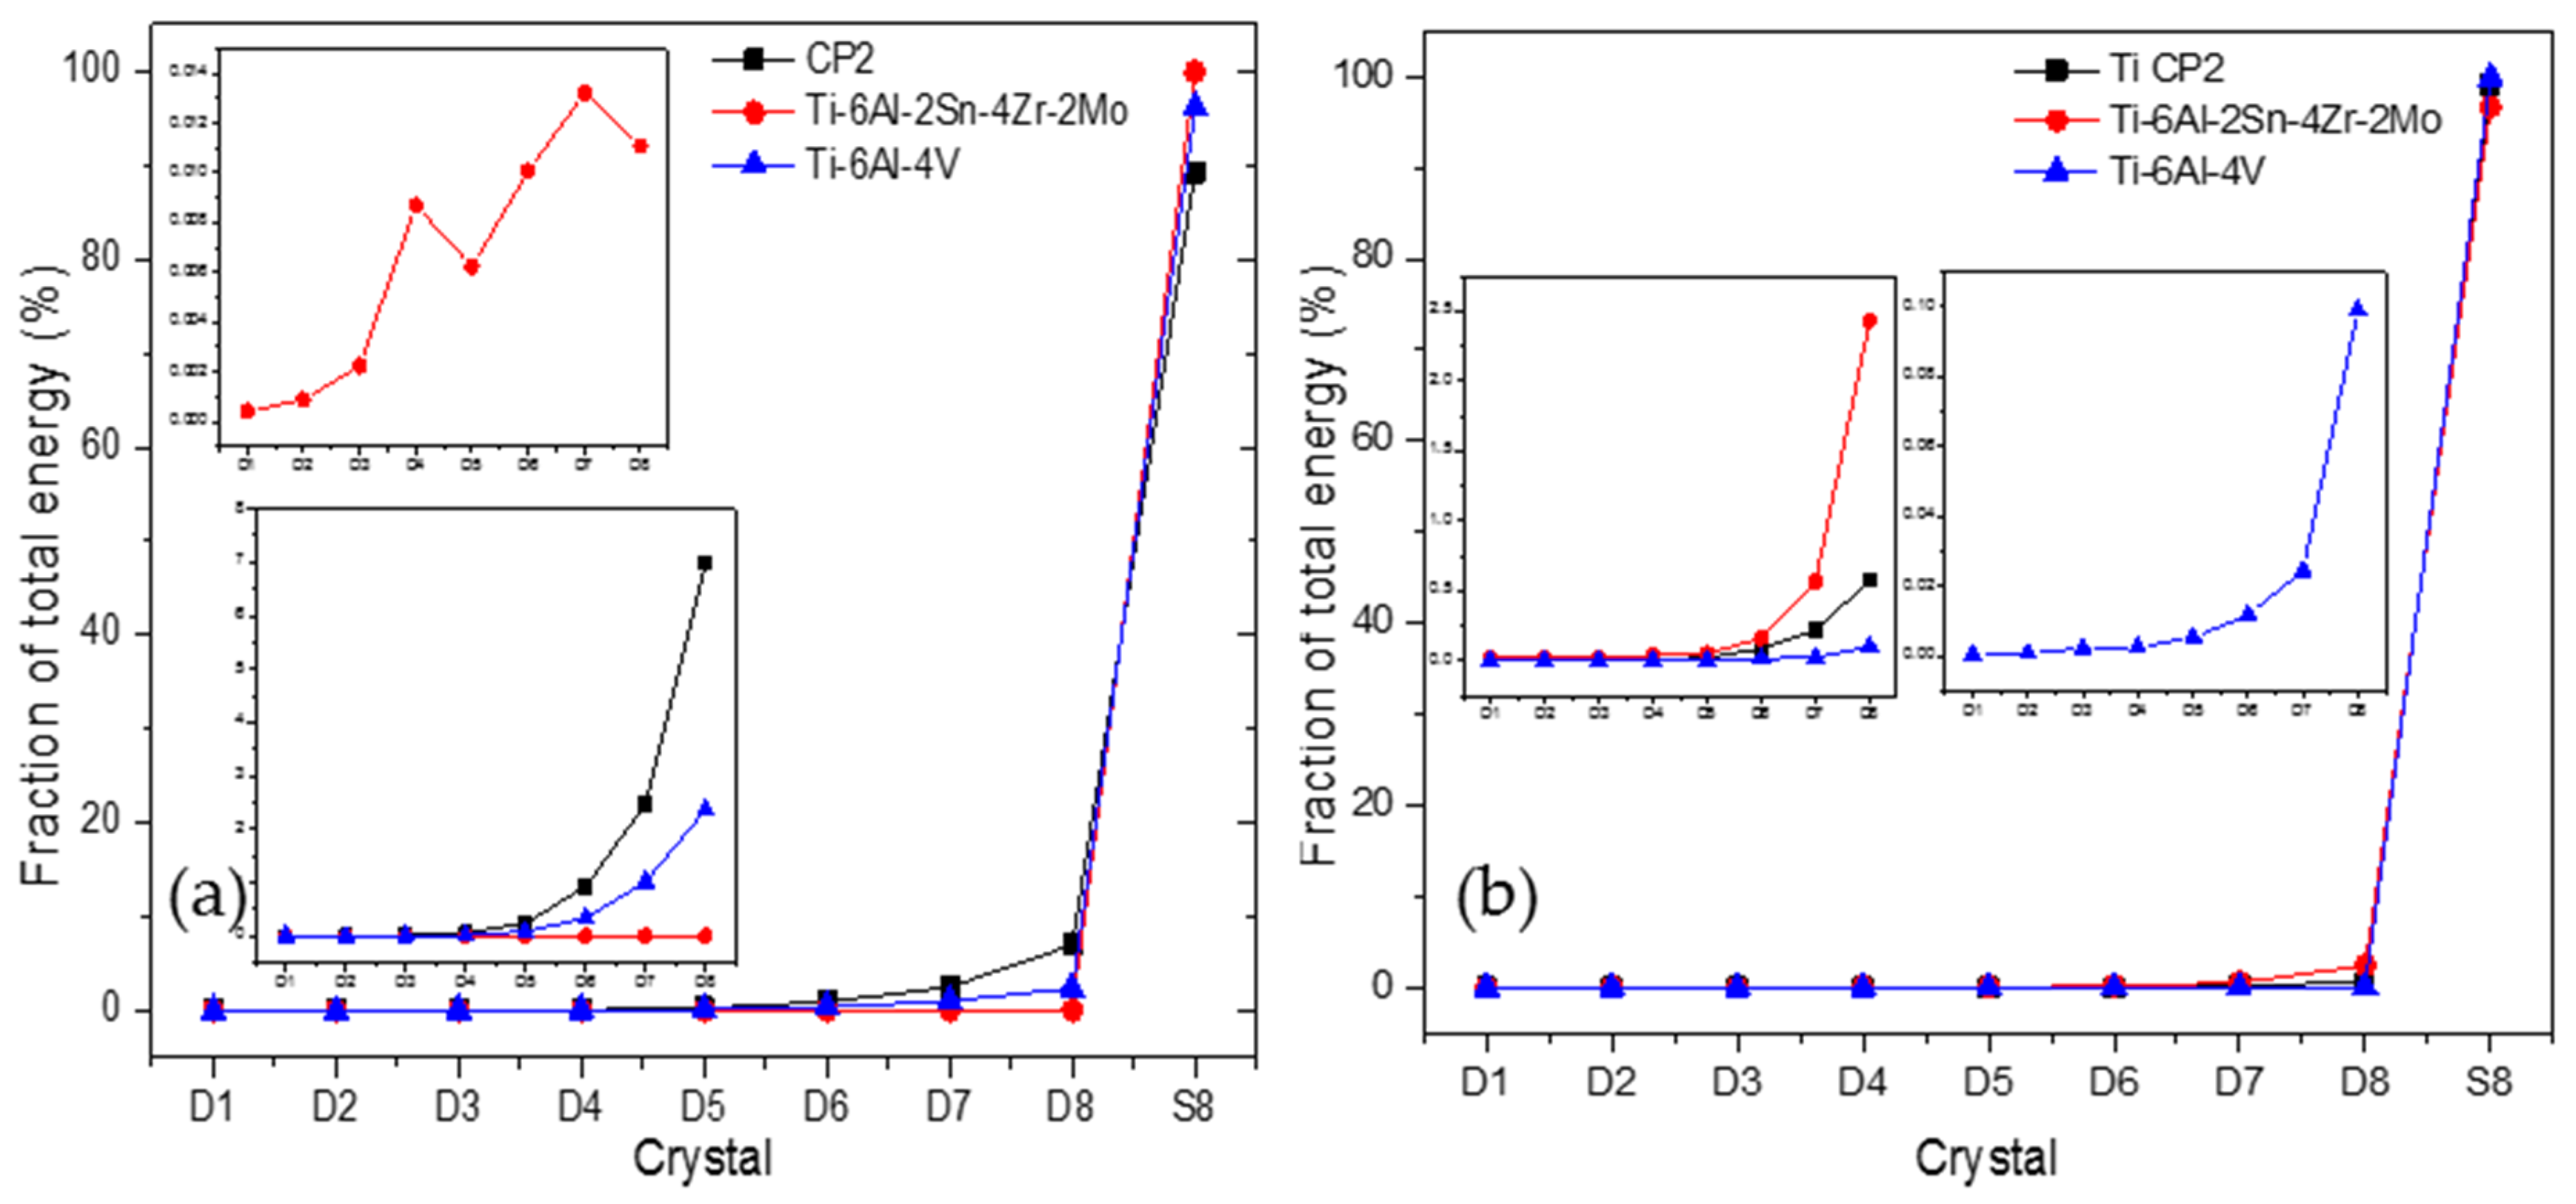
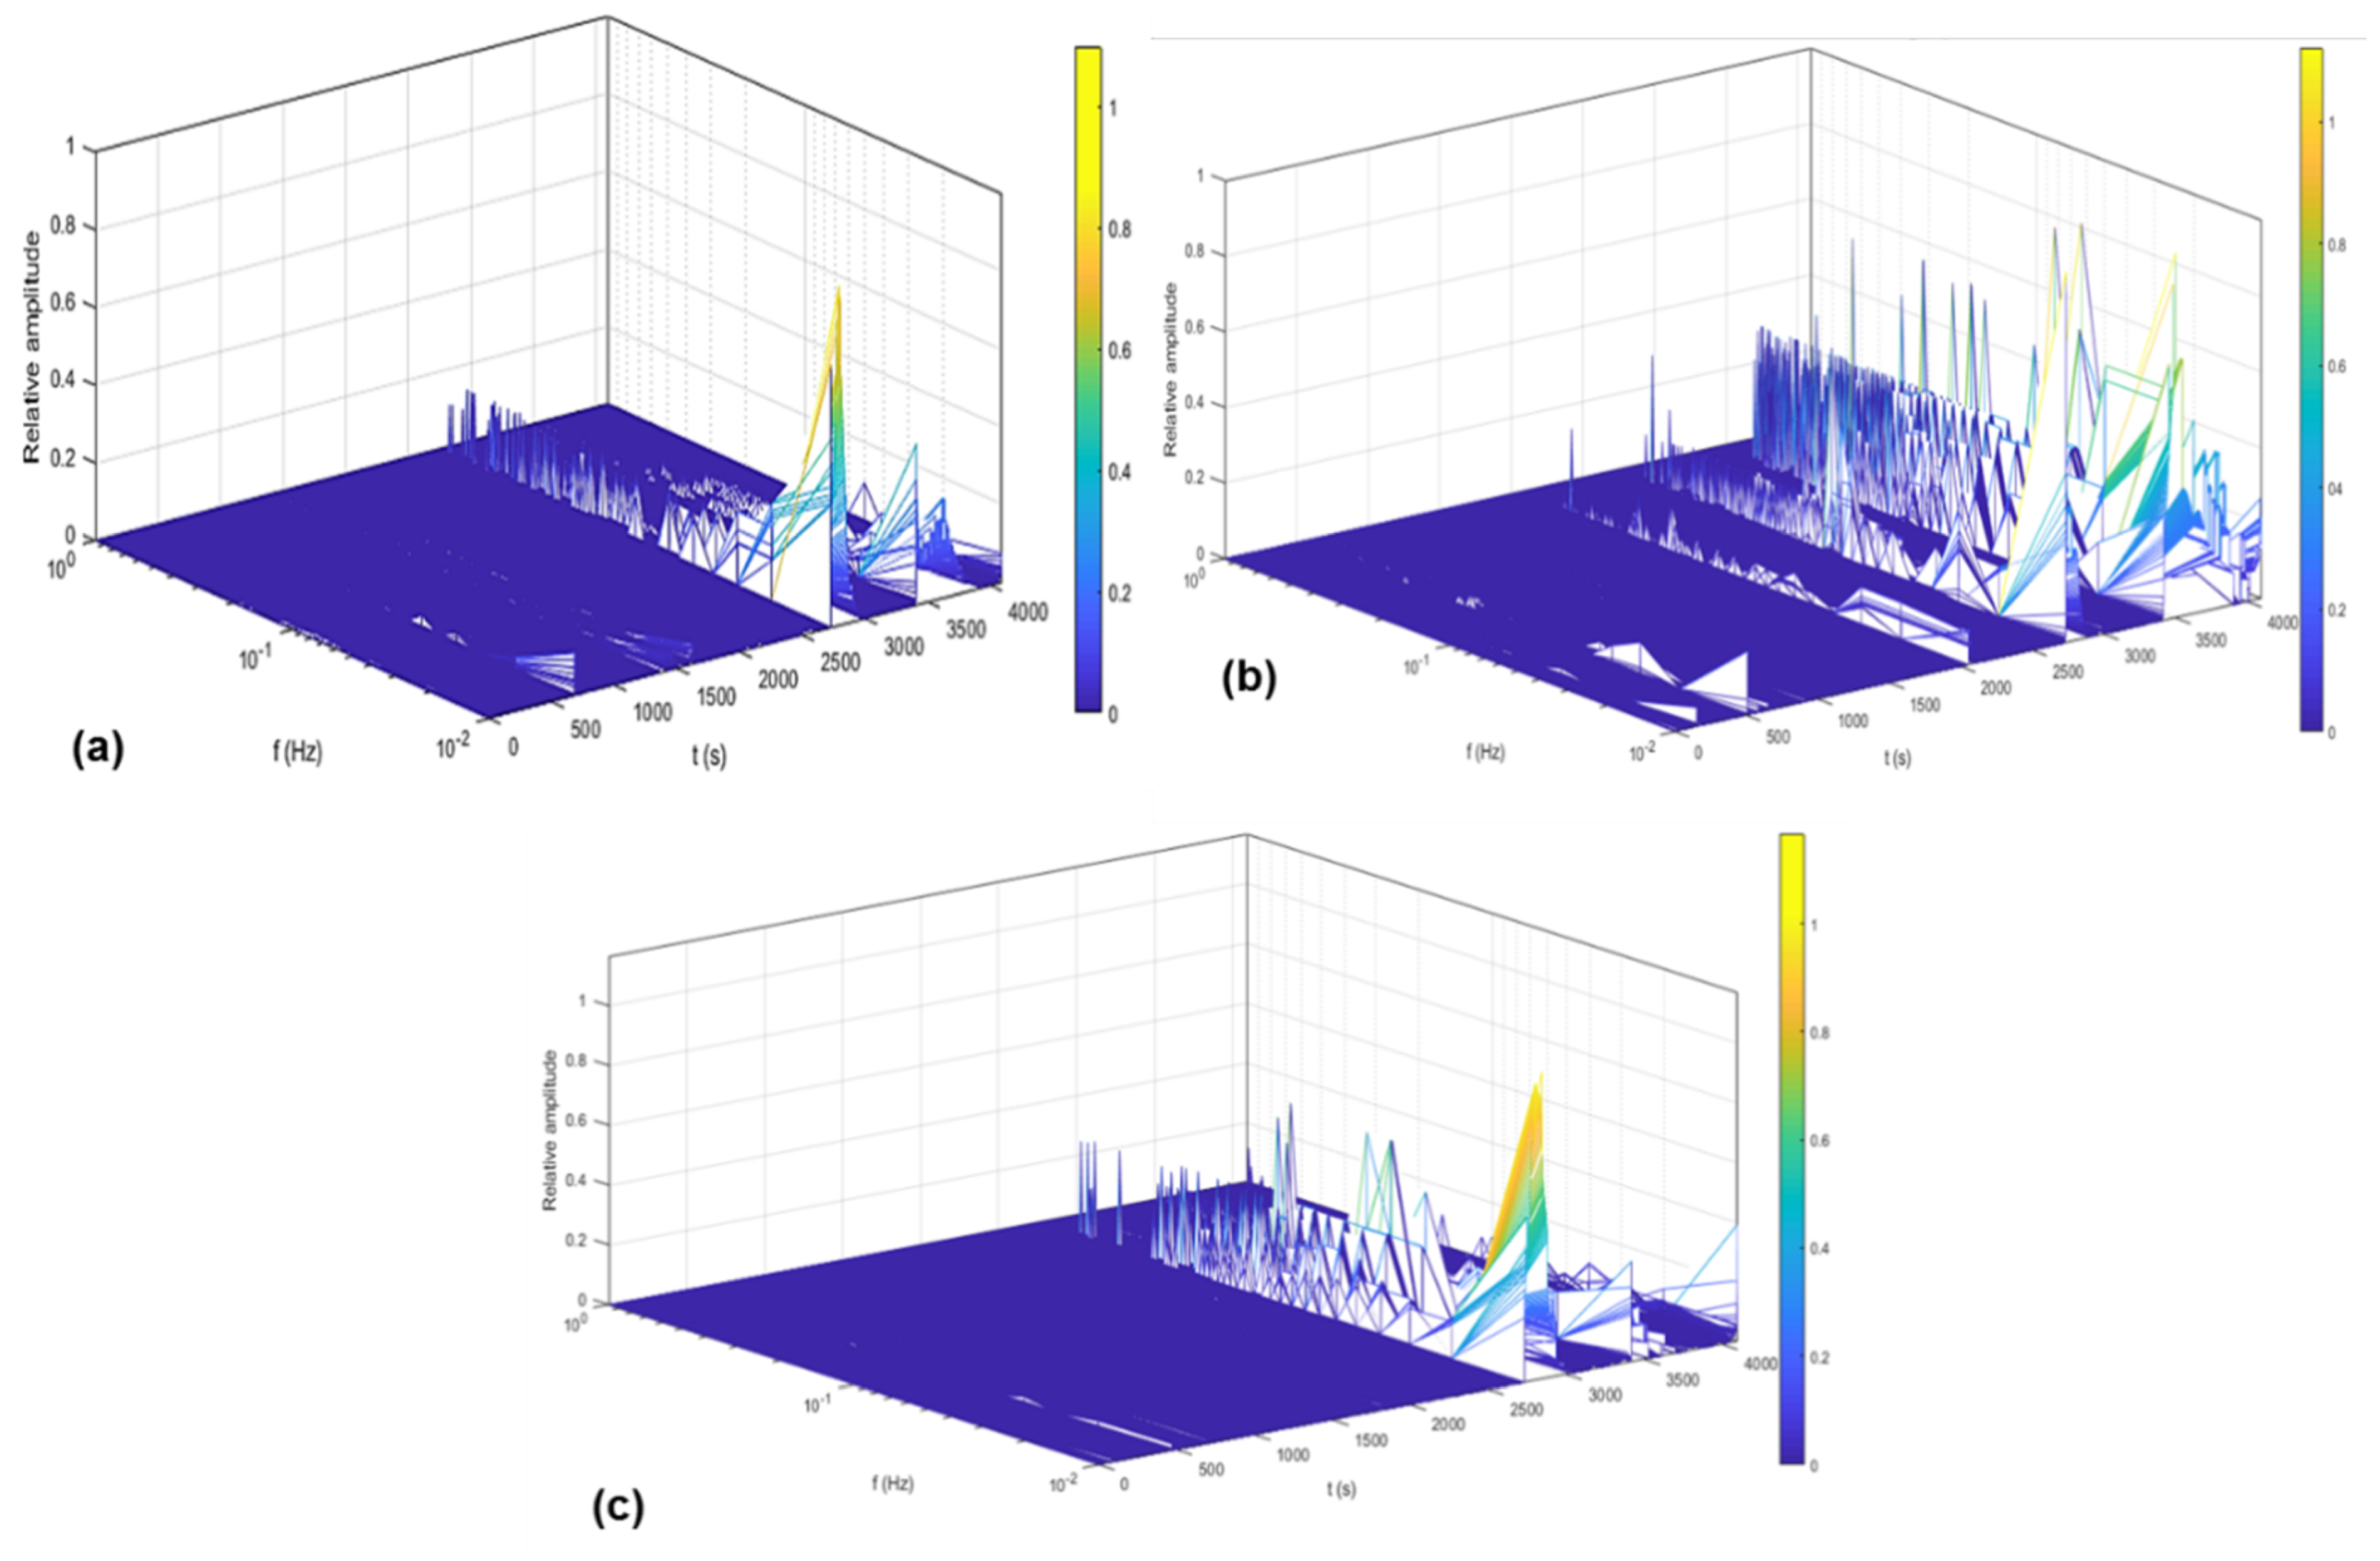
3.2.3. Wavelet Method
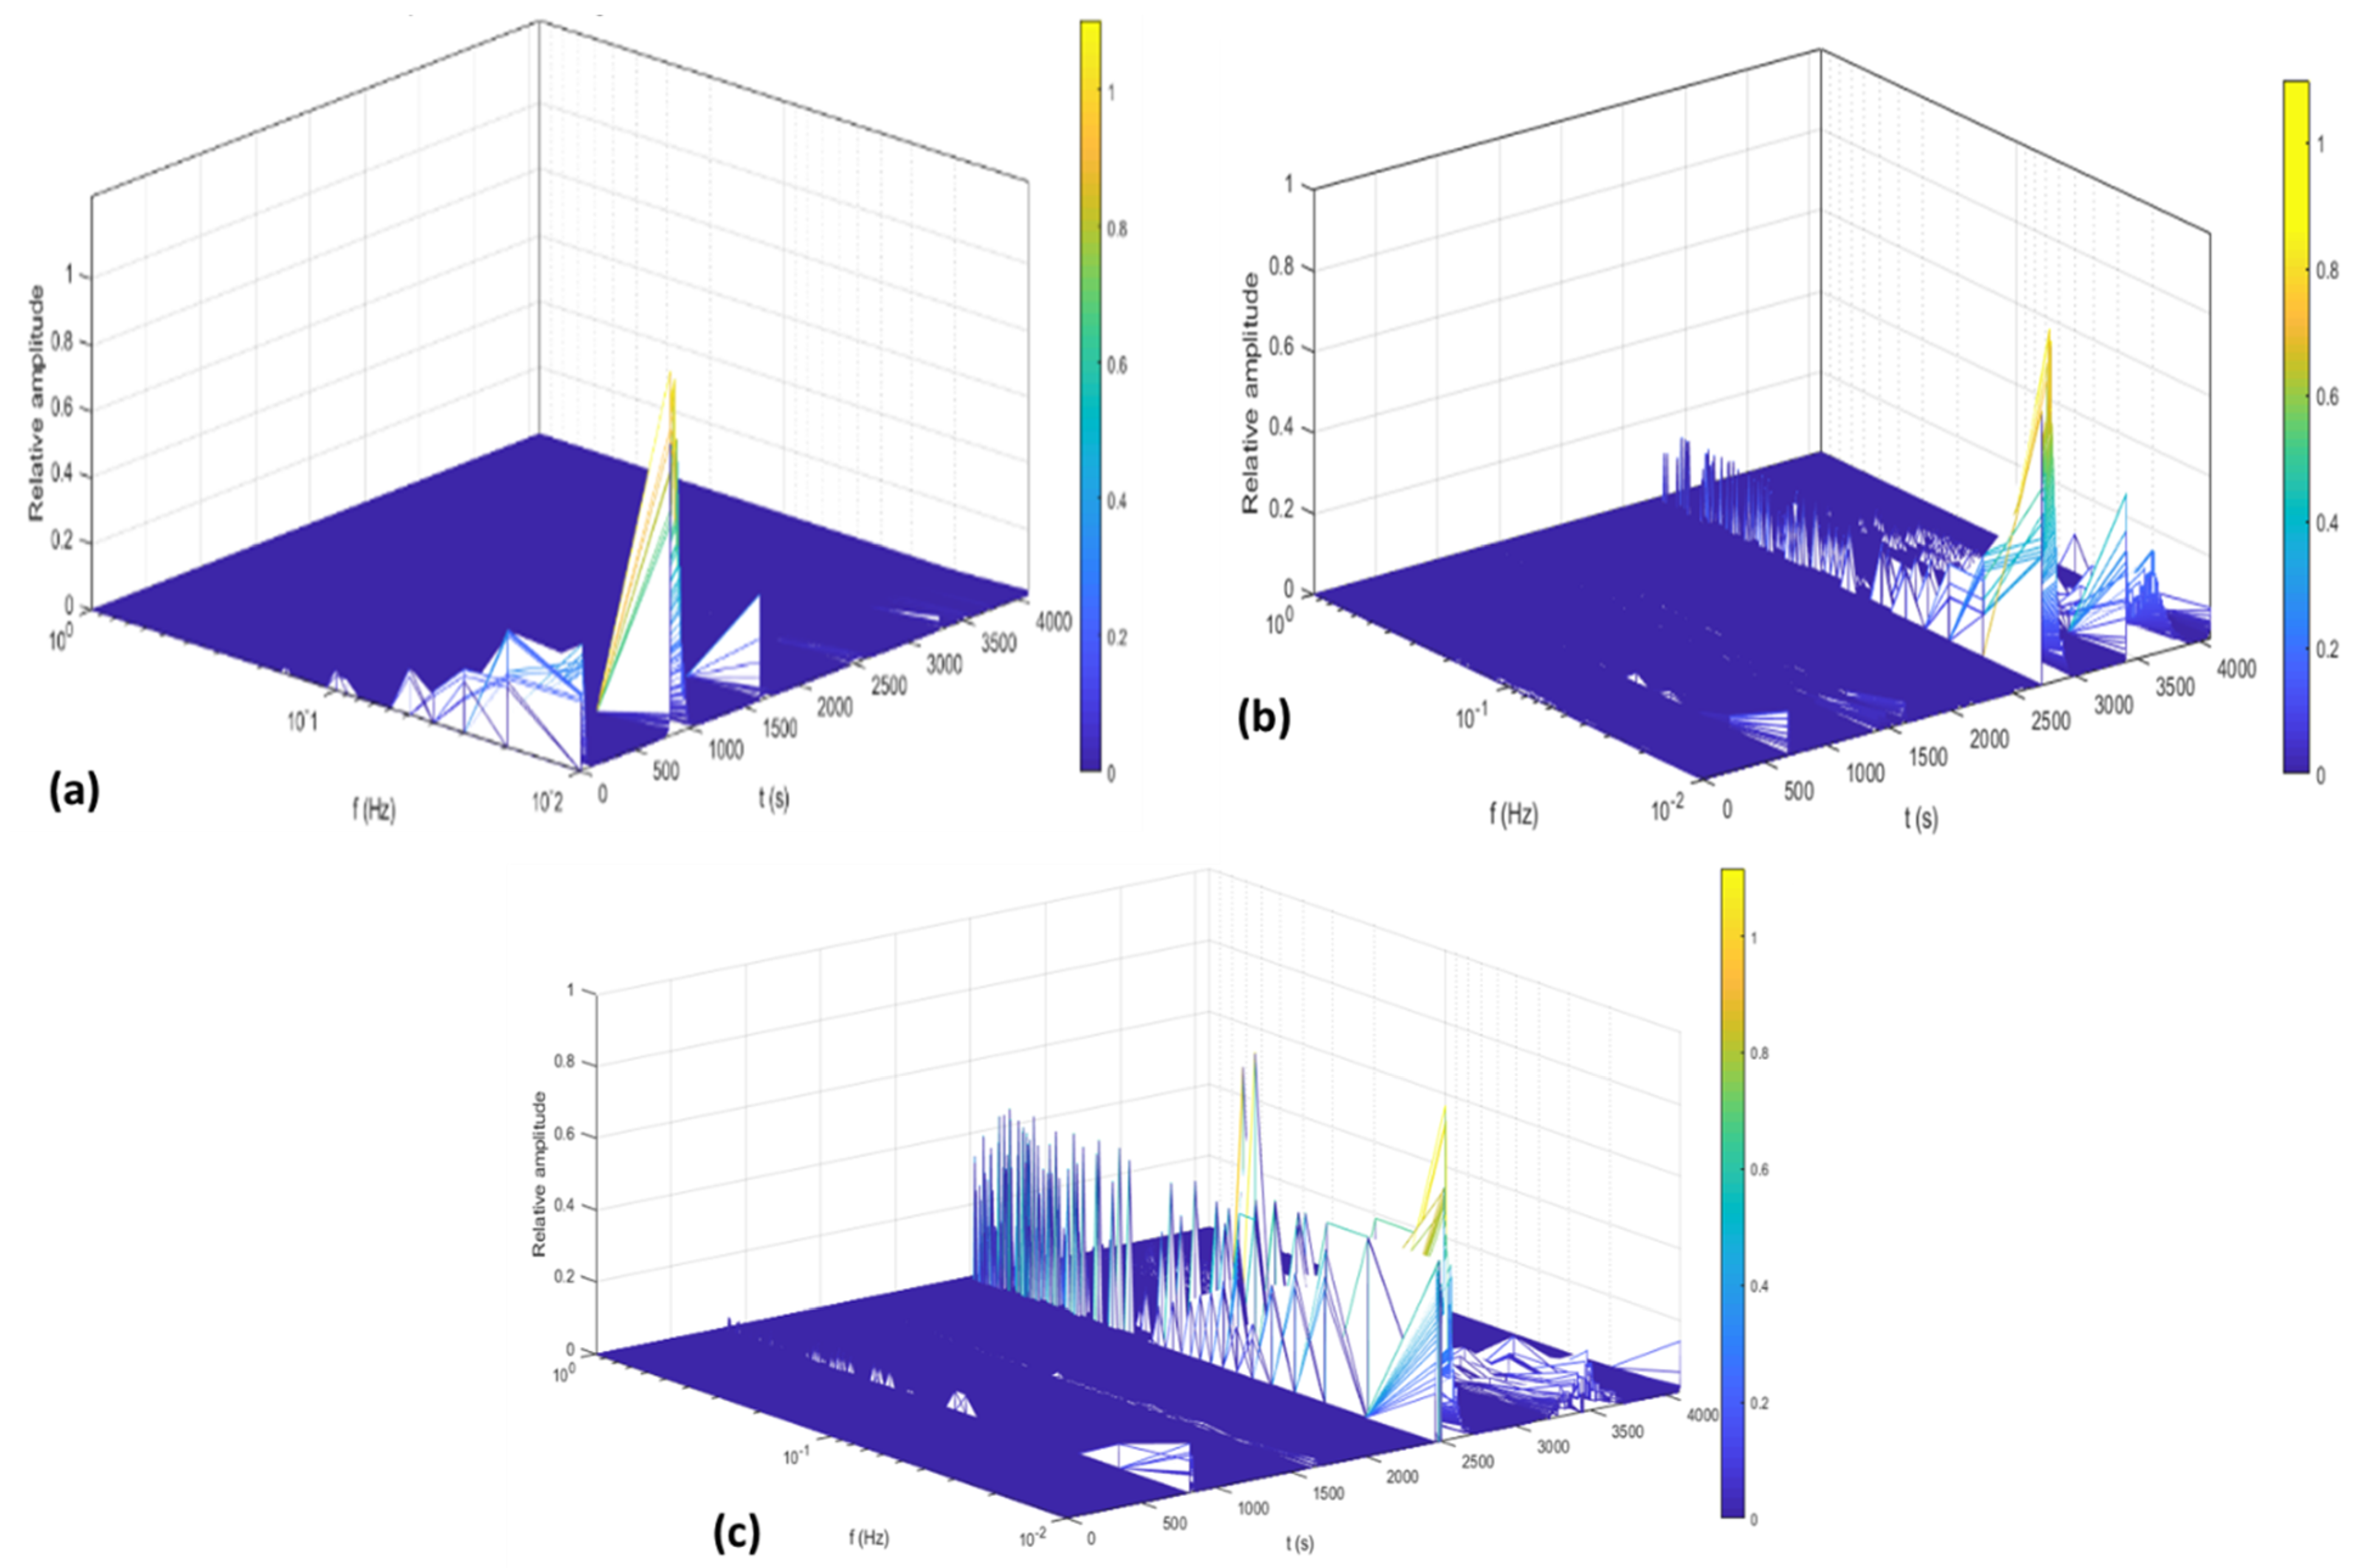
Wavelets methods decompose a signal with a high–low filter: low frequencies are named approximations, and high are called details [65]. To obtain the total energy of an N number of data is giving by Equation (11) [34]:
E = n 1 N x n 2
and energy fractions of details and approximation is giving by Equation (13):
E D j d = 1 E n = 1 N d j , n 2     E D j s = 1 E n = 1 N s j , n 2
The total energy analyzed is equal to each component energy of wavelet transform, Equation (14):
E = E D j s j = 1 j E D j d
For this research, the crystals number to analyze is of eight details and one approximation. When energy is accumulated on the first crystals (D1–D3), it is attributed to a metastable pitting process; when major energy is presented on the crystals from D4 to D6, it is associated with a localized corrosion; if energy is present in crystals D7 and D8, it is due to a diffusion, generalized, or controlled process [58,59]. Crystal S8 (approximation) is related with the DC from EN signal. To determine each crystal time range, Equation (15) must be applied [41]:
( c 1 j , c 2 j ) = ( 2 j Δ t , 2 j 1 Δ t )
where c is crystal and ∆t is time display. Table 6 shows each crystal scale range in seconds and in Hz. High-frequency crystals are the first, and low-frequency phenomena are presented in the last crystals.
Figure 5 shows EDP from ECN signal, where the highest energy is from approximation of crystal S8, indicating that major energy came from DC. Analyzing signal without DC, Figure 5a windowing presents energy accumulated in low-frequency crystals D7 and D8 for Ti CP2 and Ti-6Al-4V, representing 7% of total energy, attributed to diffusion of the passive layer. For Ti-6Al-2Sn-4Zr-2Mo, the major energy dispersed is on crystal D4 (0.008% of the total of energy), meaning an unstable passive layer, because energy is low, indicating that the passive layer was broken down. In Figure 5b, a controlled corrosion process is shown on Ti-alloys. Ti CP2 presented major energy in crystal D8 with 0.5%, Ti-6Al-2Sn-4Zr-2Mo in D8 (2.5% of energy) and Ti-6Al-4V is 0.10% in D8, meaning that in H2SO4 solution, Ti alloys developed a stable passive layer.

3.2.4. HHT Analysis

Another advanced method to determine the corrosion type and mechanism is HHT, which helps to remove DC from the original signal [59]. In addition, this method can localize the frequency and time when energy interchange is occurring; this energy is called instantaneous energy and is calculated by an empirical method of decomposition (EMD) to obtain intrinsic functions (IMF) and apply HHT as proposed by Huang et al. [60] in 1998 to study non-stationary signals. A spectrum with the distribution of time-frequency-energy is generated, and it permits localized energy to accumulated [42,66,67,68,69]. EMD, proposed by Huang, is expressed in Equation (16):
x ( t ) =   i = 1 N h ( i ) ( t ) + d ( t )
d(t) is the average of the trend at a low frequency of the time series x(t) and cannot be decomposed; h(i)(t) is the i-th term of IMF that is generated; these numbers must satisfy the conditions that the extreme and cross numbers are equal or differ by a maximum of 1 and that each point using the local maximum and minimum must be 0 [61,62]. The HHT Equation (17) is governed by:
y j ( t ) = 1 π p h j ( τ ) t τ d τ
where yj(t) is the Hilbert transform and IMF are represented with hj; p is related to the Cauchy principle and is linked with an average of IMF [69,70].
Figure 6 and Figure 7 show time–frequency–energy spectra generated by HHT. For Ti CP2 in Figure 6a and Figure 7a, the energy is concentrated on 10−2 Hz frequencies, meaning a diffusion process occurs. In Figure 7a, Ti CP in H2SO4 the process present is at 10−2 Hz but presents instantaneous frequencies at middle frequencies. However, the energy presented is low, indicating that a diffusion-repassivation process is occurring at the same time, supporting that the passive layer is broken in Ti-alloys, which will regenerate in the presence of an aqueous media. Figure 6b and Figure 7b correspond to Ti-6Al-2Sn-4Zr-2Mo in NaCl and H2SO4, respectively; this alloy presents a similar behavior in Figure 6a and Figure 7a, where energy is accumulated at low frequencies in Figure 6b to indicate a diffusion process. For Figure 7b, spectra show activity at middle frequencies, indicating a passivation-repassivation process, because repassivation (the break and regeneration of the passive layer) is a fast process related to middle and high frequencies. On the other hand, passivation-diffusion is a slower process, and they need large time periods, which are related to low frequencies. For Ti-6Al-4V the Hilbert spectra in Figure 6c and Figure 7c show the results when it was immersed in NaCl and H2SO4 several times. Figure 6c presents energy accumulation at middle frequencies in seconds 2500 and between 2600–2700; energy accumulation is presented at low frequencies, indicating that in second 2500, a pitting-repassivation process occurs, and in the time elapsed, the diffusion falls. In Figure 8c, the process taking place is passivation–repassivation (at middle and low frequencies), but the slow process is prevailing in the corrosion system. Considering that energy presented to Ti alloys is lower than that of NaCl (based on statistical, visual, and PSD results), the passive layer created could be unstable with low thickness because of the occurrence of Na+ and Cl ions diffusion.

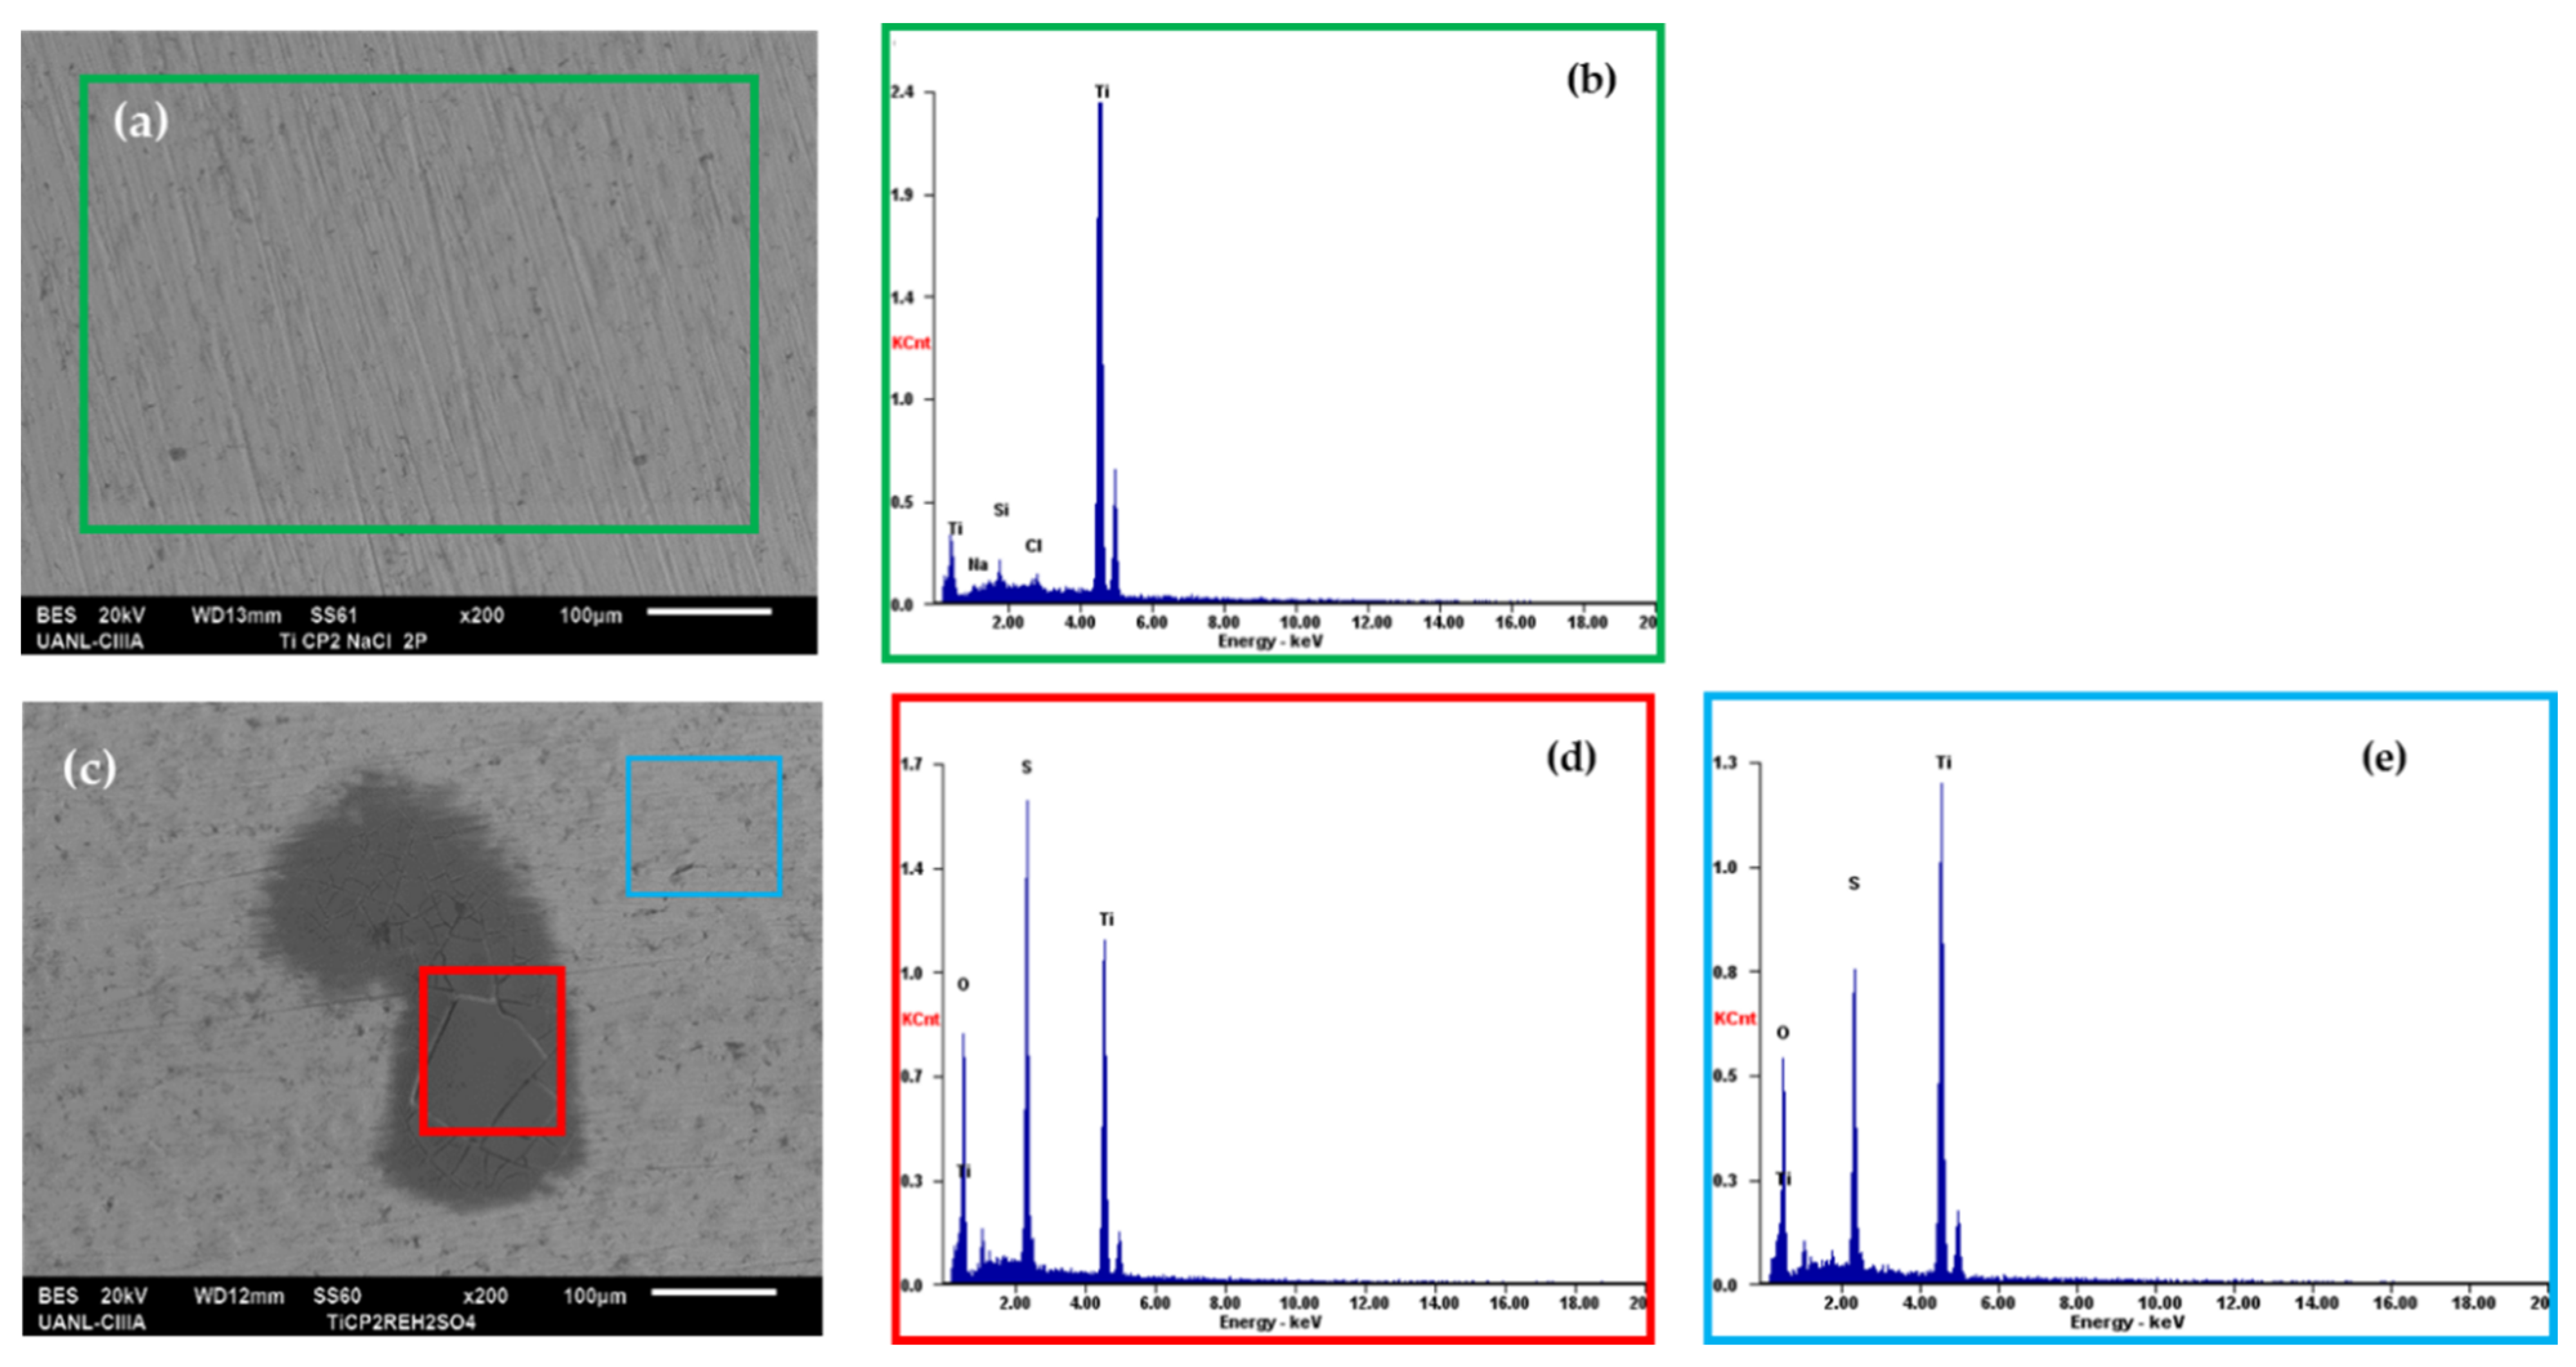
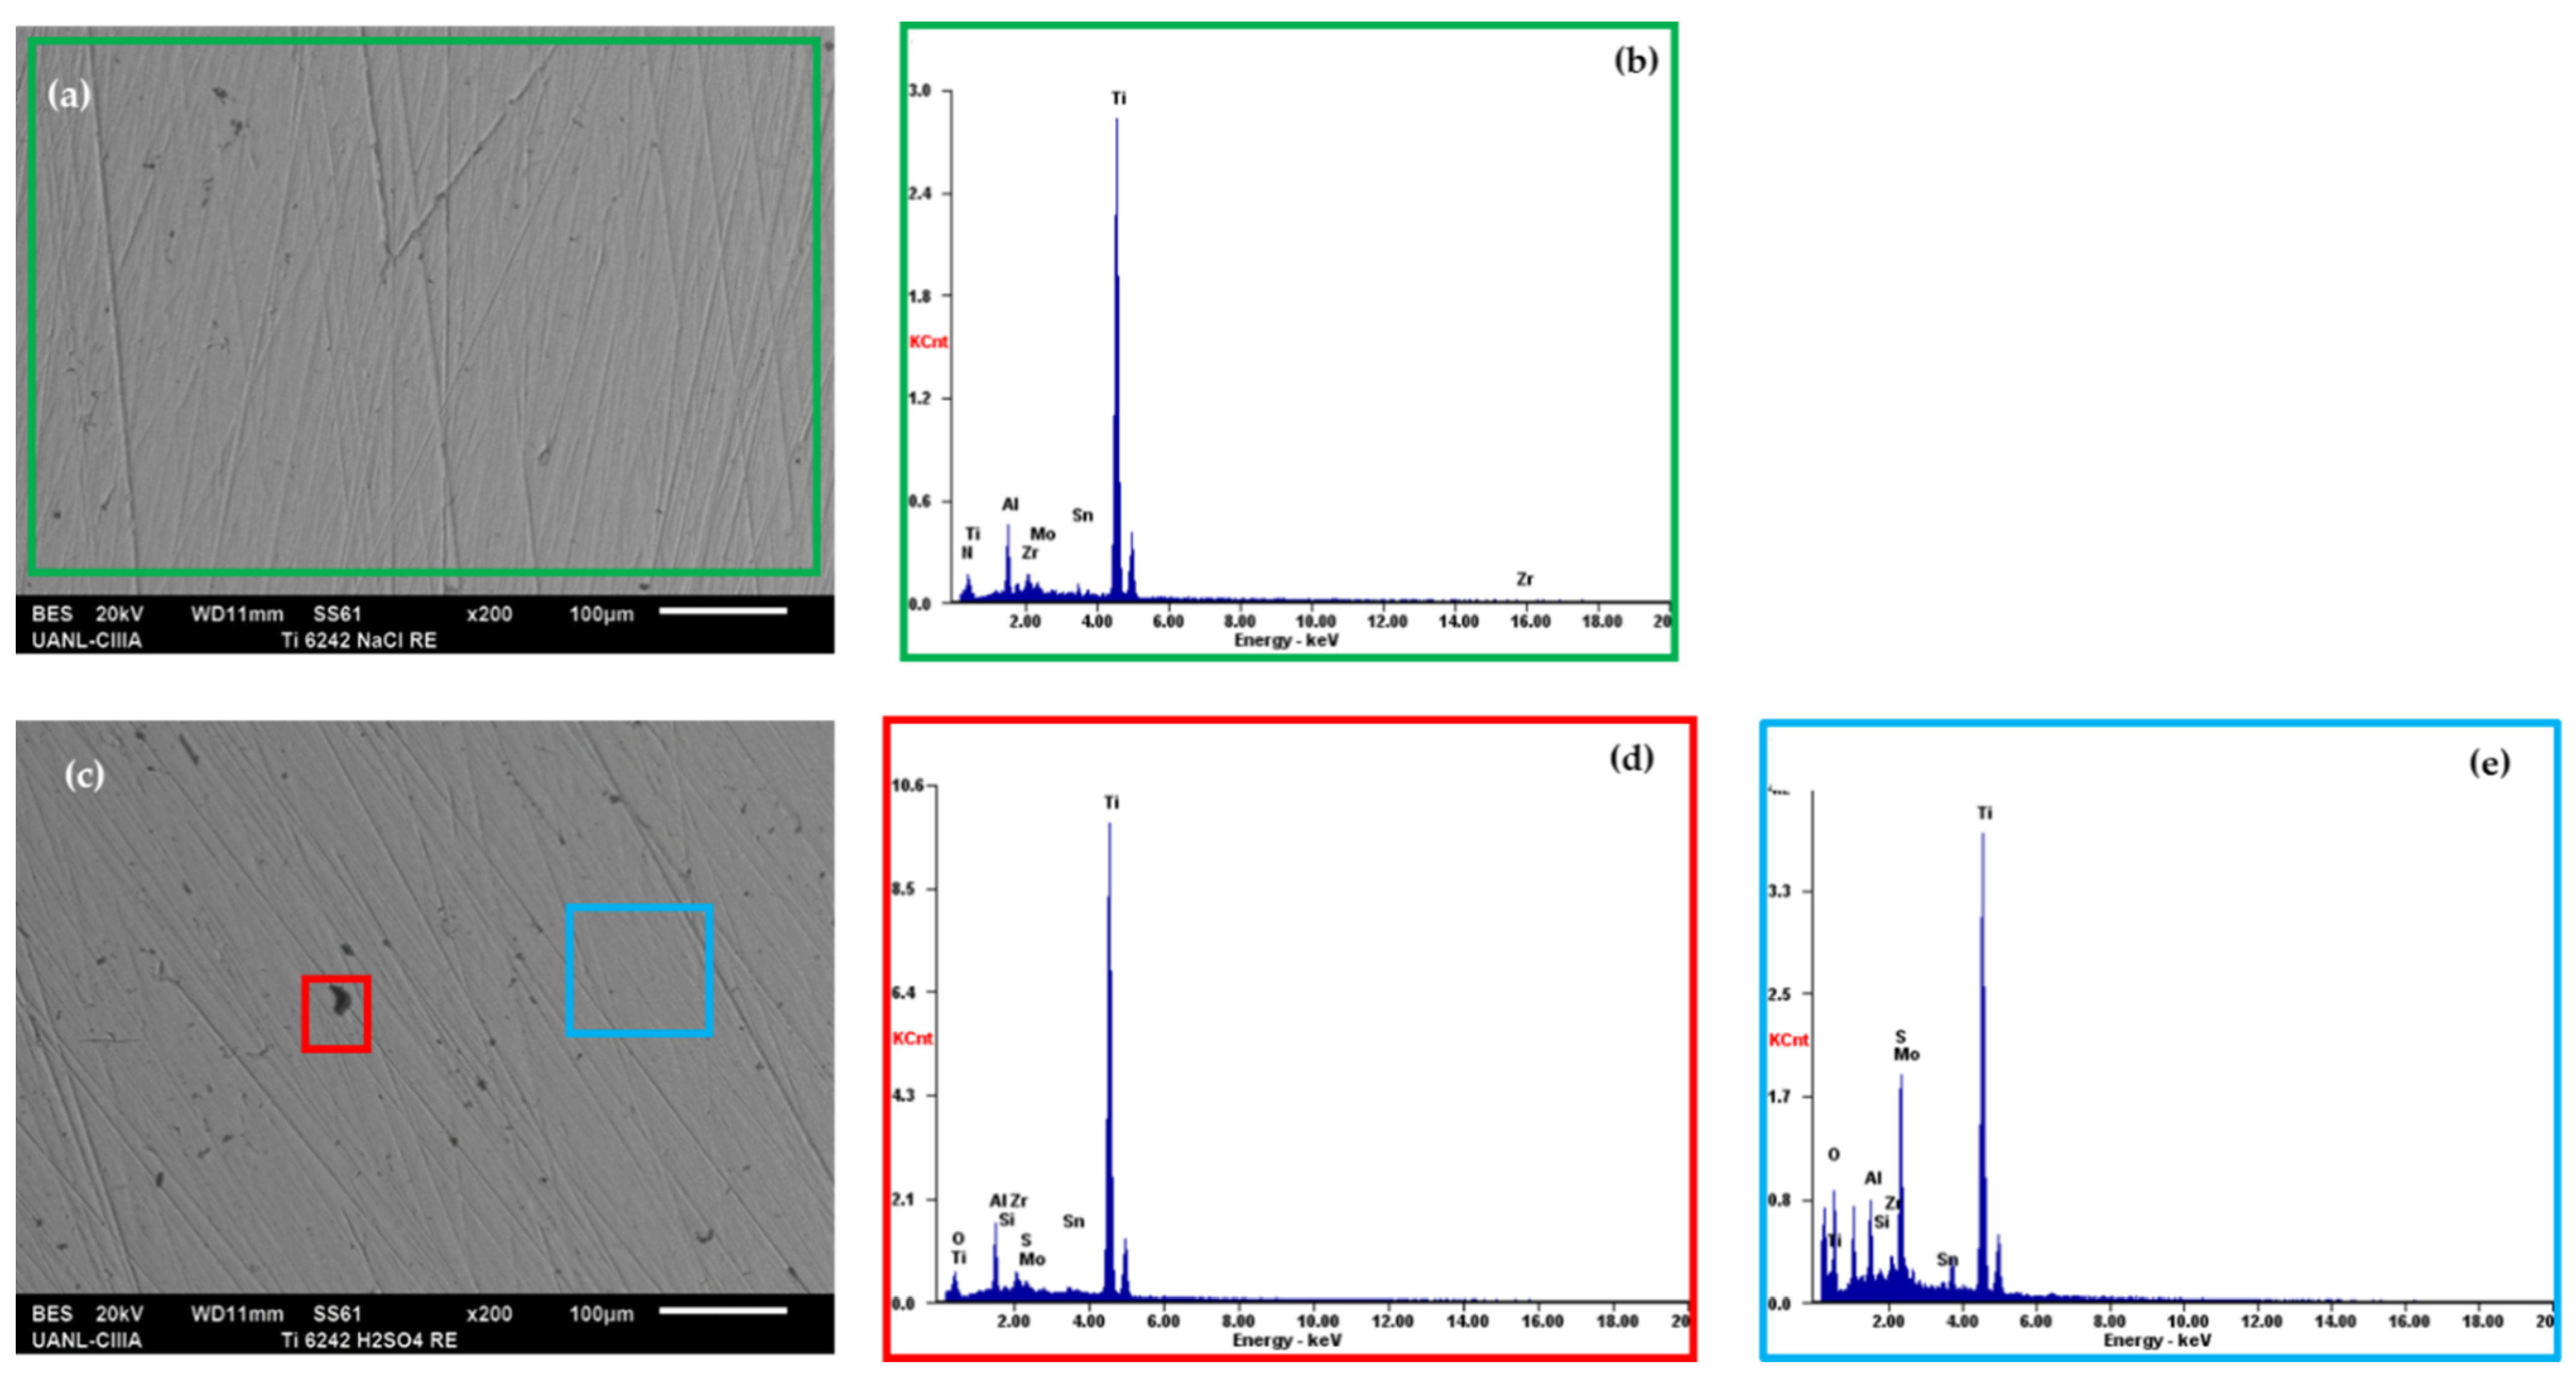
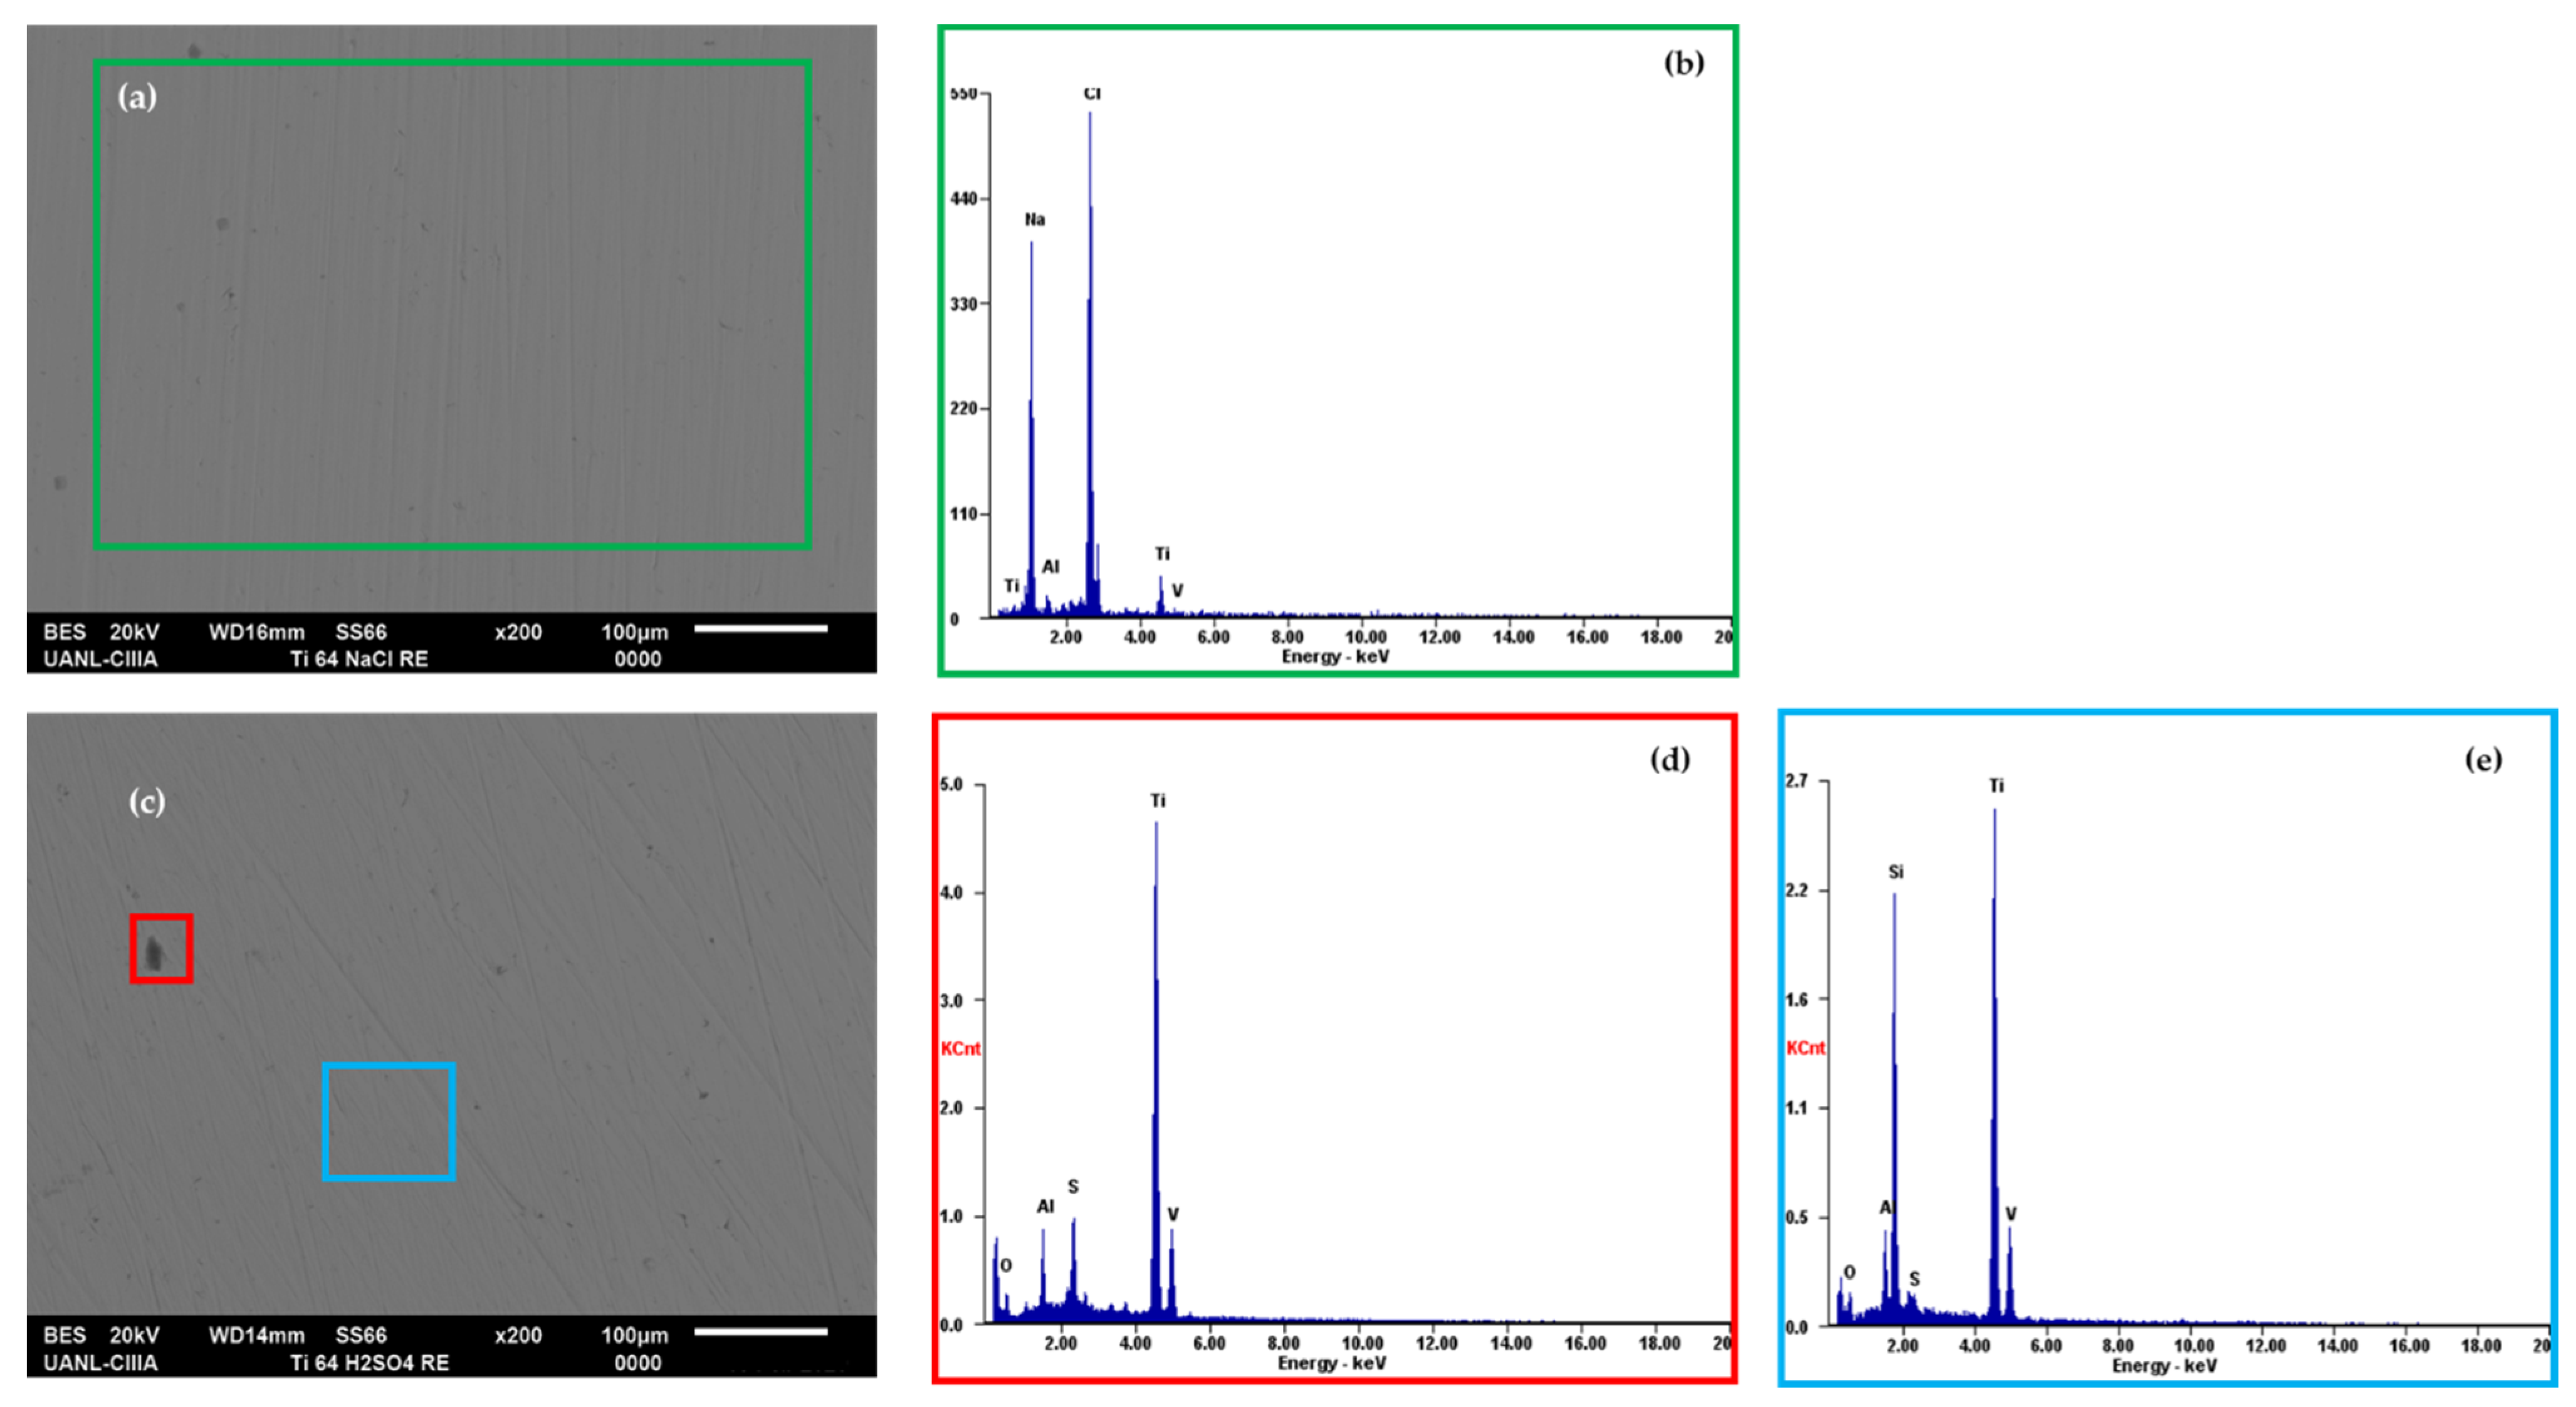
3.2.5. SEM Corrosion Product Analysis

The morphology micrographs of the titanium alloys and the elements present on the surface after the electrochemical experiments performed in NaCl and H2SO4 solutions were analyzed by scanning electron microscopy (SEM) and energy-dispersive X-ray spectroscopy (EDS); see Figure 8, Figure 9 and Figure 10.
In the EDS energy spectrum, the presence of titanium, aluminum, zirconium, vanadium, molybdenum, and tin is observed, corresponding to the base elements of the alloys under study.
Ti alloys in NaCl solution (Figure 8a,b, Figure 9a,b, Figure 10a,b) do not have the presence of oxygen, but all of them shows average Na (3.64 wt. %) and Cl (0.53 wt. %) on the surface, which indicates that the ions of Na+ and Cl were diffused on Ti-alloys surface.
When Ti alloys are in H2SO4 solution (Figure 8c–e, Figure 9c–e, Figure 10c–e), all samples present oxygen, but it is more prevalent in Ti CP2, where the presence of oxygen in the darker zone, marked with a red box (average 20.36 wt. %), is higher than in the area marked with a blue box (average 18.08 wt. %). The spectra EDS of Figure 8, Figure 9 and Figure 10d,e indicates that sulfur (average 12.12 wt. %) is present, but since the layer is not thick, surfaces do not present a major change in color in areas, like those in the Figure 8c, Figure 9c, Figure 10c (red box), which is due to the growth of a passive layer being less complicated in single-phase α alloys than in alloys that present two-phase α–β alloys, because galvanic couples can occur through alloying elements.

4. Discussion

Microstructural analysis revealed the porosity in Ti CP2 and Ti-6Al-4V samples, which causes loss of mechanical properties because pores are stress concentrators [70]. Seah et al. [71] conclude that although porosity makes material susceptible to localized corrosion, it can also repassivate.
The corrosion resistance of titanium and its alloys depends on the chemical composition of the material. Suitable alloying elements play a major role in the corrosion resistance of these alloys. The porosity of alloys is a compromise between mechanical strength and adequate pore size to obtain certain operating properties [70].
Nevertheless, an increase in the porosity of metals leads to a lower corrosion potential value, which results in increased susceptibility of porous materials to localized corrosion. It is assumed that the relatively small pores present in the cell walls favor electrolyte placement and oxygen depletion, which is important in the stability and preservation of the oxide layer on titanium. Elements with higher porosity, with open and interconnected pores, allow easier electrolyte flow, which complements the oxygen supply during the passivation process [72].
Porous titanium showed higher values of Ecorr when compared to solid counterparts, most probably because of surface oxidation [72]. Dabrowski et al. [73] obtained similar results. They found that the influence of porosity of titanium ranged from 45 to 75% on corrosion resistance and showed that material with higher porosity exhibited less susceptibility to corrosion than those of 45% porosity. However, both elements exhibited lower corrosion resistance than the solid Ti [73]. Chen et al. confirmed that the electrolyte flow can also decrease corrosion rates of solid and porous materials [74].
In this research, porosity affects homogenous passive layer generation. As pores are high-energy zones, current will accumulate in those areas generating transient. Ti-6Al-2Sn-4Zr-2Mo was the alloy with higher porosity (2.88%), and in NaCl electrolyte, it presents difficulties creating a homogenous passive layer; porosity is one of the factors that interfere with developing a continuous oxide layer. Even though pores affect the passive layer generation, is important to mention that all materials naturally present a porosity percentage that is linked with the manufacturing process. Further, pore diameters are in the order of 1–2 µm, minimizing influence in corrosion behavior. Porosity could be considered as a major impact factor in materials manufacturing by powder metallurgy or select laser melting, where porosity diameter and percentage are higher than in the forging process.
All titanium alloys are susceptible to porosities, and pores’ diameters influence electrochemical behavior. In pores with diameters between 10–100 µm, electrochemical processes of bubbles formation by gas evolution were registered [75,76]. For electrochemical noise analysis, Huet [76] concluded that oxygen evolution generated by pores is represented as fluctuations in PSD. If roughness or pores diameters increase, power spectral order will increase.
Several EN procedures correlating timed dependent fluctuation of current and potential during the corrosion process have been used to indicate the type of corrosion occurring. For instance, it is well recognized that the main source of electrochemical noise is the passive film breakdown process and repassivation process. This is why it is important to study the behavior of titanium alloys with aeronautical applications, since several components are exposed in saline environments and environmental contamination with sulfuric acid.
Recent research in electrochemical characterization of Ti-alloys showed a good corrosion resistance with electrochemical techniques such as PP and EIS. Moreover, Ti alloys do not present damage on the surface [7,77]. Researchers have also found that titanium is not affected by pitting corrosion in salt media when the temperature is under 90 °C, that Cl ions will not penetrate the surface of alloys, and that the alloy shows passivation [17,46,78,79,80,81,82,83,84,85].
Electrochemical noise cathodic and anodic reactions cause changes in material surfaces: when Ti-alloys are exposed to aqueous solutions, independently of mix, the hydrogen will react by an evolution reaction [83], given by the next chemical reaction:
2 H + + 2 e H 2
This phenomenon occurs in cathodic reactions where hydrogen reacts. On the other hand, the growth of a passive layer in electrochemical conditions is represented according to the following equations [84,86]:
Ti Ti 3 + 3 e
2 Ti 3 + 3 H 2 O Ti 2 O 3 + 6 H +
Ti 3 + Ti 4 + + e
Ti 4 + + H 2 O TiO 2 + 4 H +
where the reaction forms TiO2 and Ti2O3, whose oxides create a stable layer on the metal surface and protect the titanium against corrosion, and oxide development is a slow process. In addition, as was mentioned in the section on wavelets and HHT, in the research of Liu, aggressive ions like chloride, bromide, or sulfate accelerate the anodic process, and ions can migrate in a passive layer according to Liu et al., who showed that, in a test with Cl, those ions adhered to material surface together with oxides, as is represented by the chemical reaction [87]:
Ti a O b + 2 Cl Ti a O b Cl 2 + 2 e
Cl ions play the role as interstitial element, but as Cl is bigger than O, means that the ion will have difficulty sinking into the material, and it generates a diffusion of Cl on the surface [43]. Analysis by wavelets and HHT showed high energy accumulations in zones of low frequencies, because a diffusion process of Cl occurred on the Ti-alloys surface. In the case of Ti-6Al-2Sn-4Zr-2Mo, EDP presented energy accumulation at middle frequencies, because Cl creates an instability in the TiO2 layer, and as ions are bigger, it creates changes in electron flows like last the chemical equation shown, but as time advances, the process of instability changes to a controlled process of diffusion. Furthermore, SEM-EDS from Figure 8c shows how Cl is present on the surface, corroborating that diffusion of that element occurs in Ti alloys’ surface.
Factors that permit a non-uniform current distribution on the Ti surface is the inhomogeneity of the alloy according to Yang et al. [88]; however, a passive film is formed, and this reduces the corrosion kinetic of alloys and increases material life [89].
Dubent and Mazard [47] presented that Ti CP2 in H2SO4 formed a protective layer that contributed to reduced corrosion rate, but the electrolyte continues to be aggressive. This converges with the results from PSD, where Ti CP2 dissolution presents a value of −104 dBi in H2SO4, while in NaCl, the value is −122 dBi. This occurs due to the aggressiveness of redox reaction of H2SO4 shown in the next equations, parting from water dissociation [87,88,89,90]:
H 2 O 1 2 O 2 + 2 H + + 2 e
2 H 2 SO 4 + 2 e SO 4 2 + 2 H 2 O + SO 2
Ti + 2 H 2 SO 4   2 e   TiSO 4 2 + H 2
According to these reactions, titanium will be dissolved due to the aggressiveness of electrolytes. An H2 was developed, meaning hydrogen evolved and pH of electrolyte changed. In Ti-6Al-4V, Nabhani et al. [91] propose that a passive layer is formed on the surface; this layer is formed in a major part of TiO2 and presents aluminum and vanadium oxides concentrated in phases α and β, respectively; moreover, in the same research, Nabhani concluded that the presence of vanadium oxide increases the corrosion rate because the structure of this oxide could create vacancies and the ions penetration is easier. Wang et al. [92] report that the passive layer is generated instantaneously, and it also decreases when Cl is added, which affects the generation of a passive layer. When Engelkamp [93] performed experiments with H2SO4 added to H3PO, they demonstrated that when H2SO4 is pure, passive layer breakdown is common, as was shown in HHT for that electrolyte in this research. Wang’s and our results confirm that some ions are more severe in Ti alloys, especially Cl (and all halides) [94] because provoking the dissolution of passive-layer H2SO4 can generate more material dissolution; however, over a large amount of time, Cl can provoke more damage because it prevents the passive layer from being developed, and Cl presents a diffusion process. Fattath et al. [95] also presented a passivation system for Ti alloys under H2SO4, which confirms the existence of a passive layer but further confirms the development of a porous layer considering a natural process, this porousness creates instability and changes in measurements.
Beck, Blackburn, and Gao [96,97] determined that titanium is susceptible to Cl ions, which confirms what was mentioned in the last paragraph; in NaCl electrolyte, the behavior of the passive layer is attributed to Cl, which avoids a uniform formation of the layer.
To determine corrosion mechanisms, some authors use statistical methods to related Rn and Rp. Al-Mazeedi and Cottis in 2004 [98] mentioned that it is not possible to realize a measure of Icorr but that it is possible to estimate a measure from EPN and ECN data, concluding that the use of Rn to calculate a relation with corrosion rate is correct. However, in 2005, Cottis, Sanchez-Amaya, and Botana [99] used Rn to differentiate between corrosion activities in different media and not as an indicator of corrosion rate. In this case, Rn presents changes in values for Ti alloys in NaCl related to the time series fluctuations and transients; therefore, Rn’s value is higher in NaCl than in H2SO4 because NaCl presents more change in transients due to passive layer instability. This is because Rn depends on σE and σI, and a great variation of σ is associated to a high amplitude transients or fluctuations. Only Ti-6Al-2Sn-4Zr-2Mo presents an Rn higher in H2SO4 than in NaCl, which can be attributed to the breakdowns and regeneration of oxide layer created on the surface.
The application of statistical results to determine mechanism was discussed previously by Cottis, Eden, Turgoose, Sun, Mansfeld, Botana, Gaona-Tiburcio, Sanchez Amaya [29,30,54,58,97,98,99,100,101,102,103], and looking for a better method, Eden proposed an analysis by skewness and kurtosis and patented it with Reid [56]. Authors agree with the higher exactitude of skewness and kurtosis compared to the localization index method (LI) [65,98,102,103,104,105,106], but this also generated discrepancies due to the limitations of statistical analysis for chaotic systems. For this reason, diverse authors [31,39,57,61,102,103,104,105,106,107] recommend using this method with discretion. The results of skewness and kurtosis presented divergences in NaCl, while skewness showed uniform corrosion results and kurtosis presented pitting, making a divergence in results. This could be explained by the great number of transients of cathodic and anodic reactions. Even though statistical results did not show concordance, they can explain other phenomena: high kurtosis number indicated the presence of transients of high amplitude and high σ, and, in the case of metals, then generated a passive film. A high kurtosis means instability, or many processes occurring on the surface. On the other hand, skewness is helpful to determine if a cathodic or anodic phenomenon predominates the corrosion system: when current is analyzed, if skewness is positive, it will indicate that cathodic reactions predominate; if it is negative, it indicates that anodic reactions prevail. This behavior is inversely reciprocal for voltage analysis. Skewness is negative only for TiCP2, meaning a predominance of anodic reactions is associated with electron losses; on the other hand, Ti-6Al-2Sn-4Zr-2Mo presented positive skewness, generating electrons gain.
Results of PSD give great information about material [27,28,29,30] dissolution that cannot be obtained by statistical methods, Ti-6Al-2Sn-4Zr-2Mo presented lower values Ψ0 in NaCl and H2SO4, while Ti CP2 has the higher dissolution material values, denoting that although passivation occurs, the passive layer does not protect the H2SO4 reaction, associated with hydrogen evolution and change in electrolyte pH, which increases the aggressiveness. To analyze PSD slope, it is necessary to be careful, because, for some authors, it cannot be mechanistic [58]. However, if PSD is analyzed by the change in slopes around all the frequencies, it can provide useful information, as Uruchurtu [63] proposed that slope change means a change in the process if the change slope is around limit frequencies, signifying a charge to passivity or a decrease in pitting rate. All samples showed the change of slope at limit frequency, which means a change to alloy passivity.
Wavelets are a useful technique to analyses complex systems. Statistical and PSD slopes do not give certain information about corrosion mechanisms, and an algorithm to decompose signals has been offered [69]. Results showed an energy accumulation in crystals D7 and D8, Crystal S8 is related to DC, and crystals of approximation cannot present DC energy [108]. According to Li, when D8 crystal has the highest energy accumulations, it is because a passive film was formatted, and when energy is higher in crystals D4, D5, and D6, it is associated with a repassivation process, as shown when Ti-6Al-2Sn-4Zr-2Mo are in an NaCl solution. Smith and Macdonald declared that wavelets analysis was able to identify the pitting systems in 2009 and questioned whether it is possible to determine a generalized or passive system. Li, Moshrefi, Lara-Banda, Chui, and Liu [35,108,109,110,111,112,113,114,115,116] agree with the method to determine passivation and metastable pitting. Asfia et al. also determined that is a good option to eliminate trend without eliminating corrosion data [105,114,117] and that it is helpful to determine corrosion mechanisms in distinct media [118,119,120]. Various authors indicate that the interpretation of wavelet is more useful to determinate corrosion mechanism that statistical methods [110,111].
HHT is a technique that can be used in normal or microbiological corrosion processes, and a low-frequency process indicates a passive system [114]. For localized processes, Hilbert spectra show energy accumulation at middle and high frequencies (100 and 10−1 Hz). A process of metastable pitting/repassivation and a localized corrosion process can also be identified [119,120]. All these asseverations from authors about energy distributed at middle frequencies [34,48,69,109,118,120] correspond to a repassivation process as proven in Figure 6 and Figure 7, where Ti-alloys presented repassivation, because, for an unstable passive layer, NaCl and H2SO4 are created. However, this method is more complete than statistical analysis in finding the corrosion mechanism and not only the corrosion type. Further, given the information about the moment in that a corrosion process begins, this could be a pitting, repassivation, diffusion, or passivation, and it can be related to time-series of ECN and EPN, depending on which one elaborated the Hilbert spectra. Wavelets and HHT presented concordance in results about corrosion mechanism.

5. Conclusions

  • In this work, characterization by electrochemical noise of titanium alloys could find potential applications in the aeronautical industry. Ti-Alloys developed a passive layer in both electrolytes, but this one is more stable in H2SO4 than in NaCl solution.
  • EN results show that Rn has higher values for Ti-6Al-2Sn-4Zr-2Mo and Ti-6Al-4V in H2SO4 than in NaCl solutions. The current and potential time series show different behavior for each electrolyte, and anodic–cathodic transients’ fluctuations can be associated with a general or localized corrosion process.
  • Skewness and kurtosis results show that they must be interpreted as a measure of the disorder and distribution of transients and not as a mechanistic method for Ti alloys. This also generated discrepancies due to the limitations of statistical analysis for chaotic systems.
  • PSD in current results showed that Ti-6Al-2Sn-4Zr-2Mo has more resistance to dissolution alloy because it presents lower values of Ψ0. Limit frequency all Ti-alloys presented a changed passivation process.
  • Wavelets and HHT methods are more reliable to determine the type of corrosion for Ti alloys than statistical methods. In NaCl and H2SO4, wavelets and HHT presented similar results. For NaCl, behavior was associated with a slow process, but the energy presence at middle frequencies was significant and an unstable passive layer was attributed to Cl ions. Alloys manifested in H2SO4 a slow process associated with passivation in wavelets and HHT methods.
  • SEM-EDS observations indicated that wavelets and HHT in Ti-alloys exposed in NaCl solution showed the presence of Cl as agent diffusion, and when alloys were exposed to H2SO4 solution, the surface morphology had the presence of oxygen, a main element of the passivation layer.

Author Contributions

Conceptualization, F.A.-C., J.M.J.-M. and C.G.-T.; methodology, J.C.-M., J.M.J.-M., J.O.-C., L.D.L.-L. and C.G.-T.; data curation, F.A.-C., J.M.J.-M., E.M.-B., D.N.-M., J.O.-C., and J.P.F.-D.l.R.; formal analysis, F.A.-C., J.M.J.-M. and C.G.-T.; writing—review and editing, F.A.-C., J.M.J.-M. and C.G.-T. All authors have read and agreed to the published version of the manuscript.

Funding

This research was funded by the Mexican National Council for Science and Technology (CONACYT) of the projects CB 253272, A1-S-8882 and the Universidad Autónoma de Nuevo León (UANL).

Institutional Review Board Statement

Not applicable.

Informed Consent Statement

Not applicable.

Data Availability Statement

The data presented in this study are available on request from the corresponding author.

Acknowledgments

The authors acknowledge The Academic Body UANL—CA-316 “Deterioration and integrity of composite materials”.

Conflicts of Interest

The authors declare no conflict of interest.

References

  1. Froes, F.H. Titanium Physical Metallurgy Processing and Applications, 1st ed.; Froes, F.H., Ed.; ASM International, Materials Park: Russell, OH, USA, 2015; pp. 75–84. [Google Scholar]
  2. Sha, W.W.; Malinov, S. Titanium Alloys: Modelling of Microstructure, Properties and Applications, 1st ed.; Malinov, S., Ed.; CRC Press: Oxford, UK, 2009; pp. 237–255. [Google Scholar]
  3. Gialanella, S.; Malandruccolo, A. Aerospace Alloys, 1st ed.; Springer: Cham, Switzerland, 2020; pp. 129–189. [Google Scholar]
  4. Mouritz, P.A. Introduction to Aerospace Materials; Woodhead Publishing: Cambridge, UK, 2012; pp. 202–223. [Google Scholar]
  5. Donachie, M.J., Jr. Titanium a Technical Guide, 2nd ed.; Dragolish, K., Ed.; ASM International, Materials Park: Russell, OH, USA, 2000; pp. 123–127. [Google Scholar]
  6. Barington, N.; Black, M. Aerospace Materials and Manufacturing Processes at the Millennium. In Aerospace Materials; Cantor, B., Assender, H., Grant, P., Eds.; CRC Press: Boca Raton, FL, USA, 2002; pp. 3–15. [Google Scholar]
  7. Veiga, C.; Davim, J.P.; Loureiro, A.J.R. Properties and applications of titanium alloys: A brief review. Rev. Adv. Mater. Sci. 2012, 32, 133–148. [Google Scholar]
  8. Semian, S.; Seetharaman, V.; Weiss, I. The thermomechanical processing of alpha/beta titanium alloys. JOM 1997, 49, 33–39. [Google Scholar] [CrossRef]
  9. Koshal, D. Metal Casting and Moulding Processes. In Manufacturing Engineer’s Reference Book; Koshal, D., Ed.; Butterworth Heinemann: Brighton, UK, 1993; pp. 1–23. [Google Scholar]
  10. Yang, X.; Liu, C.R. Machining titanium and its alloys. Mach. Sci. Technol. 1997, 3, 107–139. [Google Scholar] [CrossRef]
  11. Ahmad, Z. Principles of Corrosion Engineering and Corrosion Control, 1st ed.; Ahmad, Z., Ed.; Butterworth-Heinemann: London, UK, 2006; pp. 57–199. [Google Scholar]
  12. Noel, J.J.; Shoesmith, D.W.; Ebrahimi, N. Corrosion of Titanium, and Its Alloys, 1st ed.; Wandelt, K., Ed.; Elsevier: Amsterdam, The Netherlands, 2016; pp. 193–199. [Google Scholar]
  13. Moiseyev, V.N. Titanium Alloys Russian Aircraft and Aerospace Applications, 1st ed.; Fridlayander, J.N., Eskin, D.G., Eds.; Taylor & Francis; CRC Press: Boca Raton, FL, USA, 2005; pp. 47–84. [Google Scholar]
  14. Noël, J.J. The Electrochemistry of Titanium Corrosion. Ph.D. Thesis, The University of Manitoba, Winnipeg, MB, Canada, 1999. [Google Scholar]
  15. Tang, X.; Ahmed, T.; Rack, H.J. Phase transformations in Ti-Nb-Ta and Ti-Nb-Ta-Zr alloys. J. Mater. Sci. 2000, 35, 1805–1811. [Google Scholar] [CrossRef]
  16. Schutz, R.W. Corrosion of Titanium and Titanium Alloys. In ASM Handbook Volume 13B Corrosion: Materials; Cramer, S.D., Covino, B.S., Jr., Eds.; ASM International, Materials Park: Russell, OH, USA, 2005; pp. 252–290. [Google Scholar]
  17. Fu, T.; Zhan, Z.; Tang, Y.; Liu, Z.; Liu, Z.; Li, L.; Yu, X. Effect of surface mechanical attrition treatment on corrosion resistance of commercial pure titanium. Surf. Coat. Technol. 2015, 280, 129–135. [Google Scholar] [CrossRef]
  18. Tiyyagura, H.R.; Kumari, S.; Mohan, M.K.; Pant, B.; Rao, M.N. Degradation behavior of metastable β Ti-15-3 alloy for fastener applications. J. Alloys Comp. 2019, 775, 518–523. [Google Scholar] [CrossRef]
  19. Ossowska, A.; Sobieszcyk, S.; Supernak, M.; Zielinski, A. Morphology, and properties of nanotubular oxide layer on the “Ti-13Zr-13Nb” alloy. Surf. Coat. Technol. 2014, 258, 1239–1248. [Google Scholar] [CrossRef]
  20. Stern, M.; Geary, A.L. Electrochemical polarization. I. A theoretical analysis of the shape of the polarization curves. J. Electrochem. Soc. 1957, 104, 56–63. [Google Scholar] [CrossRef]
  21. Volmer, M.; Weber, A. Keimbildung in nbersättigten Gebilden. Z. Phys. Chem. 1959, 119, 277–3013. [Google Scholar] [CrossRef]
  22. Butler, J.A.V. Studies in heterogeneous equilibria, II. The kinetic interpretation of the Nernst theory of electromotive force. Trans. Faraday Soc. 1924, 19, 729–733. [Google Scholar] [CrossRef]
  23. Butler, J.A.V. Studies in heterogeneous equilibria, I. Conditions at the boundary surface of crystalline solids and liquids, and the application of statistical mechanics. Trans. Faraday Soc. 1924, 19, 659–665. [Google Scholar] [CrossRef]
  24. Macdonald, D.D. Review of mechanistic analysis by electrochemical impedance spectroscopy. Electrochim. Acta 1990, 35, 1509–1525. [Google Scholar] [CrossRef]
  25. Almeraya-Calderón, F.; Estupiñán, F.; Zambrano, R.P.; Martínez-Villafañe, A.; Borunda, T.A.; Colás, O.R.; Gaona-Tiburcio, C. Análisis de los transitorios de ruido electroquímico para aceros inoxidables 316 y -DUPLEX 2205 en NaCl y FeCl. Rev. Metal. 2012, 4, 147–156. [Google Scholar] [CrossRef]
  26. Mehdipour, M.; Naderi, R.; Markhali, B.P. Electrochemical study of effect of the concentration of azole derivatives on corrosion behavior of stainless steel in H2SO4. Prog. Org. Coat. 2014, 77, 1761–1767. [Google Scholar] [CrossRef]
  27. Kelly, R.G.; Scully, J.R.; Shoesmith, D.W.; Buchheit, G. Electrochemical Techniques in Corrosion Science and Engineering; Taylor & Francis: Boca Raton, FL, USA, 2002; pp. 54–123. [Google Scholar]
  28. Kearns, J.R.; Eden, D.A.; Yaffe, M.R.; Fahey, J.V.; Reichert, D.L.; Silverman, D.C. ASTM Standardization of Electrochemical Noise Measurement. In Electrochemical Noise Measurement for Corrosion Applications; Kearns, J.R., Scully, J.R., Roberge, P.R., Reirchert, D.L., Dawson, L., Eds.; ASTM International, Materials Park: Russell, OH, USA, 1996; pp. 446–471. [Google Scholar]
  29. Botana, P.J.; Bárcena, M.M.; Villero, Á.A. Ruido Electroquímico: Métodos de Análisis; Septem Ediciones: Cadiz, Spain, 2002; pp. 50–70. [Google Scholar]
  30. Gaona-Tiburcio, C.; Aguilar, L.M.R.; Zambrano-Robledo, P.; Estupiñán-López, F.; Cabral-Miramontes, J.A.; Nieves-Mendoza, D.; Castillo-González, E.; Almeraya-Calderón, F. Electrochemical Noise Analysis of Nickel Based Superalloys in Acid Solutions. Int. J. Electrochem. Sci. 2014, 9, 523–533. [Google Scholar]
  31. Montoya-Rangel, M.; de Garza-Montes, O.N.; Gaona-Tiburcio, C.; Colás, R.; Cabral-Miramontes, J.; Nieves-Mendoza, D.; Maldonado-Bandala, E.; Chacón-Nava, J.; Almeraya-Calderón, F. Electrochemical Noise Measurements of Advanced High-Strength Steels in Different Solutions. Metals 2020, 10, 1232. [Google Scholar] [CrossRef]
  32. Monticelli, C. Evaluation of Corrosion Inhibitors by Electrochemical Noise Analysis. J. Electrochem. Soc. 1992, 139, 706. [Google Scholar] [CrossRef]
  33. Park, C.J.; Kwon, H.S. Electrochemical noise analysis of localized corrosion of duplex stainless steel aged at 475 °C. Mater. Chem. Phys. 2005, 91, 355–360. [Google Scholar] [CrossRef]
  34. Suresh, G.U.; Kamachi, M.S. Electrochemical Noise Analysis of Pitting Corrosion of Type 304L Stainless Steel. Corrosion 2014, 70, 283–293. [Google Scholar] [CrossRef]
  35. Cabral-Miramontes, J.A.; Barceinas-Sánchez, J.D.O.; Poblano-Salas, C.A.; Pedraza-Basulto, G.K.; Nieves-Mendoza, D.; Zambrano-Robledo, P.C.; Almeraya-Calderón, F.; Chacón-Nava, J.G. Corrosion Behavior of AISI 409Nb Stainless Steel Manufactured by Powder Metallurgy Exposed in H2SO4 and NaCl Solutions. Int. J. Electrochem. Sci. 2013, 8, 564–577. [Google Scholar]
  36. Nagiub, A.M. Electrochemical Noise Analysis for Different Green Corrosion Inhibitors for Copper Exposed to Chloride Media. Port. Electrochim. Acta 2017, 35, 201–210. [Google Scholar] [CrossRef]
  37. Nakasa, K.; Satoh, H. The effect of hydrogen-charging on the fatigue crack propagation behavior of β-titanium alloys. Corros. Sci. 1996, 38, 457–468. [Google Scholar] [CrossRef]
  38. Dawson, D.L. Electrochemical Noise Measurement: The definitive In-Situ Technique for Corrosion Applications? In Electrochemical Noise Measurement for Corrosion Applications STP 1277; Kearns, J.R., Scully, J.R., Roberge, P.R., Reirchert, D.L., Dawson, L., Eds.; ASTM International, Materials Park: Russell, OH, USA, 1996; pp. 3–39. [Google Scholar]
  39. Cottis, R.; Turgoose, S.; Mendoza-Flores, J. The Effects of Solution Resistance on Electrochemical Noise Resistance Measurements: A Theorical Analysis. In Electrochemical Noise Measurement for Corrosion Applications STP 1277; Kearns, J.R., Scully, J.R., Roberge, P.R., Reirchert, D.L., Dawson, L., Eds.; ASTM International, Materials Park: Russell, OH, USA, 1996; pp. 93–100. [Google Scholar]
  40. Brockwell, P.J.; Davis, R.A. Introduction to Time Series and Forecasting, 3rd ed.; Springer: Zürich, Switzerland, 2002; pp. 1–68. [Google Scholar]
  41. Homborg, A.M.; Tinga, T.; Zhang, X.; Van Westing, E.P.M.; Ferrari, G.M.; Wit, J.H.W.; Mol, J.M.W. A Critical Appraisal of the Interpretation of Electrochemical Noise for Corrosion Studies. Corrosion 2017, 70, 971–987. [Google Scholar] [CrossRef]
  42. Oliveira, N.T.C.; Guastaldi, A.C. Electrochemical stability and corrosion resistance of Ti-Mo alloys for biomedical applications. Acta Biomater. 2009, 5, 399–405. [Google Scholar] [CrossRef]
  43. Du, X.; Yang, Q.S.; Chen, Y.; Zhang, X.Z. Galvanic Corrosion behavior of copper/titanium galvanic couple in artificial seawater. Trans. Nonferrous Met. Soc. China 2014, 24, 570–581. [Google Scholar] [CrossRef]
  44. Vacandio, F.; Fraoucene, H.; Sugiawati, V.A.; Eyraud, M.; Hatem, D.; Belkaid, M.S.; Pasquinelli, M.; Djenizian, T. Optical and Electrochemical Properties of Self-Organized TiO2 Nanotube Arrays from Ti-6Al-4V Alloy. Front. Chem. 2019, 7, 66–83. [Google Scholar] [CrossRef] [Green Version]
  45. Huang, W.; Wang, Z.; Liu, C.; Yu, Y. Wear and Electrochemical Corrosion Behavior of Biomedical Ti-5Nb-3Mo-3Zr-2Sn Alloy in Simulated Physiological Solutions. J. Bio. Tribo. Corros. 2015, 1, 1–10. [Google Scholar] [CrossRef] [Green Version]
  46. Zhou, L.; Yuan, T.; Tang, J.; He, J.; Li, R. Mechanical and corrosion behavior of titanium alloys additively manufactured by selective laser melting—A comparison between nearly β titanium, α titanium and α+β titanium. Opt. Laser Technol. 2019, 119, 105625. [Google Scholar] [CrossRef]
  47. Dubent, S.; Mazard, A. Characterization and corrosion behaviour of grade 2 titanium used in electrolyzers for hydrogen production. Int. J. Hydrog. Energy 2019, 44, 15622–15633. [Google Scholar] [CrossRef]
  48. ASTM E3-95. Standard Practice for Preparation of Metallographic Specimens; ASTM International: West Conshohocken, PA, USA, 1995. [Google Scholar]
  49. ASTM E407-07. Standard Practice for Microetching Metals and Alloys; ASTM International: West Conshohocken, PA, USA, 2011. [Google Scholar]
  50. ASTM G199-09. Standard Guide for Electrochemical Noise Measurement; ASTM International: West Conshohocken, PA, USA, 2009. [Google Scholar]
  51. Estupiñán-López, H.F.; Almeraya-Calderón, F.; Bautista Margulis, G.R.; Baltazar Zamora, M.A.; Martínez-Villafañe, A.; Uruchurtu, C.J.; Gaona-Tiburcio, C. Transient Analysis of Electrochemical Noise for 316 and Duplex 2205 Stainless Steels Under Pitting Corrosion. Int. J. Electrochem. Sci. 2011, 6, 1785–1796. [Google Scholar]
  52. Liu, X.; Zhang, T.; Shao, Y.; Meng, G.; Wang, F. In-situ study of the formation process of stannate conversion coatings on AZ91D magnesium alloy using electrochemical noise. Corros. Sci. 2010, 52, 892–900. [Google Scholar] [CrossRef]
  53. Seifzadeh, D.; Basharnavaz, H.; Bezaatpour, A. A Schiff base compound as effective corrosion inhibitor for magnesium in acidic media. Mater. Chem. Phys. 2013, 138, 794–802. [Google Scholar] [CrossRef]
  54. Eden, D.A.; John, D.G.; Dawson, J.L. Corrosion Monitoring. WO87/07022, 19 November 1987. [Google Scholar]
  55. Mansfeld, F.; Sun, Z. Technical Note: Localization Index Obtained from Electrochemical Noise Analysis. Corrosion 1999, 55, 915–918. [Google Scholar] [CrossRef]
  56. Reid, S.A.; Eden, D.A. Assessment of Corrosion. US9264824B1, 24 July 2001. [Google Scholar]
  57. Cottis, R. Interpretation of Electrochemical Noise Data. Corrosion 2001, 57, 265–285. [Google Scholar] [CrossRef]
  58. Eden, D.A. Electrochemical Noise—The First Two Octaves. In NACE International Corrosion/98; NACE International: San Diego, FL, USA, 1998; pp. 1–31. [Google Scholar]
  59. Coakley, J.; Vorontsov, V.A.; Littlell, K.C.; Heenan, R.K.; Ohnuma, G.; Jones, N.G.; Dye, D. Nanoprecipitation in a beta-titanium alloy. J. Alloy. Compd. 2015, 623, 146. [Google Scholar] [CrossRef] [Green Version]
  60. Bertocci, U.; Huet, F. Noise Analysis Applied to Electrochemical Systems. Corrosion 1995, 51, 131–144. [Google Scholar] [CrossRef]
  61. Lee, C.C.; Mansfeld, F. Analysis of electrochemical noise data for a passive system in the frequency domain. Corr. Sci. 1998, 40, 959–962. [Google Scholar] [CrossRef]
  62. Legat, A.; Dolecek, V. Corrosion Monitoring System Based on Measurement and Analysis of electrochemical Noise. Corrosion 1995, 51, 295–300. [Google Scholar] [CrossRef]
  63. Homborg, A.M.; Cottis, R.A.; Mol, J.M.C. An integrated approach in the time, frequency and time-frequency domain for the identification of corrosion using electrochemical noise. Electrochim. Acta 2016, 222, 627–640. [Google Scholar] [CrossRef]
  64. Uruchurtu, J.C.; Dawson, J.L. Noise Analysis of Pure Aluminum under Different Pitting Conditions. Corrosion 1987, 43, 19–26. [Google Scholar] [CrossRef]
  65. Lentka, L.; Smulko, J. Methods of trend removal in electrochemical noise data-overview. Measurement 2019, 131, 569–581. [Google Scholar] [CrossRef]
  66. Cai, C.; Zhang, Z.; Cao, F.; Gao, Z.; Zhang, J.; Cao, C. Analysis of pitting corrosion behavior of pure Al in sodium chloride solution with the wavelet technique. J. Electroanal. Chem. 2006, 578, 143–150. [Google Scholar] [CrossRef]
  67. Zhao, B.; Li, J.H.; Hu, R.G.; Du, R.G.; Lin, C.J. Study on the corrosion behavior of reinforcing steel in cement mortar by electrochemical noise measurements. Electrochim. Acta 2007, 52, 3976–3984. [Google Scholar] [CrossRef]
  68. Huang, N.E.; Shen, Z.; Long, Z.R.; Wu, M.C.; Shih, H.H.; Zheng, Q.; Yen, N.C.; Tung, C.C.; Liu, H.H. The empirical mode decomposition and the Hilbert spectrum for nonlinear and non-stationary time series analysis. Proc. R. Soc. 1998, 454, 903–995. [Google Scholar] [CrossRef]
  69. Lafront, A.M.; Safizadeha, F.; Ghali, E.; Houlachi, G. Study of the cupper anode passivation by electrochemical noise analysis using spectral and wavelet transform. Electrochim. Acta. 2010, 55, 2505–2512. [Google Scholar] [CrossRef]
  70. Froes, F.; Quian, M.; Niinomi, M. Titanium for Consumer Applications. Real World Use of Titanium; Elsevier Inc.: Amsterdam, The Netherlands, 2019; pp. 27–65. [Google Scholar] [CrossRef]
  71. Seah, K.H.W.; Thampuran, R.; Teoh, S.H. The influence of pore morphology on corrosion. Corros. Sci. 1998, 40, 547–556. [Google Scholar] [CrossRef]
  72. Adamek, G.; Pałka, K.; Jakubowicz, J. Corrosion properties of Ti scaffolds prepared with sucrose as a space holder. Solid State Phenom. 2015, 227, 519–522. [Google Scholar] [CrossRef]
  73. Dabrowski, B.; Kaminski, J.; Swieszkowski, W.; Kurzydlowski, K.J. Porous titanium scaffolds for biomedical applications: Corrosion resistance and structure investigation. Mater. Sci. Forum 2011, 674, 41–46. [Google Scholar] [CrossRef]
  74. Chen, X.; Fu, Q.; Jin, Y.; Li, M.; Yang, R.; Cui, X.; Gong, M. In vitro studying corrosion behavior of porous titanium coating in dynamic electrolyte. Mater. Sci. Eng. C 2017, 70, 1071–1075. [Google Scholar] [CrossRef]
  75. Lohrberg, K.; Kohl, P. Preparation and use of Raney-Ni activated cathodes for large scale hydrogen production. Electrochem. Acta 1984, 29, 1557–1561. [Google Scholar] [CrossRef]
  76. Huet, F.; Musiani, M.; Nogueira, P. Oxygen evolution on electrodes of different roughness an electrochemical noise study. J. Solid State Electrochem. 2004, 786–793. [Google Scholar] [CrossRef]
  77. Hai, L.; Guo-Quiang, X.; Pan, Z.; Hua-Sen, Z.; Khan, M.Y. The Hilbert-Huang Transform-Based Denoising Method for the TEM Response of a PRBS Source Signal. Pure App. Geophys. 2016, 173, 2777–2789. [Google Scholar] [CrossRef]
  78. Homborg, A.M.; Oonincx, P.J.; Mol, J.M.C. Wavelet Transform Modulos Maxima and Holder Exponents Combined with Transient Detection for the Differentiation of Pitting Corrosion Using Electrochemical Noise. Corrosion 2018, 48, 1001–1010. [Google Scholar] [CrossRef] [Green Version]
  79. Runa, M.J.; Mathew, M.T.; Rocha, L.A. Tribocorrosion response of the Ti6Al4V alloys commonly used in femoral stems. Tribol. Int. 2013, 68, 85–93. [Google Scholar] [CrossRef]
  80. Toptan, F.; Rego, A.; Alvces, A.C.; Guedes, A. Corrosion and tribocorrosion behavior of Ti-B4C composite intended for orthopaedic implants. J. Mech. Behav. Biomed. 2016, 61, 152–163. [Google Scholar] [CrossRef]
  81. Joshi, V.A. Titanium Alloys: An Atlas of Structures and Fracture Features; Joshi, V.A., Ed.; CRC Press, Taylor & Francis Group: Boca Raton, FL, USA, 2006; pp. 97–140. [Google Scholar]
  82. Benavides, S. Corrosion Control in the Aerospace Industry, 1st ed.; Benavides, S., Ed.; Woodhead Publishing: Boca Raton, FL, USA, 2009; pp. 210–250. [Google Scholar]
  83. Alves, A.C.; Wenger, F.; Ponthiaux, P.; Celis, J.P.; Pinto, A.M.; Rocha, L.A.; Fernandes, J.C.S. Corrosion mechanisms in titanium oxide-based films produced by anodic treatment. Electrochim. Acta 2017, 234, 16–27. [Google Scholar] [CrossRef]
  84. Kuphasuk, C.; Oshida, Y.; Andres, C.J.; Hovijitra, S.T.; Barco, M.T.; Brown, D.T. Electrochemical corrosion of titanium and titanium-based alloys. J. Prosthet. Dent. 2001, 85, 195–202. [Google Scholar] [CrossRef]
  85. Jiang, Z.; Dai, X.; Middleton, H. Effect of silicon on corrosion resistance of Ti-Si alloys. Mater. Sci. Eng. B 2011, 176, 79–86. [Google Scholar] [CrossRef]
  86. Escriva-Cerdán, C.; Blasco-Tamarit, E.; García-García, D.M.; Akid, R.; Walton, J. Effect of temperature on passive film formation of UNS N08031 Cr-Ni alloy in phosphoric acid contaminated with different aggressive anions. Electrochem. Acta 2013, 111, 552–561. [Google Scholar] [CrossRef]
  87. Liu, C.; Leyland, A.; Bi, Q.; Matthews, A. Corrosion resistance of multi-layerded plasma-assisted physical vapour deposition TiN and CrN coatings. Surf. Coat. Technol. 2001, 141, 164–173. [Google Scholar] [CrossRef]
  88. Balla, A.; Marcu, C.; Axante, D.; Borodi, G.; Lazar, D. Catalytic reduction of sulfuric acid to sulfur dioxide. Cent. Eur. J. Chem. 2012, 10, 1817–1823. [Google Scholar] [CrossRef] [Green Version]
  89. Yang, X.; Dong, X.; Li, W.; Feng, W.; Xu, Y. Effect of solution and aging treatments on corrosion performance of laser solid formed Ti-6Al-4V alloy in a 3.5 wt. % NaCl solution. J. Mater. Res. Technol. 2020, 9, 1559–1568. [Google Scholar] [CrossRef]
  90. Ikumapayi, O.M.; Akinlabi, E.T. Efficacy of α-β grade titanium alloy powder (Ti-6Al-2Sn-2Zr-2Mo-2Cr-0.25Si). Mater. Res. Express 2019, 6, 2053–2063. [Google Scholar] [CrossRef]
  91. Nabhani, M.; Razavi, R.S.; Barekat, M. Corrosion study of laser cladded Ti-6Al-4V alloy in different corrosive environments. Eng. Fail. Anal. 2019, 97, 234–241. [Google Scholar] [CrossRef]
  92. Wang, Z.B.; Hu, H.X.; Zheng, Y.G. Synergistic effects of fluoride and chloride on general corrosion behavior of AISI 316 stainless steel and pure titanium in H2SO4 solutions. Corros. Sci. 2018, 130, 203–217. [Google Scholar] [CrossRef]
  93. Engelkamp, B.; Fischer, B.; Schierbaum, K. Plasma Electrolytic Oxidation of Titanium in H2SO4-H3PO4 Mixtures. Coatings 2020, 10, 116. [Google Scholar] [CrossRef] [Green Version]
  94. Prando, D.; Nicolis, D.; Pedeferri, M.; Ormellese, M. Pitting corrosion on anodized titanium: Effect of halades. Mater. Corros. 2018, 69, 1–6. [Google Scholar] [CrossRef]
  95. Fattah-Alhosseini, A.; Attarzadeh, F.R.; Vakili-Azghandi, M. Effect of Multi-pass Friction Stir processing on the Electrochemical and Corrosion Behavior of Pure Titanium in Strongly Acidic Solutions. Metall. Mater. Trans. A 2017, 48, 403–411. [Google Scholar] [CrossRef]
  96. Beck, T.R.; Blackburn, M.J. Stress corrosion cracking of titanium alloys. AIAA J. 1968, 6, 326–332. [Google Scholar] [CrossRef]
  97. Gao, K.W.; Chu, W.Y.; Gu, B.; Zhang, T.C.; Qiao, L.J. In-Situ Transmission Electron Microscopic Observation of Corrosion Enhanced Dislocation Emission and Crack Initiation of Stress Corrosion. Corrosion 2000, 56, 515–522. [Google Scholar] [CrossRef]
  98. Al-Mazeedi, H.A.A.; Cottis, R.A. A practical evolution of electrochemical noise parameters as indicators of corrosion type. Electrochim. Acta 2004, 49, 2787–2793. [Google Scholar] [CrossRef]
  99. Sanchez-Amaya, J.M.; Cottis, R.A.; Botana, F.J. Shot noise and statistical parameters to estimation of corrosion mechanisms. Corros. Sci. 2005, 47, 3280–3299. [Google Scholar] [CrossRef]
  100. Eden, D.A.; Meng, Q.J.; Mendez, M.; Yunovich, M. Electrochemical Noise. In Uhlig’s Corrosion Handbook, 1st ed.; Revie, R.W., Ed.; John Wiley & Son: New York, NY, USA, 2011. [Google Scholar]
  101. Contreras, A.; Salazar, M.; Carmona, A.; Galván-Martínez, R. Electrochemical Noise for Detection of Stress Corrosion Cracking of Low Carbon Steel Exposed to Synthetic Soil Solution. Mater. Res. 2017, 20, 1–10. [Google Scholar] [CrossRef] [Green Version]
  102. Pellegrini-Cervantes, M.J.; Almeraya-Calderon, F.; Borunda-Terrazas, A.; Bautista-Margulis, R.G.; Chacón-Nava, J.G.; Fajardo-San-Miguel, G.; Almaral-Sanchez, J.L.; Barrios-Durstewitz, C.; Martinez-Villafañe, A. Corrosion Resistance, Porosity and Strength of lended Portland Cement Mortar Containing Rice Husk Ash And Nano-SiO2. Int. J. Electrochem. Sci. 2013, 8, 10697–10710. [Google Scholar]
  103. Nagiub, A.; Mansfeld, F.; Sun, Z.; Hsu, C.H. Concerning trend removal in electrochemical noise measurements. Corros. Sci. 2001, 43, 341–352. [Google Scholar] [CrossRef]
  104. Arellano-Pérez, H.; Escobar-Jiménez, R.F.; Granados-Lieberman, F.; Gómez-Aguilar, J.F.; Uruchurtu-Chavarrín, J.; Alvarado-Martínez, V.M. Electrochemical noise signals evaluation to classify the type of corrosion using synchrosqueezing transform. J. Electroanal. Chem. 2019, 848, 113249. [Google Scholar] [CrossRef]
  105. Reid, S.; Bell, G.E.C.; Edgemon, G.L. The use of skewness, kurtosis and neural networks for determining mechanism from electrochemical noise data. In Corrosion/98; NACE International: San Diego, FL, USA, 22–27 March 1998; p. 176. [Google Scholar]
  106. Nazarnezhad-Bajastani, M.; Neshti, J.; Hossein Siadati, M. Determination of SS321 pitting stage in FeCl3 solution based on electrochemical noise measurement data using artificial neural network. J. Electroanal. Chem. 2019, 845, 31. [Google Scholar] [CrossRef]
  107. Cui, J.; Yu, D.; Long, Z.; Xi, B.; He, X.; Pei, Y. Application of electrochemical noise (EN) technology to evaluate the passivation performance of adsorption and film-forming type corrosion inhibitors. J. Electroanal. Chem. 2019, 855, 113584. [Google Scholar] [CrossRef]
  108. Li, J.; Du, C.W.; Liu, Z.Y.; Li, X.G.; Liu, M. Effect of microstructure on the corrosion resistance of 2205 duplex stainless steel. Part 2: Electrochemical noise analysis of corrosion behaviors of different microstructures based on wavelet transform. Constr. Build. Mater. 2018, 189, 1294–1302. [Google Scholar] [CrossRef]
  109. Lara-Banda, M.; Gaona-Tiburcio, C.; Zambrano-Robledo, P.; Delgado-E, M.; Cabral-Miramontes, J.A.; Nieves-Mendoza, D.; Maldonado-Bandala, E.; Estupiñan-López, F.; Chacón-Nava, J.G.; Almeraya-Calderón, F. Alternative to Nitric Acid Passivation of 15-5 and 17-4PH Stainless Steel Using Electrochemical Techniques. Materials 2020, 13, 2836. [Google Scholar] [CrossRef]
  110. Corral-Higuera, R.; Arredondo-Rea, P.; Neri-Flores, M.A.; Gómez-Soberón, J.M.; Almaral-Sánchez, J.L.; Castorena-González, J.C.; Almeraya-Calderón, F. Chloride ion penetrability and Corrosion Behavior of Steel in Concrete with Sustainability Characteristics. Int. J. Electrochem. Sci. 2011, 6, 958–970. [Google Scholar]
  111. Moshrefi, R.; Mahjani, M.G.; Jafarian, M. Application of wavelet entropy in analysis of electrochemical noise for corrosion type identification. Electrochem. Commun. 2014, 48, 49–51. [Google Scholar] [CrossRef]
  112. Smith, M.T.; Macdonald, D.D. Wavelet Analysis of Electrochemical Noise Data. Corrosion 2009, 438–448. [Google Scholar] [CrossRef]
  113. Liu, L.; Li, Y.; Wang, F. Pitting mechanism on an austenite stainless steel nanocrystalline coating investigated by electrochemical noise and in-situ AFM analysis. Electrochim. Acta 2008, 54, 768–780. [Google Scholar] [CrossRef]
  114. Asfia, M.P.; Rezail, M.; Bahlakeh, K. Corrosion prevention of AISI 304 stainless steel in hydrochloric acid medium using garli extrac as a green corrosion inhibitor: Electrochemical and theorical studies. J. Mol. Liq. 2020, 315, 113679. [Google Scholar] [CrossRef]
  115. Shahidi, M.; Hosseini, S.M.A.; Jafari, A.H. Comparison between ED and SDPS plots as the results of wavelet transform for analyzing electrochemical noise data. Electrochim Acta 2011, 56, 9986–9997. [Google Scholar] [CrossRef]
  116. Bajestani, M.Z.; Neshati, J.; Siadati, M.H. Development of Time-Frequency Analysis in Electrochemical Noise for Detection of Pitting Corrosion. Corrosion 2019, 75, 183–191. [Google Scholar] [CrossRef]
  117. Zhao, Y.; Wang, X.; Huang, J.C.; Chen, X.; Cao, L.; Mu, M. Affection of Cu content on the phase evolution during the dealloying of Ag-Cu alloys using electrochemical noise with Hilbert spectra analysis. Mater. Lett. 2016, 183, 165–169. [Google Scholar] [CrossRef]
  118. Homborg, A.M.; Morales, C.F.L.; Tinga, T.; de Wit, J.H.W.; Mol, J.M.C. Dection of microbiologically influenced corrosion by electrochemical transients. Electrochim. Acta 2014, 136, 223–232. [Google Scholar] [CrossRef]
  119. Zhao, Y.; Zhou, E.; Xu, D.; Yang, Y.; Zhao, Y.; Zhang, Y.; Gu, T.; Yang, K.; Wang, F. Laboratory investigation of microbiologically influenced corrosion of 2205 duplex stainless steel by marine pseudomonas aeruginosa biofilm using electrochemical noise. Corrosion 2018, 143, 281–291. [Google Scholar] [CrossRef]
  120. Chui, C.K. An Introduction to Wavelets, 1st ed.; Chui, C.K., Ed.; Academic Press: San Diego, CA, USA, 1992; pp. 49–74. [Google Scholar]
Figure 1. OM and SEM micrographs of titanium alloys (initial conditions): (a,d) CP2, (b,e) Ti-6Al-2Sn-4Zr-2Mo, (c,f) Ti-6Al-4V.
Metals 11 00105 g001
Figure 2. Time series electrochemical noise (EN) data: (a) electrochemical potential noise (EPN) and (b) electrochemical current noise (ECN) in 3.5 wt. % NaCl solution.
Metals 11 00105 g002
Figure 3. Time series EN data: (a) EPN and (b) ECN, in 3.5 wt. % H2SO4 solution.
Metals 11 00105 g003
Figure 4. Potential spectral density (PSD) in current for (a) NaCl and (b) H2SO4.
Metals 11 00105 g004
Figure 5. Energy dispersion plot for (a) NaCl and (b) H2SO4.
Metals 11 00105 g005
Figure 6. The Hilbert spectra of Ti alloys for ECN data in 3.5 wt. % NaCl solution. (a) Ti CP2 (b) Ti-6Al-2Sn-4Zr-2Mo (c) Ti-6Al-4V.
Metals 11 00105 g006
Figure 7. The Hilbert spectra of Ti-alloys for ECN data in 3.5 wt. % H2SO4 solution. (a) Ti CP2 (b) Ti-6Al-2Sn-4Zr-2Mo (c) Ti-6Al-4V.
Metals 11 00105 g007
Figure 8. SEM-EDS surface morphology micrographs of Ti CP2 alloys in (a) NaCl and (c) H2SO4 solution; the rectangles show the areas where EDS analysis was performed for each image; (b) NaCl and (d,e) H2SO4.
Metals 11 00105 g008
Figure 9. SEM-EDS surface morphology micrographs of Ti-6Al-2Sn-4Zr-2Mo alloys in (a) NaCl and (c) H2SO4 solution; the rectangles show the areas where EDS analysis was performed for each image. (b) NaCl and (d,e) H2SO4.
Metals 11 00105 g009
Figure 10. SEM-EDS surface morphology micrographs of Ti-6Al-4Valloys in (a) NaCl and (c) H2SO4 solution and H2SO4 solution; the rectangles show the areas where EDS analysis was performed for each image; (b) NaCl and (d,e) H2SO4.
Metals 11 00105 g010
Table 1. Chemical Composition of the used Titanium alloys (wt. %).
Titanium AlloyTiAlVZrMoSnFe
Ti CP299.94 ± 0.005-----0.038 ± 0.005
Ti-6Al-2Sn-4Zr-2Mo84.65 ± 0.196.75 ± 0.20-4.18 ± 0.011.99 ± 0.0082.08 ± 0.01-
Ti-6Al-4V87.71 ± O.367.14 ± 0.374.03 ± 0.08---0.21 ± 0.01
Table 2. Corrosion types evaluated by kurtosis and skewness [56].
Corrosion TypePotentialCurrent
Skewness KurtosisSkewness Kurtosis
Uniform<±1<3<±1<3
Pitting<−2>>3>±2>>3
Transgranular (SCC)420−420
Intergranular (SCC #1)−6.618 to 1141.5 to 3.26.4 to 15.6
Intergranular (SCC #2)−2 to −65 to 453 to 610 to 60
Table 3. EN statistical parameters from different alloys and electrolytes.
AlloysElectrolyteRn (Ω·cm2)icorr (mA/cm2)SkewnessCorrosion TypeKurtosisCorrosion Type
Ti CP2NaCl515035.05 × 10−4 −0.8Uniform33pitting
H2SO4117842.21 × 10−4 −0.1Uniform5pitting
Ti-6Al-2Sn-4Zr-2MoNaCl451235.76 × 10−4 3.5Localized29pitting
H2SO42389431.09 × 10−41.1Localized8pitting
Ti-6Al-4VNaCl256431.01 × 10−3 2.6Localized35pitting
H2SO4585644.44 × 10−41.2Localized5pitting
Table 4. β intervals to indicate the type of corrosion [62].
Corrosion TypedB(V)·Decade−1dB(A)·Decade−1
MinimumMaximumMinimumMaximum
Uniform0−70−7
Pitting−20−25−7−14
Passive−15−25−11
Table 5. Parameters obtained by PSD.
AlloysΨ0 (dBi)Β (dB [A])
NaCl
Ti CP2−122.29−12
Ti-6Al-2Sn-4Zr-2Mo−138.49−20
Ti-6Al-4V−121.13−15
H2SO4
Ti CP2−104.95−18
Ti-6Al-2Sn-4Zr-2Mo−134.93−8
Ti-6Al-4V−128.54−15
Table 6. Ranges of scale of each crystal.
Crystal (D)Scale (s)Scale (Hz)
11–21–0.5
22–40.5–0.25
34–80.25–0.125
48–160.125–0.0625
516–320.0625–0.3125
632–640.03125–0.015625
764–1280.015625–0.00781
8128–2560.00781–0.00390
Publisher’s Note: MDPI stays neutral with regard to jurisdictional claims in published maps and institutional affiliations.

