Article

Effect of Trace Mg on Impact Toughness of 2.25Cr1Mo Steel Doped with 0.056% P at Medium Temperature Aging Process

1
School of Materials and Engineering, Shenyang University of Technology, Shenyang 110870, China
2
Institute of Metal Research, Chinese Academy of Sciences, Shenyang 110016, China
3
CAS Key Laboratory of Nuclear Materials and Safety Assessment, Institute of Metal Research (NMSA), Shenyang 110014, China
4
Shi-Changxu Innovation Center for Advanced Materials, Institute of Metal Research, Shenyang 110016, China
*
Authors to whom correspondence should be addressed.
Metals 2021, 11(1), 10; https://doi.org/10.3390/met11010010
Submission received: 26 November 2020 / Revised: 18 December 2020 / Accepted: 18 December 2020 / Published: 23 December 2020

Abstract

:
In order to investigate the effect of Mg addition on the embrittlement of Cr-Mo steels, the 2.25Cr1Mo steel plates containing Mg, P contents were refined with vacuum induction furnace and rolled with double-stick reversible rolling mill. The impact toughness evolution and microstructural characteristics of these steels after aging at 580 °C for up to 5000 h were systematically investigated. The grain boundary segregation behaviors of P, S, and Mg before and after aging were analyzed with auger electron spectroscopy (AES), and the microstructure characteristics of the steels were detected with optical electron microscope (OM) and transmission electron microscope (TEM). The research results show Mg addition can improve the impact toughness of the 2.25Cr1Mo steel to a certain extent even with 0.056 wt.% P doping. It was clarified that Mg can segregate to grain boundary during the aging process, and its strong segregation tendency can reduce the grain boundary segregation of P to some degree. The effects of Mg on the impact toughness after subjecting to 580 °C ageing, including element segregation behaviors at grain boundary, ferrite formation, prior austenite grain characteristics, and carbides at grain boundary were also identified and discussed.

1. Introduction

2.25Cr1Mo steel is a typical steel for pressure vessels, which is widely used in power and petrochemical industries. This steel is a low-alloy structural steel with chromium and molybdenum as the main alloying elements. The addition of chromium can improve alloy strength but may increase the risk of temper embrittlement at the same time. Molybdenum can restrain the segregation of impurity elements to grain boundary but also improve temper embrittlement to some degree. This means the combination of these two elements makes the Cr–Mo steel a typical medium temperature steel. Recently, the 2.25Cr1Mo steel was chosen as the main structural material of steam generator of the advanced fourth-generation sodium-cooled fast reactor in China [1,2]. However, the service temperature of the steam generator is in the range of 500–600 °C, which is a sensitive temperature for temper embrittlement, and also its service period is as high as 40 years, which hence brings a severe challenge to 2.25Cr1Mo steel.
It is well known that temper embrittlement is mainly induced by grain boundary segregation of impurity elements like phosphorus, tin, antimony, arsenic, and sulfur, leading to a decrease in grain boundary cohesion when the low-alloy steels such as chromium–manganese, chromium–nickel, and chromium–nickel–molybdenum steels are in service at medium temperature (450–650 °C) [3,4]. Among these embrittling impurities, phosphorus is a major one as it always exists in some level [4,5,6]. For example, Wang et al. [7], Shen et al. [8], and Liu [9] all reported that the grain boundary segregation of P can obviously increase the ductile–brittle transition temperature (DBTT) of the materials, i.e., a greater amount of P segregation at grain boundary always results in a higher ductile–brittle transition temperature. Recently, Zhao et al. [10] discovered both strength (corresponding to prior austenite grain size) and P boundary segregation will influence the embrittlement of 2.25Cr-1Mo steel, and they found that the combined effect of these two factors can be described as FATT (°C) = 0.25σs + 2.64Cp − 270, where σs is the yield strength in MPa, and CP is the grain boundary concentration of P in at.%. This further claims the segregation of P at grain boundary is the main reason to trigger temper embrittlement of these steels, i.e., the effect of grain boundary P concentration is almost 11 times the yield strength based on the above equation.
Heretofore, particular attentions have been paid to explore the methods to suppress the embrittlement induced by grain boundary segregation of P. For instance, McMahon et al. [11] found P-induced (0.02%) temper embrittlement can be eliminated by the Mo–P interaction, which can effectively make P atoms immobilize rather than segregate. Whereas they also pointed out the embrittlement can still be observed in high P steel (0.06%). In such steel, Mo is more likely to form carbide other than prevent P from segregating to grain boundary. Qu et al. [12] and Janovec et al. [13] discovered the embrittlement can be mitigated by V addition because it has a stronger affinity to C than that of Mo in α-Fe, but this is still difficult to avoid embrittlement occurrence. Song et al. [14] and Hong et al. [15] reported that B preferentially located on grain boundaries, which reduced the possible grain boundary segregation sites of P. Wu et al. [16] discovered the temper embrittlement susceptibility of medium carbon CrNi3Mo steel could be improved by alloying with Ce, and the main reason was the Ce–P compound formation as well as the segregation of Ce at grain boundary. The effect of Ce segregation was also elaborated by Jiang et al. [17], who found that Ce can segregate to grain boundary and increase the grain boundary cohesion, toughening the steel. In general, the positive effects of alloying elements on impurity induced temper embrittlement can be ascribed to two types, i.e., one is to immobilize impurities to prevent them segregating to grain boundary, and the other type is to segregate at grain boundary by itself first to hinder other impurities segregation.
Similarity to Ce and B, Mg has been considered a grain boundary segregation element in nickel-based alloys [18]; however, its segregation behavior in α-Fe is still not known. Thus, in this research object, impact toughness evolution of 2.25Cr1Mo steel and 2.25Cr1Mo steel with Mg content addition during middle temperature aging process (580 °C) was studied. The effects of Mg on the microstructures in 2.25Cr1Mo steel, including the element GB segregation behavior, primary austenite grain, and carbide precipitation at GB were also identified and discussed.

2. Materials and Methods

The experimental steels were prepared with vacuum induction melting, Mg was added through Ni–4.5%Mg. The chemical compositions of the experimental steels are listed in Table 1, where S1, S2 represent benchmark steel and Mg-treated steel, respectively. It can be seen from Table 1 that the O content in S2 is only 0.0003%, so the content of MgO should be very low. The ingots were forged into billets (100 mm × 60 mm × 460 mm), after that, all the billets were reheated to 1100 °C and held for 60 min, then hot rolled into approximately 15-mm thick plates. The steel plates were austenitized at 930 °C for 30 min and then air cooling, followed by tempering for 2 h at 725 °C to attain a unified microstructure. These specimens were treated with aging at 580 °C for 97 h, 500 h, 2011 h, and 5000 h in muffle furnace (Shenyang Reyan Industrial Furnace Factory, Shenyang, China) and then cooled in air to room temperature.
According to GB/T 229 2007, the Charpy impact specimens with the size of 10 mm × 10 mm × 55 mm (V-notch) were prepared from the aged samples along the vertical rolling direction, and then tested on ZBC2452-C pendulum impact test machine (SANS, Shenzhen, China). The value of each impact energy was taken from the average of three parallel samples. The impact fracture morphology of the specimens after cleaning were performed with a FEI Quanta 450 scanning electron microscope (SEM, FEI, Washington D.C, USA). We calculated proportion of crack-initiated area of three groups of parallel specimens’ fractures, that is, six fracture regions, using Image-Pro-Plus (IPP) 6.0 (Media Cybernetics, MD, USA) to obtain the average value. The microstructures were characterized by the Axio observer Z1m optical electron microscope (OM, Zeiss, Oberkochen, Germany). The OM specimens were etched by 4% nitric acid alcohol, the volume fraction of the ferrite phase was analyzed based on the generally morphology of different phases using IPP 6.0, and six fields of view were selected for calculation to obtain the average value. The Vickers hardness was also conducted on each aged specimen to shed light on the microstructure difference using an MICROMET-5103 Vickers hardness tester (Akashi corporation, Tokyo, Japan). The test load was 500 g, loading time was 10 s, and ten measurements were taken and the average value was used as the final result. The morphology and distribution of the precipitated phases in samples were performed with the JEM-2100F transmission electron microscope (TEM, Electronics Corporation, Tokyo, Japan). At the same time, the carbide composition was analyzed by TEM equipped with energy dispersive spectroscopy (EDS). For this purpose, specimens of 0.5 mm in thickness were cut and manually grinded from both sides to 50μm, followed by electrolytical thinning in 10% perchloric acid at 18 V and −25 °C using a Tenupol-5 from Struers. In order to characterize the primary austenite grain size for the heat-treated condition, the samples were solution treated at 930 °C for 30 min, and then quenched in iced water. The supersaturated picric acid added with Seagull brand shampoo was selected as the corrosive liquid, and the temperature of the water bath furnace was controlled to 45 °C for corrosion.
To reveal the grain boundary segregation behavior of elements in the steel during aging, Auger electron spectroscopy (AES) was employed, using a PHI-700 Auger spectrometer in Tsinghua University. The standard AES specimens (Figure 1) were prepared from the aging samples. The specimens were maintained in liquid nitrogen in the AES chamber for approximately 60 min and then immediately fractured along AES specimens notch by impact to obtain intergranular fracture for subsequent AES analysis. All spectra were recorded in the differential mode dN(E)/dE. About 10 grain boundaries were measured for each sample in order to obtain the average value.

3. Results

3.1. Influence of Mg on the Impact Energy Evolution after Subjected to Aging Process

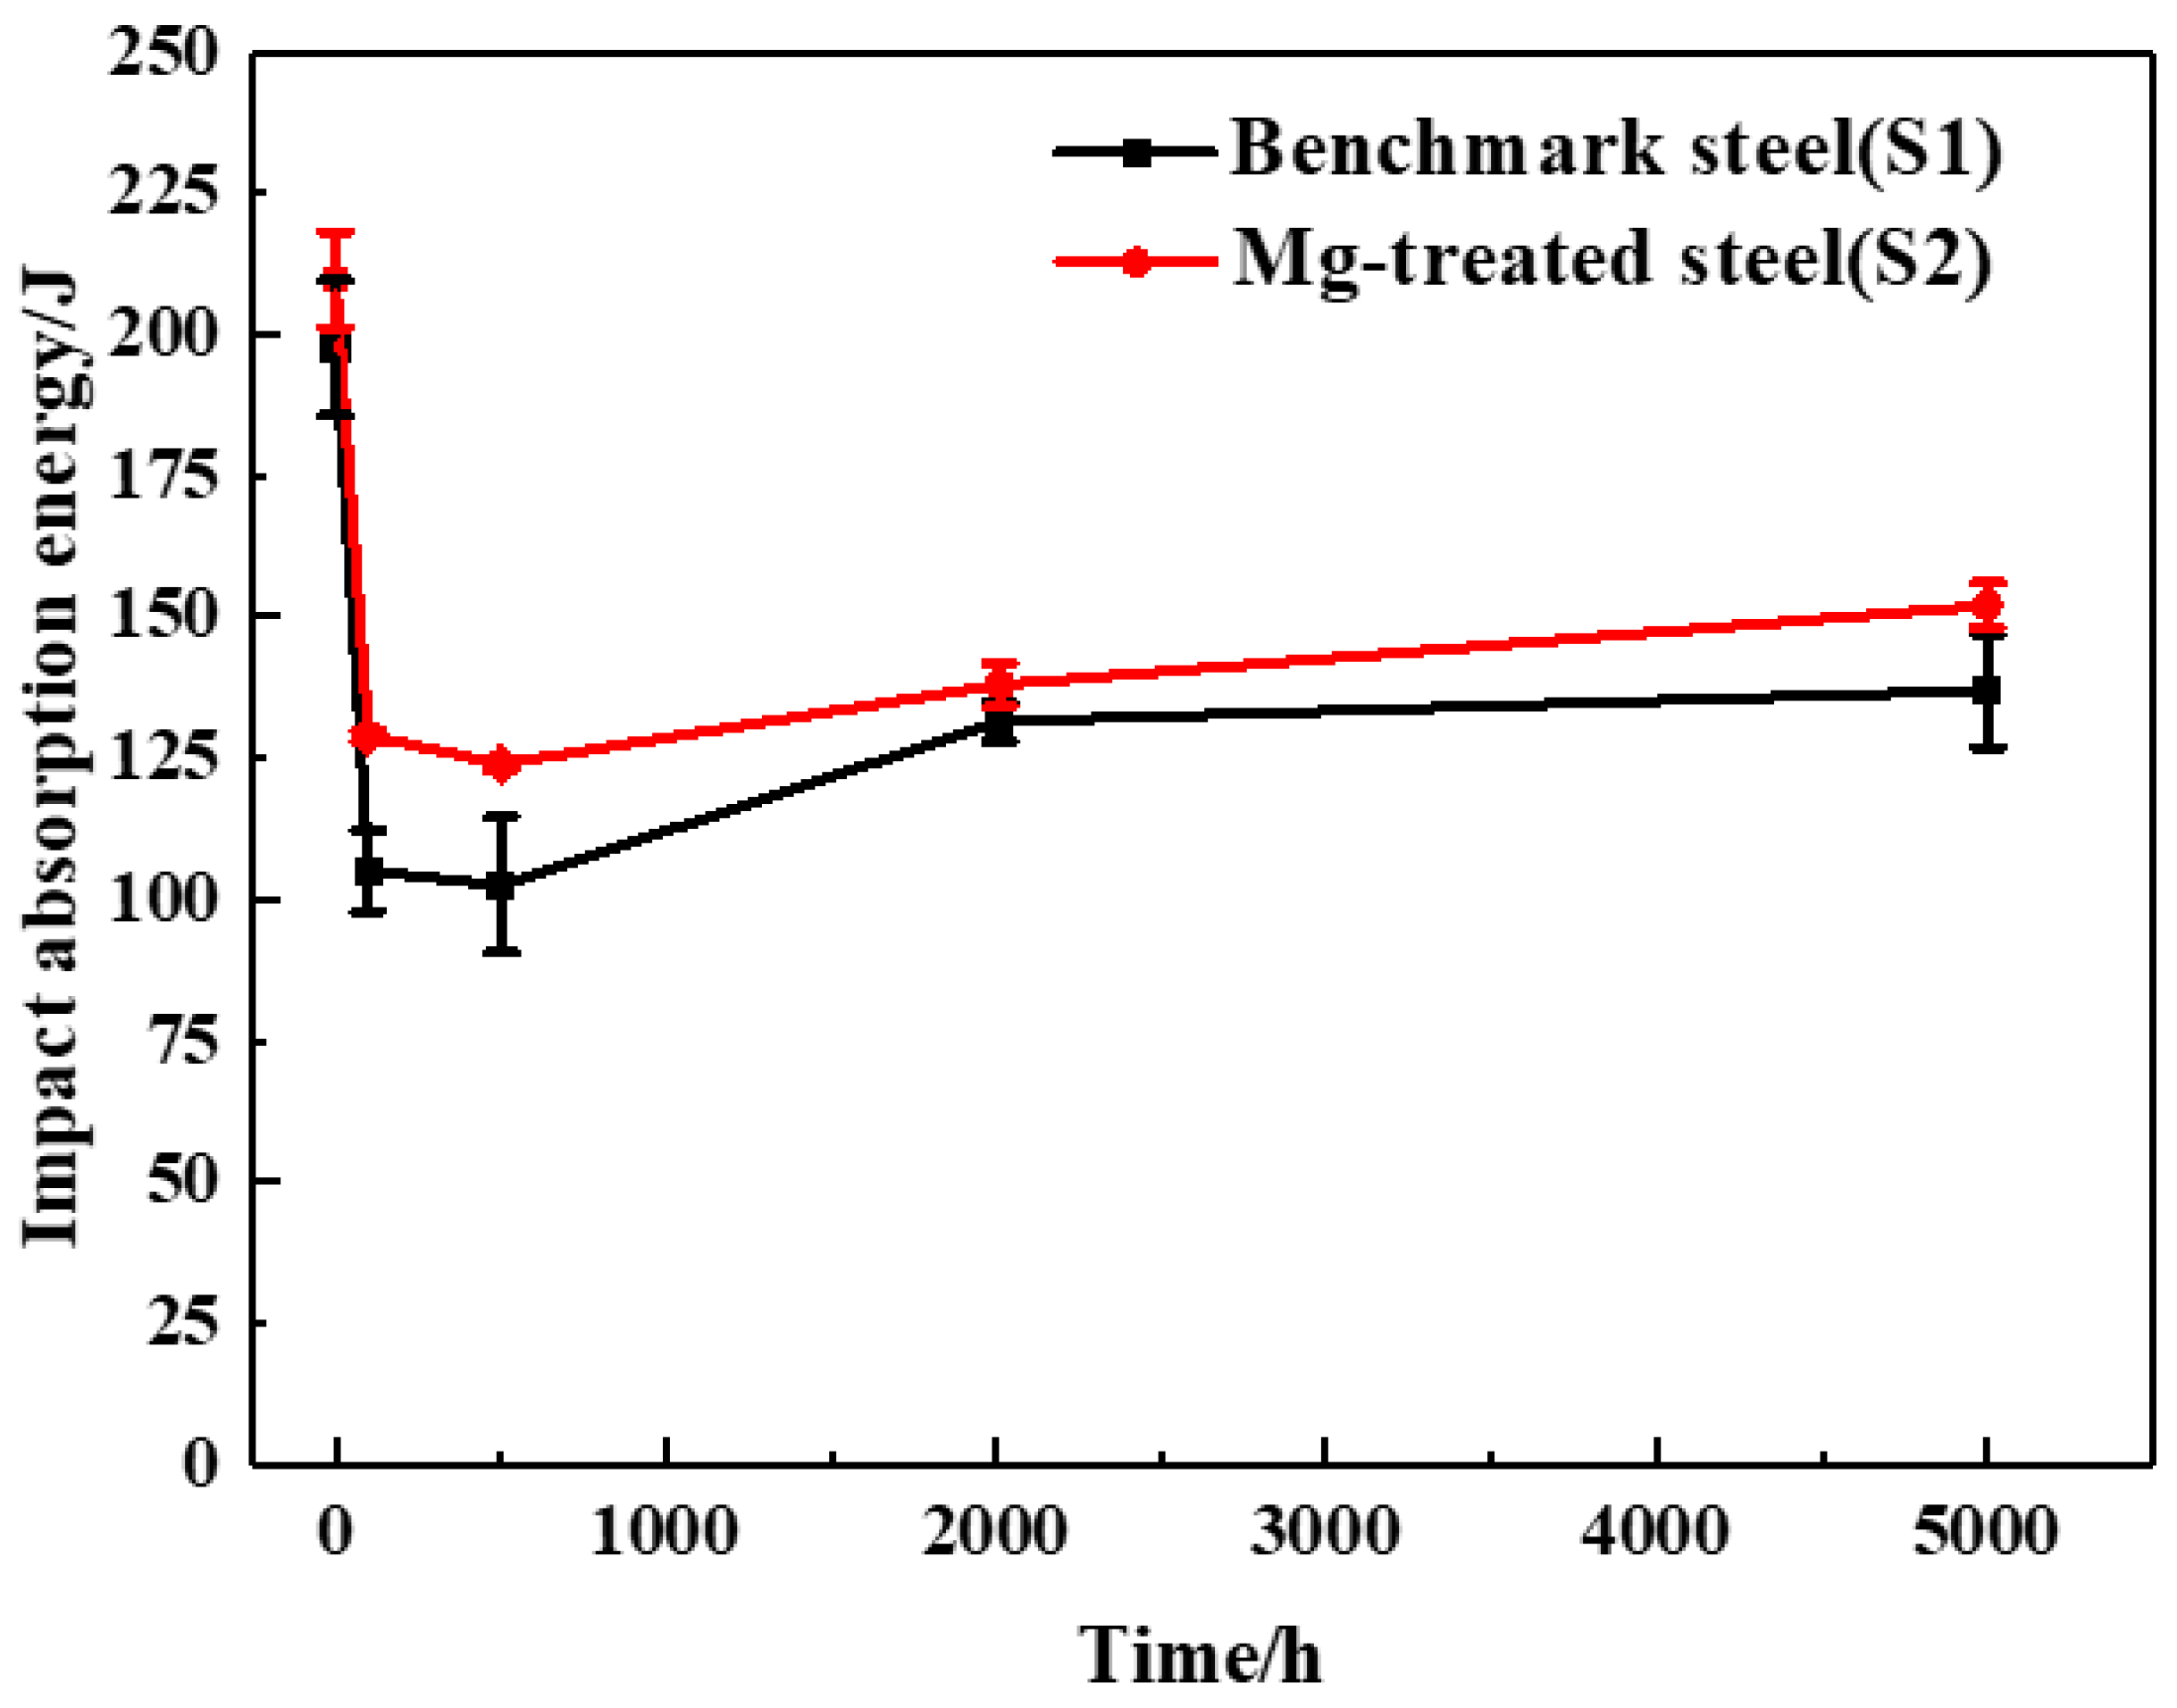
Charpy impact energies of S1 and S2 samples at room temperature after aging different time are shown in Figure 2. As can be seen, during the aging process at 580 °C, the impact energies of S1 and S2 samples all first decrease sharply, and then finally tend to be stable. The time for the impact energy sharply dropping is about 97 h. Compared with aging 0 h, after aging 97 h, the average impact energy of the S1 sample is reduced by 96 J, while that of the S2 sample is reduced by 79 J, which is smaller than that of S1. Moreover, the impact energies of S2 are generally higher than that of S1 during aging at 580 °C. It shows that Mg can improve the impact toughness of 2.25Cr1Mo steel to extend degrees even when P content (0.056%) is slightly higher than that of S2 sample (0.05%).

3.2. Fractographs after Charpy Impact at Room Temperature

Figure 3 and Figure 4 show the low- and high-magnification fractographs of S1 and S2 samples after Charpy impact at room temperature before and after aging for 97 h, respectively. From Figure 3, it can be seen that the fractures are mainly composed of crack-initiated area, crack growth area, and shear lip. Images of crack-initiated area are represented in Figure 4a–d, and it is composed of dimples and has ductile fracture characteristics. Images of crack growth area are represented in Figure 4e–h. The crack growth area has obvious cleavage steps and shows brittle fracture characteristics. The fracture mode is ductile and brittle mixed fracture before and after aging. But the fracture morphologies also change with Mg addition. After quantitative calculation of the crack-initiated area by ipp6.0 image software (Table 2), it is found that crack-initiated area of S2 sample adding Mg is larger than that of S1 sample before and after aging. Samples S1 and S2 seem to have similar morphology before aging (Figure 4a,b,e,f), but after aging for 97 h, the dimple size of S2 sample increased slightly (Figure 4c,d). From the point of view of fracture analysis, the impact performance of the S2 sample adding with Mg is better than that of S1, which is consistent with the impact toughness in this condition.
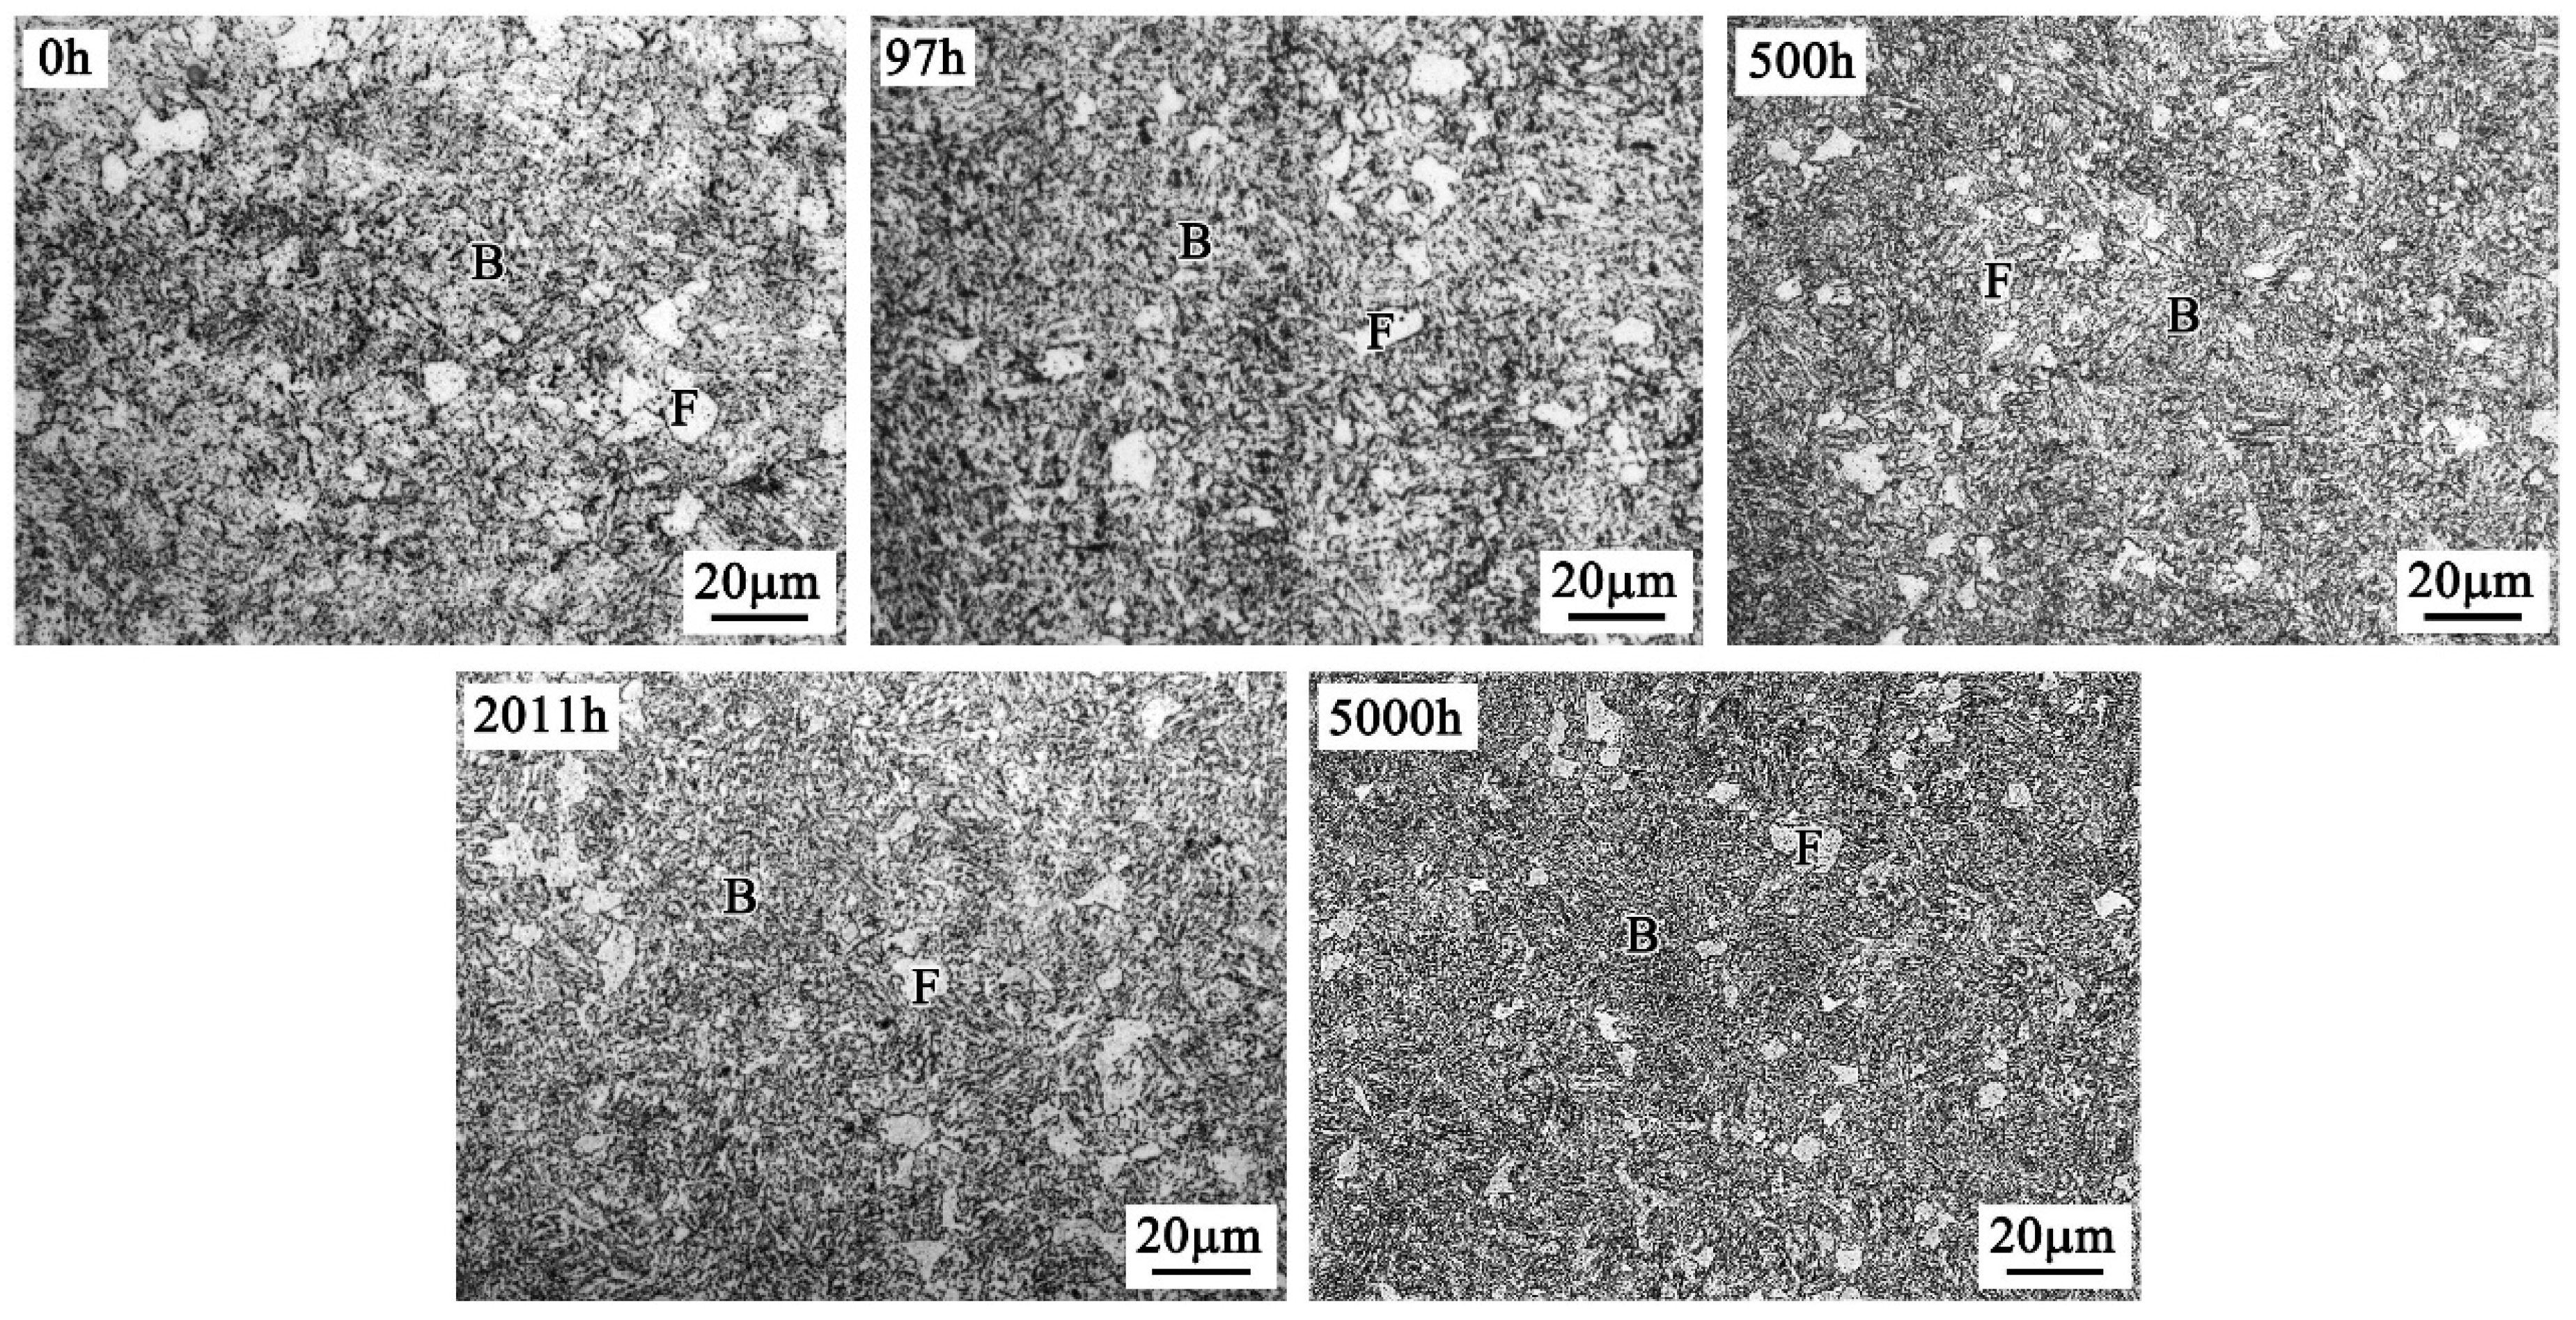
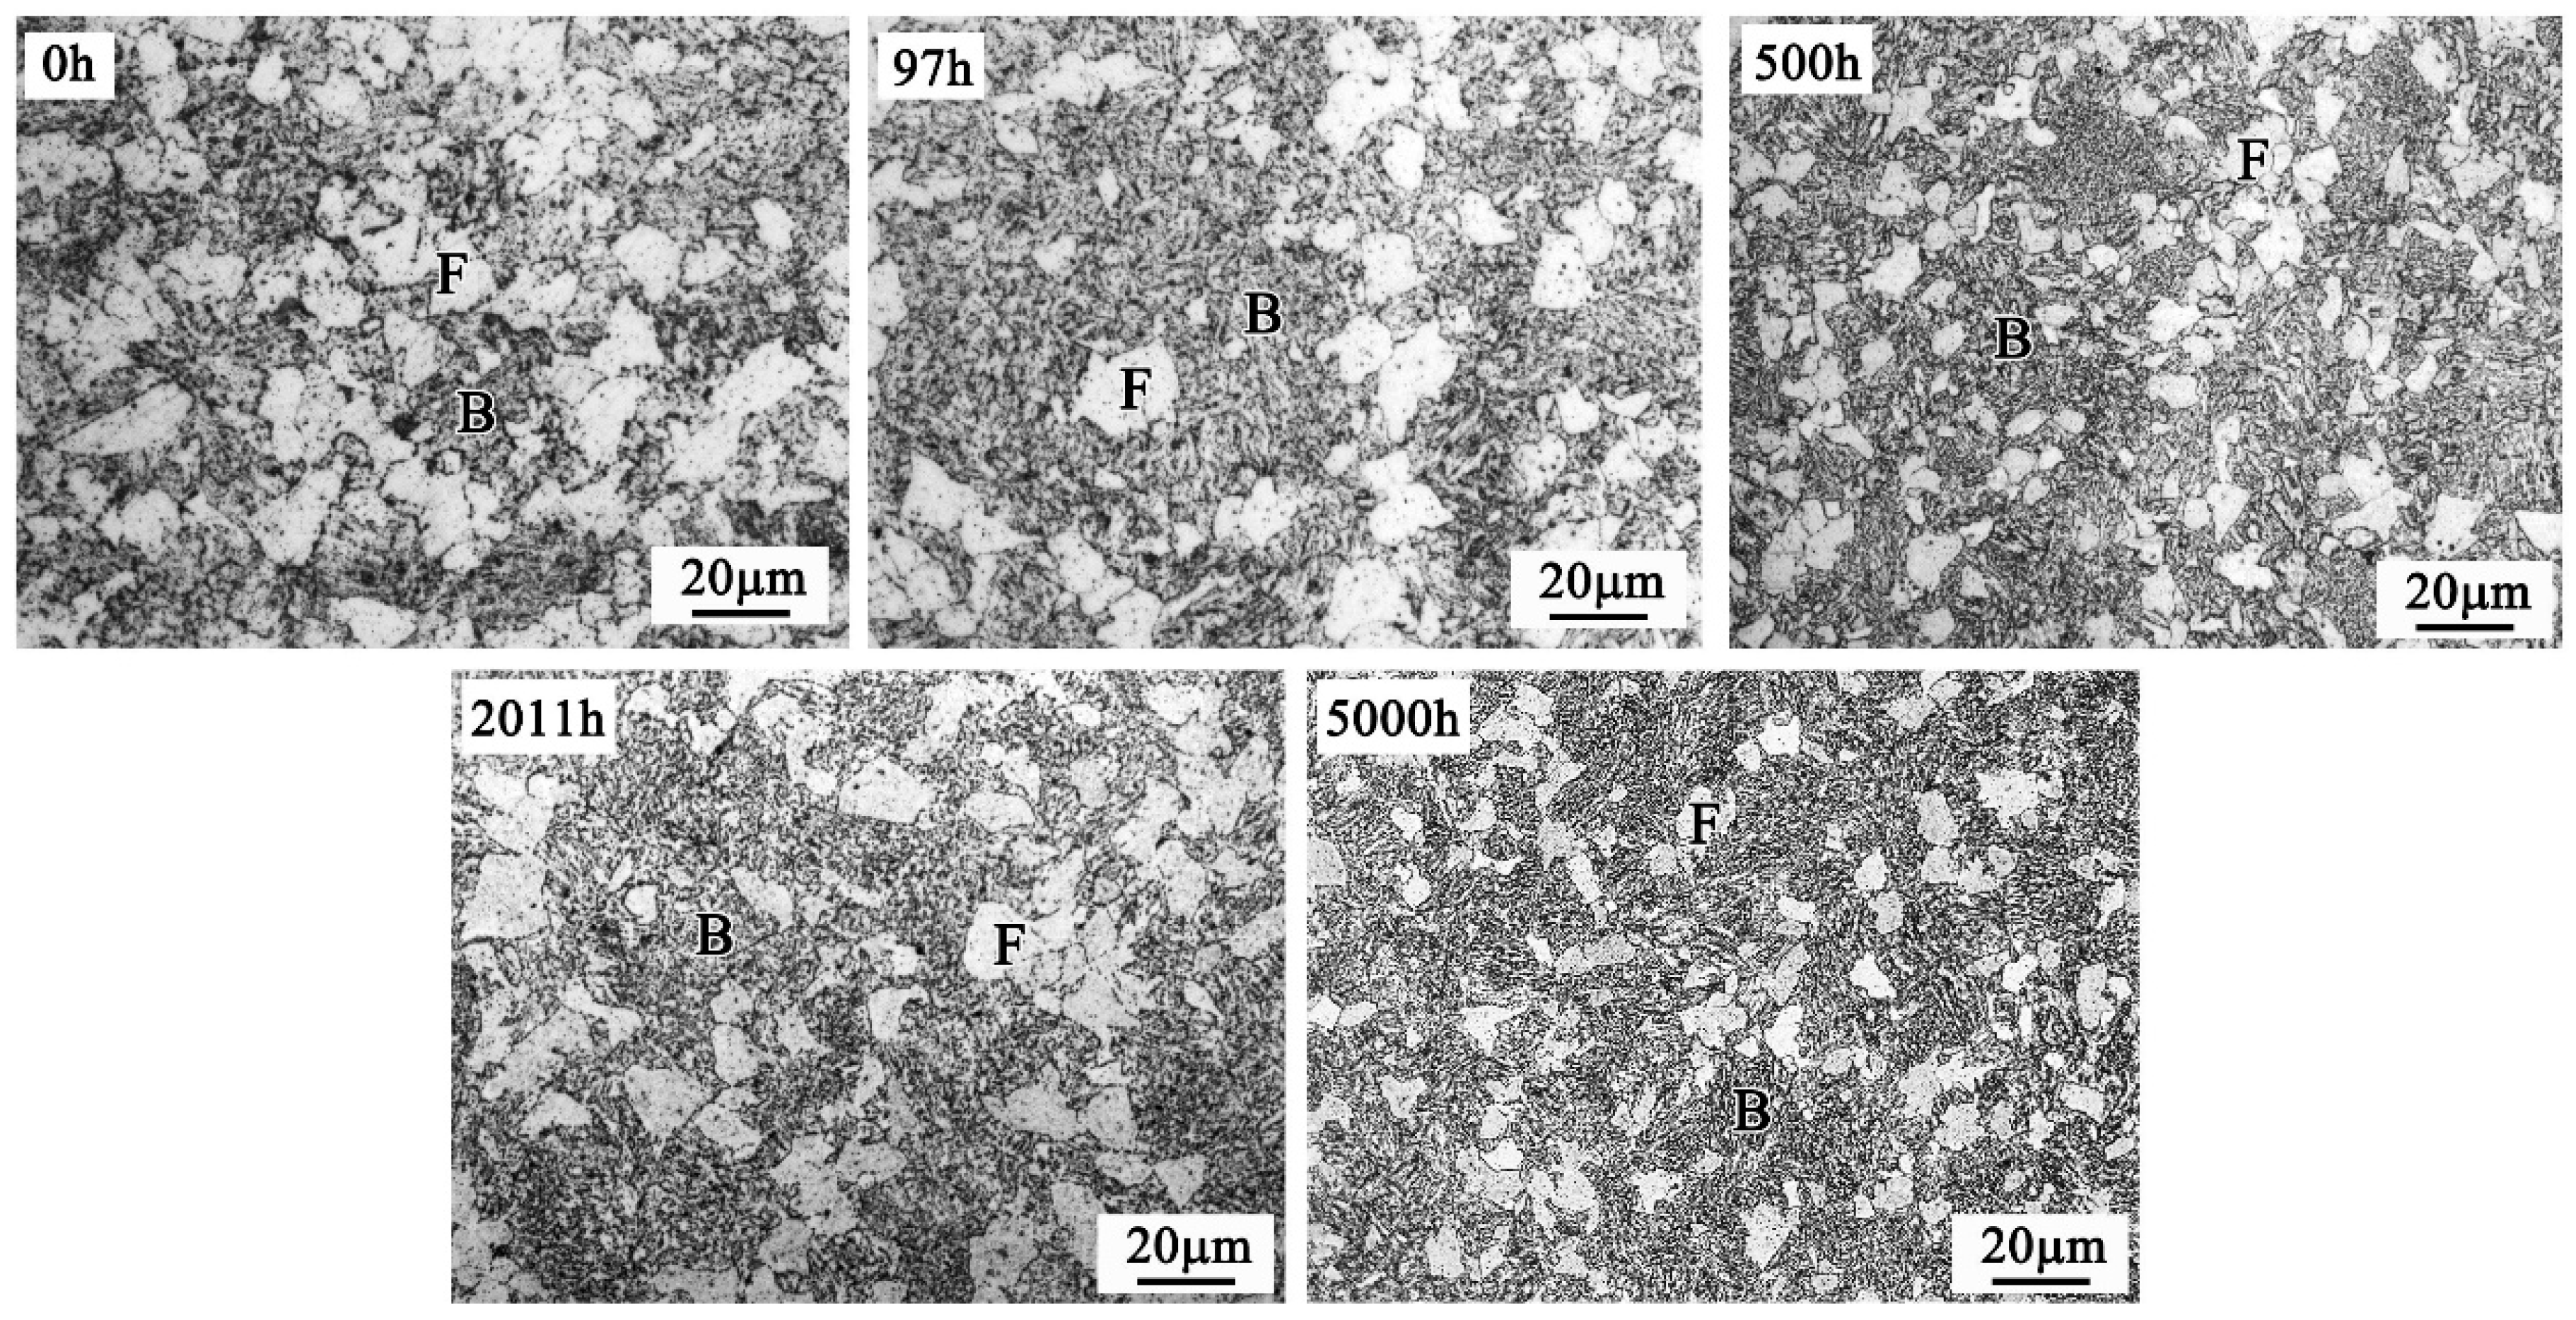
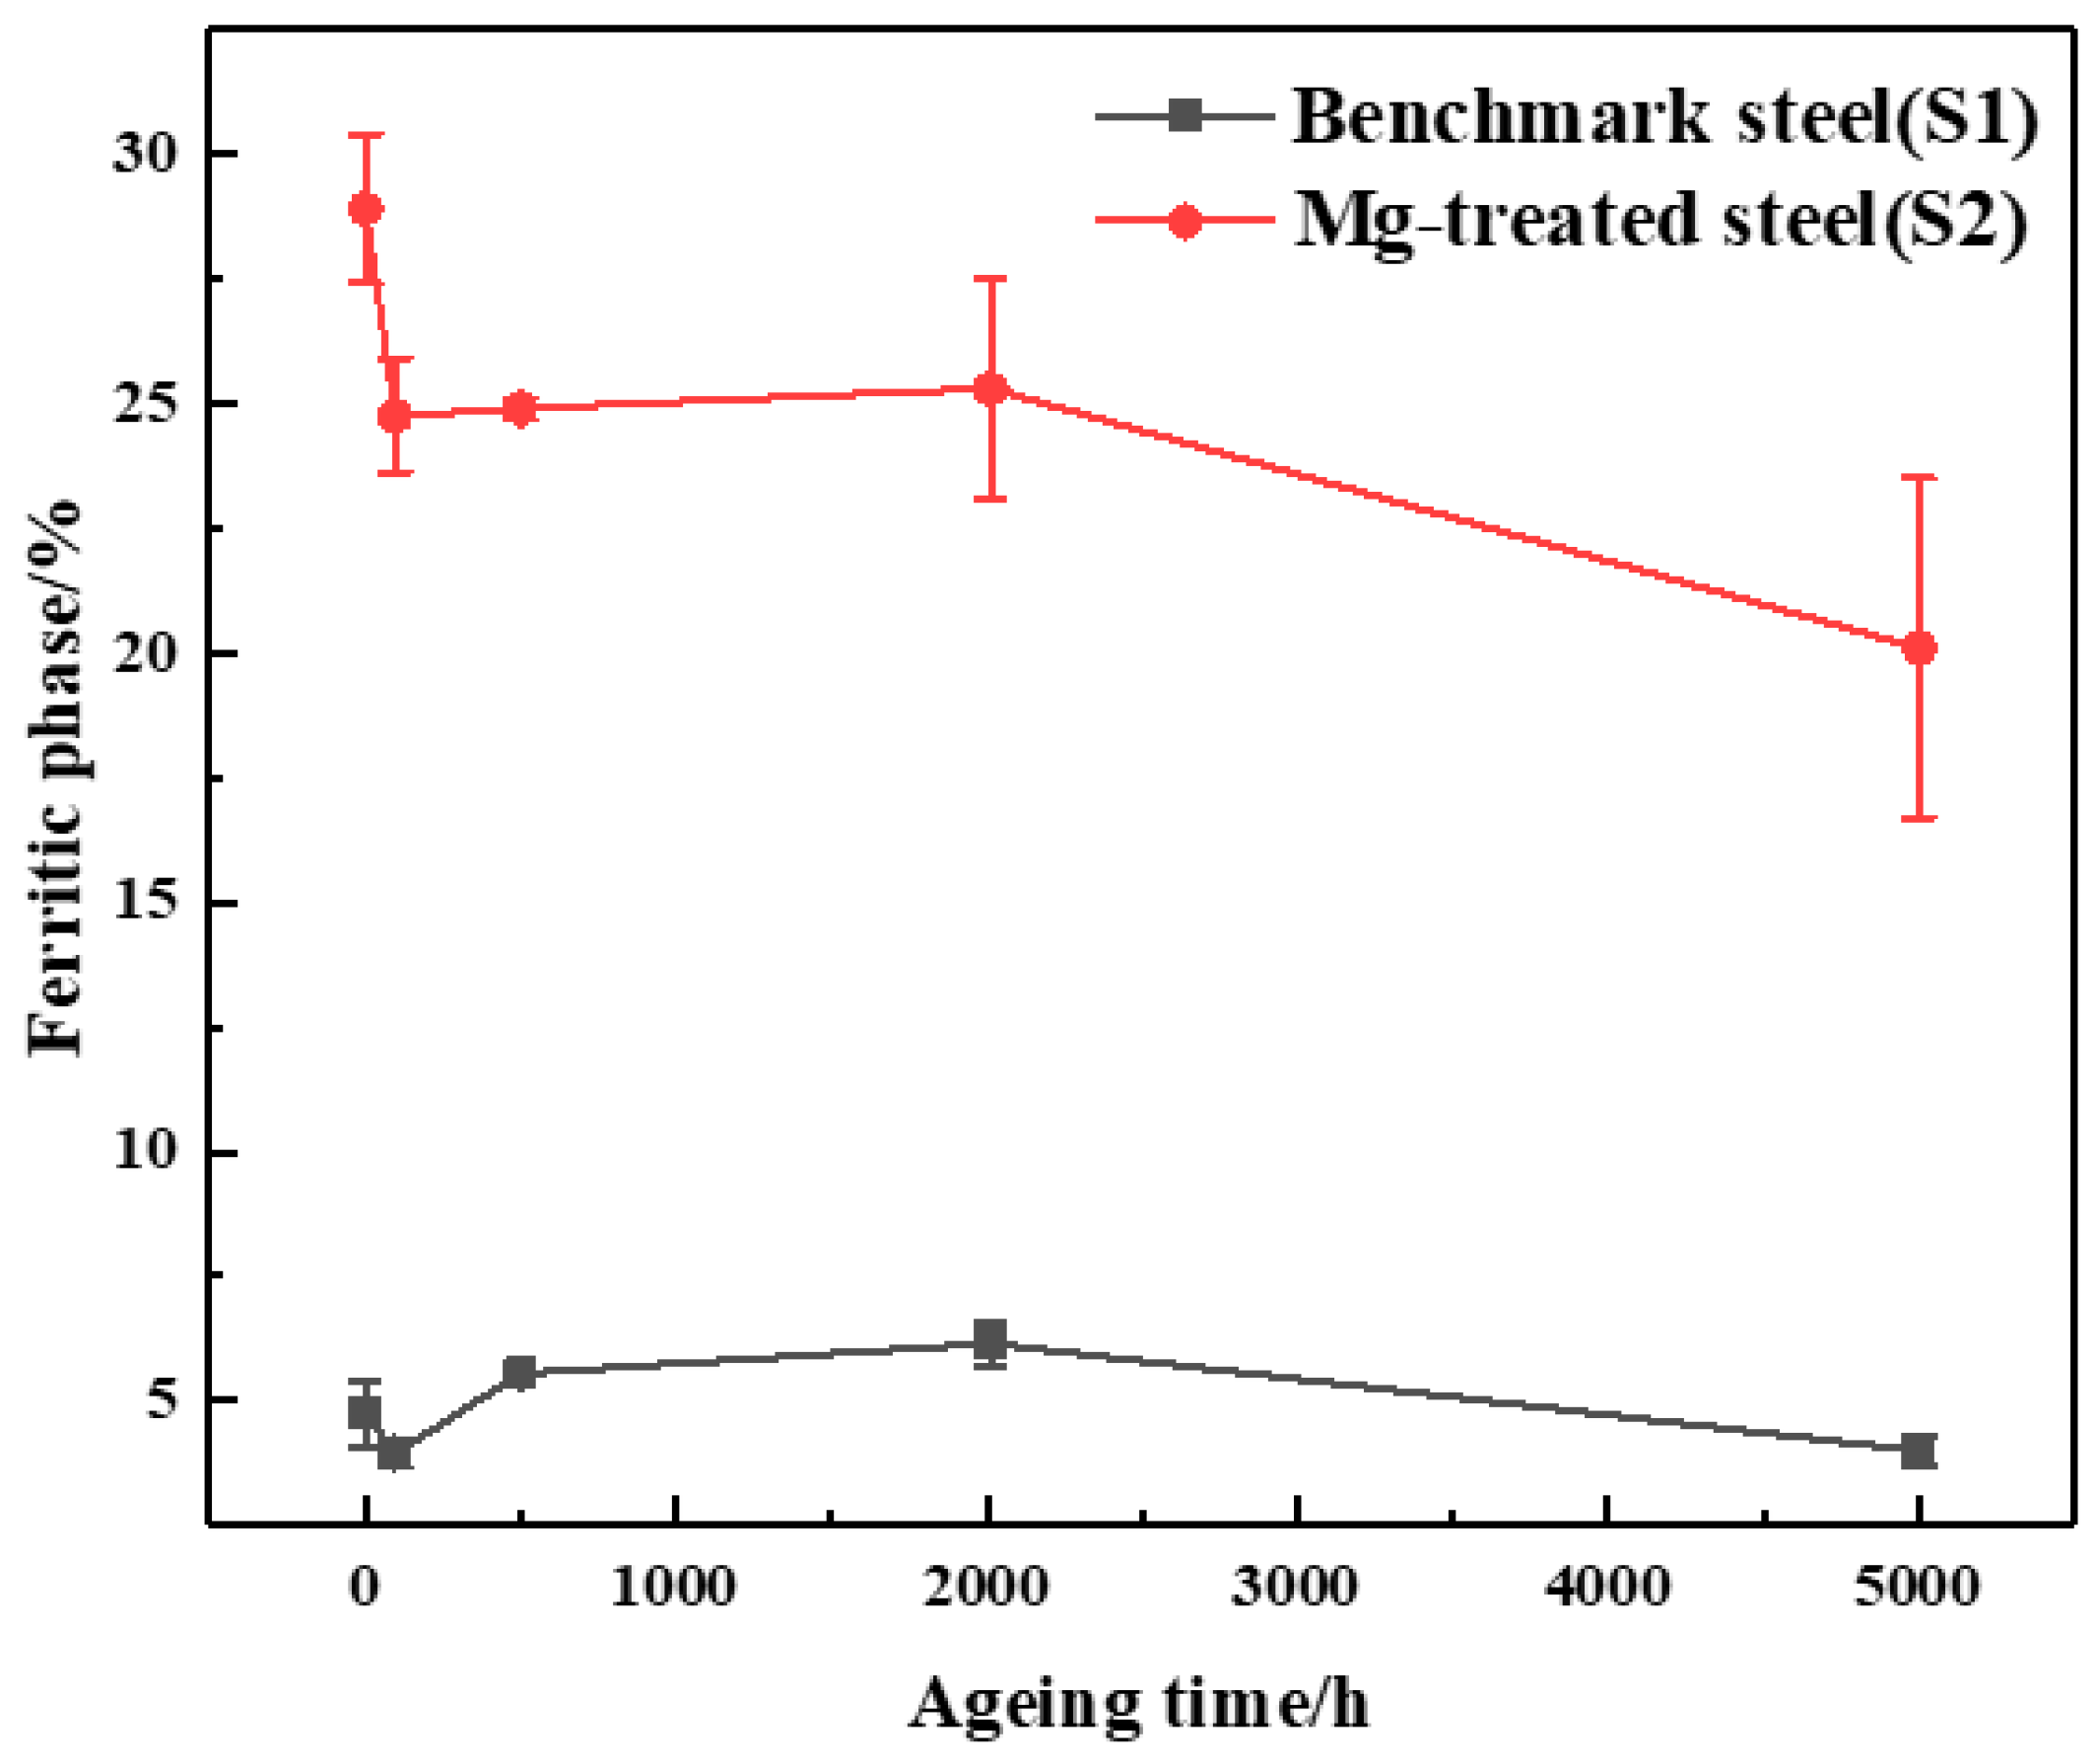
Figure 5 and Figure 6 show the microstructure characteristics of S1 and S2 after being subjected to different aging times, respectively. The microstructure of the samples is mainly bainite and ferrite, with the extension of aging time, the phase structure has no change and is always ferrite and bainite; however, the ferrite volume fraction is different. Figure 7 shows ferrite phase volume fraction of S1 and S2 samples aged at 580 °C for different lengths of time. As shown, the ferrite volume fraction of the two samples all firstly decreases, then slightly increases and finally decreases to about 3 vol.% and 20 vol.% for S1 and S2 samples, respectively. From these results, it is noted that the ferrite volume fraction of Mg-added sample is significantly higher than that of Mg-free sample.
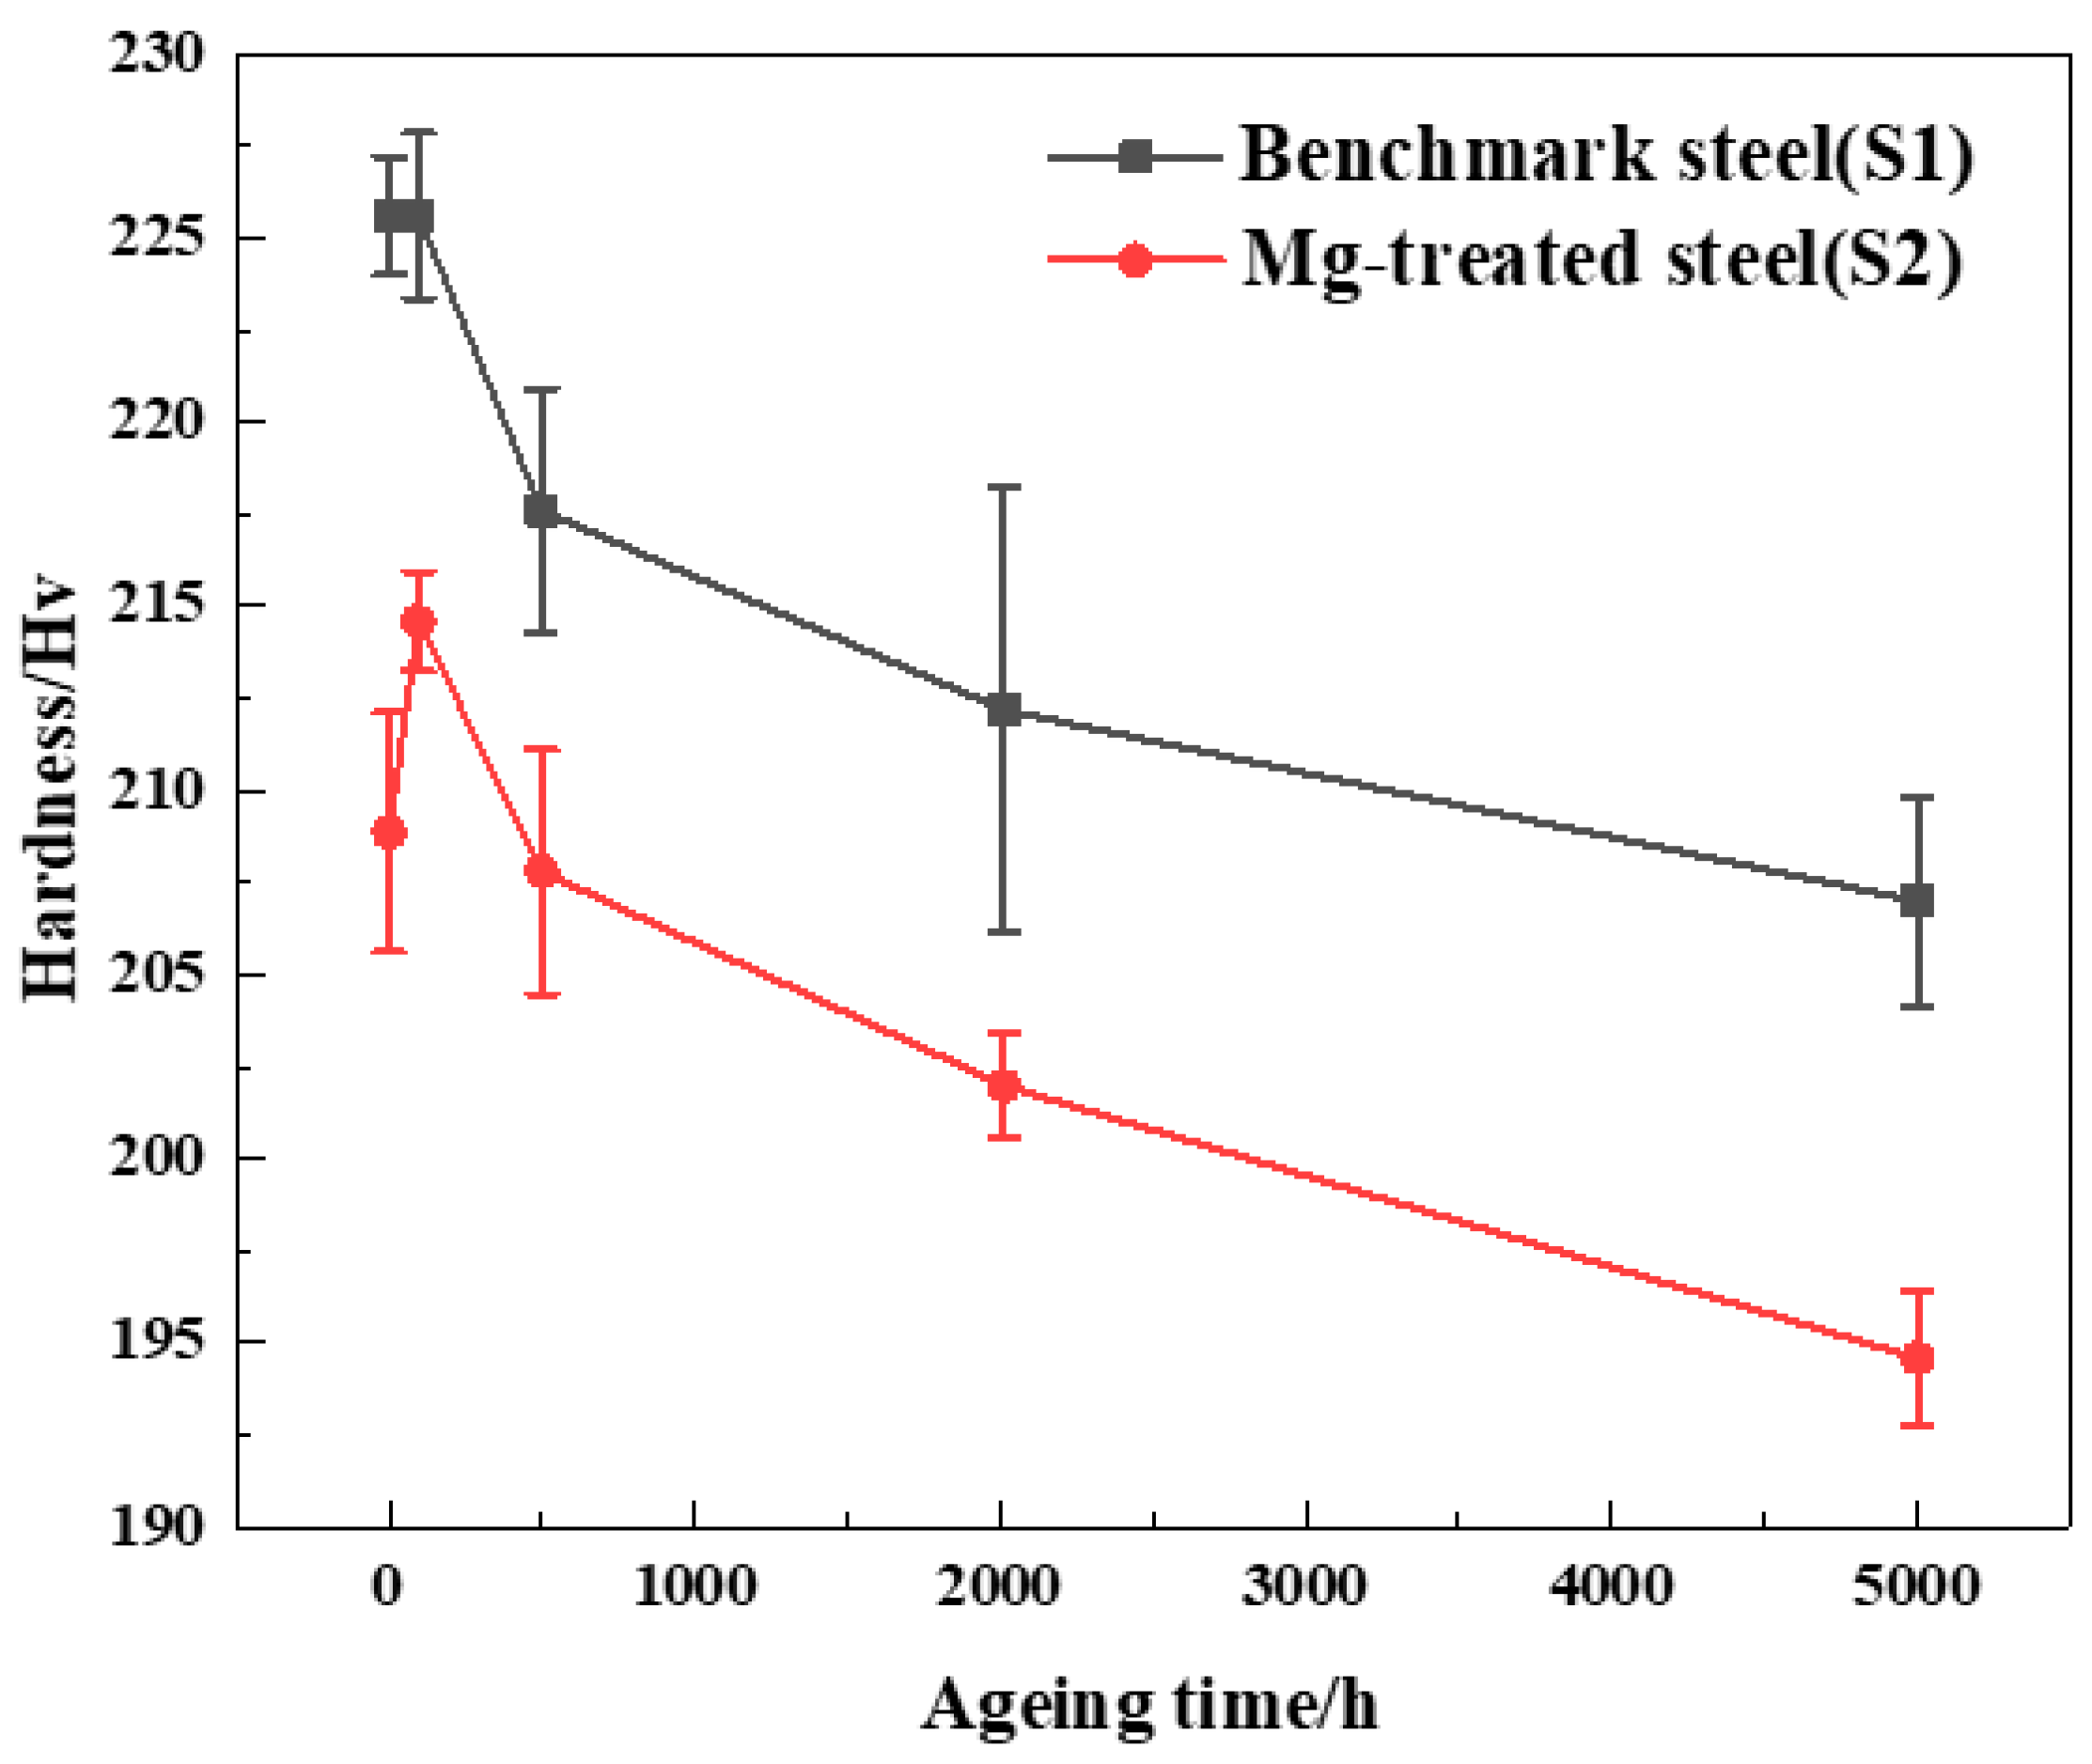
Furthermore, to shed light on the microstructure difference, the hardness of S1 and S2 samples after aging for different lengths of time was also characterized, as shown in Figure 8. The results show that with the increased aging time, the hardness of the two samples tended to decrease. During the aging time up to 5000 h, the hardness of S2 sample with Mg addition is intensively lower than that of S1, which is generally ascribed to the high-volume fraction of the soft and tough ferrite phase in Mg-treated steel.

4. Discussion

As we all know, in steel, the main factors affecting impact toughness are microstructure, grain boundary segregation of impurity elements, prior austenite grain size, and grain boundary precipitation [19,20,21,22]. Therefore, this article will explain the evolution of impact toughness from the above aspects.

4.1. Microstructure

As stated above, both the microstructural characteristics and microhardness have addressed that the volume fraction of ferrite phase in Mg-treated steel is significantly larger than that of Mg-free steel. This result proves the Mg in steel should be a ferrite stabilizer element. In addition, it is commonly believed that there exists a relationship between microstructural embrittlement and its strength or hardness. For example, Viswanathan et al. [23] pointed out that hardness is positively related to the tendency of temper embrittlement, i.e., as the material hardness increased, the concentration of impurity elements such as P segregated at grain boundary increased. Yang et al. [24] compared the temper embrittlement tendency of martensite and bainite structures. They pointed out that although S content in the steel is as small as 0.002 wt.% (equal to the S content in this paper, see Table 1), the AES results revealed that S segregation was more obvious in the martensitic structure than that of bainitic structure under the same step cooling process. From the perspective of hardness, for the same steel composition, the hardness of martensite is in fact much higher than that of bainite due to its shear transformation. Hence, these perfectly coincide with the conclusions made by Viswanathan et al. [23]. Thus, these identify the structure with a lower hardness (for example ferrite phase in this study) might has a lower tendency to temper embrittlement. On the other hand, Han et al. [25] have shown that a small amount of ferrite can improve the impact toughness of bainite or pearlite steel, mainly because the ferrite phase can increase the coordinated deformation ability of the structure, and the tip of the crack will be passivated when the crack propagates to the ferrite phase, thereby increasing the crack propagation power. Above all, in this research, the positive effect of Mg on the embrittlement limitation can be ascribed to the one reason, i.e., Mg addition promotes the formation of ferrite structure.

4.2. Grain Boundary Segregation of Impurity Elements

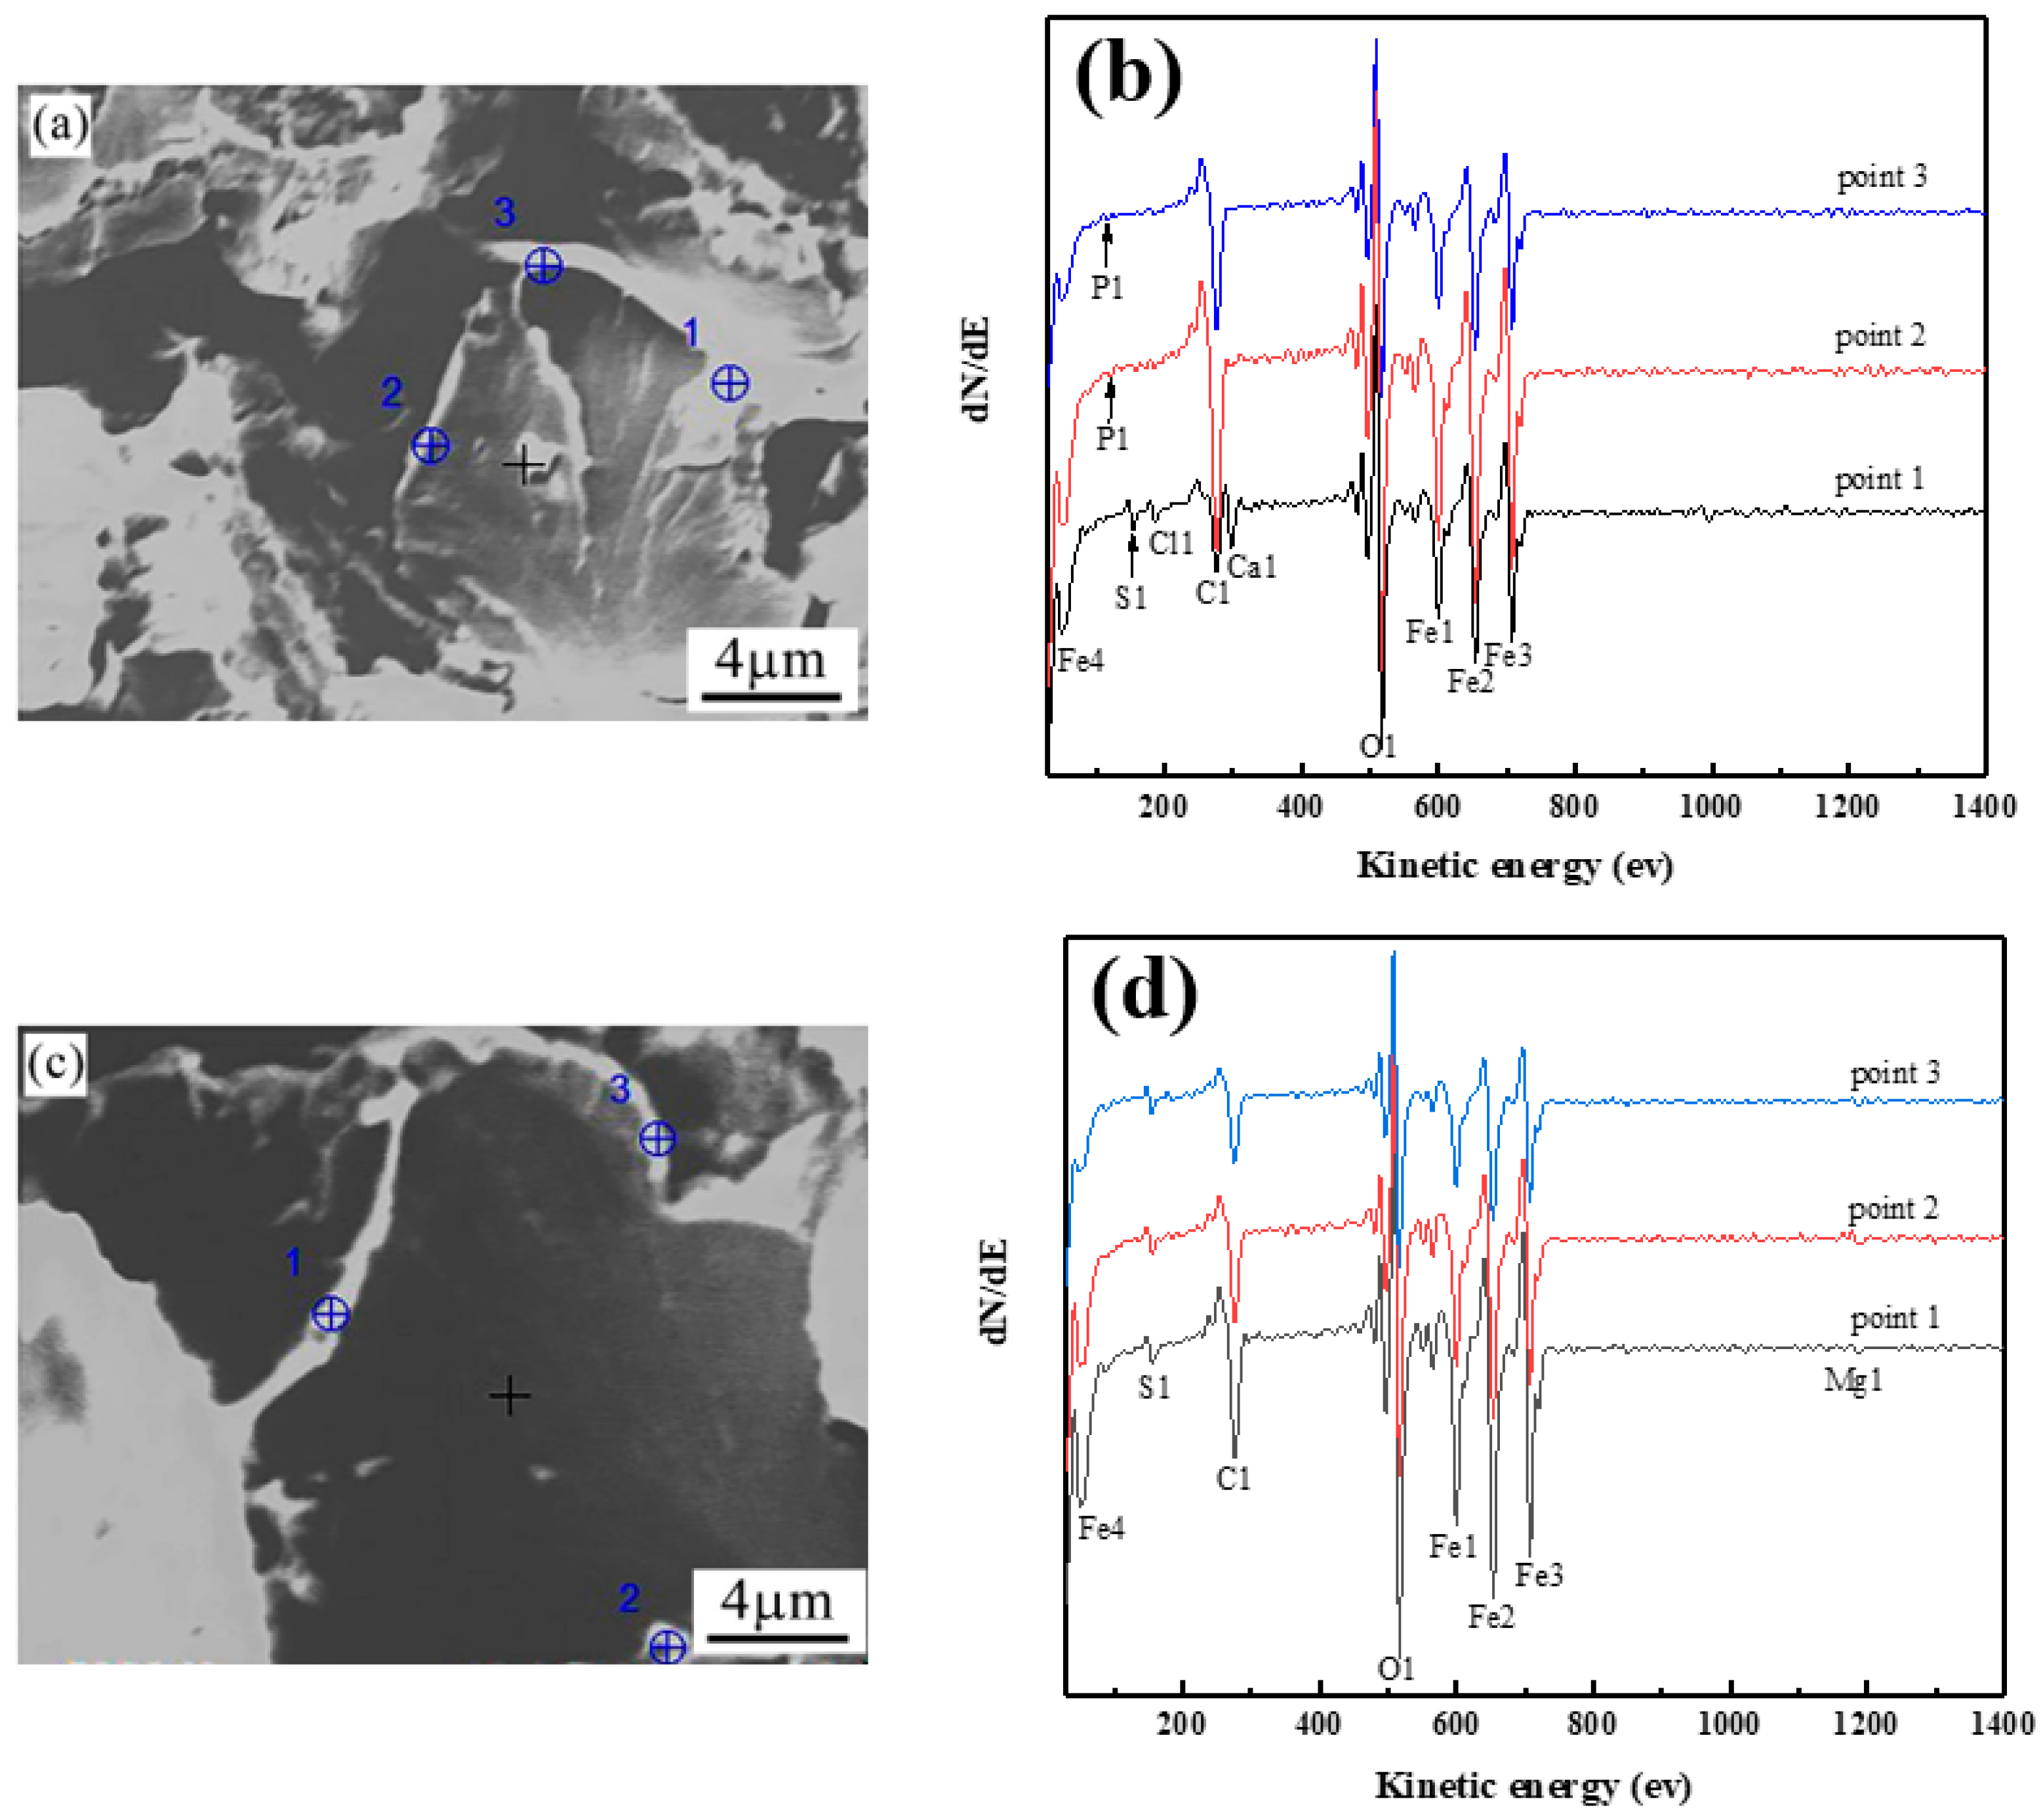
In order to analyze the grain boundary segregation behavior of the typical element during the aging process, we performed auger electron analysis on the S1 and S2 experimental steel samples before and after aging. The typical aging samples, for example 0 h, 500 h, and 5000 h, were chosen. Table 3 shows the concentration of P, S, Ca, and Mg at the grain boundary of S1 and S2 samples after aging different times at 580 °C, and the corresponding typical AES spectra and analysis positions are shown in Figure 9 and Figure 10.
As can be seen in Table 3, P and S peaks are not detected at the grain boundary in S1 sample before aging, but when the aging time increases to 500 h, P and S segregation peaks are detected, and the segregation behavior mainly exists in cosegregation of P, S (Figure 9a,b). It should be mentioned that when the aging time is up to 5000 h, there is a Ca segregation peak when P and S segregate at grain boundary. Before aging, the grain boundary is mainly segregated with Mg. After aging for 500 h, Mg, P, and S cosegregate at grain boundary (Figure 9), and the content of S is even slightly higher than that of S1 while the content of P is obvious smaller than that of S1. With increasing aging time, the concentration range of Mg segregation is about 5–7 at.% (Table 3). By comparison, in the Mg-added S2 sample, there is no detection of P, Ca segregation at the grain boundary. Hence, it can be concluded that, during aging at 580 °C, Mg and S can continuously segregate to the grain boundary, which would restrain or even suppress the segregation of P, thus that no obvious P segregation peak is found in the detected grain boundaries.
Generally speaking, in the middle-temperature aging process, impurity elements such as P and S will segregate to the grain boundary under thermal activation conditions, which will reduce the bonding force of the grain boundary and cause embrittlement [26]. Furthermore, previous studies pointed out that the grain boundary can be regarded as a two-dimensional phase, which is different from the granular [27], and the performance of the grain boundary depends on the composition and structure of the two-dimensional phase. Some researchers pointed [28,29] that P atoms segregating at the α-Fe grain boundary will form a structure similar to Fe3P compounds, and S mainly form a structure similar to FeS compounds [30]. Both of them are believed to reduce the grain boundary bonding force and result in temper embrittlement heavily. Thus, for the Mg-free sample (S1), the grain boundary two-dimensional phase should be the phase with higher content of P, S, and Ca, and that of the Mg-added sample (S2) is two-dimensional phases may be formed with higher content of Mg and S. This means P and S atoms may not only form Fe–P and Fe–S bonds compounds but also have great opportunity to combine with Mg atoms forming other types of bonds. This will relieve the decohesion of Fe–Fe bond induced by impurities at grain boundary, which in turn has a positive effect on temper embrittlement limitation.
Seah believed [31] that whether the segregation of solute atoms can increase the grain boundary bonding force is mainly determined by the difference in the sublimation heat per unit area between solute atoms and solvent atoms. The greater sublimation heat of the solute atoms compared with solvent can increase the grain boundary bonding force, otherwise, it will reduce the grain boundary bonding force. Theoretical calculations were also employed in the research and showed that P, S, Mg, etc. segregation at the grain boundary will reduce the grain boundary bonding force and accelerate the grain boundary embrittlement, and the order is Mg > S > P in α-Fe. But the research did not provide any evidence on the segregation of Ca and its influence. Hence, it can be noted that the influence of Mg segregation obtained by theoretical calculations is obviously different from the experiment results of this paper.
In fact, there do exist some inconsistence between theoretical calculations and experimental results. For example, experimental studies confirmed that Ce has a strong tendency to segregate at the grain boundary, and the segregation can strengthen the grain boundary and reduce the tendency of embrittlement as stated in the introduction. However, this result also conflicts with Seah’s calculations because according to the theoretical results the Ce at grain boundary may reduce the bonding strength of the grain boundaries and accelerate the GB embrittlement [31]. This phenomenon can be generally explained by Lejček et al. [32], who have explored the potential reasons of the difference between the theoretical calculations and the experimental results on the effect of segregation element on grain boundary embrittlement in iron-based alloy systems. The research showed that the degree of agreement between calculations and experimental results is related to the solubility of alloying elements in the matrix. When the solubility of alloying elements in the matrix is higher, such as Co, Si, V, Al, Cr, Ni, Sn, Mn, Mo, etc., most of the theoretical calculation results of these elements are consistent with the experimental results; but when the solubility of alloying elements in the matrix is relatively lower, such as Pd, P, N, C, H, Mg, S, B, Ag, O, Ce, etc., the calculated results are very scattered, and the degree of agreement is lower. Therefore, combining both theoretical and experimental results to analyze the influence of alloying elements on material embrittlement is necessary. Thus, based on the results of this article, a reasonable speculation can be made, i.e., compared with the influence of P, S, and Ca cosegregation, the two-dimensional phase formed by Mg and S cosegregation should have fewer weakened bonds than that of P, S, and Ca cosegregation. Therefore, it is believed that the Mg segregation at grain boundary could increase the grain boundary bonding force and improve temper embrittlement, and even the Mg segregation at grain boundary could also reduce the P segregation to a certain extent, which should be another reason why the steel adding Mg has relatively high impact energy.

4.3. Prior Austenite Grain Size

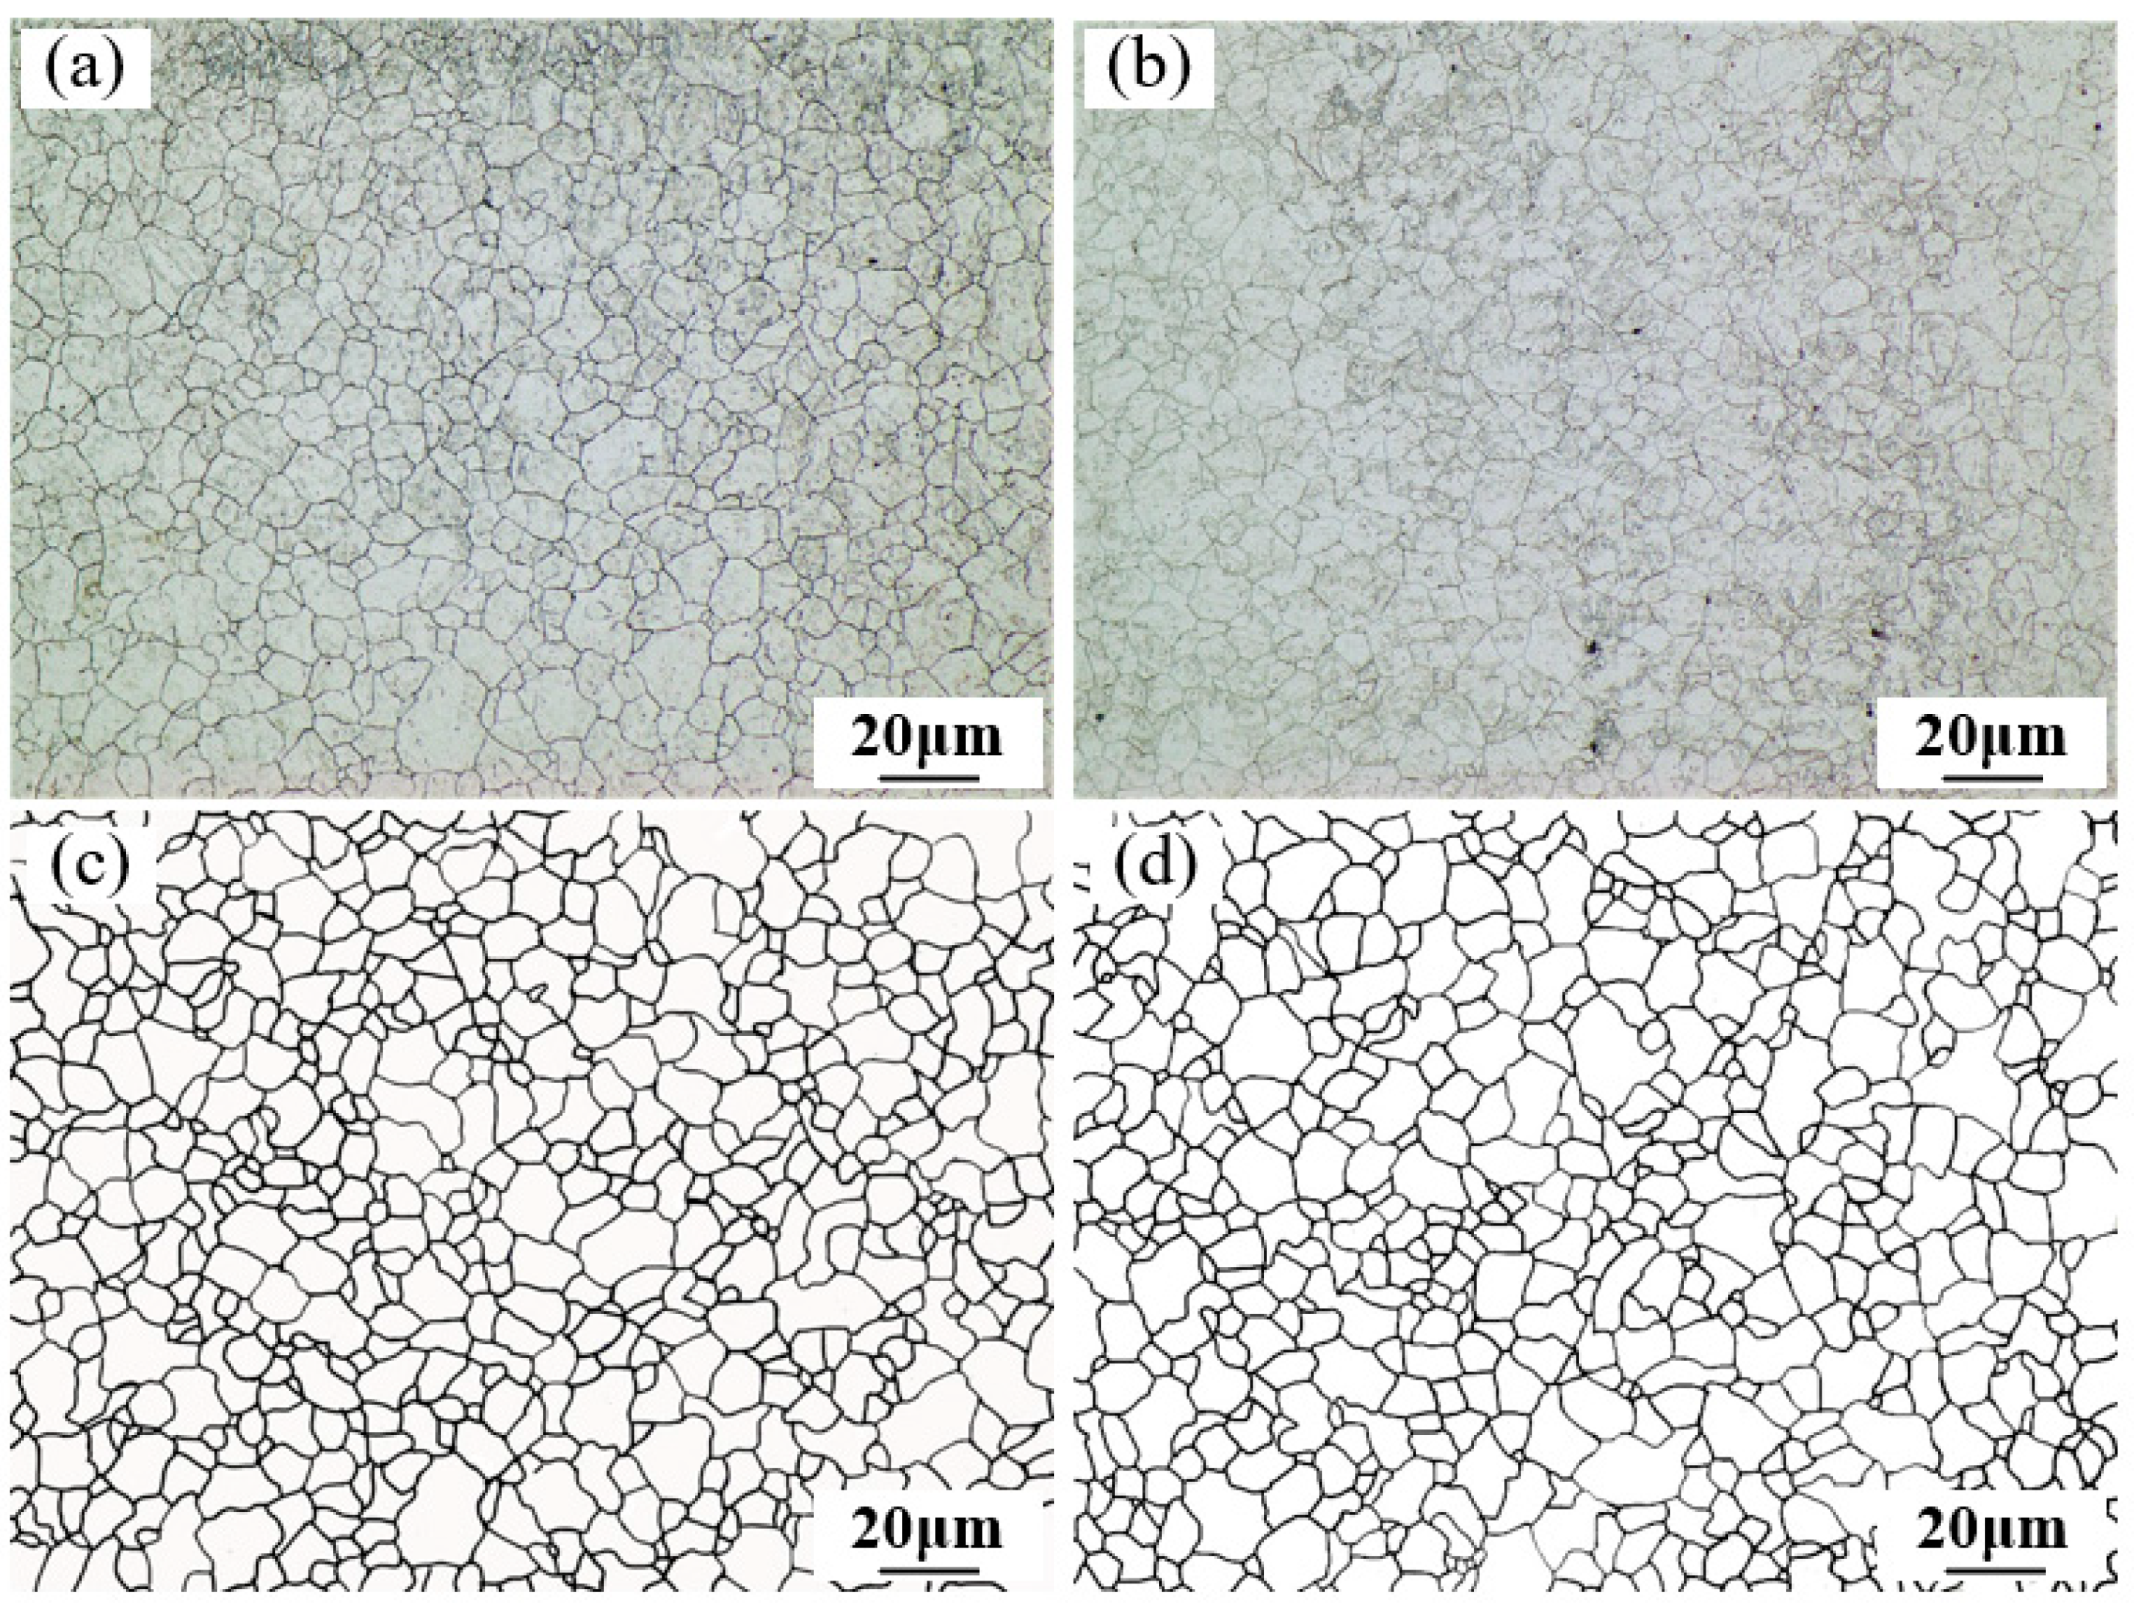
It is generally believed the atomic concentration at the grain boundary could also depend on the total surface of prior austenite grain size [33]. For example, Jia et al. [33] pointed out that grain refinement can minimize the degree of segregation such as P element and improve the impact toughness. As a result, the impact toughness is improved and the DBTT is decreased. Actually, grain refinement is equivalent to increasing the total area of the grain boundary, so that the concentration of elements on the grain boundary is diluted. Zhao et al. [34] proved that the grain size has an apparent effect on the grain boundary segregation, since the grain boundary segregation of phosphorus has a significant effect on the ductile-to-brittle transition temperature (DBTT). Thus, the prior austenite grain size could influence the embrittlement of the steels through the following mechanisms, i.e., the steel toughness could be affected both by the austenite grain size through itself and its effect on the boundary segregation of impurity atoms. Regrettably, the prior austenite grain cannot be directly etched based on the heat-treated samples. Therefore, the heat-treated samples were resolution treated at 930 °C for 30 min, and then quenched in iced water and etched in supersaturated picric acid as stated in Section 2. Figure 11 shows the prior austenite grain morphology of S1 and S2 samples, of which Figure 11c,d depict austenite grain boundaries by the PS software for S1 and S2 sample, respectively. For S1 and S2 samples, the grain sizes are 8.6 ± 0.2 μm and 9.3 ± 0.1 μm by the cross-section method, respectively. Hence, it can be found that the grain size is not refined with adding Mg, which is consist with the results of Bu et al. [35]. They have found that when Mg segregates at the grain boundary, it mainly exists in a solid solution state and fails to fully play the role of pinning grain boundaries. Therefore, it can be further speculated that the impact toughness improvement caused by Mg addition is not through the austenite grain size in this study. Despite this, combined with the segregation concentration of P, S elements at grain boundary, it can be further concluded that the reduced P segregation concentration at grain boundary should be mainly ascribed the inhibiting effect by trace Mg rather than the austenite grain characteristics.

4.4. Carbide Precipitation at the Grain Boundary

For Cr–Mo steels, carbides at grain boundary are also important factors affecting impact toughness during the aging process. It is believed that carbides at grain boundary are not beneficial to the impact toughness of steel [19]. But despite this, the damage degree would also quite depend on the morphology and distribution of carbides. For instance, Li et al. [20] found that the second phase changes from uneven rod-shaped and blocky to dispersed fine particles with the tempering temperature increases, which is a key factor in improving impact toughness. Cui et al. [36] also proved that the impact toughness with carbides on the grain boundary in a fine and even distribution is higher than that in a blocky distribution.
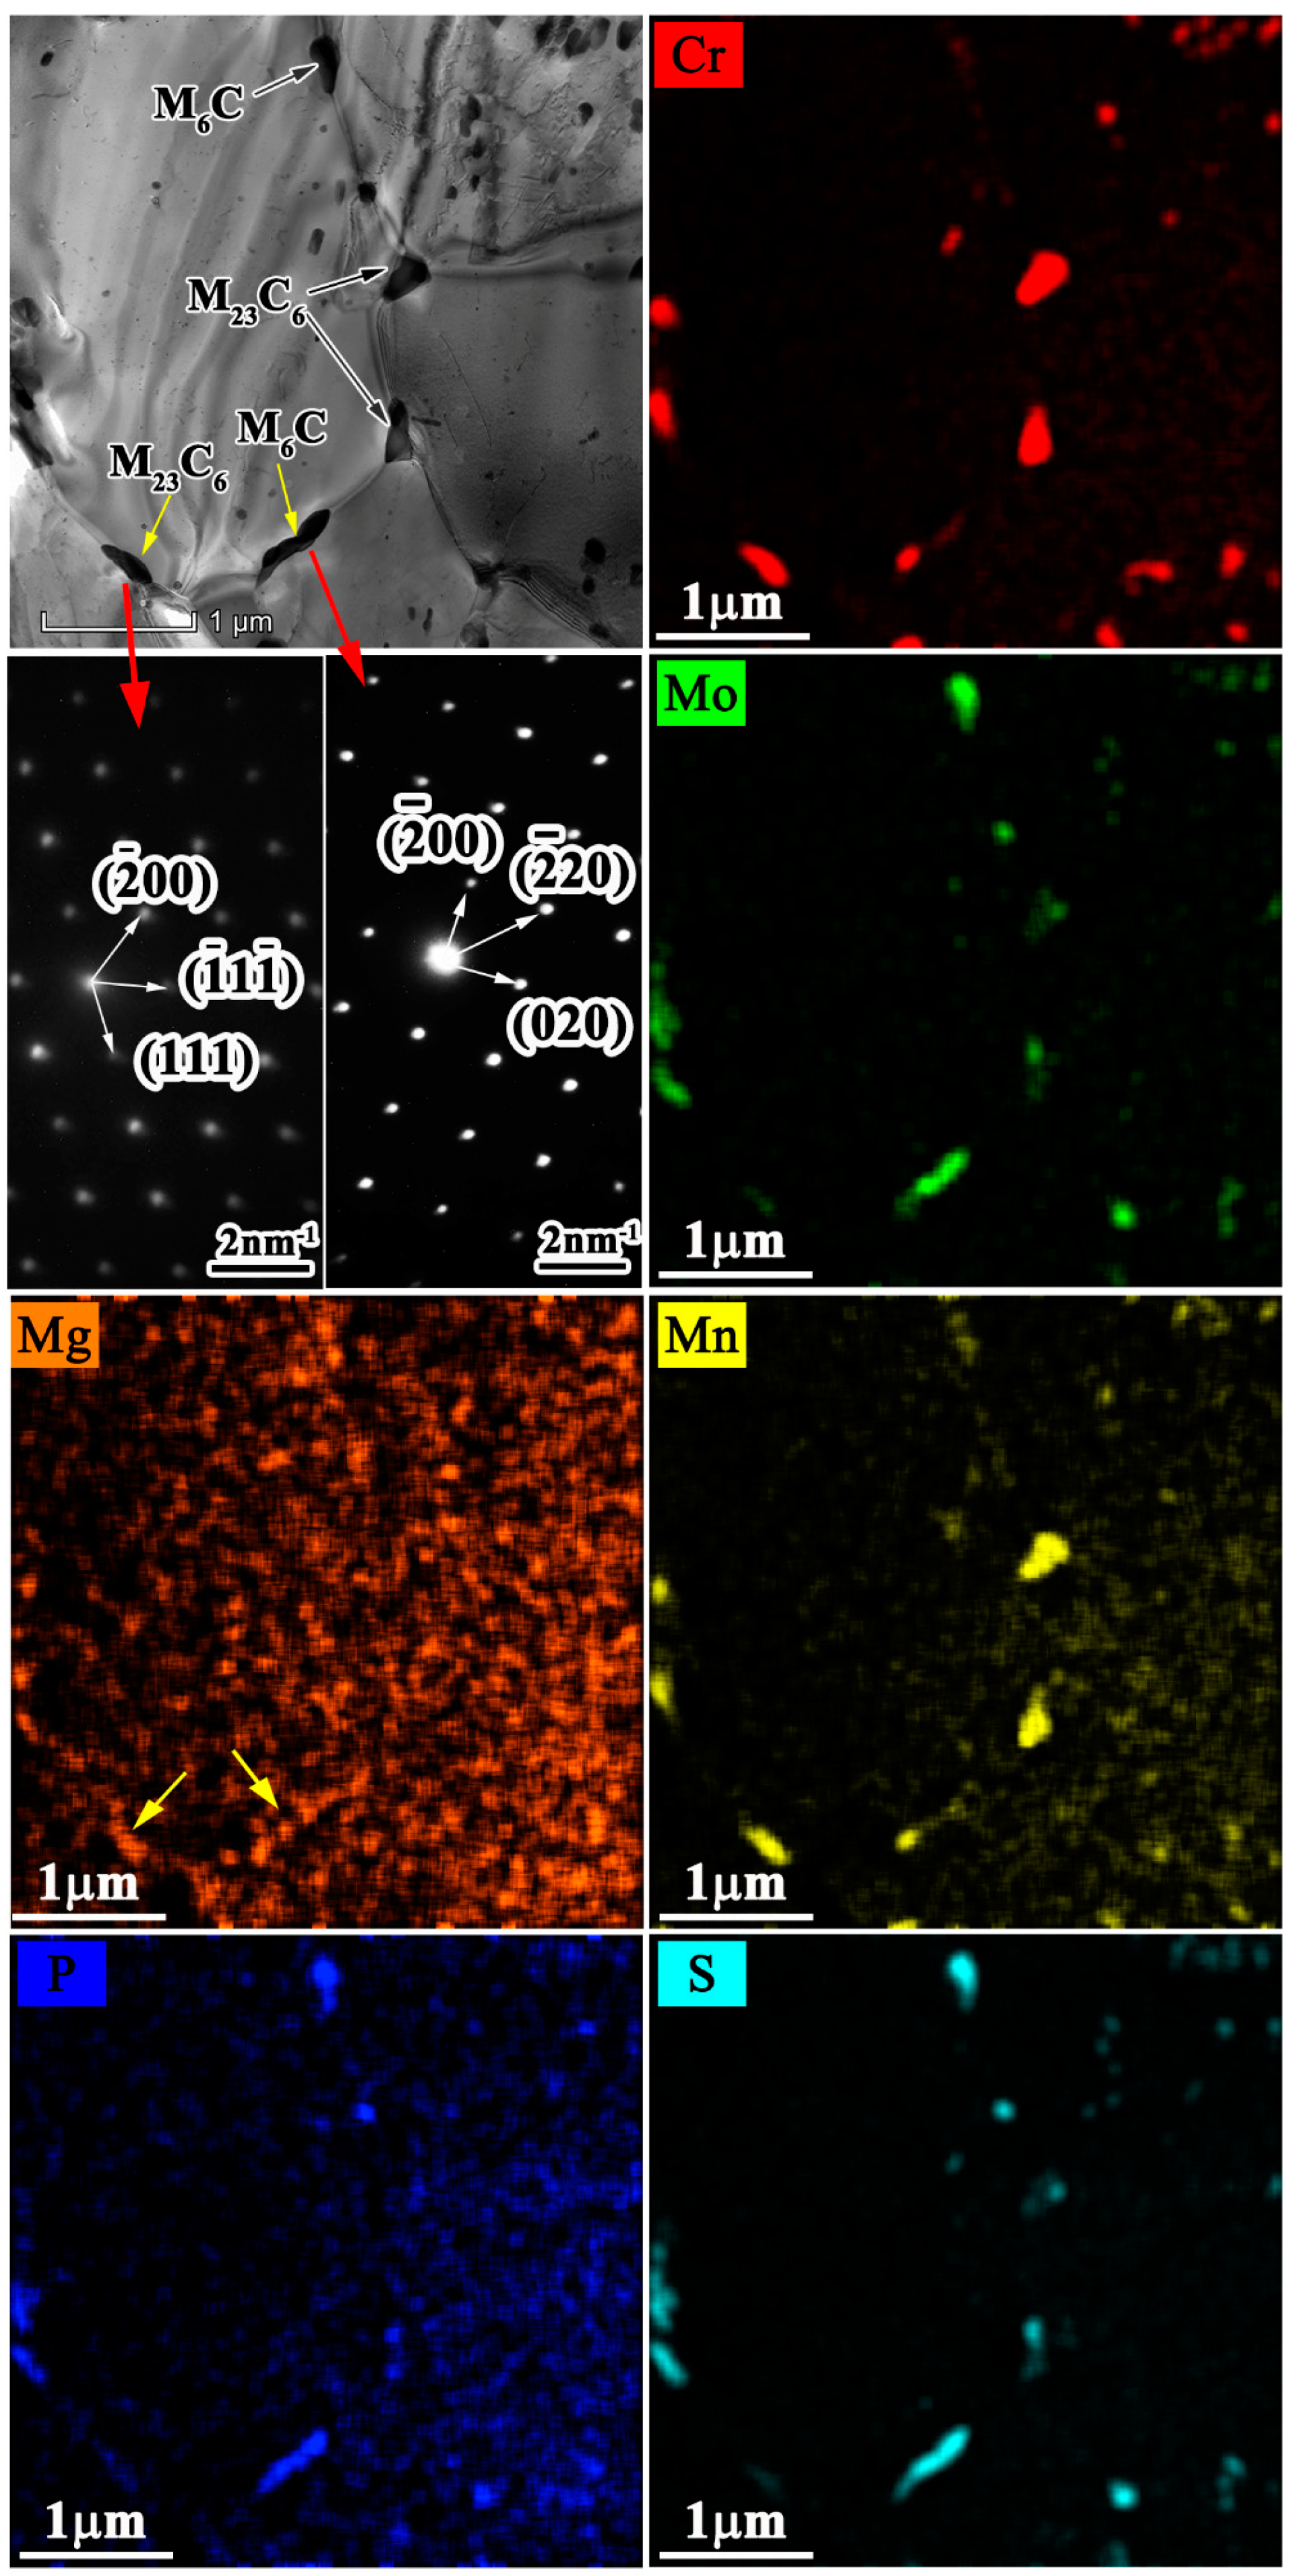
Therefore, the characteristics of carbides at grain boundary both for S1 and S2 samples were further identified with TEM. It is found that there are mainly two kinds of carbides in the grain boundaries of S1 and S2 steels, namely, M6C and M23C6. Figure 12 demonstrates the corresponding selected area electron diffraction patterns (SAED) and the lattice constant for these two kinds of carbides is determined as 1.05 nm and 1.07 nm, respectively. Considering the M23C6 and M6C carbides are all face-centered cubic (FCC) structure, and the standard lattice constants of M23C6 and M6C carbides are very similar, namely 1.06 nm and 1.084 nm, respectively. Thus, it is difficult to distinguish them only by SAED, but they can be distinguished from the element content. Based on literature reports [37,38,39], the Mo-rich element is the M6C phase, and the Cr-rich element is the M23C6 phase. Therefore, the individual type of carbides can be clarified based on the element map distributions of these two carbides (see Figure 12). It should be mentioned that, with Mg addition, the types of carbides do not change, but it is found that a small amount of Mg in the carbides of S2 steel as the arrow shown in Figure 12.
In addition, it is also found that the size of carbides in Mg-added steel is generally smaller than that of Mg-free steel as shown in Figure 13. This figure shows the typical TEM image of carbides at GB after aging 5000 h at 580 °C for S1 and S2 samples. As for the refining effect of Mg on the carbides, it can be also accepted from the other steels. For example, in high-speed tool steel, previous studies have shown that trace Mg can refine carbides, because the segregated Mg will hinder the diffusion of alloying elements, and reduce the diffusion coefficient of the elements, thereby inhibiting the growth of carbides and refining the size of carbides effect [40]. Moreover, in bearing steel, it was also proved that Mg will dissolve in the carbide changing its Fe/Cr ratio, which is conducive to the spheroidization of carbide [41]. Therefore, in this study, the refiner carbides at grain boundary in Mg-added steel could be also ascribed to the grain boundary segregation of Mg and the dissolution of Mg in carbides, and this should be another reason for the relatively high impact toughness in Mg-added steel.

5. Conclusions

(1) Adding trace Mg (60 × 10−6) can improve the impact toughness of 2.25Cr1Mo steel to a certain extent after aging at 580 °C up to 5000 h, even when the steel is doped with 0.056 wt.% P.
(2) The positive effect of Mg on the embrittlement limitation can be ascribed to the following reasons: (i) Mg addition promotes the formation of ferrite structure, which has a higher toughness value. (ii) the occurrence of grain boundary segregation of Mg may not only increase the grain boundary cohesion by stopping the formation of Fe–S or Fe–P bonds but also decrease or even inhibit the segregation amounts of P. (iii) Mg segregates at the grain boundary and exists in carbides, and it could refine the grain boundary carbides.

Author Contributions

X.D.: formal analysis, investigation, writing—original draft. X.L.: conceptualization, funding acquisition, methodology, supervision. Y.M., W.X. & K.L.: methodology, data curation. L.D.: resources. N.Z.: software. All authors have read and agreed to the published version of the manuscript.

Funding

This research was funded by the National Natural Science Foundation of China, grant number 51801210.

Institutional Review Board Statement

Not applicable.

Informed Consent Statement

Not applicable.

Data Availability Statement

The data presented in this study are available on request from the corresponding author. The data are not publicly available due to privacy.

Acknowledgments

The authors thank the National Natural Science Foundation of China for their financial support under contract No. 51801210. The authors also thank Shunnan Zhang in IMR for valuable discussions and Liping Yang in Tsinghua University for her careful analysis and testing.

Conflicts of Interest

The authors declare no conflict of interest.

References

  1. Li, B. Investigation on the pearlite spheroidizing of the 10CrMo910 steel and the rescue heat treatment technical. Hot Work. Technol. 2002, 22, 50–51. [Google Scholar]
  2. Pan, X.X. Development of Steam Generator Main Materials for Fast Reactor; World Nonferrous Metals: Chengdu, China, 2017; pp. 181–183. [Google Scholar]
  3. Xu, J.P.; Lv, B.J. Methods of preventing steel embrittlement and its application. Guide Sci. Tech. Mag. 2014, 36, 170. [Google Scholar]
  4. Song, S.H.; Wu, J.; Yuan, Z.X.; Weng, L.Q.; Xu, T.H. Non-equilibrium grain boundary segregation of phosphorus under a high applied tensile stress in a 2.25CrlMo steel. Mater. Sci. Eng. Astruct. Mater. Prop. Microstruct. Process. 2007, 486, 675–679. [Google Scholar] [CrossRef]
  5. Wang, J.; Ni, B.H.; Cai, C.; Zhang, Z. Performance degradation of 2.25Cr1Mo steel served in hydrogenation reactor. J. Mater. Eng. 2015, 43, 82–88. [Google Scholar]
  6. Cao, J.C.; Liu, C.L.; Gao, P.; Zhou, X.L.; Zhou, H. Research status and development trend of elemental segregation in steel. Iron Steel 2019, 54, 11–19. [Google Scholar]
  7. Wang, Q.J. Investigation on Impact Toughness and Step Cooling Embrittlement Law for 2.25Cr1Mo Steel Electrode Deposited Metal; China Academy of Machinery Science and Technology: Beijing, China, 2015. [Google Scholar]
  8. Shen, D.D.; Yuan, Z.X. Analysis of factors affecting the ductile-brittle transition temperature of 2.25Cr1Mo steel. J. Wuhan Univ. Sci. Technol. 2011, 34, 12–15. [Google Scholar]
  9. Liu, R.L. Phosphorus Equilibrium Grain Boundary Segregation and Its Effect on the Ductile-To-Brittle Transition Temperature for a 2.25Cr1Mo Steel; Harbin Institute of Technology: Harbin, China, 2006. [Google Scholar]
  10. Zhao, Y.; Song, S. Combined Effect of Phosphorus Grain Boundary Segregation, Yield Strength, and Grain Size on Embrittlement of a Cr-Mo Low-Alloy Steel. Steel Res. Int. 2018, 89, 6–12. [Google Scholar] [CrossRef]
  11. McMahon, C.J.; Cianelli, A.K.; Feng, H.C. The influence of Mo on P-induced temper embrittlement in Ni-Cr steel. Metall. Trans. A 1977, 8, 1055–1057. [Google Scholar] [CrossRef]
  12. Qu, Z.; McMahon, C.J. The effects of tempering reactions on temper embrittlement of alloy steels. Metall. Trans. A 1983, 14, 1101–1108. [Google Scholar] [CrossRef]
  13. Janovec, J.; Výrostková, A.; Perhácová, J.V.; Homolová, V.; Grabke, H.J.; Ševc, P.; Lucas, M. Effect of vanadium on grain boundary segregation of phosphorus in low alloy steels. Steel Res. 1999, 70, 269–273. [Google Scholar] [CrossRef]
  14. Song, S.-H.; Guo, A.-M.; Shen, D.-D.; Yuan, Z.-X.; Liu, J.; Xu, T.-D. Effect of boron on the hot ductility of 2.25Cr1Mo steel. Mater. Sci. Eng. A 2003, 360, 96–100. [Google Scholar] [CrossRef]
  15. Hong, S.; Lee, J.; Park, K.S.; Lee, S. Effects of boron addition on tensile and Charpy impact properties in high-phosphorous steels. Mater. Sci. Eng. A 2014, 589, 165–173. [Google Scholar] [CrossRef]
  16. Wu, C.J.; Tang, X.L. Grain boundary segregation of Ce, Mo and P and temper embrittlement of steel. Iron Steel 1991, 26, 31–35. [Google Scholar]
  17. Jiang, X.; Song, S. Enhanced hot ductility of a Cr–Mo low alloy steel by rare earth cerium. Mater. Sci. Eng. A 2014, 613, 171–177. [Google Scholar] [CrossRef]
  18. Bor, H.; Chao, C.; Ma, C. The influence of magnesium on carbide characteristics and creep behavior of the Mar-M247 superalloy. Scr. Mater. 1997, 38, 329–335. [Google Scholar] [CrossRef]
  19. Feng, H.; Jia, H.Y.; Song, Z.G.; Guo, H.S. Effect of mid-temperature aging on precipitation and impact toughness of 022Cr21Ni2Mn5N duplex stainless steel. J. Iron Steel Res. 2017, 29, 137–143. [Google Scholar]
  20. Li, Z.J.; Xiao, N.M.; Li, D.Z.; Zhang, J.Y.; Luo, Y.J.; Zhang, R.X. Influence of microstructure on impact toughness of G18CrMo2-6 steel during tempering. Acta Metall. Sin. 2014, 50, 777–786. [Google Scholar]
  21. Zheng, Z.J. The analysis of considerably reduction to HR3C’s aging impact ductility. Boil. Technol. 2011, 42, 46–48. [Google Scholar]
  22. Ma, D.Q.; Song, Y.H.; Zhao, X.Q.; Lang, Q.B.; Zhang, G.W. Research on impact toughness of 2.25Cr-1Mo-0.25V steel for hydrogenation forgings. J. Mater. Sci. Eng. 2020, 38, 625–628. [Google Scholar]
  23. Viswanathan, R.; Joshi, A. Effect of microstructure on the temper embrittlement of Cr-Mo-V steels. Metall. Mater. Trans. A-Phys. Metall. Mater. Sci. 1975, 6, 2289–2297. [Google Scholar] [CrossRef]
  24. Yang, Z.; Liu, Z.; He, X.-K.; Qiao, S.; Xie, C. Effect of microstructure on the impact toughness and temper embrittlement of SA508Gr.4N steel for advanced pressure vessel materials. Sci. Rep. 2018, 8, 207. [Google Scholar] [CrossRef] [PubMed] [Green Version]
  25. Han, S.Q.; Zhao, J.Q.; Wan, R.D.; Yang, G. Effect of microstructure on long-term aging stability of 2.25Cr-1Mo steel. Heat Treat. Met. 2020, 45, 11–18. [Google Scholar]
  26. Fu, G.Q.; Zhu, M.Y. Phosphorus segregation on steel grain boundary. Angang Technol. 2006, 339, 5–9. [Google Scholar]
  27. Guttmann, M.; McLean, D. Interfacial Segregation; Johnsonand, W.C., Blakely, J.M., Eds.; American Society for Metals: Karlsruhe, Germany; Metal Park, OH, USA, 1979; pp. 261–347. [Google Scholar]
  28. Kenji, A.; Shigeru, J.; Hiroshi, K. Chemical state of phosphorus segregated at grain boundaries of iron. Iron Steel Nippon Steel Corp. 1983, 69, 625–630. [Google Scholar]
  29. Yin, L.; Sridhar, S. Effects of Residual Elements Arsenic, Antimony, and Tin on Surface Hot Shortness. Met. Mater. Trans. A 2011, 42, 1031–1043. [Google Scholar] [CrossRef]
  30. Jones, R.H.; Baer, D.R.; Charlot, L.A.; Thomas, M.T. Grain boundary segregation of sulfur and antimony in iron alloys. Met. Mater. Trans. A 1988, 19, 2005–2011. [Google Scholar] [CrossRef]
  31. Seah, M. Adsorption-induced interface decohesion. Acta Met. 1980, 28, 955–962. [Google Scholar] [CrossRef]
  32. Lejček, P.; Šob, M.; Paidar, V. Interfacial segregation and grain boundary embrittlement: An overview and critical assessment of experimental data and calculated results. Prog. Mater. Sci. 2017, 87, 83–139. [Google Scholar] [CrossRef]
  33. Jia, S.J.; Qu, P.; Wen, Y.; Zhang, J.B.; Chen, H.J.; Liu, Q.Y. Research on influence of phosphorus and grain size on mechanical properties of low carbon steels. Iron Steel 2005, 40, 59–63. [Google Scholar]
  34. Zhao, Y.; Song, S.; Si, H.; Wang, K. Effect of Grain Size on Grain Boundary Segregation Thermodynamics of Phosphorus in Interstitial-Free and 2.25Cr-1Mo Steels. Metals 2017, 7, 470. [Google Scholar] [CrossRef] [Green Version]
  35. Bu, Y.; Yin, F.Z.; Hu, B.F.; Chen, X. Effect of rare-earth metal, Ca and Mg on microstructure and toughness of heat affected zone of high heat-input welding. Iron Steel 2006, 41, 71–76. [Google Scholar]
  36. Cui, T.; Lv, J.Y.; Wang, L.; Yang, H.C.; Zhao, G.P. Effect of grain boundary carbide on impact ductility of superalloy GH586. J. Iron Steel Res. 2003, 15, 24–28. [Google Scholar]
  37. Zhang, X.F.; Komizo, Y. Direct observation of thermal stability of M23C6 carbides during reheating using in situsynchrotron X-ray diffraction. Philos. Mag. Lett. 2013, 93, 9–17. [Google Scholar] [CrossRef]
  38. Tariq, F.; Naz, N.; Baloch, R.A.; Ali, A. Evolution of microstructure and mechanical properties during quenching and tempering of ultrahigh strength 0.3C Si–Mn–Cr–Mo low alloy steel. J. Mater. Sci. 2010, 45, 1695–1708. [Google Scholar] [CrossRef]
  39. Yang, Y.; Chen, Y.; Sridharan, K.; Allen, T.R. Evolution of Carbide Precipitates in 2.25Cr-1Mo Steel during Long-Term Service in a Power Plant. Met. Mater. Trans. A 2010, 41, 1441–1447. [Google Scholar] [CrossRef]
  40. Zhang, Z.; Chang, K.H.; Chang, L.Z.; Chen, J.S.; Zheng, F.Z. Effect of Mg on carbides in M2 high speed tool steel. J. Iron Steel Res. 2019, 31, 1046–1052. [Google Scholar]
  41. Lu, Q.L.; Zheng, S.B.; Qiu, X.D.; Li, Z. Effect of trace Mg in steel on carbide of bearing steel. Shanghai Met. 2008, 30, 28–32. [Google Scholar]
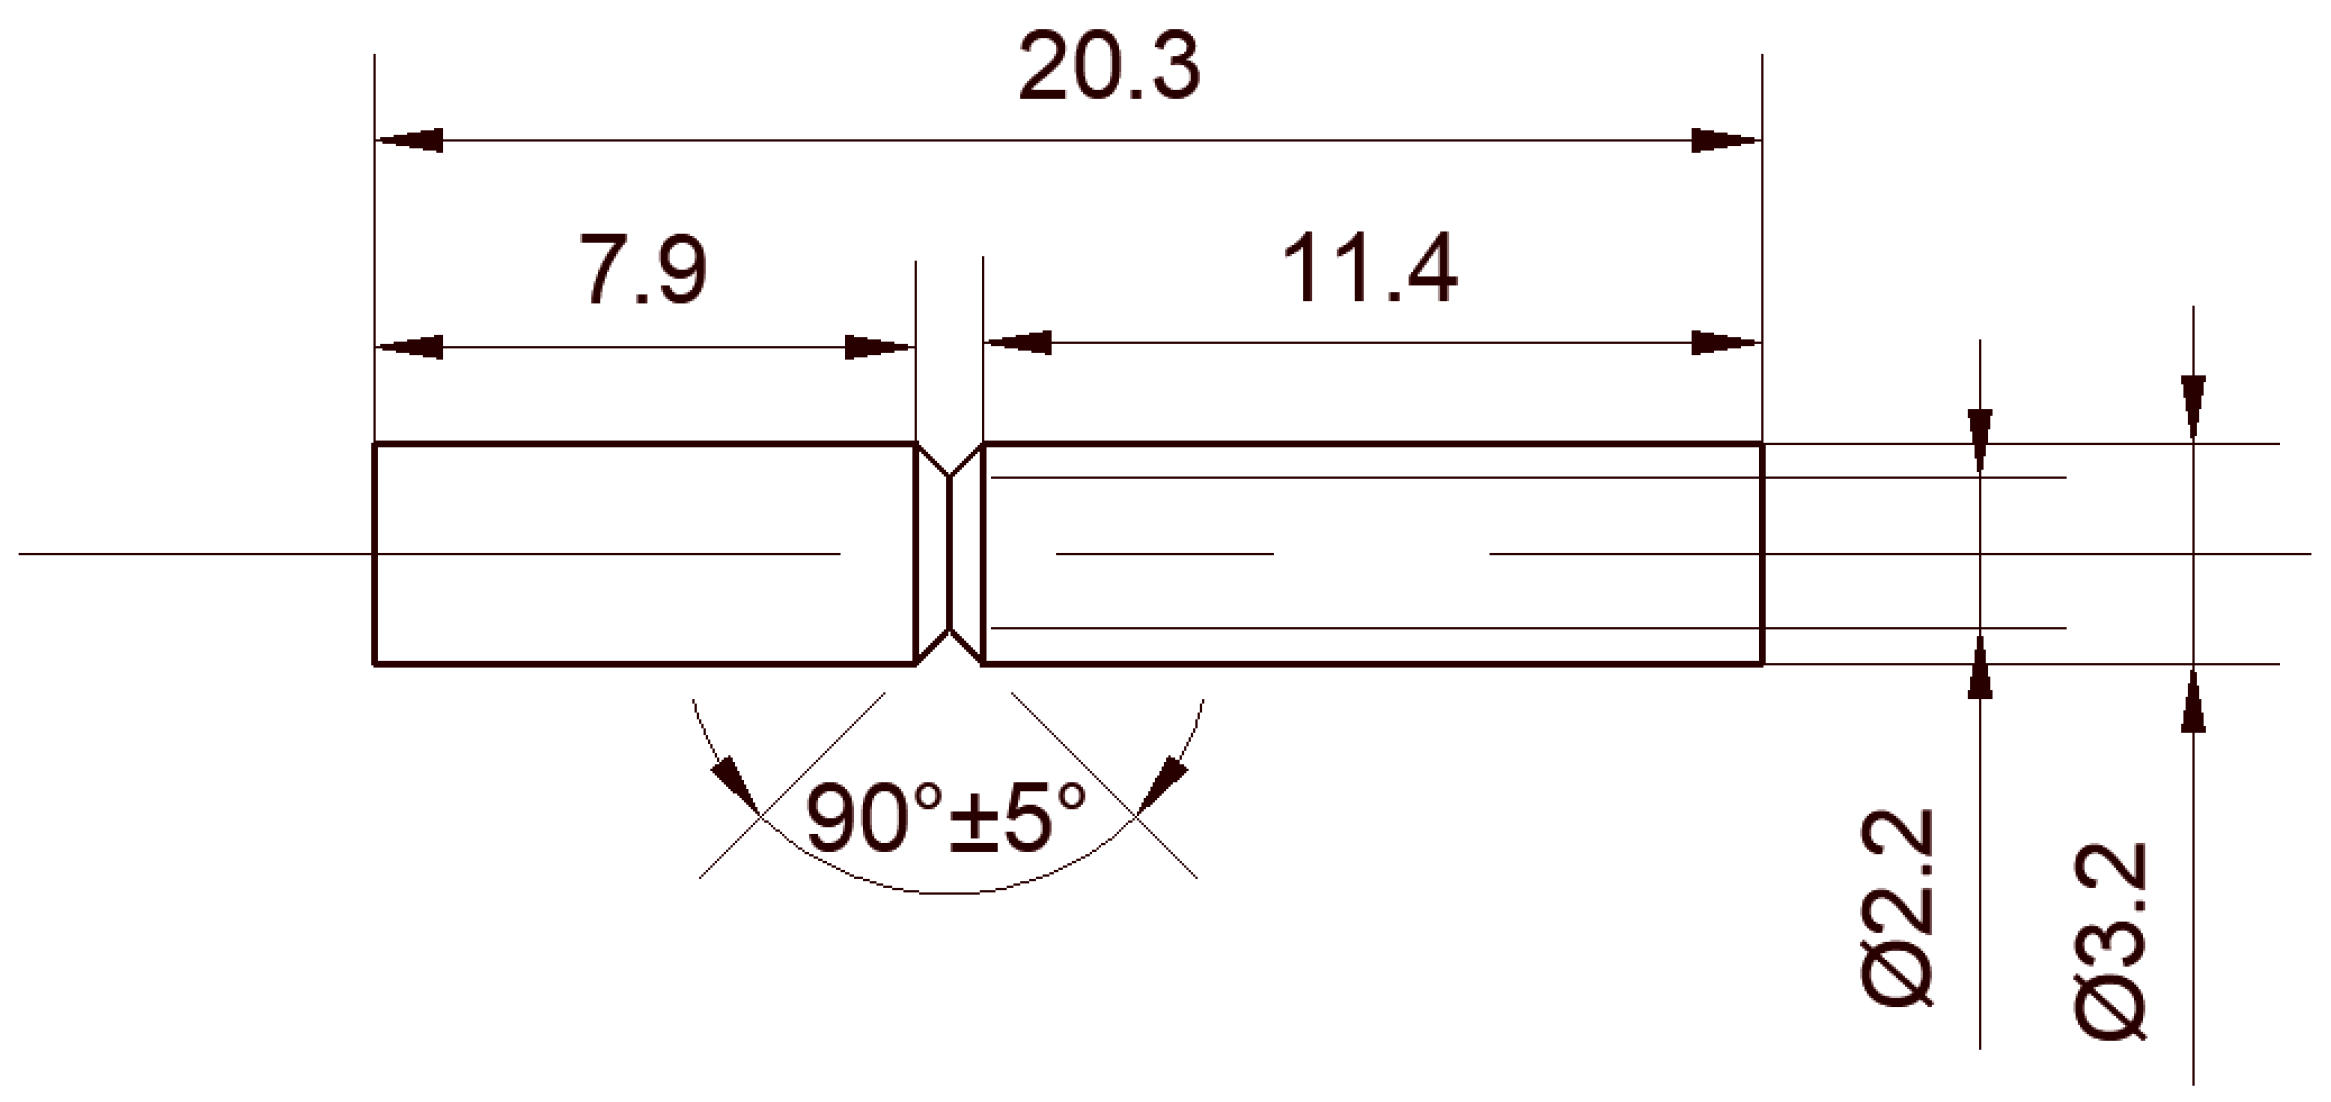
Figure 1. The shape of standard auger sample (mm).
Metals 11 00010 g001
Figure 2. Charpy impact energies of S2 and S3 samples at room temperature after aging different times.
Metals 11 00010 g002
Figure 3. Low magnification fractographs of S1 and S2 samples after Charpy impact at room temperature (a) S1 before aging; (b) S2 before aging; (c) S1 aging 97 h at 580 °C; and (d) S2 aging 97 h at 580 °C.
Metals 11 00010 g003
Figure 4. High magnification fractographs of crack-initiated area (ad) and crack growth area (eh) of S1 and S2 samples after Charpy impact at room temperature; (a,e) S1 before aging; (b,f) S2 before aging; (c,g) S1 aging 97 h at 580 °C; and (d,h) S2 aging 97 h at 580 °C.
Metals 11 00010 g004
Figure 5. Microstructure and morphology of S1 experimental steel aging for different lengths of time at 580 °C.
Metals 11 00010 g005
Figure 6. Microstructure and morphology of S2 experimental steel aging for different lengths of time at 580 °C.
Metals 11 00010 g006
Figure 7. Ferritic phase content of S1 and S2 samples aging at 580 °C for different time.
Metals 11 00010 g007
Figure 8. Hardness of S1 and S2 samples aging at 580 °C for different lengths of time.
Metals 11 00010 g008
Figure 9. Typical AES spectra of S1 (a,b) and S2 (c,d) after aging 500 h at 580 °C.
Metals 11 00010 g009
Figure 10. Typical AES spectra of S1 (a,b) and S2 (c,d) after aging 5000 h at 580 °C.
Metals 11 00010 g010
Figure 11. Original austenite grain size of S1 (a,c) and S2 (b,d), of which (c,d) depict austenite grain boundaries by the PS software for S1 and S2 sample, respectively.
Metals 11 00010 g011
Figure 12. TEM images show the element map distribution of S2 after aging 5000 h at 580 °C.
Metals 11 00010 g012
Figure 13. TEM images of carbides microstructure of S1 (a) and S2 (b) after aging 5000 h at 580 °C.
Metals 11 00010 g013
Table 1. Chemical composition of the steels.
No.CCrMoMnTiNiCaPSOMgFe
S1 (wt.%)0.122.221.010.510.060.88<0.0010.0500.00150.0005-Bal.
S1 (at.%)0.5592.3860.5880.5170.0670.834<0.0010.0900.003490.00105-Bal.
S2 (wt.%)0.112.120.970.490.050.84<0.0010.0560.0020.00030.006Bal.
S2 (at.%)0.5122.2790.5650.4980.0560.796<0.0010.1010.00340.001050.0139Bal.
Table 2. Proportion of crack-initiated area.
-S1S2
No-aged25.3 ± 2.1%30.9 ± 1.8%
Aged 97 h12.1 ± 2.4%16.2 ± 1.5%
Table 3. Grain boundary segregation number of elements of P, S, Mg, and Ca in S1 and S2 samples aged at 580 °C for different time.
Aging Time/hSegregated Number of Elements for S1Segregated Number of Elements for S2
PSCaPSCaMg
0 (at.%)ND 1NDNDNDNDND3.68 ± 0.47
0 (wt.%)ND 1NDNDNDNDND1.64 ± 0.21
500 (at.%)2.35 ± 0.761.27 ± 0.63ND0.55 ± 0.421.88 ± 0.54ND6.70 ± 1.02
500 (wt.%)1.32 ± 0.430.74 ± 0.37ND0.32 ± 0.241.13 ± 0.32ND3.06 ± 0.47
5000 (at.%)1.12 ± 0.212.07 ± 0.8012.48 ± 8.6ND2.60 ± 0.58ND5.12 ± 1.26
5000 (wt.%)0.56 ± 0.111.25 ± 0.489.42 ± 6.49ND1.56 ± 0.35ND2.32 ± 0.57
1 “ND” represents no detected.
Publisher’s Note: MDPI stays neutral with regard to jurisdictional claims in published maps and institutional affiliations.