1. Introduction
With the continuous development of lightweight technology, aluminum alloy materials are being more widely used in automotive, aerospace and other fields than ever before. This is because of the low density, high specific strength and corrosion resistance of aluminum alloy materials. However, when compared with steel materials, aluminum alloy demonstrates poor plasticity at room temperature, as well as difficulties for pressing a body panel with a complex shape. In addition, defects such as spring-back and fracture are prone to occur after the sheet metal stamping process. In many cases, it is difficult to guarantee the dimensional accuracy of parts, and the qualification rate of parts processed is comparatively low, which production costs [
1].
Warm metal forming generally refers to the forming process in which the material is heated to a temperature below the dynamic recovery or recrystallization temperature through the heat transfer of the furnace or die. Under the warm forming condition, the elongation of the aluminum alloy sheet can reach levels between 20% and 25%, the strength of stamping parts increases, the spring-back decreases and the forming accuracy improves [
2]. According to the temperature between the sheet metal and the die, warm forming can be divided into isothermal forming and non-isothermal forming. In the process of isothermal forming, the temperatures of the sheet metal and the die remain basically the same, which can improve the plasticity of the sheet metal and the uniform distribution of the wall thickness of parts. However, the warm forming process imposes higher demands on equipment, resulting in increased production cost and difficulty, and the anti-concave performance of parts can be poor. In the non-isothermal forming process, there is a specific temperature difference between the sheet metal and the die. During the stamping process, heat is transferred between the sheet metal and the die. The temperature of the sheet metal changes in real time, so it is widely used in the actual production process [
3]. El Fakir et al. [
4] put forward a new integrated processing technology that combines warm forming and heat treatment, called solution heat treatment forming cold die quenching, which can realize synchronous forming and quenching. This effectively solves the difficult problem of complex part processing while ensuring the plasticity of aluminum alloy.
Finch and Wilson et al. [
5,
6] carried out experimental research on aluminum alloy after annealing and tempering in a cylinder and square box. The results showed that the drawing properties of the aluminum alloy sheet were improved at 200 °C, and the shape of the formed parts had no effect on the sheet properties. Ayres and Wenner [
7] studied the influence of forming temperature and punch speed on the forming limit of 5182 aluminum alloy through a punch bulging experiment. It was found that the forming limit of the sheet metal increased significantly with the increase in temperature and decrease in punch speed, and the results showed the strain distribution of the material tended to be within a reasonable range. D. Li et al. [
8] studied the mechanical properties of 5182, 5754 and 6111 aluminum alloys at different temperatures and strain rates through a uniaxial tensile test. The results showed that the elongation of the sheet metal increased, corresponding to the increase in temperature and the decrease in strain rate, and the effect of temperature on the strain rate sensitivity coefficient was more pronounced. V.M. Simões [
9] reported that the punch speed had a significant influence on the success of the sheet metal warm forming of aluminum alloys, and formability and spring-back remained stable or improved with the increase in punch speed.
Lee et al. [
10] also studied the influence of lubricant viscosity and surface roughness on the friction coefficient, established a friction model and calculated the relationship between the friction coefficient, lubricant viscosity and surface roughness by the least squares method. The Equation is as follows:
where
ν is the lubricant viscosity and
λ is the surface roughness.
IM.Y.T. et al. [
11] modified the classical Coulomb friction model by using the finite element method and an arctangent function and introduced the relative slip velocity. The modified model can maintain continuous friction stress on the boundary, and its shear friction model is as follows.
Y.Z. Zhao et al. [
12] studied the relationship between load and the friction coefficient under boundary lubrication conditions and established a variable friction coefficient model based on different interface loads.
S.S. Dou [
13] studied the influence of sliding speed and interface load on the friction coefficient under the boundary lubrication condition and established a comprehensive variable friction coefficient model with variable speed and variable load:
where
P is the interface load and
v is the sliding speed.
Currently, there is no singular conclusion about the friction problem in the warm forming of aluminum alloy, as the stamping process for an aluminum alloy sheet is a highly nonlinear changing process, and the friction behavior between aluminum alloy and the die is exceedingly complex. It is important to study the friction characteristics of aluminum alloy warm forming to improve the accuracy of CAE (Computer Aided Engineering) simulation. The influence of the initial forming temperature, positive pressure (normal load) and sliding speed on the friction coefficient between 6111 aluminum alloy and an H13 die steel surface was investigated by using a CFT-I multifunctional material surface comprehensive performance tester (Zhongke Kaihua Technology Development Co., Ltd., Lanzhou, China) under boundary lubrication conditions. The surface morphology of 6111 aluminum alloy after a friction experiment with H13 die steel was observed and analyzed using a microscope. The influence law of multiple factors on the friction coefficient under different conditions was analyzed, leading to a friction model being established. In addition, the model of the variable friction coefficient was also established through experimentation, which is proved to improve simulation accuracy.
4. Discussion
In order to test the effectiveness of the variable friction model in predicting the numerical simulation of sheet metal stamping, the friction model was inputted into the DYNAFORM 5.9 software (ETA CO, US) to simulate the thickness distribution within the U-bending part. For the spring-back analysis of hot stamping, “6*MAT_THERMAL_ISOTROPIC_TD_LC” was selected as the material models of the sheet and tooling, which are non-isothermal analysis models.
Under the warm forming condition, the stamping speed is 2000 mm/s, the blank holder force is 30 KN and the friction coefficient is 0.12. The friction coefficient is set as the variable friction coefficient model and input with the table. The friction of the blank holder is controlled by the variable friction coefficient model for the load, and the friction between the sheet metal and the punch and die is controlled by a variable friction coefficient model for the speed. The simulation process parameters are shown in
Table 5.
The lubrication state of the material can be divided into fluid lubrication (
μ ≤ 0.03), mixed lubrication (0.03 <
μ ≤ 0.1), boundary lubrication (0.1 <
μ < 0.3) and dry friction (
μ > 0.3). During the actual stamping process, most of the sheet metal interface friction states are boundary lubrication and mixed lubrication. Two groups of constant friction coefficient and variable friction coefficient modified friction models with a friction coefficient of 0.08 (mixed lubrication) and an optimal combination friction coefficient of 0.12 (boundary lubrication) were selected for the simulation. The simulated thickness distributions of the U-bend under different friction coefficients are shown in
Figure 9.
The warming stamping U-bend part test device was developed by the metal forming Laboratory of Jiangsu University, and it includes a temperature detection and control system, induction-heating furnace, U-shaped hot stamping die with water cooling, a hydraulic press, etc., as shown in
Figure 10b. The hot stamping temperature control system collects the sheet temperature and die surface temperature warming by using an infrared thermometer, and it controls the temperature by water cooling. After being heated by the induction furnace, it is quickly sent to the hot die.
The working parts of the die are made of H13 steel and do not need to be heated, and there is a cooling water pipe for cooling, as shown in
Figure 10a. The speed and load of die movement are controlled by a hydraulic press.
The U-bend warming stamping parts are shown in
Figure 11a. The thickness of the actual stamping parts was measured through the use of an ultrasonic thickness gauge, and the measuring point was the symmetrical center of the sheet width direction. The distribution curves of the plate thickness were determined by the constant friction coefficient, and the modified friction model and test are shown in
Figure 11b.
Under an optimal combination of process parameters, when the stamping speed is 20 mm/s and the blank holder force is 30 KN, a constant friction coefficient of 0.12 and the variable friction coefficient model were selected to simulate the warm forming of 6111 aluminum alloy, and the spring-back of the U-bend was measured (diagrams of the spring-back angle and measurement are shown in
Figure 12). In order to reduce the measurement error of the actual spring-back angle, the average values of five actual U-bend parts were taken as the effective spring-back angle. According to the above measurements and calculation formula of the variable friction coefficient model, the spring-back angles Δθ
1 and Δθ
2 of the actual stamping parts were 6.5° and −6.8°. The spring-back angle reflects the spring-back deformation degree of parts after warm forming. In the post-processing of DYNAFORM, the spring-back angle under the constant friction coefficient and variable friction coefficient model were measured. The measurement results are shown in
Table 5.
As seen in
Table 6 the predicted values of the spring-back angles Δθ
1 and Δθ
2 based on the constant friction coefficient model were 5.2° and 5.9°, and the errors between the predicted value of the spring-back angle and the actual stamping measurement were 20% and 9.2%. The predicted values of the spring-back angles Δθ
1 and Δθ
2 were −5.4° and −6.2°, respectively, obtained by using the modified friction model, and the errors between them and the actual stamping measurement were 9.2% and 8.8%.
Therefore, the prediction of the spring-back angle of sheet metal forming based on the modified friction model is closer to the actual measurement results and can reflect the characteristics of sheet metal forming more realistically.
5. Conclusions
The effects of temperature, sliding speed and normal load on friction and wear properties resulting from friction between 6111 aluminum alloy and H13 die steel were studied by using a CFT-I friction tester under different lubrication conditions. The surface morphology of 6111 aluminum alloy under different experimental conditions was observed and analyzed through an optical microscope, and the influence mechanism of different experimental parameters affecting the friction coefficient was studied from a microscopic perspective. From the analysis of experimental data, variable friction coefficient models based on sliding speed and normal load were established using the Origin software, and the validity of the models was verified. The conclusions are as follows.
(1) Under different process parameters, the friction coefficient shows rapid fluctuation during the running-in stage and relatively stable levels of fluctuation in the later stage. With the increase in time, the friction coefficient first increases sharply and then decreases to a relatively stable state.
(2) The friction coefficient increases with the increase in temperature, from room temperature to 200 °C, and the increasing trend of the friction coefficient becomes slower with the continuous increase in temperature; the influence of different temperatures on the hardness of 6111 aluminum alloy is not pronounced. According to the observation of surface micro-morphology, the number of furrows on the 6111 aluminum alloy surface is limited, the surface is relatively smooth and the surface morphology is better at 200 °C.
(3) When the temperature is 200 °C and the load is 20 N, the friction coefficient decreases with the increase in sliding speed. According to the analysis, the variable friction coefficient model of sliding speed was established, and the errors of the model are all less than 8%, which shows the effectiveness of the variable friction coefficient model.
(4) The results show that the friction coefficient decreases with the increase in normal load when the temperature is 200 °C and the sliding speed is 30 mm/s. When the interface load is greater than 30 N, the decreasing trend gradually slows down. The morphology observations show that with the increase in the interface load, the scratches on the surface of 6111 aluminum alloy clearly increase and deepen, and surface exfoliation occurs.
(5) With the optimal process parameters, a stamping simulation of typical U-bending parts was carried out by using finite element analysis software and the variable friction coefficient model established by the friction test. The thickness distribution simulation results under a mixed lubrication state and a boundary lubrication state were compared with the actual U-shaped stamping parts. Through the comparison of thickness distribution, it is observed that the simulation results for the thickness distribution based on the variable friction coefficient model are close to the actual measured values. Through the analysis of the spring-back angle, it is also observed that the spring-back measurement error of the variable friction coefficient model is smaller than that of the constant friction coefficient model. Therefore, the variable friction coefficient model improves simulation accuracy.
Author Contributions
Conceptualization, S.D.; methodology, S.D.; software, S.D.; advisors, X.W. and L.W.; formal analysis, J.X.; data curation, S.D.; writing—original draft preparation, S.D.; writing—review and editing, S.D.; funding acquisition, J.X. All authors have read and agreed to the published version of the manuscript.
Funding
National Natural Science Foundation of China: 51505408.
Conflicts of Interest
The authors declare no conflict of interest.
References
- Hosseini-Tehrani, P.; Nikahd, M. Two materials S-frame representation for improving crashworthiness and lightening. Thin Walled Struct. 2006, 44, 407–414. [Google Scholar] [CrossRef]
- Kim, H.-J.; McMillan, C.; Keoleian, G.A. Greenhouse gas emissions payback for lightweighted vehicles using aluminum and high-strength steel. J. Ind. Ecol. 2010, 14, 929–946. [Google Scholar]
- Unbo, J.; Anders, U. A parametric study for the structural behavior of a Light-weight deck. Eng. Struct. 2004, 26, 963–977. [Google Scholar]
- Fakir, E.; Omer, D.S.; Stone, I. Solution heat treatment, forming and in-die quenching of a commercial sheet magnesium alloy into a complex-shaped component: Experimentation and FE simulation. Key Eng. Mater. 2014, 622, 596–602. [Google Scholar] [CrossRef]
- Finch, D.M.; Wilson, S.P.; Dorn, J.E. Deep drawing aluminum alloy at elevated temperatures part I-deep drawing cylindrical cups. Trans. ASM 1946, 1, 254–289. [Google Scholar]
- Finch, D.M.; Wilson, S.P.; Dorn, J.E. Deep drawing aluminum alloy at elevated temperatures part II-deep drawing boxes. Trans. ASM 1946, 1, 290–310. [Google Scholar]
- Ayres, R.A.; Wenner, M.L. Strain and strain-rate hardening effects in punch stretching of 5182-0 aluminum at elevated temperatures. Metall. Trans. 1979, 10, 41–46. [Google Scholar] [CrossRef]
- Li, D.; Ghosh, A. Tensile deformation behavior of aluminum alloys at warm forming temperatures. Mater. Sci. Eng. A 2003, 352, 279–286. [Google Scholar] [CrossRef]
- Simões, V.M.; Oliveira, M.C.; Laurent, H.; Menezes, L.F. The punch speed influence on warm forming and springback of two Al-Mg-Si alloys. J. Manuf. Process. 2019, 38, 266–278. [Google Scholar] [CrossRef]
- Lee, B.H.; Keum, Y.T.; Wagoner, R.H. Modeling of the friction caused by lubrication and surface roughness in sheet metal forming. J. Mater. Process. Technol. 2002, 130, 60–63. [Google Scholar] [CrossRef]
- Im, Y.T.; Kang, S.H.; Cheon, J.S. Finite element investigation of friction condition in a backward extrusion of aluminum alloy. Trans. ASME J. Manuf. Sci. Eng. 2003, 125, 378–383. [Google Scholar] [CrossRef]
- Zhao, Y.Z.; Wang, K.; Wang, W.R.; Wei, X.C. Application of variable friction coefficient model in forming of advanced high-strength steel. J. Shanghai Jiaotong Univ. 2015, 49, 1446–1451. [Google Scholar]
- Dou, S.S.; Xia, J.S. Analysis of sheet metal forming (stamping process): A study of the variable friction coefficient on 5052 aluminum alloy. METALS 2019, 9, 853. [Google Scholar] [CrossRef]
- ISO 12004-2:2008. Metallic Materials—Sheet and Strip—Determination of Forming-Limit Curves—Part 2: Determination of Forming-Limit Curves in the Laboratory; ICS: Geneva, Switzerland, 2008. [Google Scholar]
- Yoshikiyo, T.; Toru, I.; Ken-ichi, M. FE forming analysis with nonlinear friction coefficient model considering contact pressure, sliding velocity and sliding length. J. Mater. Process. Technol. 2016, 227, 161–168. [Google Scholar]
- Erding, W.; Renbo, S.; Xiong, W.M. Effect of tempering temperature on microstructuresand wear behavior of a 500 HB grade wear-resistant steel. Metals 2019, 9, 45. [Google Scholar]
- Zhang, D.H.; Bai, D.P.; Liu, J.B. Formability Behaviors of 2a12 thin-wall part based on dynaform and stamping experiment. Compos. Part B Eng. 2013, 55, 591–598. [Google Scholar] [CrossRef]
- Boyer, H.E. Atlas of Stress-Strain Curves; ASM International: Cleveland, OH, USA, 2002; p. 235270. [Google Scholar]
- Schey, J. Tribology in Metalworking: Lubrication, Friction and Wear; American Society for Metal: Metal Park, OH, USA, 1983; pp. 125–150. [Google Scholar]
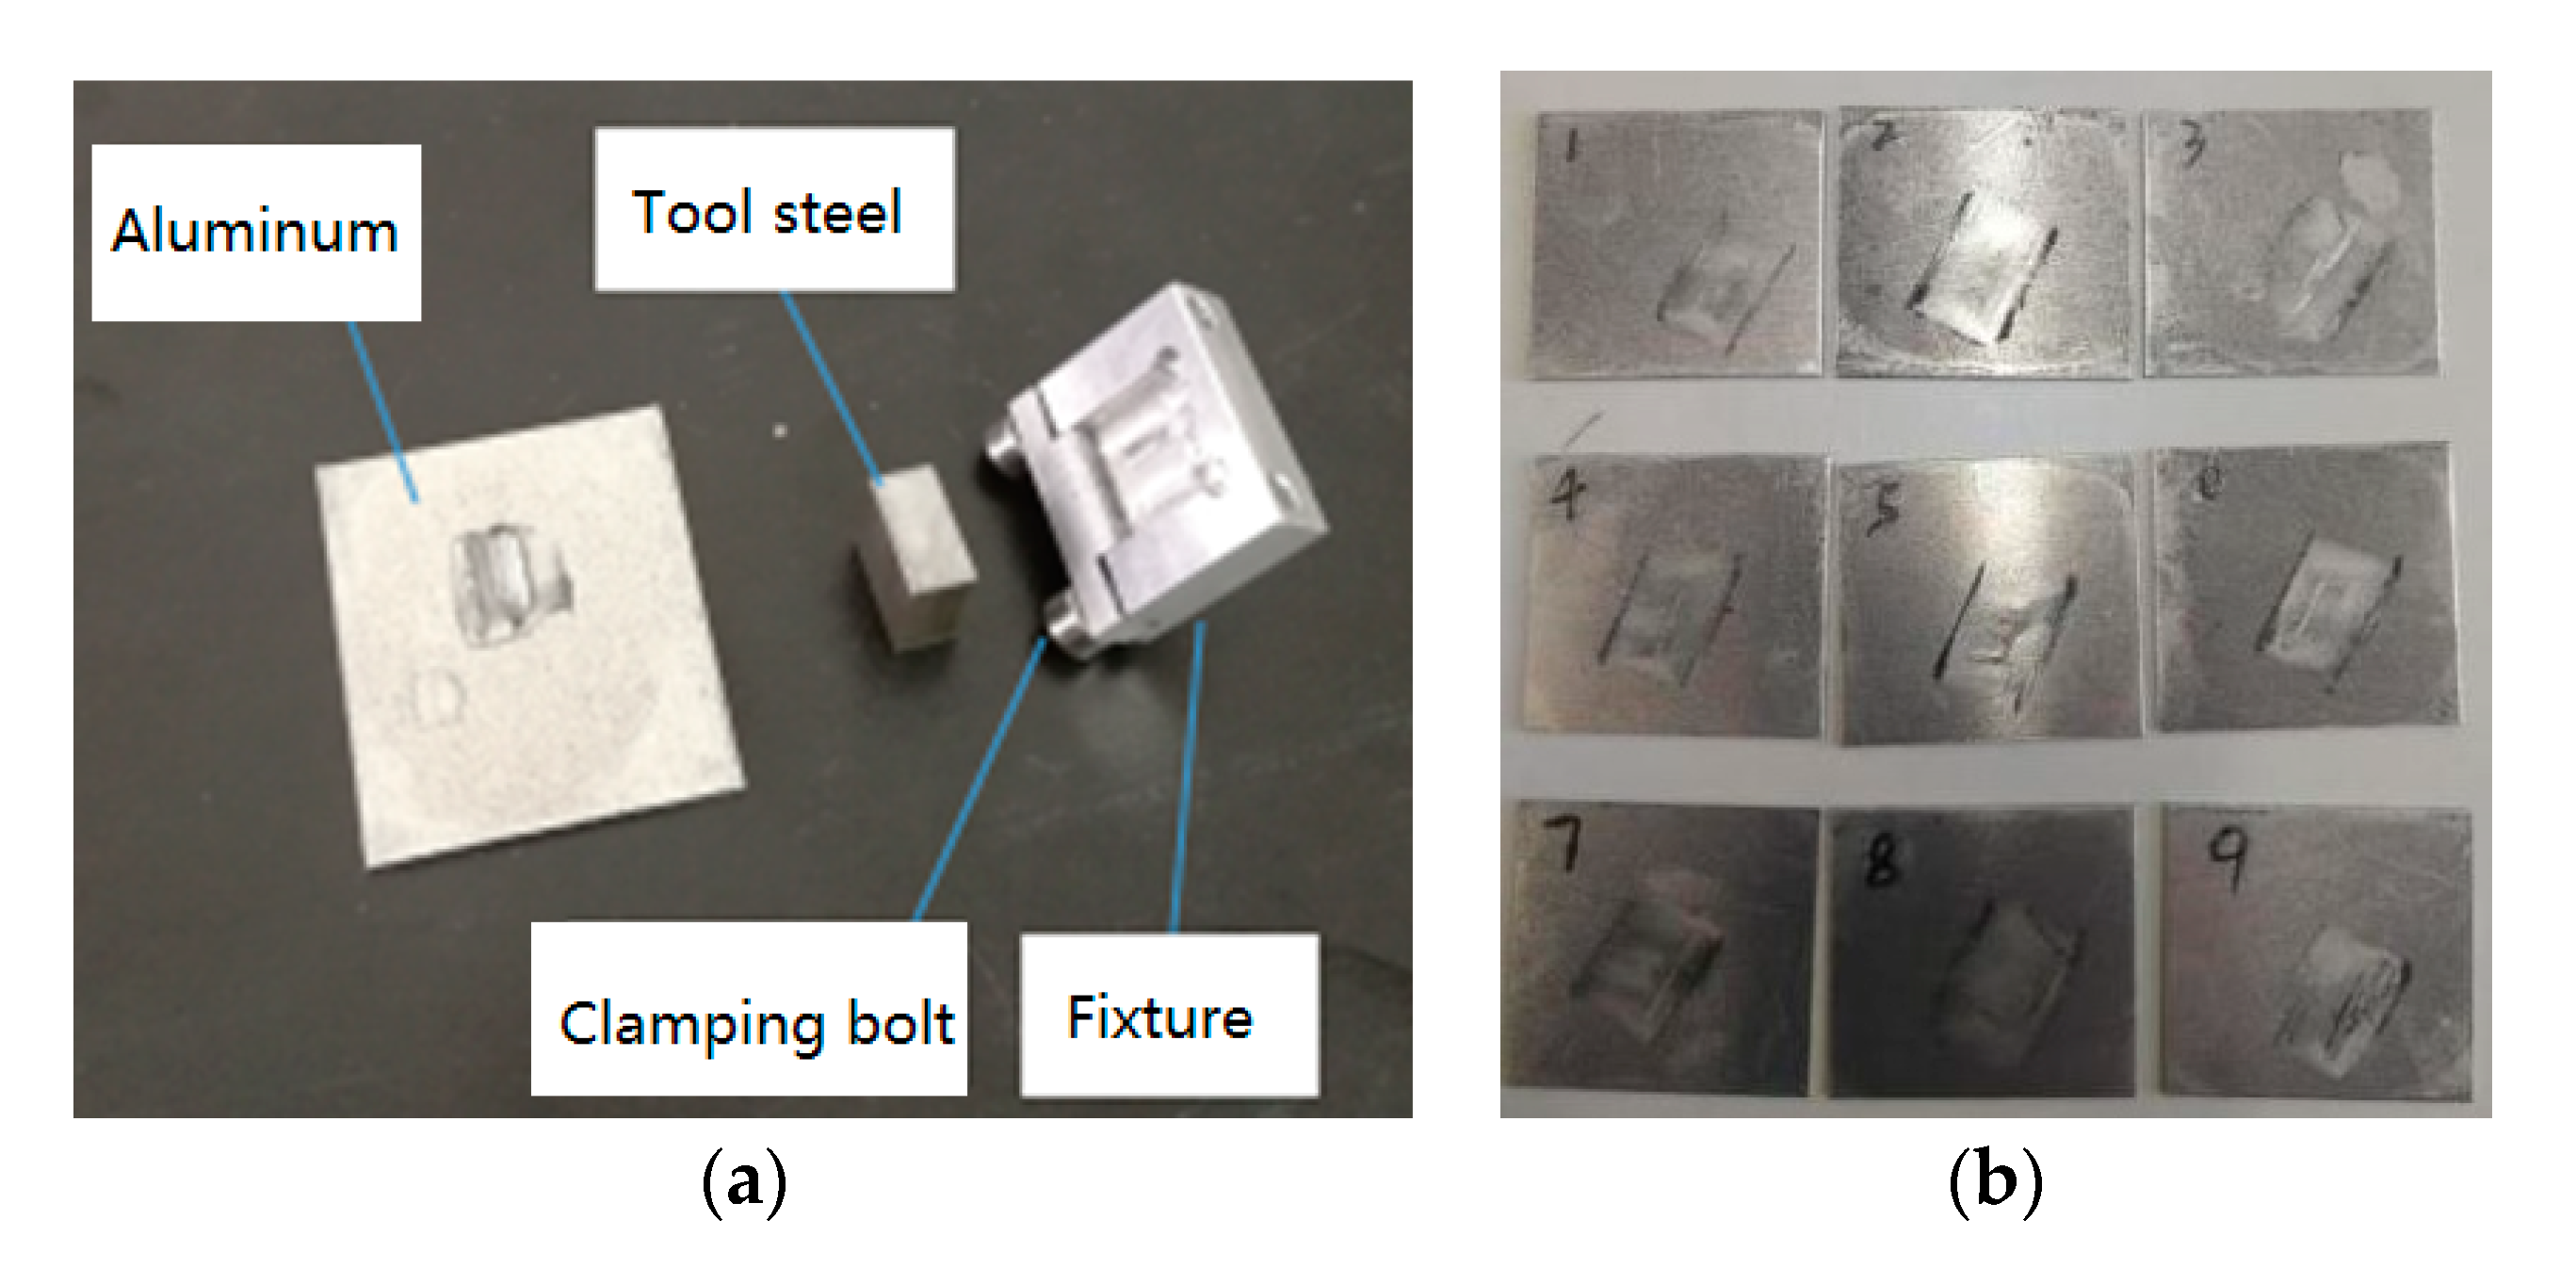
Figure 1.
Diagram of the friction test sample. (a) Friction objects; (b) Aluminum plate samples.
Figure 2.
CFT-I multifunctional material surface comprehensive performance tester. (a) Disk–pin friction test principle; (b) Temperature control table.
Figure 3.
The fluctuation curve of the friction coefficient with sliding stroke in boundary lubrication: (a) Variation curves of the friction coefficient with time under different temperatures; (b) Experimental friction coefficients at different temperatures.
Figure 4.
Surface morphology at different temperatures. (a) T = 25 °C; (b) T = 100 °C; (c) T = 150 °C; (d) T = 200 °C; (e) T = 250 °C; (f) Original sheet.
Figure 5.
The fluctuation curve of the friction coefficient according to sliding speed: (a) Variation curves of the friction coefficient over time under different speeds; (b) Experimental friction coefficients under different speeds; (c) Inverse function fitting curve.
Figure 6.
Surface morphology under different sliding speeds. (a) 20 mm/s; (b) 30 mm/s; (c) 50 mm/s; (d) 60 mm/s.
Figure 7.
Friction coefficient curve under different loads: (a) Variation curves of the friction coefficient over time under different loads; (b) Experimental friction coefficients at different loads; (c) Fitting curve of the friction coefficient with load.
Figure 8.
Surface morphology under different normal loads: (a) 10 N; (b) 20 N; (c) 40 N; (d) 50 N.
Figure 9.
Thickness distributions under different friction coefficients of U-bending. (a) μ = 0.08; (b) μ = 0.12; (c) Variable friction coefficient model.
Figure 10.
Friction coefficient curve under different loads and function fitting curve: (a) Warming stamping mold; (b) Test device for hot stamping U-shaped parts.
Figure 11.
Friction coefficient curve under different loads and function fitting curve: (a) Warming stamping mold; (b) U-bend parts and thickness measurement; (c) Thickness distribution curve under different conditions.
Figure 12.
Friction coefficient curve under different loads and function fitting curve: (a) Spring-back angle; (b) True spring-back measurement.
Table 1.
Chemical composition of 6111 aluminum alloys (wt.%), data from [
14].
| Components | Si | Fe | Cu | Mg | Zn | Ti | Cr | Mn | Al |
|---|
| Mass fraction | 0.75 | 0.40 | 0.50–0.90 | 0.70 | 0.10 | 0.10 | 0.10 | 0.15–0.45 | 96.5–97.2 |
Table 2.
Parameter settings of 6111 aluminum alloy for the friction test.
| Sheet Temperature (°C) | Load Fz (N) | Sliding Speed Vx (mm/s) | Running Stroke L (mm) | Contact Conditions |
|---|
| 25 | 10 | 20 | 5 | Boundary lubrication |
| 100 | 20 | 30 | 5 |
| 150 | 30 | 40 | 5 |
| 200 | 40 | 50 | 5 |
| 250 | 50 | 60 | 5 |
Table 3.
Friction coefficient measurement and function model prediction.
| Speed (mm/s) | 15 | 25 | 35 | 55 | 70 |
|---|
| μ1 (measured value) | 0.194 | 0.145 | 0.112 | 0.082 | 0.073 |
| μ2 (calculated value) | 0.188 | 0.143 | 0.116 | 0.084 | 0.07 |
| Error rate (%) | 3.09 | 1.38 | 3.57 | 2.44 | 4.11 |
Table 4.
Friction coefficient measurement and function model prediction.
| Load (N) | 15 | 25 | 45 | 55 | 65 |
|---|
| μ1 (Measured value) | 0.138 | 0.125 | 0.115 | 0.108 | 0.104 |
| μ2 (Calculated value) | 0.148 | 0.134 | 0.120 | 0.115 | 0.112 |
| Error rate (%) | 7.25 | 8.57 | 4.26 | 6.90 | 7.50 |
Table 5.
The simulation process parameters.
| Sheet Temperature (°C) | Holding Time
(min) | Tooling Temperature (°C) | Transfer Time
(s) | Blank Holder Force
(KN) | Punch Pressure
(MPa) | Punch Speed
(mm/s) |
|---|
| 200 | 4 | 60 | 3 | 30 | 3.0 | 20 |
Table 6.
Comparison of simulation and test results of the rebound angle.
| Spring-Back/(°) | Δθ1 | Δθ2 |
|---|
| True value | 6.5 | −6.8 |
| Constant friction coefficient | 5.2 (Error, 20%) | −5.4 (Error, 20.6%) |
| Variable friction coefficient | 5.9 (Error, 9.2%) | −6.2 (Error, 8.8%) |
© 2020 by the authors. Licensee MDPI, Basel, Switzerland. This article is an open access article distributed under the terms and conditions of the Creative Commons Attribution (CC BY) license (http://creativecommons.org/licenses/by/4.0/).


