Article

Machine Learning Enabled Prediction of Stacking Fault Energies in Concentrated Alloys

Department of Mechanical Engineering, University of Wyoming, Laramie, WY 82071, USA
*
Author to whom correspondence should be addressed.
Metals 2020, 10(8), 1072; https://doi.org/10.3390/met10081072
Submission received: 13 July 2020 / Revised: 5 August 2020 / Accepted: 7 August 2020 / Published: 9 August 2020

Abstract

:
Recent works have revealed a unique combination of high strength and high ductility in certain compositions of high-entropy alloys (HEAs), which is attributed to the low stacking fault energy (SFE). While atomistic calculations have been successful in predicting the SFE of pure metals, large variations up to 200 mJ/m2 have been observed in HEAs. One of the leading causes of such variations is the limited number of atoms that can be modeled in atomistic calculations; as a result, due to random distribution of elements in HEAs, various nearest neighbor environments may not be adequately captured in small supercells resulting in different SFE values. Such variation further increases with the increase in the number of elements in a given composition. In this work, we use machine learning to overcome the limitation of smaller system sizes and provide a methodology to significantly reduce the variation and uncertainty in predicting SFEs. We show that the SFE can be accurately predicted across the composition ranges in binary alloys. This capability then enables us to predict the SFE of multi-elemental alloys by training the model using only binary alloys. Consequently, SFEs of complex alloys can be predicted using a binary alloys database, and the need to perform calculations for every new composition can be circumvented.

1. Introduction

High-entropy alloys (HEAs) have recently attracted wide attention as future structural alloys [1,2,3,4,5,6,7,8]. These alloys have exhibited superior hardness, yield strengths, and fracture toughness compared to conventional alloys [2,3,4,5,6,7,8]. A key distinguishing feature of HEAs from conventional alloys is the presence of multiple principal elements randomly distributed in large proportions on a given crystal lattice. This feature has opened up an exponentially large number of possible alloy compositions that have the potential to unveil many interesting properties. Indeed, certain HEA compositions have shown a unique presence of both high strength and high ductility, [9] which is generally an uncommon property in conventional alloys.
Recent experiments have shown that the underlying cause of the unique combination is the change in the deformation mechanisms from slip to twinning to transformation-induced plasticity [9,10,11,12,13,14]. These mechanism changes have been directly correlated to the stacking fault energy (SFE) of alloys, where it is observed that lowering the SFE favors the sequential change in the deformation mechanisms [9,13,14,15,16,17,18,19]. Li et al. [20] experimentally showed this phenomenon in Fe80−xMnxCo10Cr10, where the change in Mn from 45% to 30% resulted in the sequential observation of three deformation mechanisms with simultaneous decrease in SFE and increase in both strength and ductility. Liu et al. [21] performed similar study in Fe20CoxNi40−xCr20Mn20 (x = 20–30%). With the increase in Co from 15% to 30%, the authors showed systematic decrease in SFE from 38 ± 6 mJ/m2 to 19 ± 3 mJ/m2 and revealed a concomitant sequential change in the deformation mechanisms; in parallel, a systematic increase in both strength and ductility was observed. Similar observations have also been made in other studies [22,23,24]. These experimental results reveal that SFE serves as the central quantity, and new HEAs with a combination of high strength-high ductility are now being designed around SFE.
Atomistic calculations, particularly, density functional theory (DFT) have been widely used to calculate SFE of various pure metals. These predictions have generally been in good agreement with experimental measurements [25,26,27,28,29]. Atomistic calculations are expected to play a key role in developing guidelines to down-select alloy compositions with low SFEs. However, disagreements between calculated SFEs and experimental measurements have been noted in HEAs. Furthermore, large variations among DFT-calculated SFEs have been observed, both among different groups and even within the same research group. For example, Zhao et al. [26] performed SFE calculations on various alloys from unary to quinary compositions including Ni, NiCo, NiFe, NiPd, NiCoCr, NiCoFe, NiCoFeCr, NiCoFeMn, NiCoFeCrMn, and NiCoFeCrPd. The authors performed calculations on three different special quasi-random structures (SQS) to include a certain level of statistics. However, variations up to 120 mJ/m2 were observed within a given composition; in addition, it was found that the variation increased with the increase in the number of elements. Furthermore, the variation spanned across both negative and positive values of SFE, thereby adding large uncertainty to the predicted values. Similarly, calculations by Yu et al. [30] revealed a variation from −112 mJ/m2 to +8 mJ/m2 in Al0.36FeNiCoCr and from −59 mJ/m2 to +31 mJ/m2 in Mo0.36FeNiCoCr among six calculations for each alloy. A variation between −18 mJ/m2 to −77 mJ/m2 and between −82 mJ/m2 to −180 mJ/m2 for NiCoCr and NiCoCrFe, respectively has also been reported by Zhang et al. [31]. Similarly, Ding et al. [32] also reported a variation from −140 mJ/m2 to 65 mJ/m2 in NiCoCr in their calculations. Other values of −24 mJ/m2 [33], −62 mJ/m2 [26] and −41 mJ/m2 [34] have also been reported for NiCoCr by different research groups. Large variations have also been reported in various other studies [35,36,37].
In contrast, relatively much smaller variations have been observed experimentally among various groups. For example, Laplanche et al. [38] and Liu et al. [39] reported SFE of 30 ± 5 mJ/m2 and 26.5 ± 4.5 mJ/m2 for NiFeCoCrMn, which is a fairly good agreement between the two studies. Similarly, the same two groups reported 22 ± 4 mJ/m2 and 18 ± 4 mJ/m2 for NiCoCr, which is also in good agreement. Experimental SFE values of many other alloys have been reported, and a fairly narrow variation, normally less than 10 mJ/m2, is observed [21,38,39]. Thus, while a very large uncertainty exists in atomistic predictions, fairly reliable SFE values are obtained experimentally.
The large variations in calculated SFEs is a result of the inherent limitation of small supercell sizes that have to be used to perform the calculations. For example, DFT calculations are performed in structures containing up to five-hundred atoms, which is a very small fraction of atoms compared to experiments. As a result, only a handful of nearest neighbor atomic environments are captured, and these structures fail to capture the overall real-life distribution of various elements in a given alloy composition. Recent works have illustrated the effect of nearest neighbor environments on SFEs calculated from DFT [30,31,32,40]. These observations have revealed a strong correlation between the type of nearest neighbor environment and the resulting SFE value. Thus, the limited nearest neighbor environments incorporated in the supercell appears to be the leading cause of large disagreements among various atomistic studies. What is therefore needed is a framework that can capture a large number of different nearest neighbor environments and predict the SFE of experimentally resembling elemental distribution.
In this work, we illustrate a proof-of-concept framework that is built to overcome the system size challenge by using machine learning (ML). We train the ML model on various nearest neighbor environments and their corresponding SFEs in Ni-Fe, Fe-Cr, and Ni-Cr binary alloys. This training is done on various supercells, each containing 480 atoms that potentially have varying nearest neighbor environments. The ML model is then used to predict the SFE of a given alloy composition. We show that the model is capable of predicting SFE with high accuracy and with significantly reduced variation. In addition, the model is able to predict SFEs of ternary alloys among the phase ranges of Ni-Fe-Cr compositions simply from binary alloys. This capability thus lays a foundation of a framework to predict accurate SFE of complex HEAs simply by using the nearest neighbor and SFE information of binary alloys.

2. Methodology

In order to overcome the limitation of smaller system sizes, the central idea of the approach is to learn the nearest neighbor environments from smaller structures, and then use ML to predict the SFE of larger structures that contain diverse nearest neighbor environments. Figure 1a schematically shows the overall idea where many smaller supercells are modeled using atomistic simulations to train an ML model, which is then used to predict the SFE of a much larger supercell of a given alloy composition. We translate the idea to ternary systems, where the same database of binary alloys of smaller structures is used to train an ML model to predict SFEs of ternary alloys, as illustrated in Figure 1b.
In literature, various methods have been used to calculate the SFE of alloys from DFT calculations. It is to be noted that the variation in SFE is observed irrespective of the method used. Discussions on the implementation of these methods can be found here [26,29,35,41]. In this work, we use one of these methods, where an intrinsic stacking fault (ISF) is created by removing one plane of atoms from the ABCABC face centered cubic (fcc) stacking of planes; as a result, a stacking fault (and a local hexagonal close packed (hcp) region) is created. Figure 2a,b show the perfect and faulted structures, respectively. In fcc, the stacking faults form on {111} plane and <110> direction, and this is the slip system that we have considered in this study. This is a standard plane and direction in fcc stacking faults. Due to the implementation of periodic boundary conditions in all three directions, a system size convergence test is done, in order to determine the minimum number of atomic planes required to prevent the interactions between the two stacking faults, as shown in Figure 2c. In this work, we use a distance of at least eleven layers between the two stacking faults to nullify their interactions. While removing the layer we ensure that the alloy composition of the perfect and faulted structure remains identical. For example, in a A50B50 alloy, the layer that is removed also has A50B50 composition; as a result, both the perfect and the faulted structures maintain the original alloy composition. Energies of the structures in Figure 2a,b are computed. The energy of the perfect structure is normalized with respect to the number of atoms used in the faulted structure. Equation (1) is used to calculate the SFE
E S F = E fault E perfect S
where ESF is the ISF energy, Efault and Eperfect are energies of the faulted and perfect structures, respectively, and S is the cross-sectional area. In this work, only the fcc phase is considered. All binary and ternary compositions are modeled in fcc. This is done because of the limitation of the interatomic potential, and to keep the study simple in order to demonstrate that the ML framework can work. Complexities such as different phases will be incorporated in the next versions of the ML framework.
The energies are computed using atomistic simulations performed via large-scale atomic/molecular massively parallel simulator (LAMMPS) code [42]. The benefit of using the LAMMPS code is that it enables calculations of large system sizes, which, in turn, allow us to validate the predictions of the ML model. The simulations are performed on various system sizes, including 480, 4320, 6000, 12,000, and 108,000 atoms to elucidate the effect of system size on SFE variation. We use Bonny 2013 potential to model Ni-Cr-Fe system [43].
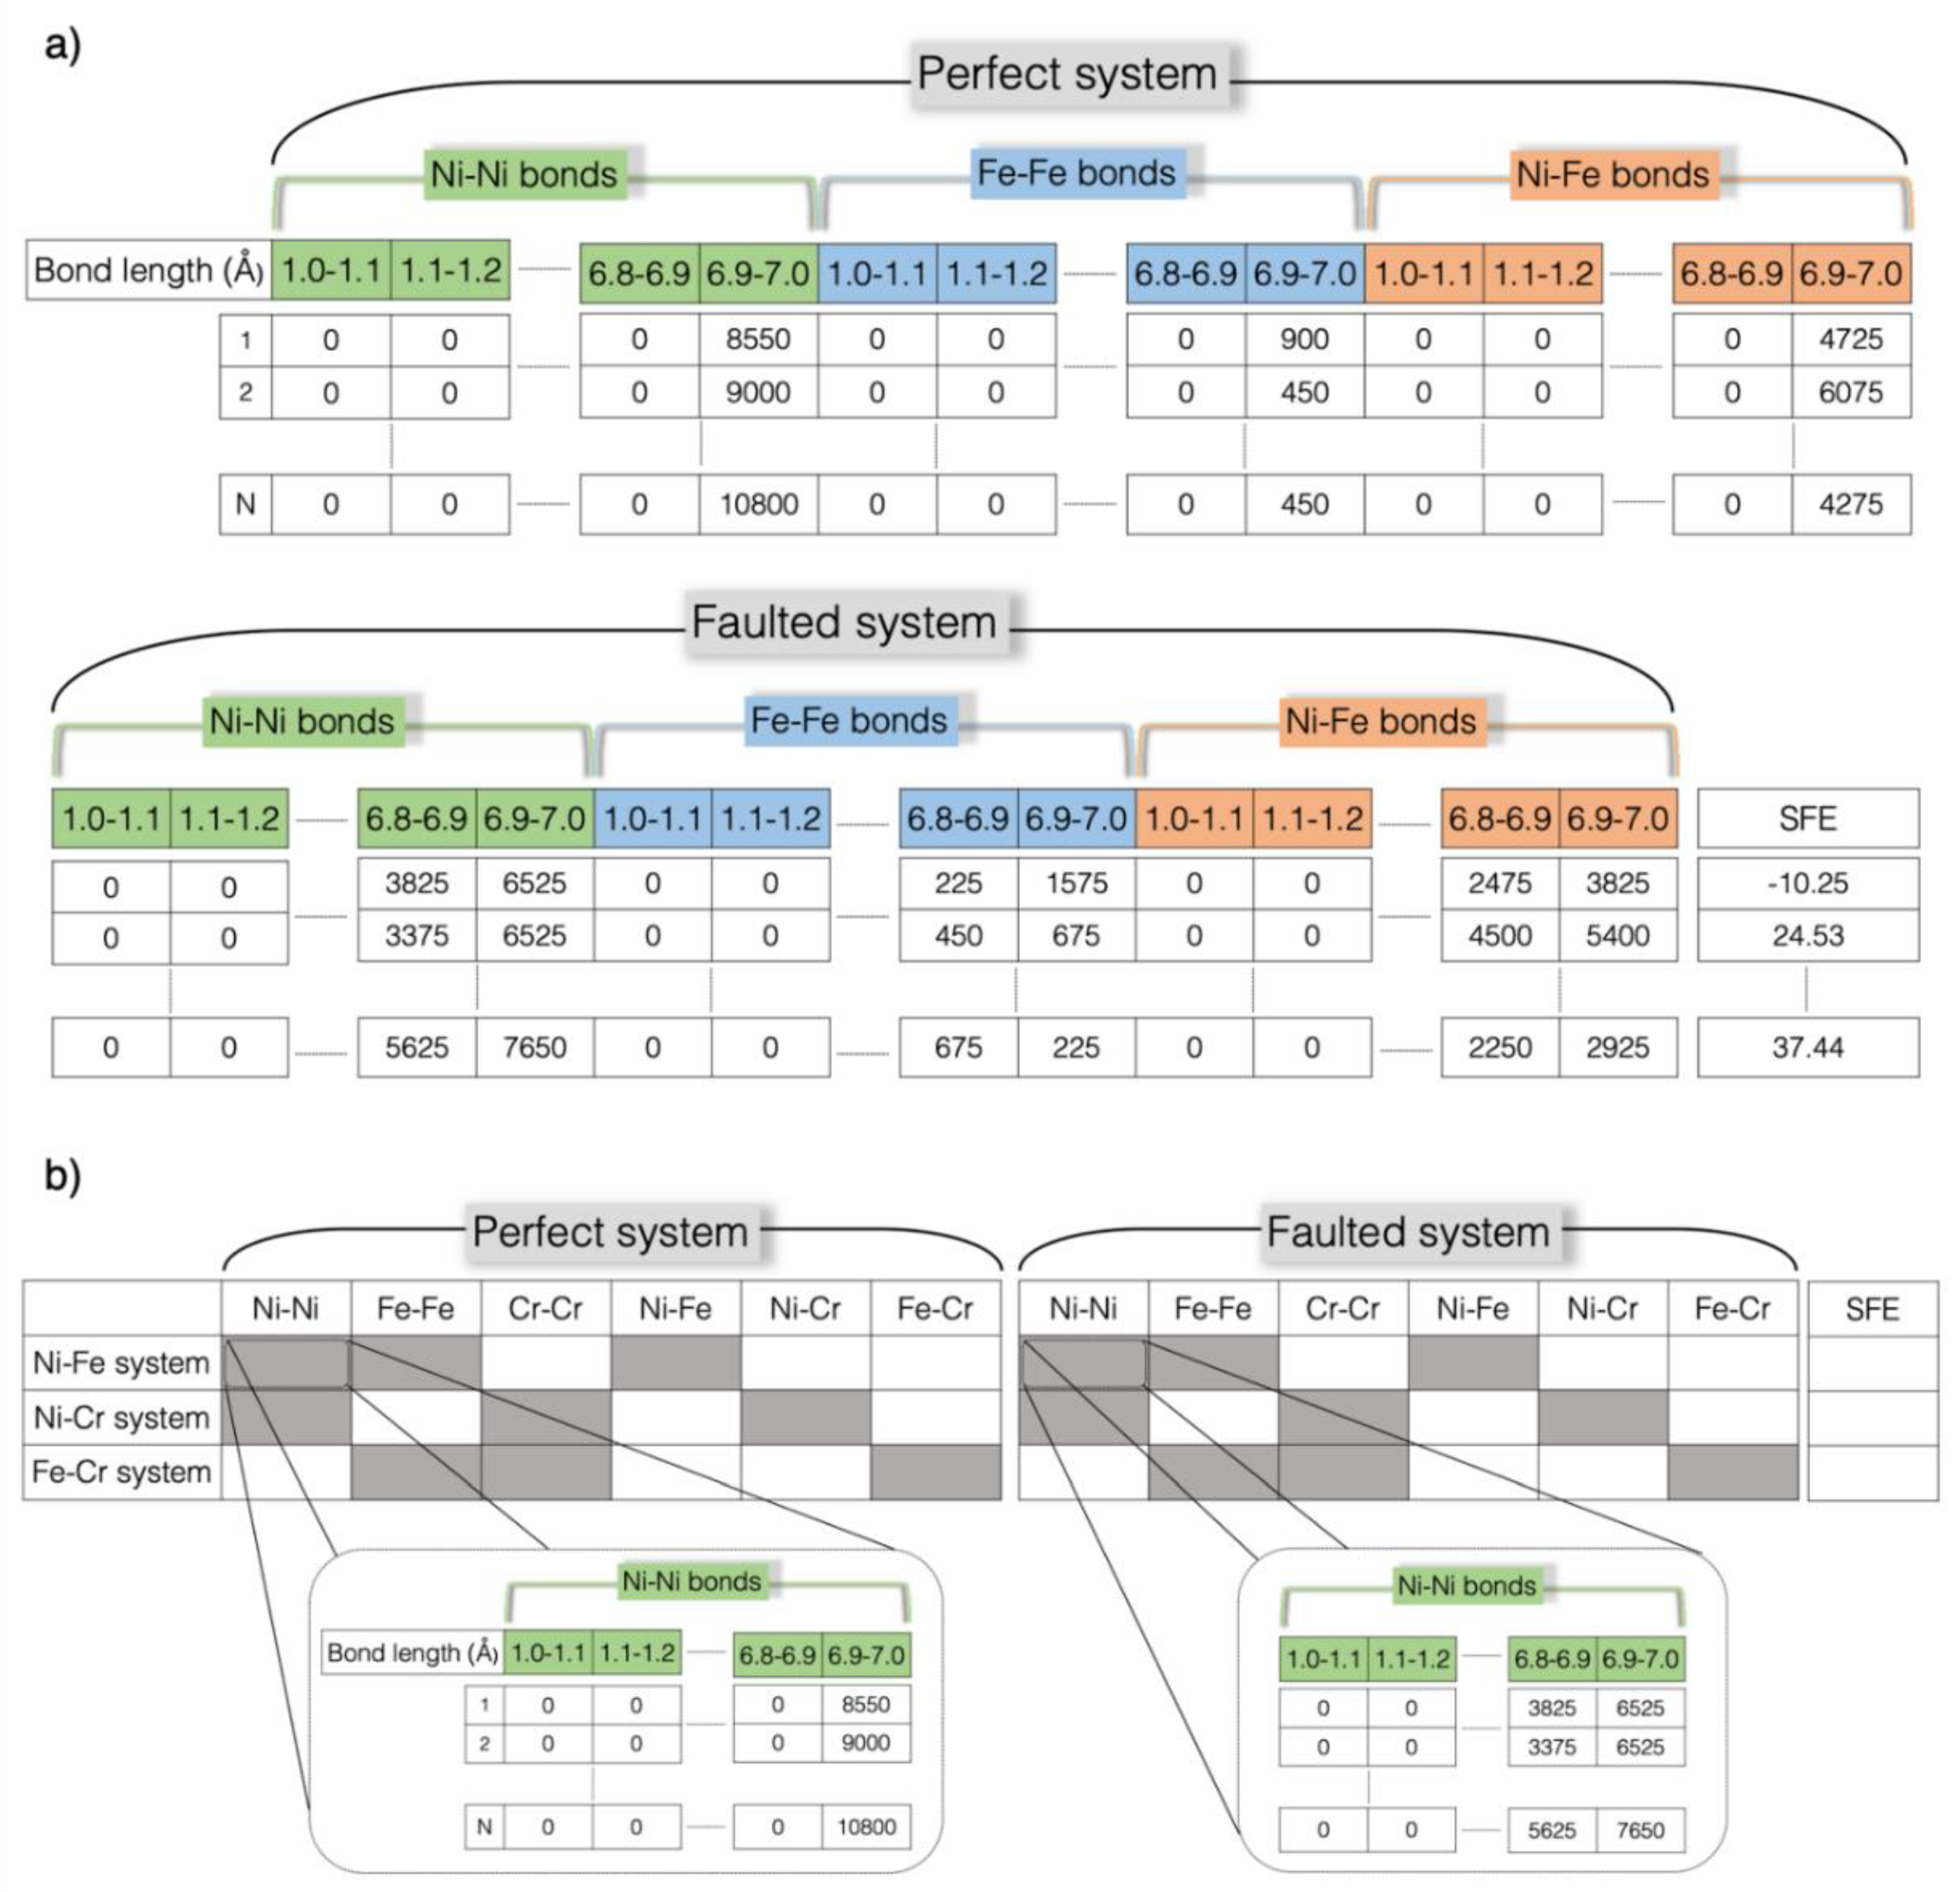
Various recent studies have concluded that the local nearest neighbor environment is largely responsible for the ultimate value of SFE. Therefore, in order to capture the effect of local nearest neighbor environment on SFE, the type and number of bonds are used as descriptors to train the ML model. A portion of the spreadsheet that is built for a binary alloy is shown in Figure 3. After relaxing the structures, the number of bonds in both perfect and faulted structures are documented. This information is stored for all bonds that lie within a range from 1 Å to 7 Å, thereby including information up to fourth nearest neighbors. These bonds are then binned with a bin size of 0.1 Å resulting in total of 60 bins for each type of bond. For example, to predict SFE for Ni-Fe alloy, Ni-Ni, Fe-Fe, and Ni-Fe bonds are included (60 of each type), which results in a total of 180 descriptors. Descriptors for both perfect and faulted structures are included. This results in a total of 360 descriptors for training the ML model. In Figure 3a, the top row represents the range of the bins. The second row represents the number of bonds that lie within a given bin size. The binning is done for each type of bond as shown in Figure 3a. At the extreme right, the final column is the SFE calculated for a given supercell. Since each row represents a given supercell, the number of rows represent the number of supercells; this information is used to train the ML model. Finally, a spreadsheet for a given alloy system (e.g., Ni-Fe) contains the information of various compositions (e.g., NixFe1−x).
While Figure 3a is built for binary alloys, this information is then collectively used to build the model for ternary alloys. Figure 3b shows collective binary data of Ni-Fe, Ni-Cr, and Fe-Cr for ternary Ni-Fe-Cr. The top row in Figure 3b represents different types of bonds in the binary system. Shaded boxes represent the type of bond and bond length information, whereas the empty box represents no information for the corresponding bond type. For example, in the Ni-Fe system only three out six boxes i.e., Ni-Ni, Fe-Fe, and Ni-Fe are filled whereas the Cr-Cr, Ni-Cr, and Fe-Cr are unfilled, because these bonds are absent in Ni-Fe system. Each filled box contains the information of the number of bonds of a particular binary system as shown by the close-up view in Figure 3b. Note that we do not provide any information about the ternary alloys; only, the information of the binary alloys is used to train the model to predict the SFE of ternary alloys. This is so done to make a robust ML model such that the SFE of ternary HEAs could be predicted simply using the information of binary alloys.
Generally, the construction of an ML model consists of three sequential steps, i.e., sample construction, model building, and model evaluation [44]. The sample is constructed via data collection, either from the experiments or from the simulations [44]. Depending upon the complexity of the data, a model is chosen from various available models, such as linear regression, support vector machine, random forest regressor, gradient boosting regressor, etc. [45]. Depending upon the volume of the data, either hold-out, cross-validation or bootstrapping individual evaluation method, or a combination is chosen. Due to availability of sufficient amount of data in this work, a cross-validation method is used for training the model and a hold-out is used for testing the accuracy of the model [44]. In the hold-out method, data is divided into training and testing sets. Usually, an 80-20 combination is used, i.e., 80% of the data is used for training the model and 20% data set is kept aside for evaluating the model. The k-fold cross-validation is also used for training the model. In this method, the original dataset is portioned into k mutually exclusive subsets of the same size. Then, the union set of k-1 of the subsets is taken as the training dataset, and the remaining one subset is used as a testing dataset. This is usually done to tune the hyper-parameters avoiding over-fitting or under-fitting the model. After training the model, it is evaluated to test its performance. Mathematical tools such as mean absolute percentage error (MAPE), root mean square error (RMSE), Pearson coefficient (R), and the correlation coefficient (R2), etc. are used to evaluate the model.
In this work, the data is generated and collected by running a large number of atomistic simulations and is represented as shown in Figure 3a,b. Due to the simplicity of the system, linear regression models are chosen. We chose a ridge model for the binary alloys and a lasso model [45] for the ternary alloys, and the data is split into 80-20 ratio for training and testing. Two different models are chosen, due to the differences in the collection/representation of the data for binary and ternary alloys. Although ridge regression is usually the first choice, due to large number of features, i.e., 720 for ternary (60 for each type of bond, as shown in Figure 3b), lasso is chosen for training the ternary model. After testing the model on the 20% hold-out dataset, the same model is used to predict the SFE for larger supercells. Five different random states are chosen for splitting the data, resulting in five different models for the same data set. This is done to ensure the generalization of the model. Training of the 80% data set is done using 10 k-fold cross-validation technique. Finally, we use root mean square error (RMSE), Pearson coefficient (R), and standard deviation (std.) of the error as the mathematical tools for model evaluation. Throughout the paper, true-data refers to the actual SFE calculation, whereas predicted-data refers to the SFE prediction from the ML model.

3. Results

3.1. Large Variation in SFE Due to System Size

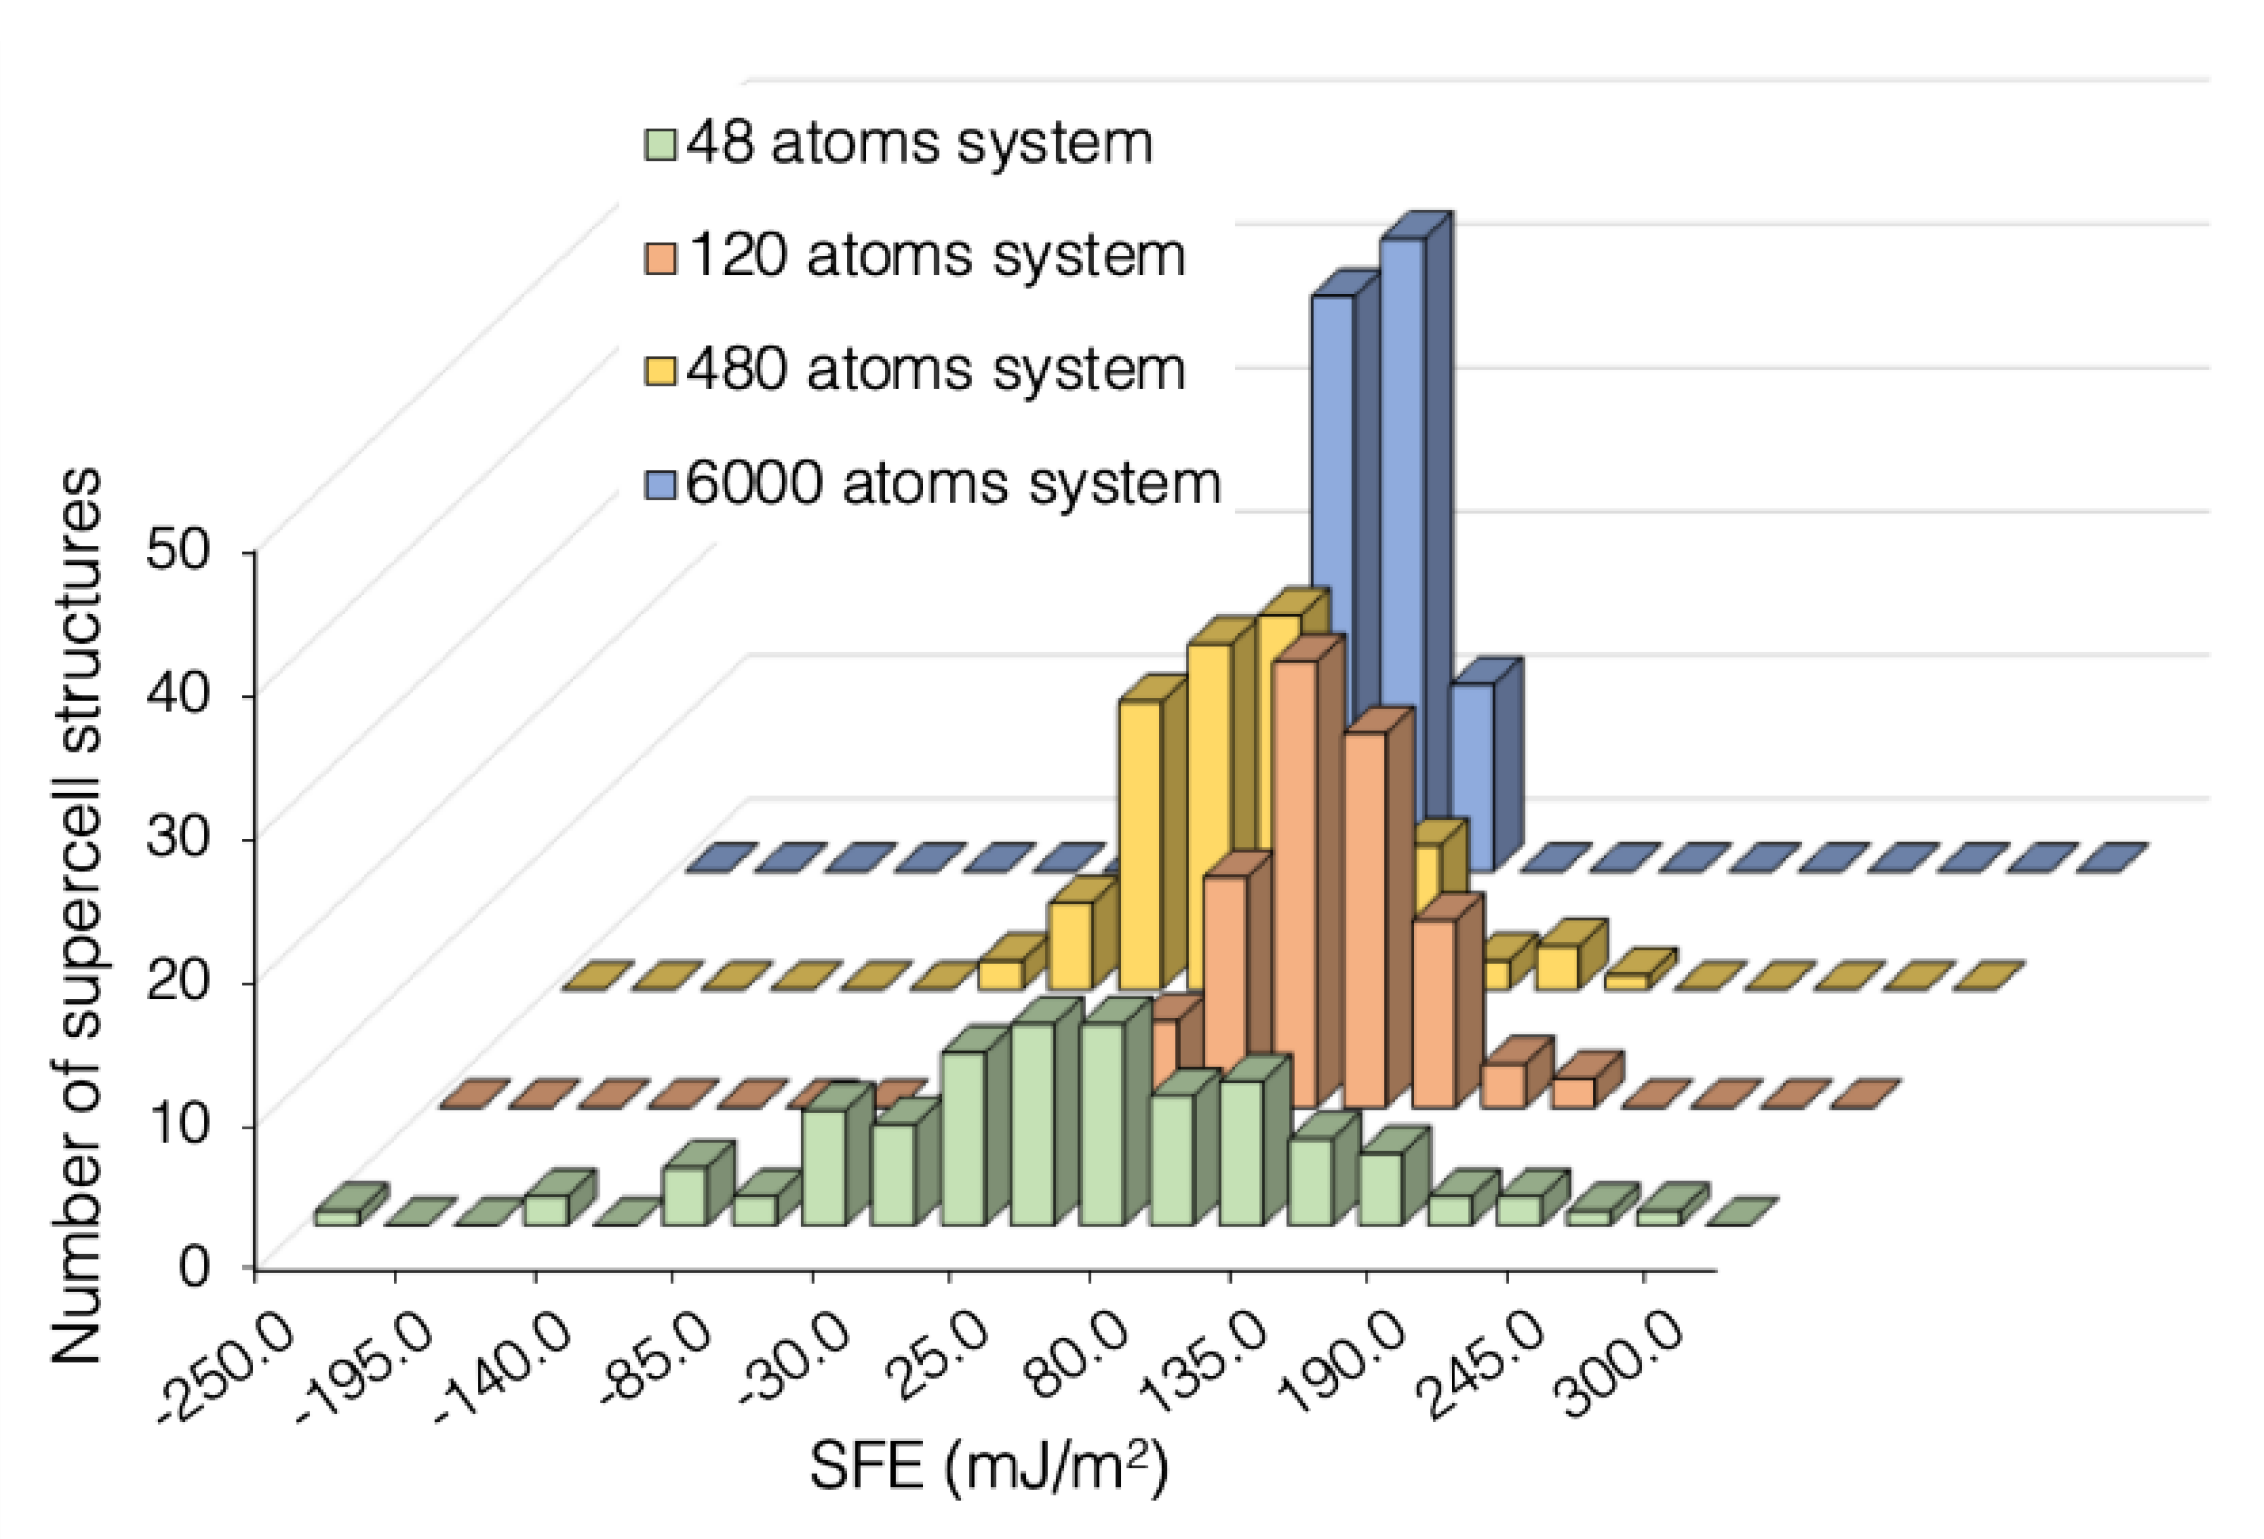
We first demonstrate the effect of system size on SFE values. Figure 4 shows the variation in SFE obtained by performing calculations in four different system sizes, i.e., 48, 120, 480, and 6000 atoms in Ni50Fe50. For each system size, 100 different supercell structures are created. Figure 4 shows that a very large distribution from −244 mJ/m2 to +292 mJ/m2 is obtained when the SFE is calculated in a 48-atom supercell. In contrast, the variation decreases and converges between −8 mJ/m2 to +72 mJ/m2 in the 6000-atom supercell. The height of the bars in Figure 4 shows the number of structures with a corresponding SFE value. We find that the SFE variation decreases and the number of structures falling within a small distribution of SFE increases as the supercell size increases from 48 to 6000 atoms. This distribution implicitly indicates that the SFE depends on the nearest neighbor environments, i.e., in a smaller 48 atom supercell, the SFE distribution is wider because each supercell contains a very small fraction of the overall nearest neighbor environments. In addition, each supercell potentially contains a distinct nearest neighbor environment from the other that leads to widely different SFE values. As a result, a wider variation among 100 supercell structures is observed in a 48-atom system. In contrast, in the 6000-atom system, a much larger variety of nearest neighbor environment is present in a given supercell, which leads to more converged SFE values. A similar observation has been made in a recent work [26].
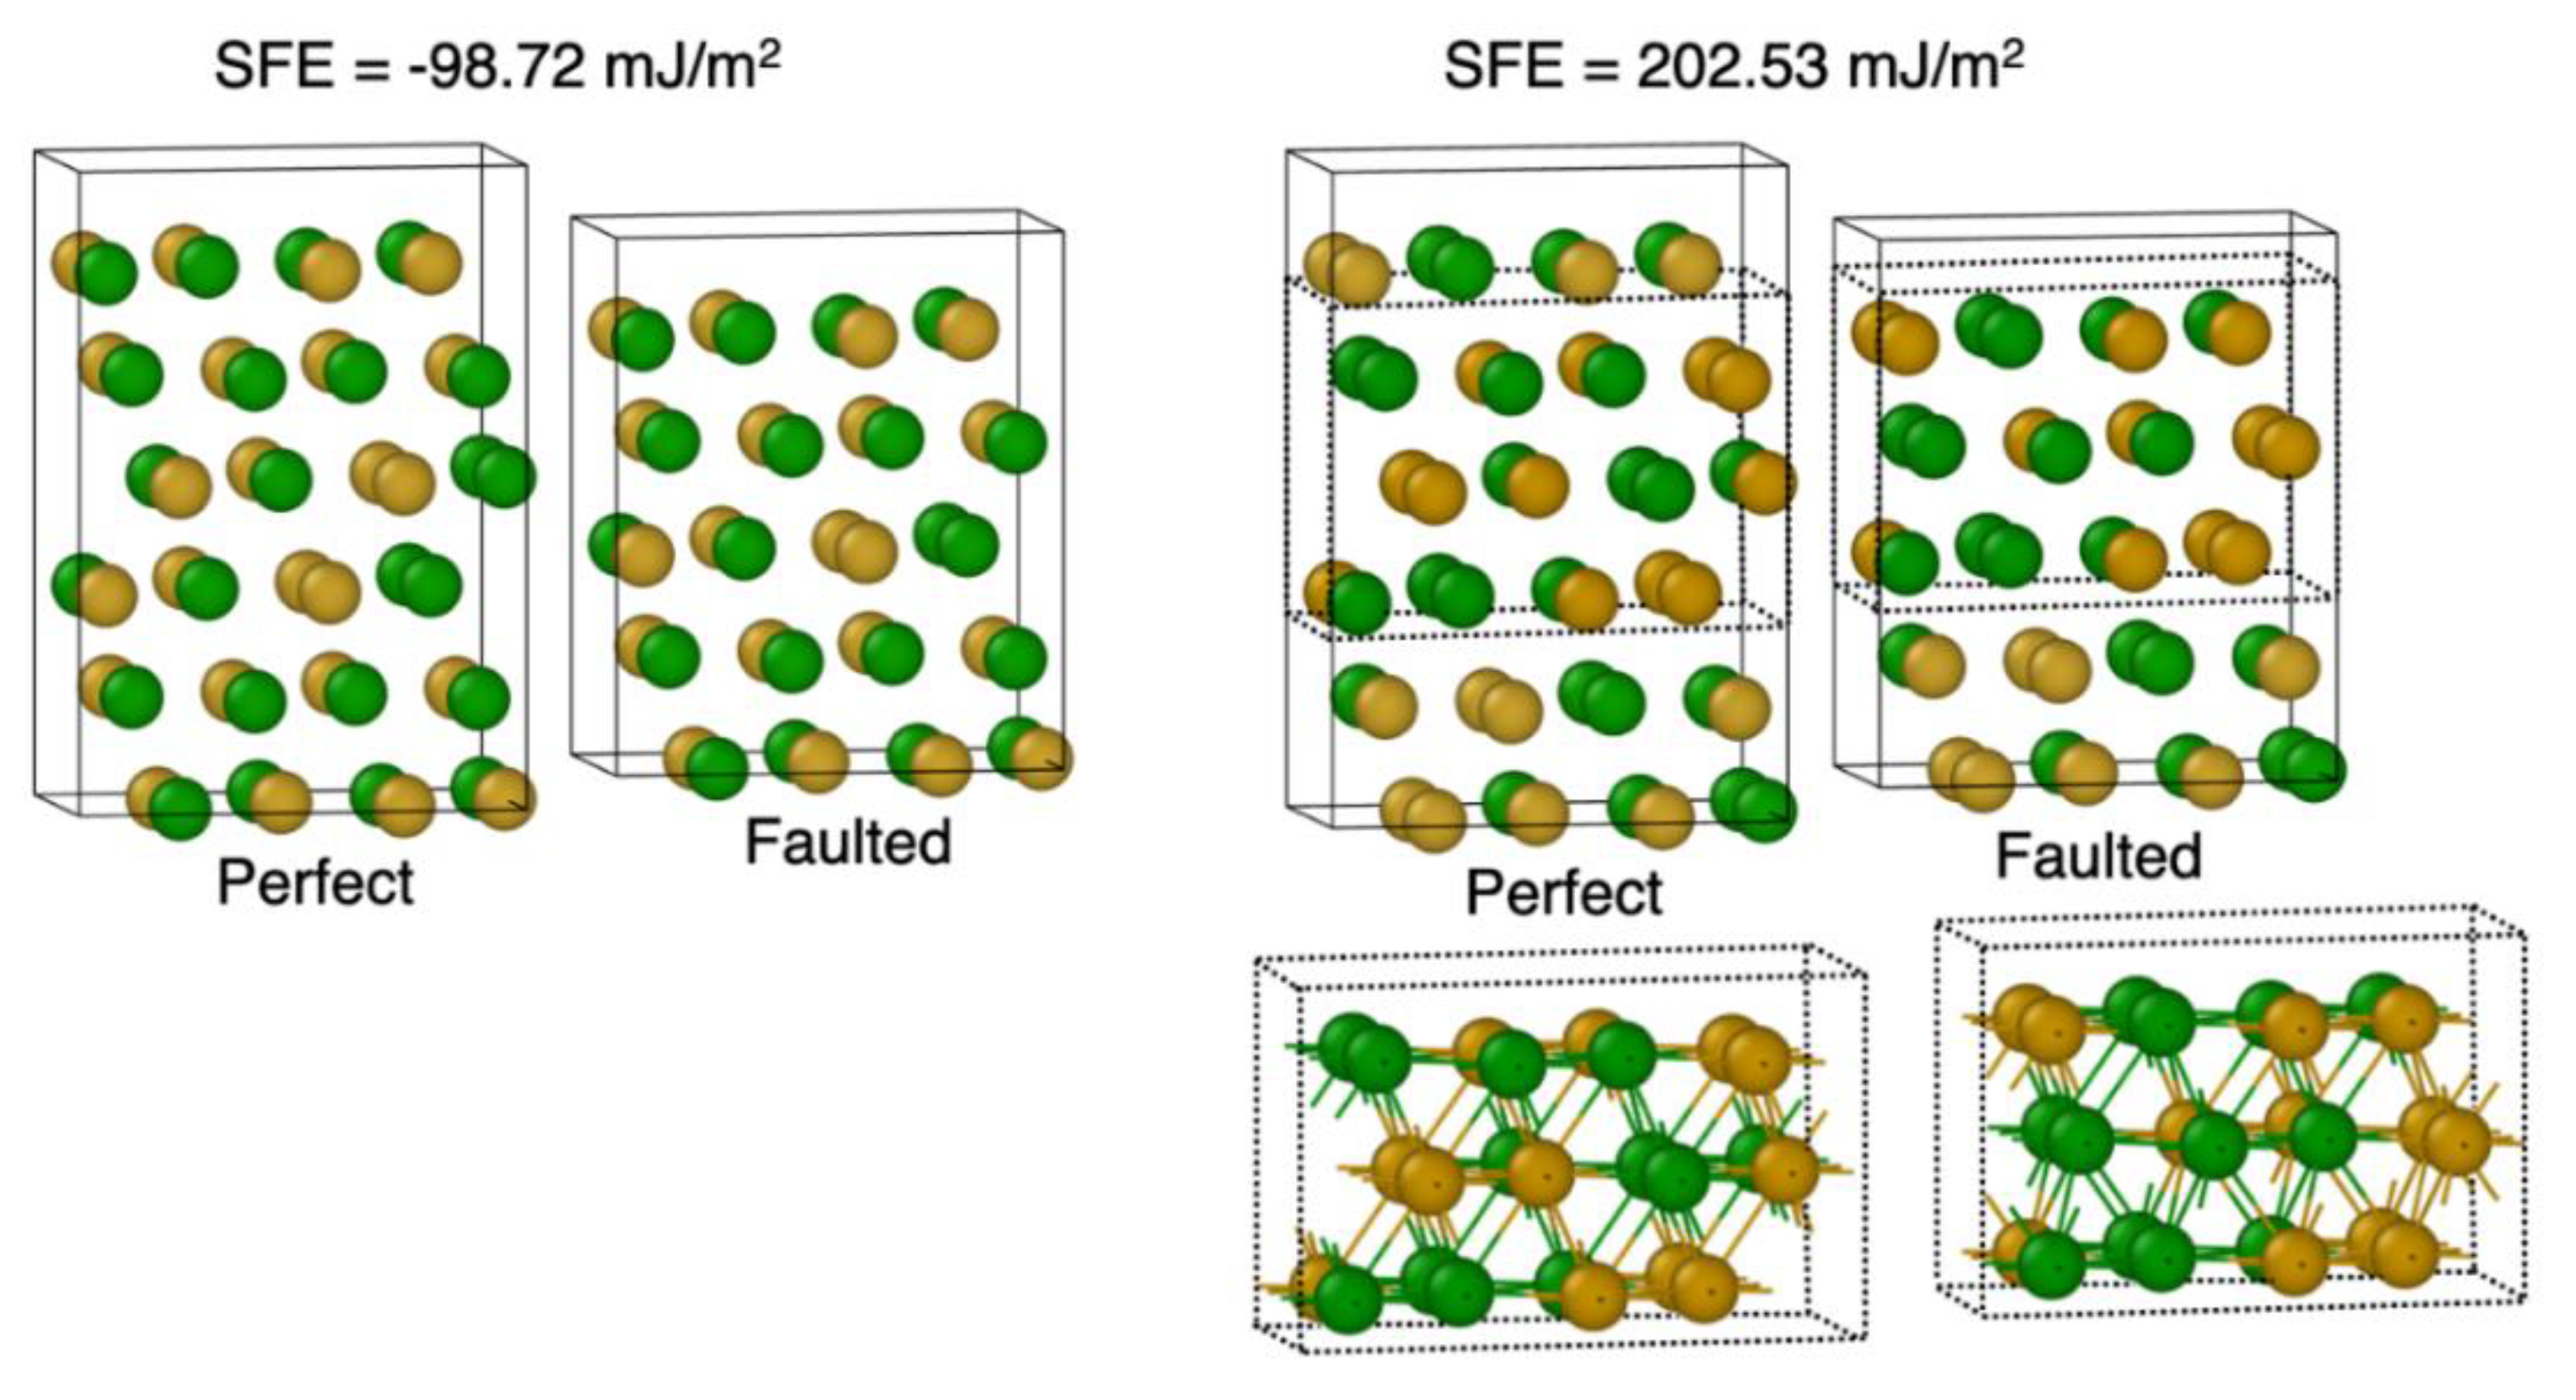
To elaborate on the effect of system size on SFE values, Figure 5 shows the SFE of two different 48-atom supercell structures in Ni50Fe50. A large variation in SFE is observed among the two supercells. Recall that the SFE is calculated from the difference in the energies between the perfect and the faulted structures, using Equation (1). When the faulted structure is created, the only structural change that occurs is at the layer, which is removed to create the fault; the rest of the structure remains identical to the perfect structure. The insets in Figure 5 show different nearest neighbor environments in the perfect and the faulted structures, before and after the layer has been removed. A significantly large difference in the nearest neighbor environment between the perfect and faulted structures leads to a large SFE value. The variation among the two supercells originates from how large the change in nearest neighbor environment occurs between the perfect and faulted structures of a given supercell. Indeed, the change is expected to occur much more drastically in the smaller system-size supercells compared to larger supercells. Note that the local composition does not change (e.g., it remains Ni50Fe50), yet a large difference (−98.72 mJ/m2 vs 202.53 mJ/m2) in the SFE is observed between the two structures. Thus, the larger variations in the 48-atom supercell compared to the 6000-atom supercell is essentially due to the system size.
Table 1 shows the SFE average (avg.), range of variation (r.v) and standard deviation (std.) for four system sizes, i.e., 48, 480, 6000, and 108,000-atom supercells obtained from 100 structures for each supercell size. The data is provided for three different binaries, i.e., Ni50Fe50, Ni50Cr50 and Fe50Cr50. The data shows that, while the average SFE for each supercell structure remains almost the same, the range of variation and the standard deviation decrease consistently with the increase in the supercell size. For example, in Ni50-Fe50, the range of variation decreases from 537.59 mJ/m2 in 48-atom supercell to a mere 18.37 mJ/m2 in 108,000-atom supercell. Similarly, the standard deviation decreases from 90.94 to 3.68 mJ/m2, respectively. These results show that system size has a significant effect on the SFE value and is the underpinning reason for the wide disagreement among the literature, as discussed above.

3.2. Variation in SFE for Various Compositions

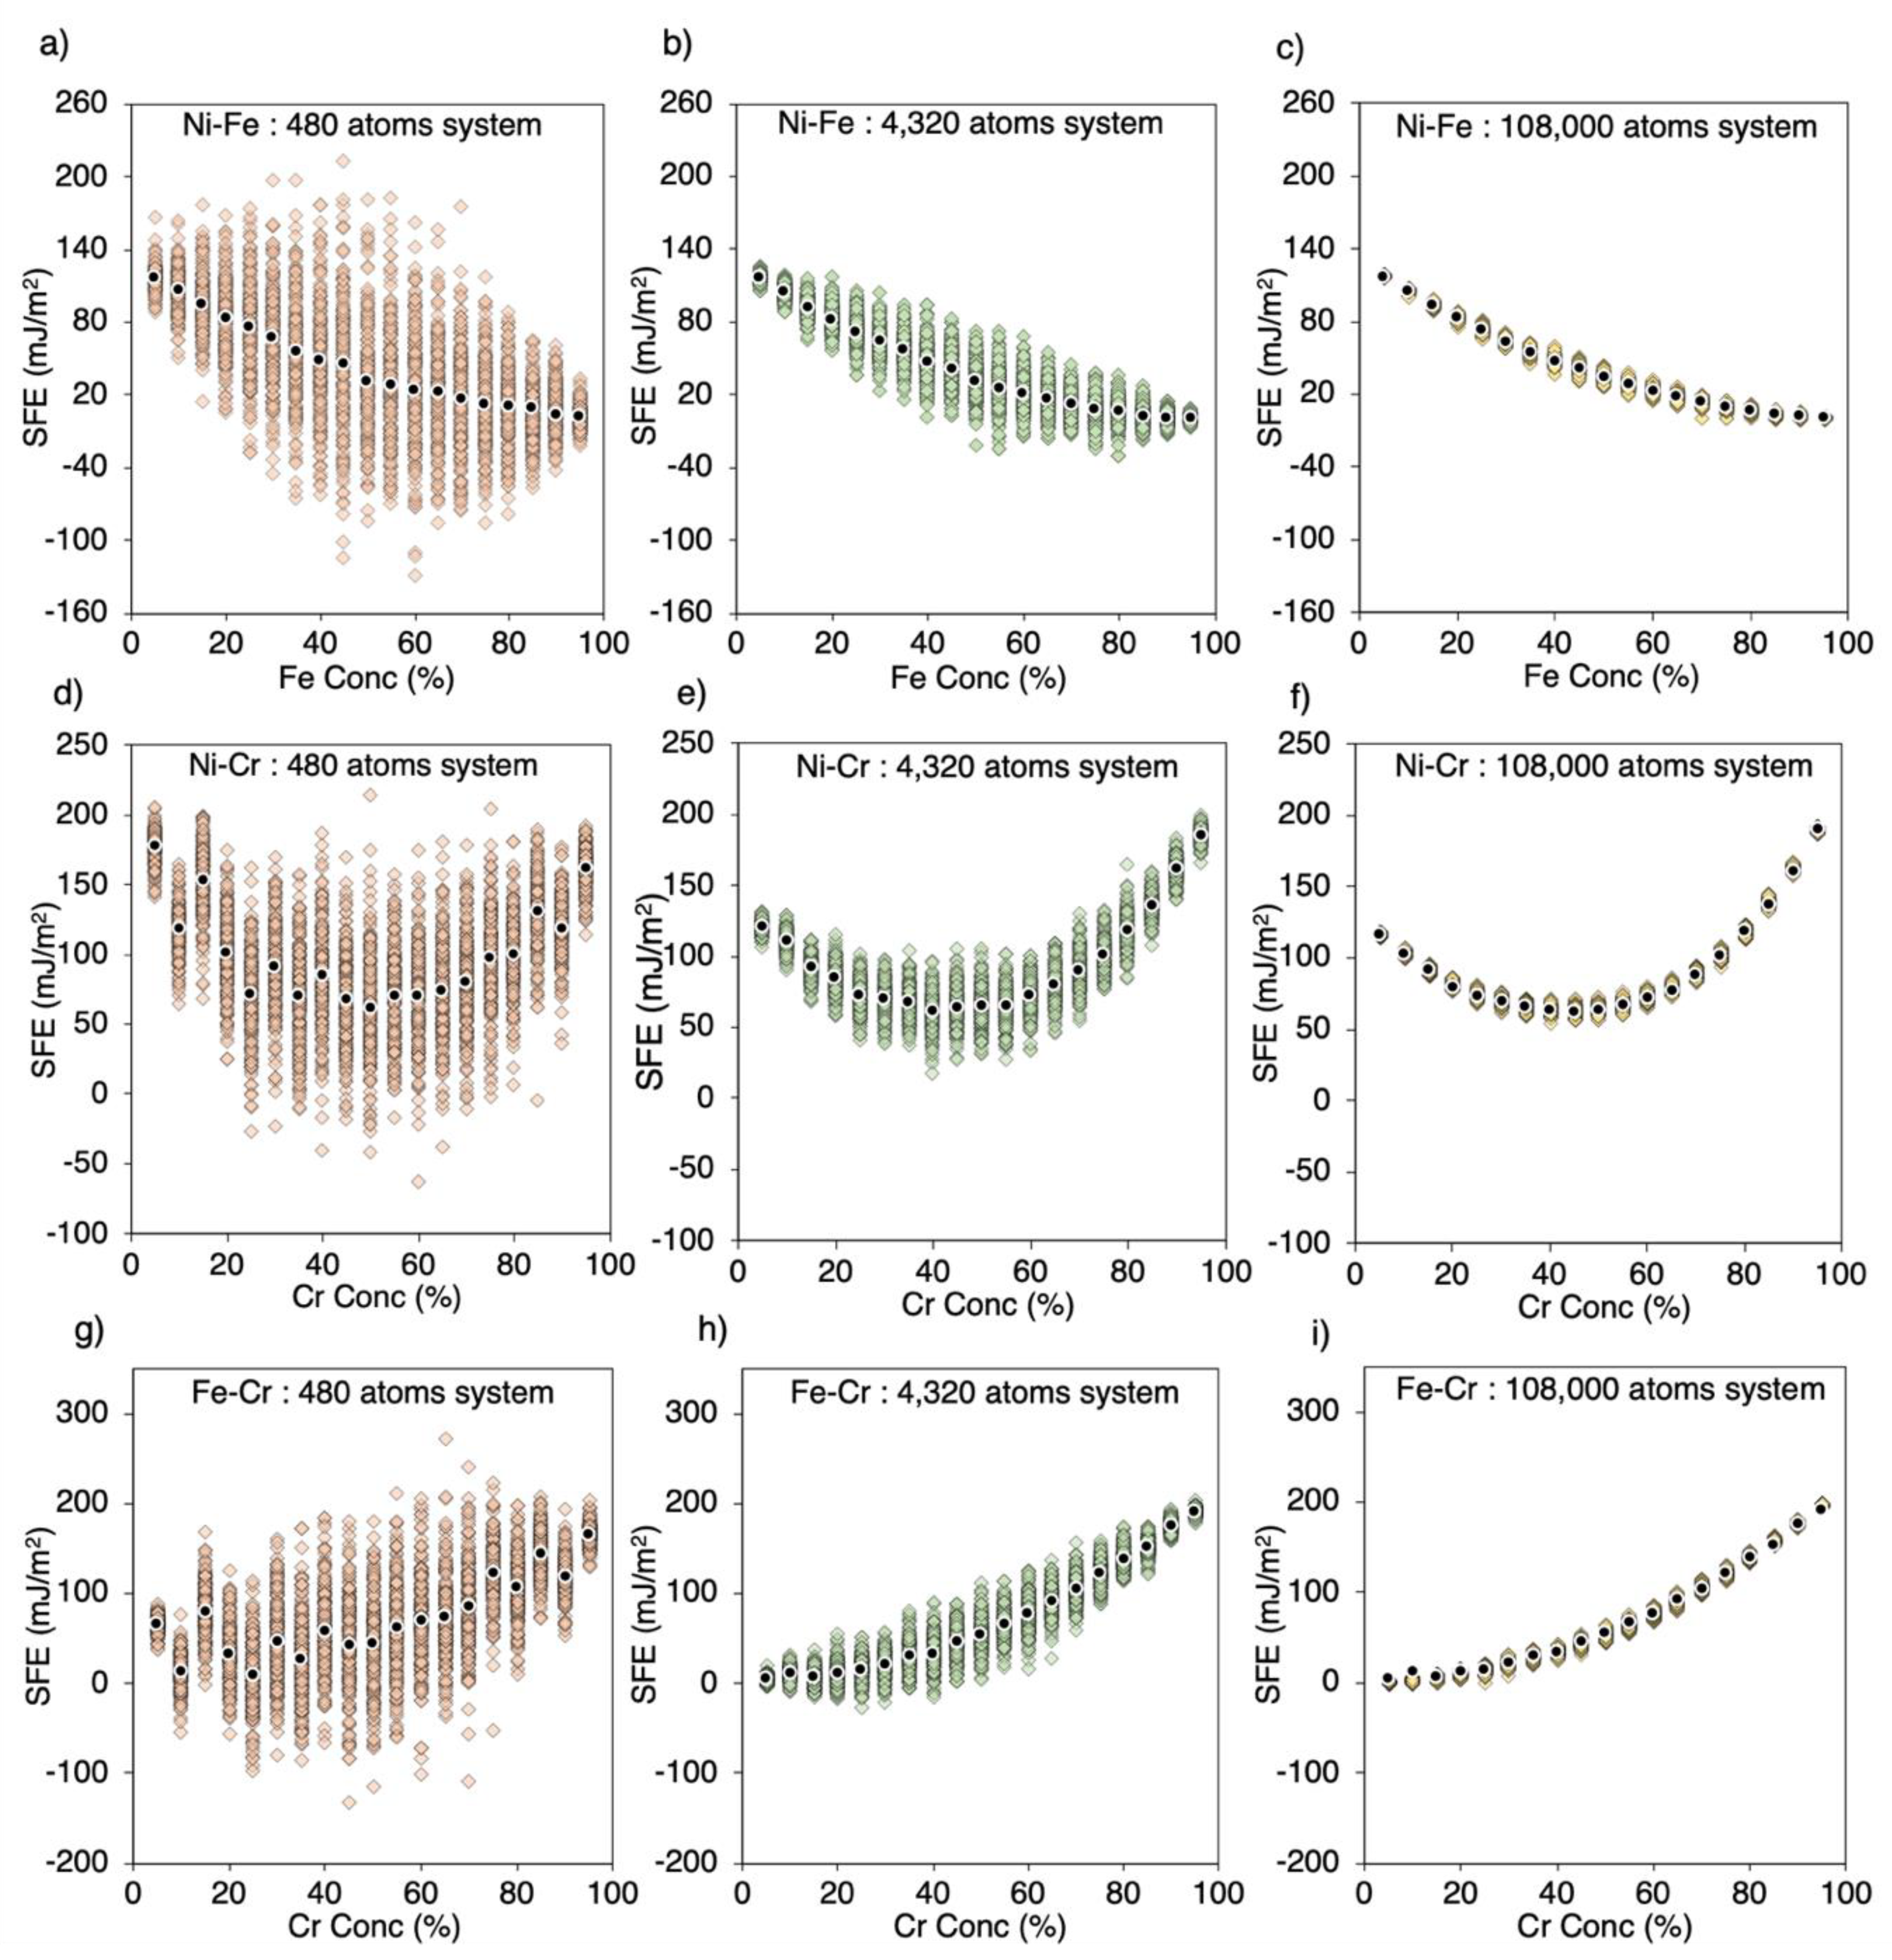
The above results are shown for Ni50Fe50 composition. Now, we illustrate the SFE variation across the whole composition range in Ni-Fe, Ni-Cr and Fe-Cr binary phase diagrams. Figure 6a shows the SFE variation across the composition range in Ni-Fe at an interval of 5% Fe. The SFE variation for three different system sizes, i.e., 480, 4320, and 108,000-atom supercells are shown in Figure 6a–c, respectively. Two-hundred different supercell structures are modeled for each composition in each system size, leading to a total 11,400 calculations in Figure 6a. For the 480-atom system size, we observe that the SFE variation in the largest (264.4 mJ/m2) for the 50-50 composition; the variation, however, decreases as the composition moves away from the center towards either ends of the phase diagram. This is simply because of the larger randomness in the 50-50 supercell that creates the largest possibilities of different nearest neighbor environments. Figure 6b,c show the SFE variation in 4320 and 108,000-atom supercells, respectively. As expected, the variation in SFE goes down significantly as the system size increases. Another key point to note is that the standard deviation for the SFE also decreases significantly from 480 to 108,000-atom system. The standard deviation for 480 and 108,000-atom system is 47.11 mJ/m2 and 3.52 mJ/m2, respectively. For the approximate normal distribution possessing average (μ) and standard deviation (σ), 95.45% of the value lie within the range of μ ± 2σ. Thus, for the 108,000-atom system, with μ equals 33.54 and σ equals 3.52, 95.45% of the SFE should lie within the range from 26.5 to 40.5 mJ/m2. This small variation observed in the 108,000-atom system indicates that various nearest neighbor environments are potentially captured in this system size. In contrast, much higher standard deviations of 47.11 mJ/m2 and 16.14 mJ/m2 are observed in 480-atom and 4320-atom supercells, respectively. The average SFE across the three systems sizes remains almost same, i.e., 31.67 mJ/m2, 31.65 mJ/m2, and 33.54 mJ/m2 in 480, 4320, and 108,000 atom systems, respectively. The average SFE for each composition is shown by black dots in Figure 6a–c. It is to be noted that the average SFE is similar because we have considered very large number of supercell structures (i.e., two hundred) for each composition. If only a handful of structures were considered, the average SFE among three system sizes could be widely different. In agreement with Figure 4, these results show that the SFE variation decreases with increasing system size across the composition range.
Similar to the Ni-Fe alloy system, simulations are performed for Ni-Cr and Fe-Cr binary alloys. Figure 6d–f and Figure 6g–i show the variations observed for 480, 4320, and 108,000-atom supercells in Ni-Cr and Fe-Cr systems, respectively. Similar results are obtained in both systems, i.e., the variation in SFE decreases with increasing system size.
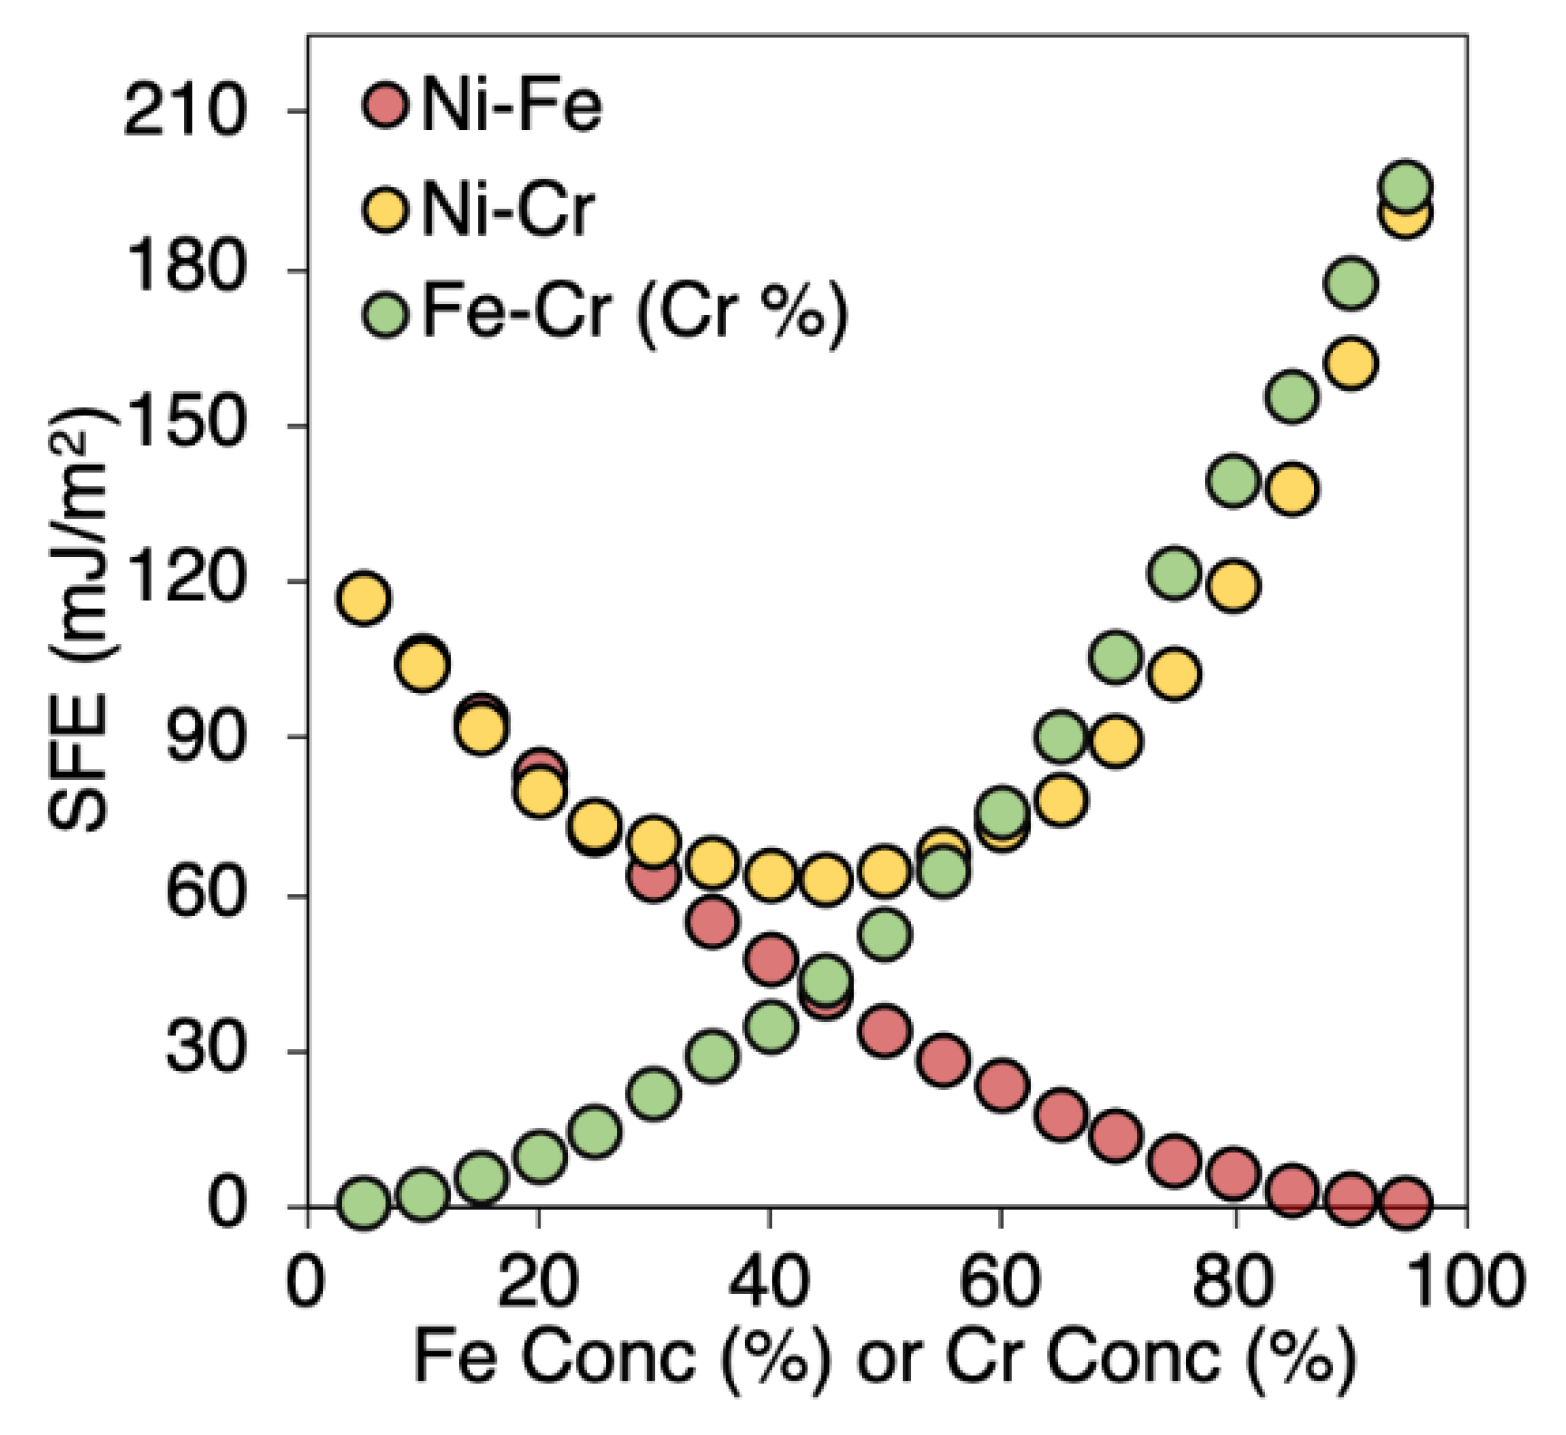
Despite these similarities, these simulations also reveal a distinguishing feature among these alloy systems, i.e., the effect of alloy chemistry on SFE. Figure 7 shows the average SFE of the three alloy systems from 108,000-atom supercell calculations. We find that each alloy chemistry has a unique SFE trend. While there is almost a linear decrease in Ni-Fe and a linear increase in Fe-Cr as a function of Fe concentration, there is a parabolic behavior observed in the Ni-Cr alloy system across the phase diagram. These behaviors are not surprising, because they represent the effect of alloy chemistry, which is expected to be unique for each alloy. This is an important information that is included in the database in Figure 3, which allows us to incorporate nearest neighbor environmental chemistry-effect in the database. The ML models learn these correlations and predict the SFE for unknown environments, as discussed in the rest of the paper.

3.3. SFE Prediction Using Machine Learning Models

The overall goal of using ML is to be able to club the best of the two worlds, i.e., the atomistic information from the practically feasible smaller system sizes, and various nearest neighbor environments from larger system sizes. Using the central idea from Figure 1, ML allows us to bridge the system-size gap. By clubbing the two, the expectation is that the large SFE variations observed in smaller supercells will be reduced when predicted on larger supercells.
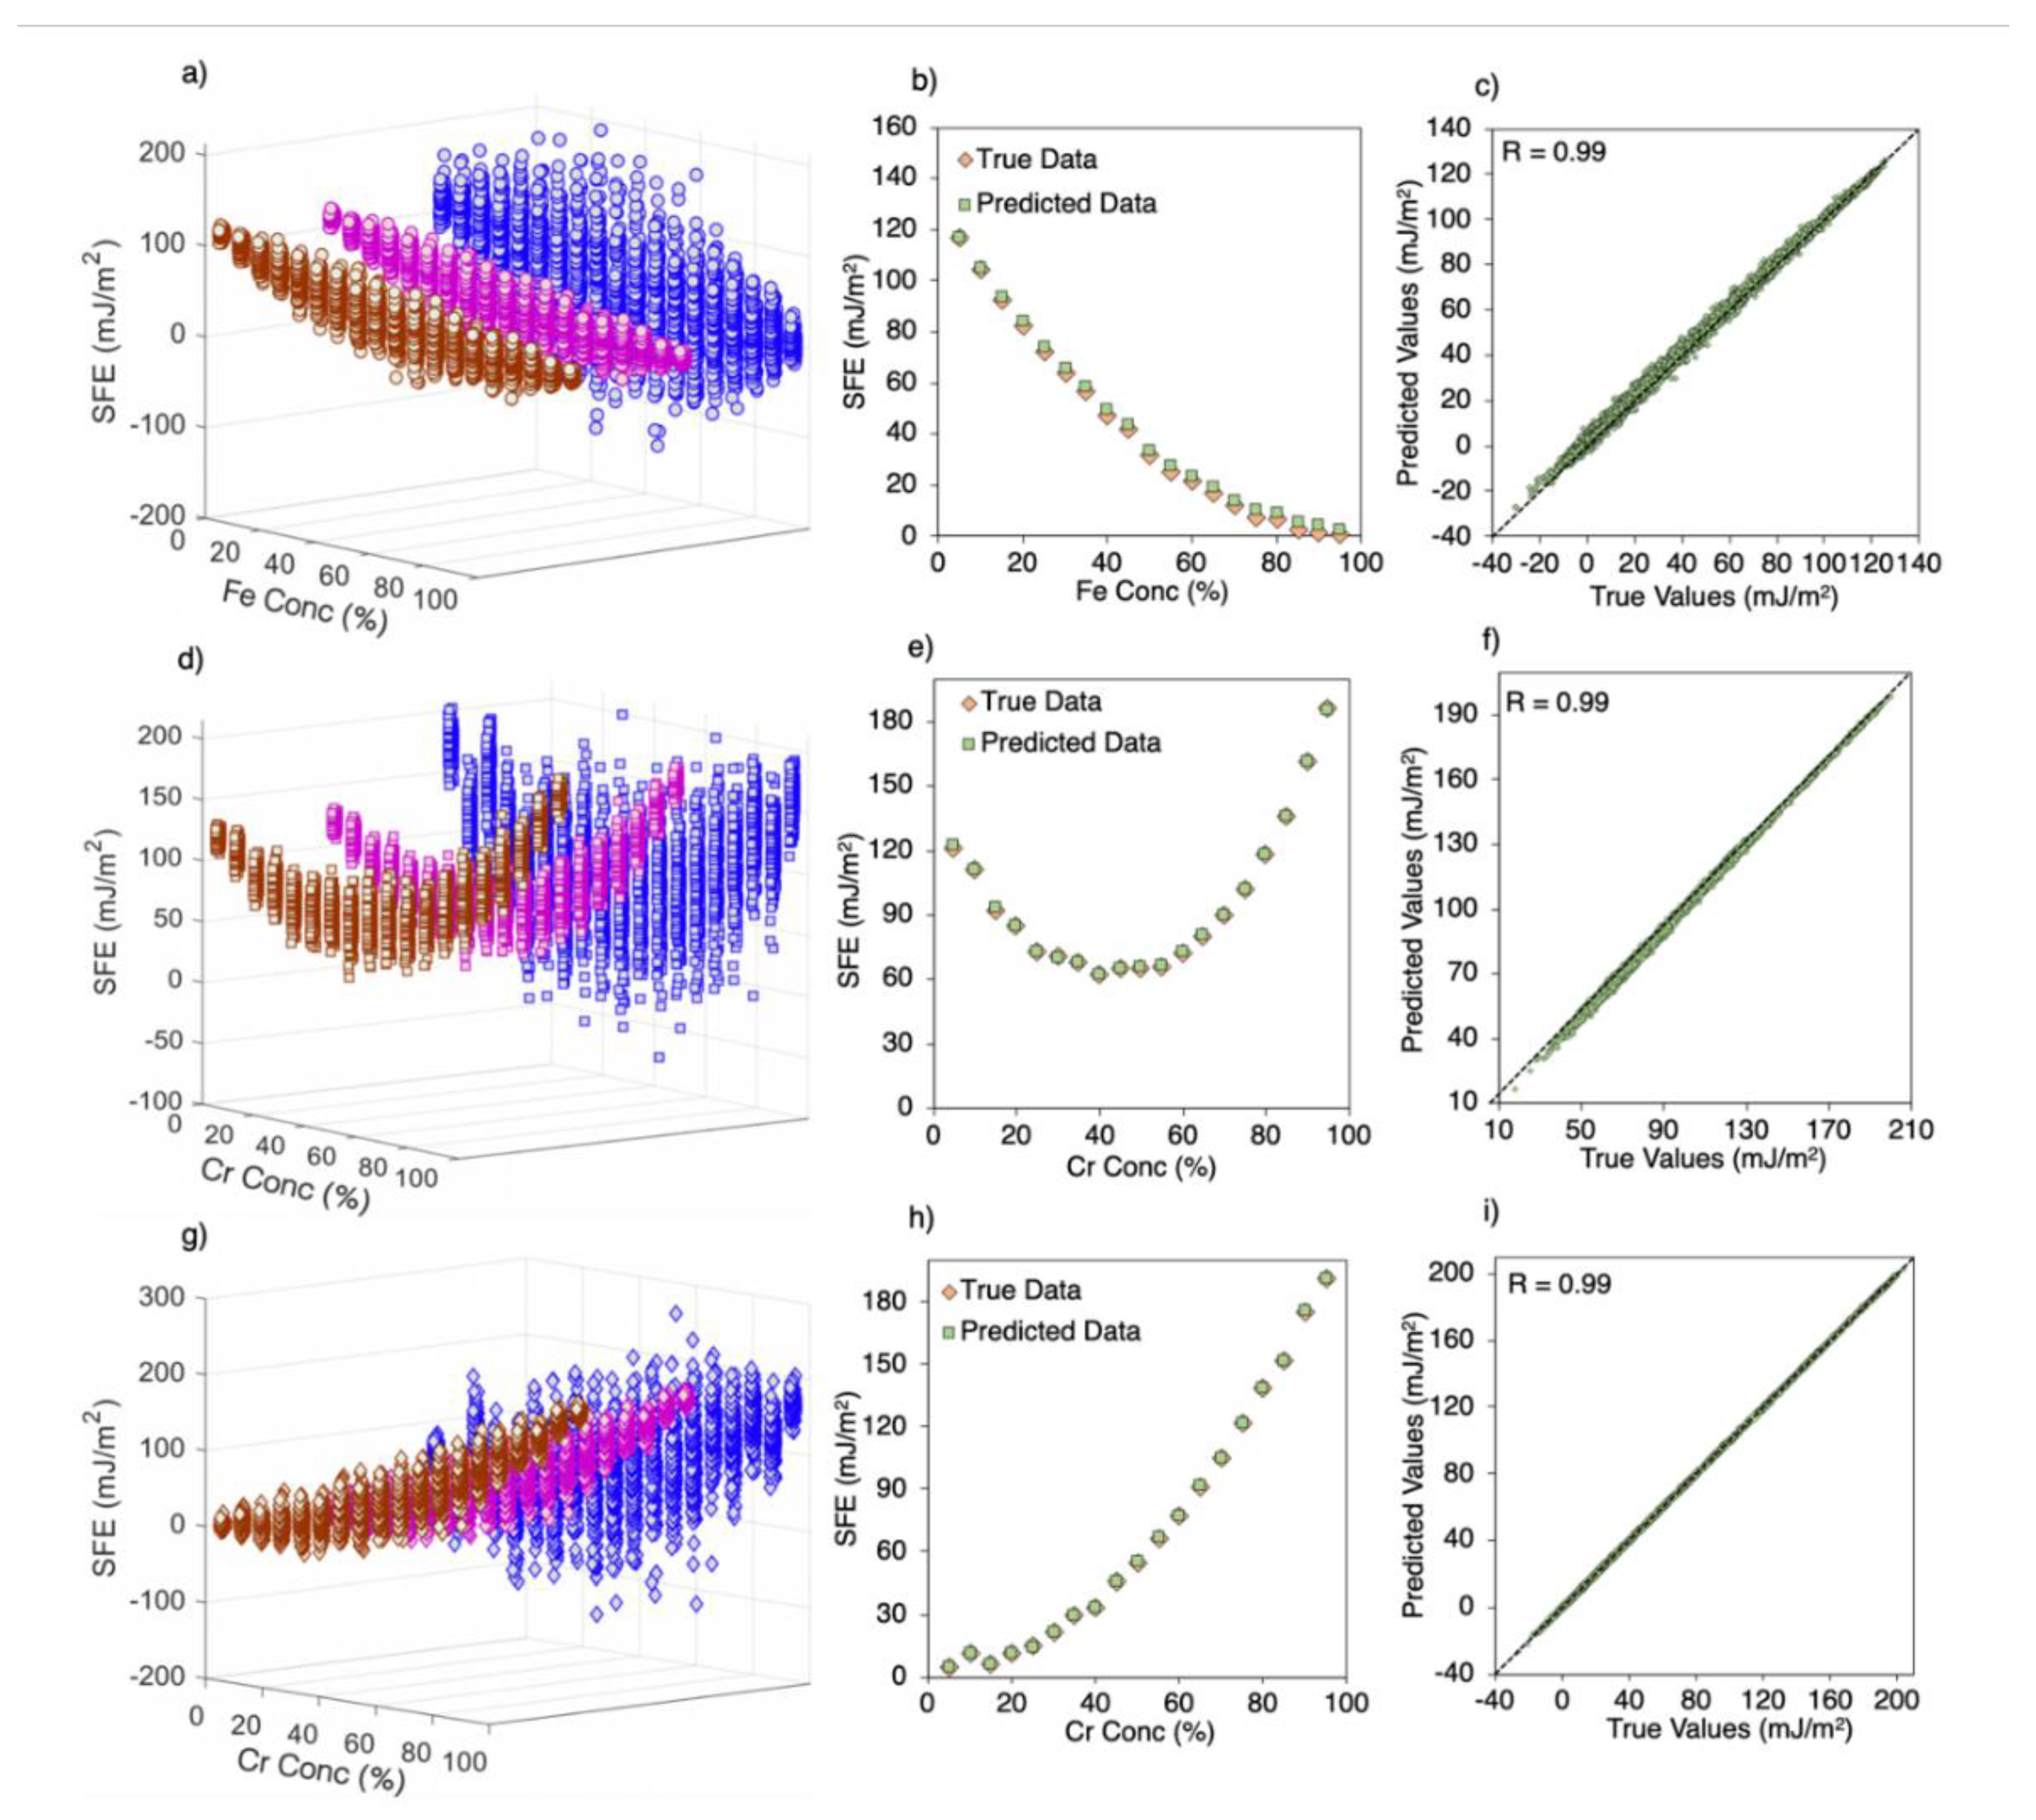
Figure 8a shows a comparison of SFE variation in Ni-Fe between the true data from 480-atom and 4320-atom supercells. In addition, it shows the ML-predicted variation on 4320-atom supercells. Recall that the ML model is trained using the nearest neighbor and SFE information of the 480-atom supercells. Based on the above discussion, the variation decreases from 480-atom to 4320-atom supercells as expected when the true data are compared. More interestingly, we find that the variation in the 4320-atom ML prediction is significantly lower than the true 480-atom supercells and is exactly same as that of the true data of 4320-atom supercells. This is a key result that shows that ML is able to predict a significantly reduced SFE variation by learning from smaller 480-atom supercells. In other words, the large SFE variation in 480-atom supercells is significantly reduced when predicted on larger 4320-atom supercells by the ML model, even though the model is trained on 480-atom supercells. This training has enabled predicting the SFE for unseen environments in larger 4320-atom supercells.
Figure 8b shows the comparison of average SFE between the true-data and ML predicted-data for 4320-atom system. A very good agreement between the two is observed. In particular, ML is able to fully capture the shape of the curve as a function of alloy chemistry, which indicates that the effect of the change in the number of Ni and Fe nearest neighbors on SFE is captured very well. This capability becomes very useful in predicting the SFE of multi-elemental alloys, as shown later in ternary Ni-Fe-Cr system. Figure 8c shows the Pearson coefficient (R) plot between the true and predicted SFE values demonstrating a very good agreement. Overall, these results illustrate that ML is able to club the properties of the two length scales, and the effect of alloy chemistry is now embedded in our ML model.
Figure 8d–f and 8g–i show similar results in Ni-Cr and Fe-Cr alloys, respectively. We find that ML is able to reduce the level of uncertainty in SFE in larger 4320-atom supercells in both alloys by learning from the 480-atom supercells, as shown in Figure 8d,g, respectively. Similarly, the shape of the SFE curve demonstrated by the average SFE of true and ML-predicted in Figure 8e,h are also captured very well. Finally, the Pearson coefficient shows a good agreement between the true and ML-predicted data for both alloys in Figure 8f,i respectively. Table 2 shows the RMSE and Pearson coefficient for Ni-Fe, Ni-Cr, and Fe-Cr, illustrating a very good prediction by the ML model.
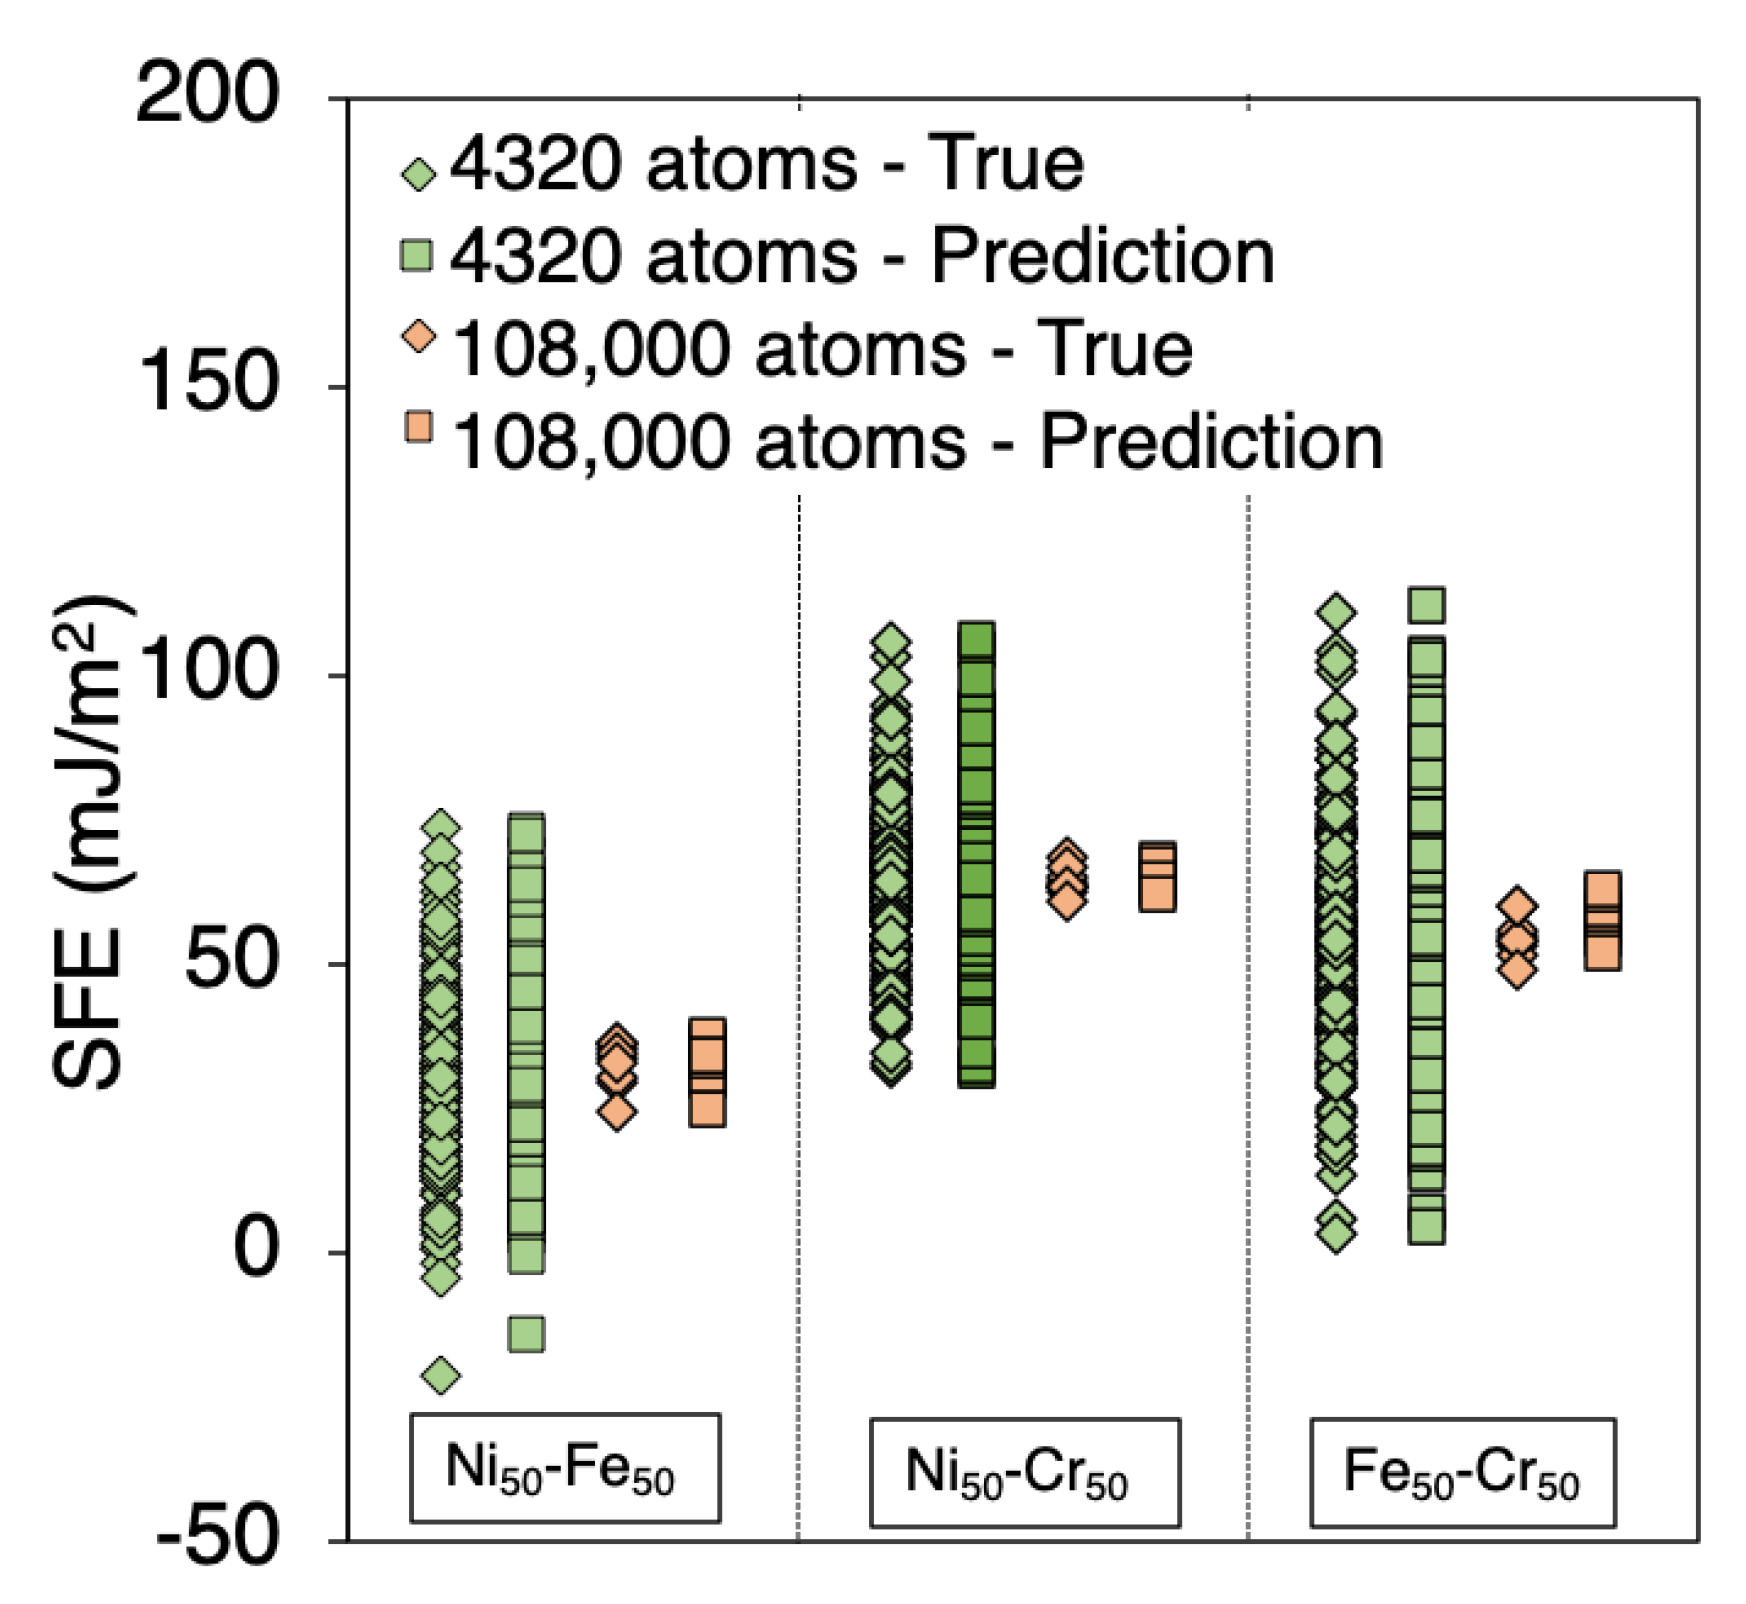
The above results illustrate the benefit of predicting SFE on larger system sizes. An additional benefit of this ML-framework is that it has no limitations on how large the system sizes are used for predictions. Rather, the prediction improves with increasing system sizes as more nearest neighbor environments are included. We illustrate this benefit by predicting SFE on a 108,000-atom system. The results are shown in Figure 9 for 50-50 compositions of Ni-Fe, Ni-Cr, and Fe-Cr. In Figure 9, we compare the true and ML-predicted SFEs of 4320-atom and 108,000-atom supercells for each of the three compositions.
Recall that the training is done only on 480-atom supercells. Here, we use two-hundred supercells of 480-atom each to train the model, and the ML prediction is also made on different two-hundred supercells of 4320 atoms. For 108,000-atom supercells, ML predictions are made on ten different supercell structures. Unsurprisingly, the SFE variation of the true data decreases significantly from 4320-atom to 108,000-atom systems. More interestingly, the ML-predicted variation of the SFE decreases drastically between the two system sizes. The variation in the 4320-atom system is 87.38 mJ/m2, compared to only 12.77 mJ/m2 in the 108,000-atom Ni-Fe system. This result indicates that the ML-model provides a methodology to predict SFE of alloys with an increasing level of precision as the system size increases. It is to be noted that there is no additional computational cost to predict for larger systems from ML unlike in DFT, where each simulation has to be explicitly performed. Thus, we propose that this framework opens a path to predict SFE of an experimentally resembling elemental distribution in a binary alloy with minimized uncertainty.

3.4. Number of Supercells vs ML Precision Tradeoff

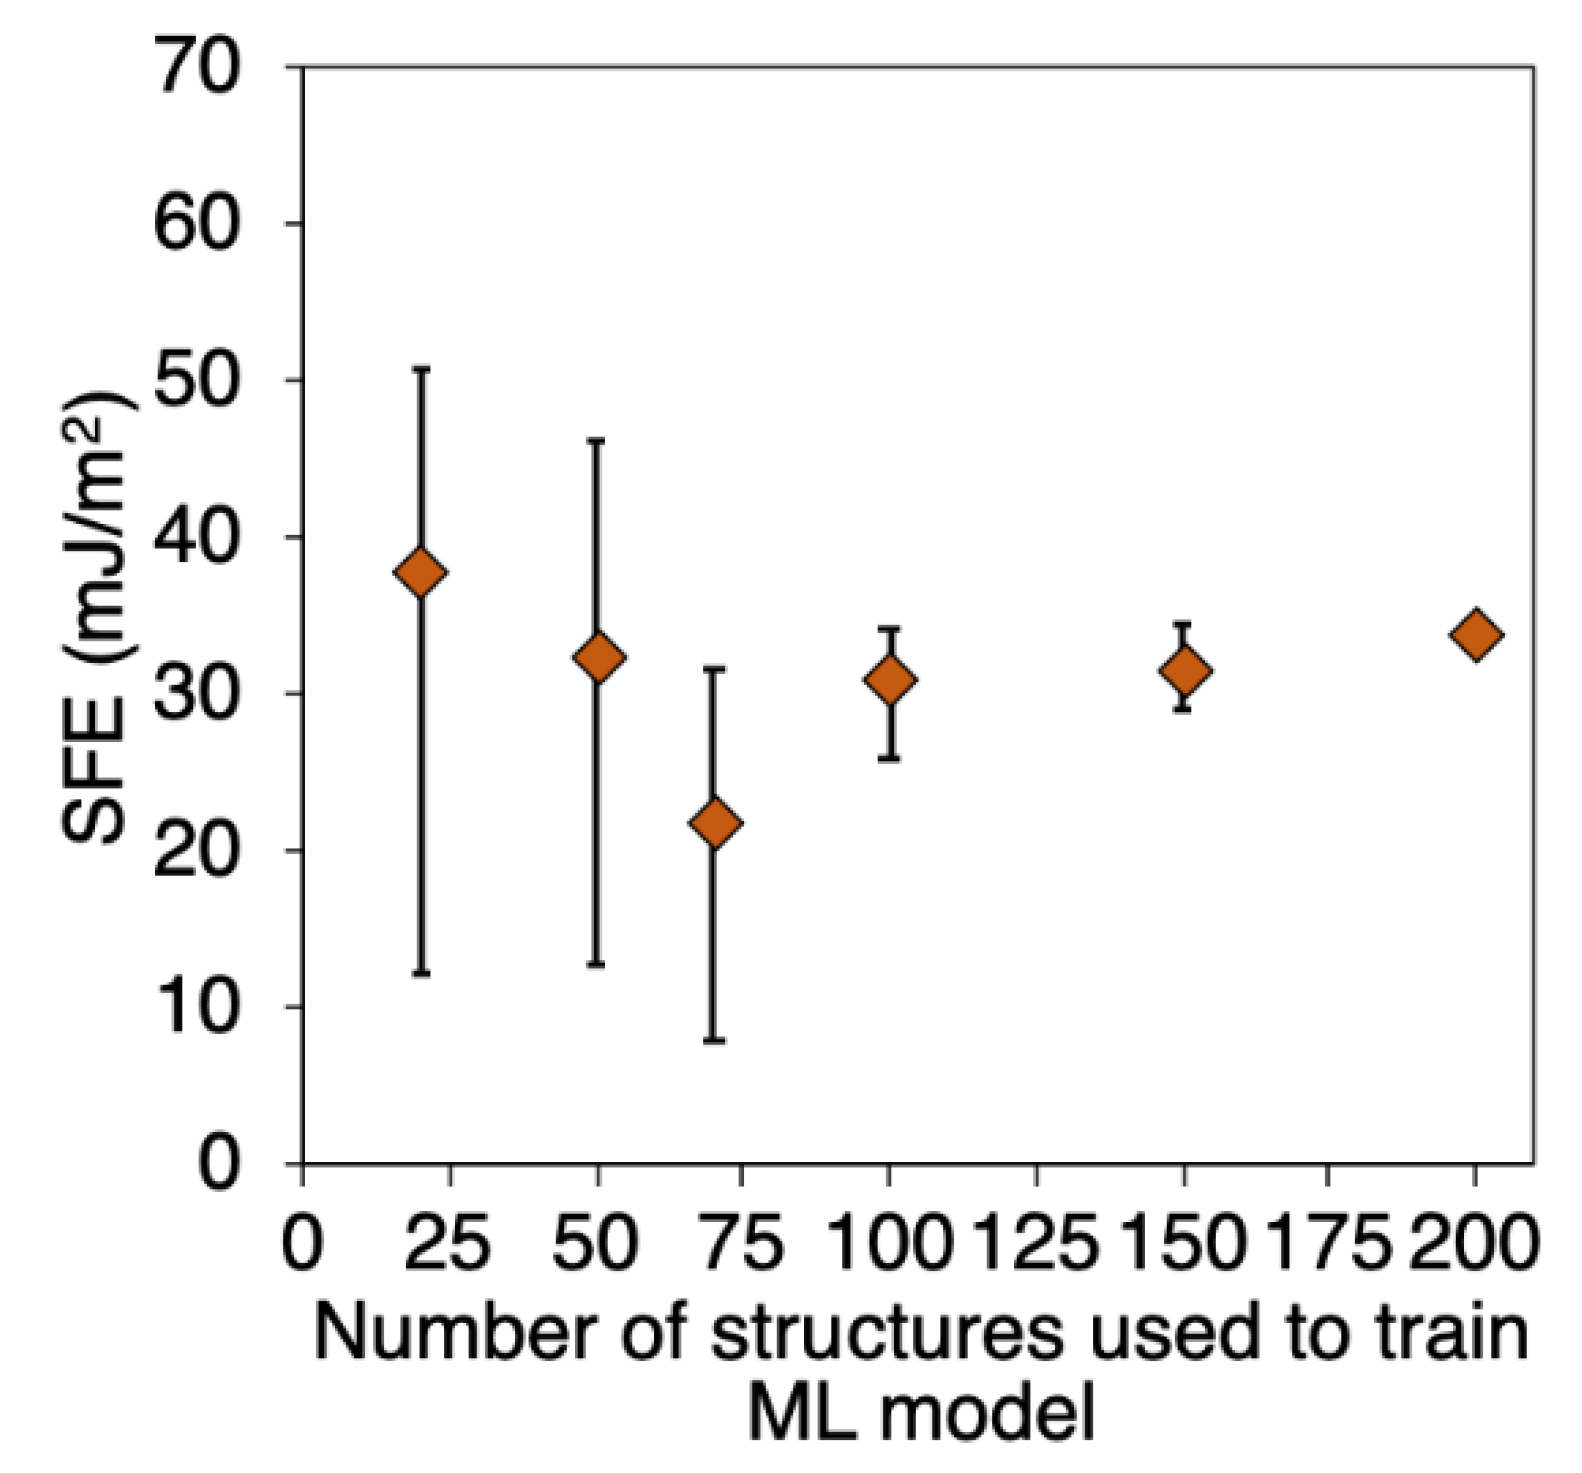
Since the accuracy of ML prediction increases with increasing number of training data, there is a tradeoff between the computational cost and accuracy. Figure 10 provides an overview of a trade-off between the number of supercells and the accuracy of the ML model. A comparison between the variation in SFE prediction with the number of supercells used to train the model is provided. For a given number of training supercells, the model is trained five times with different random states, ensuring complete randomness and generalization while choosing the states used for training the model. In Figure 10, diamonds show the average of those five random states chosen and the error bars represent minimum and maximum observed SFE values. Again, the training is done on 480-atom supercells, while a prediction is made on ten different 108,000-atom supercell structures. Training is done on 480-atom system, because a smaller system size could lead to an interaction between the stacking faults, due to periodic boundary conditions. While the variation is almost negligible when the model is trained with 200 supercells, we find that a reasonable level of accuracy can be achieved by training between 60–90 supercells. We find that the 200-supercells and 70-supercells trained models predict an average SFE of 33.72 mJ/m2 and 21.92 mJ/m2 respectively, which are in close agreement. A variation of 23.51 mJ/m2 is observed when trained on 70 supercells. This shows that the ML model may be optimally trained on 70-supercells of 480 atoms; the number of supercells is still large, but it is practically possible for DFT calculations. We expect the predictions to further improve in the future as we explore other ML models and improve the descriptors used to train the model. This framework thus opens a possibility to predict SFE of complex alloys using DFT calculations.

3.5. Predicting SFE of Ternary Alloys

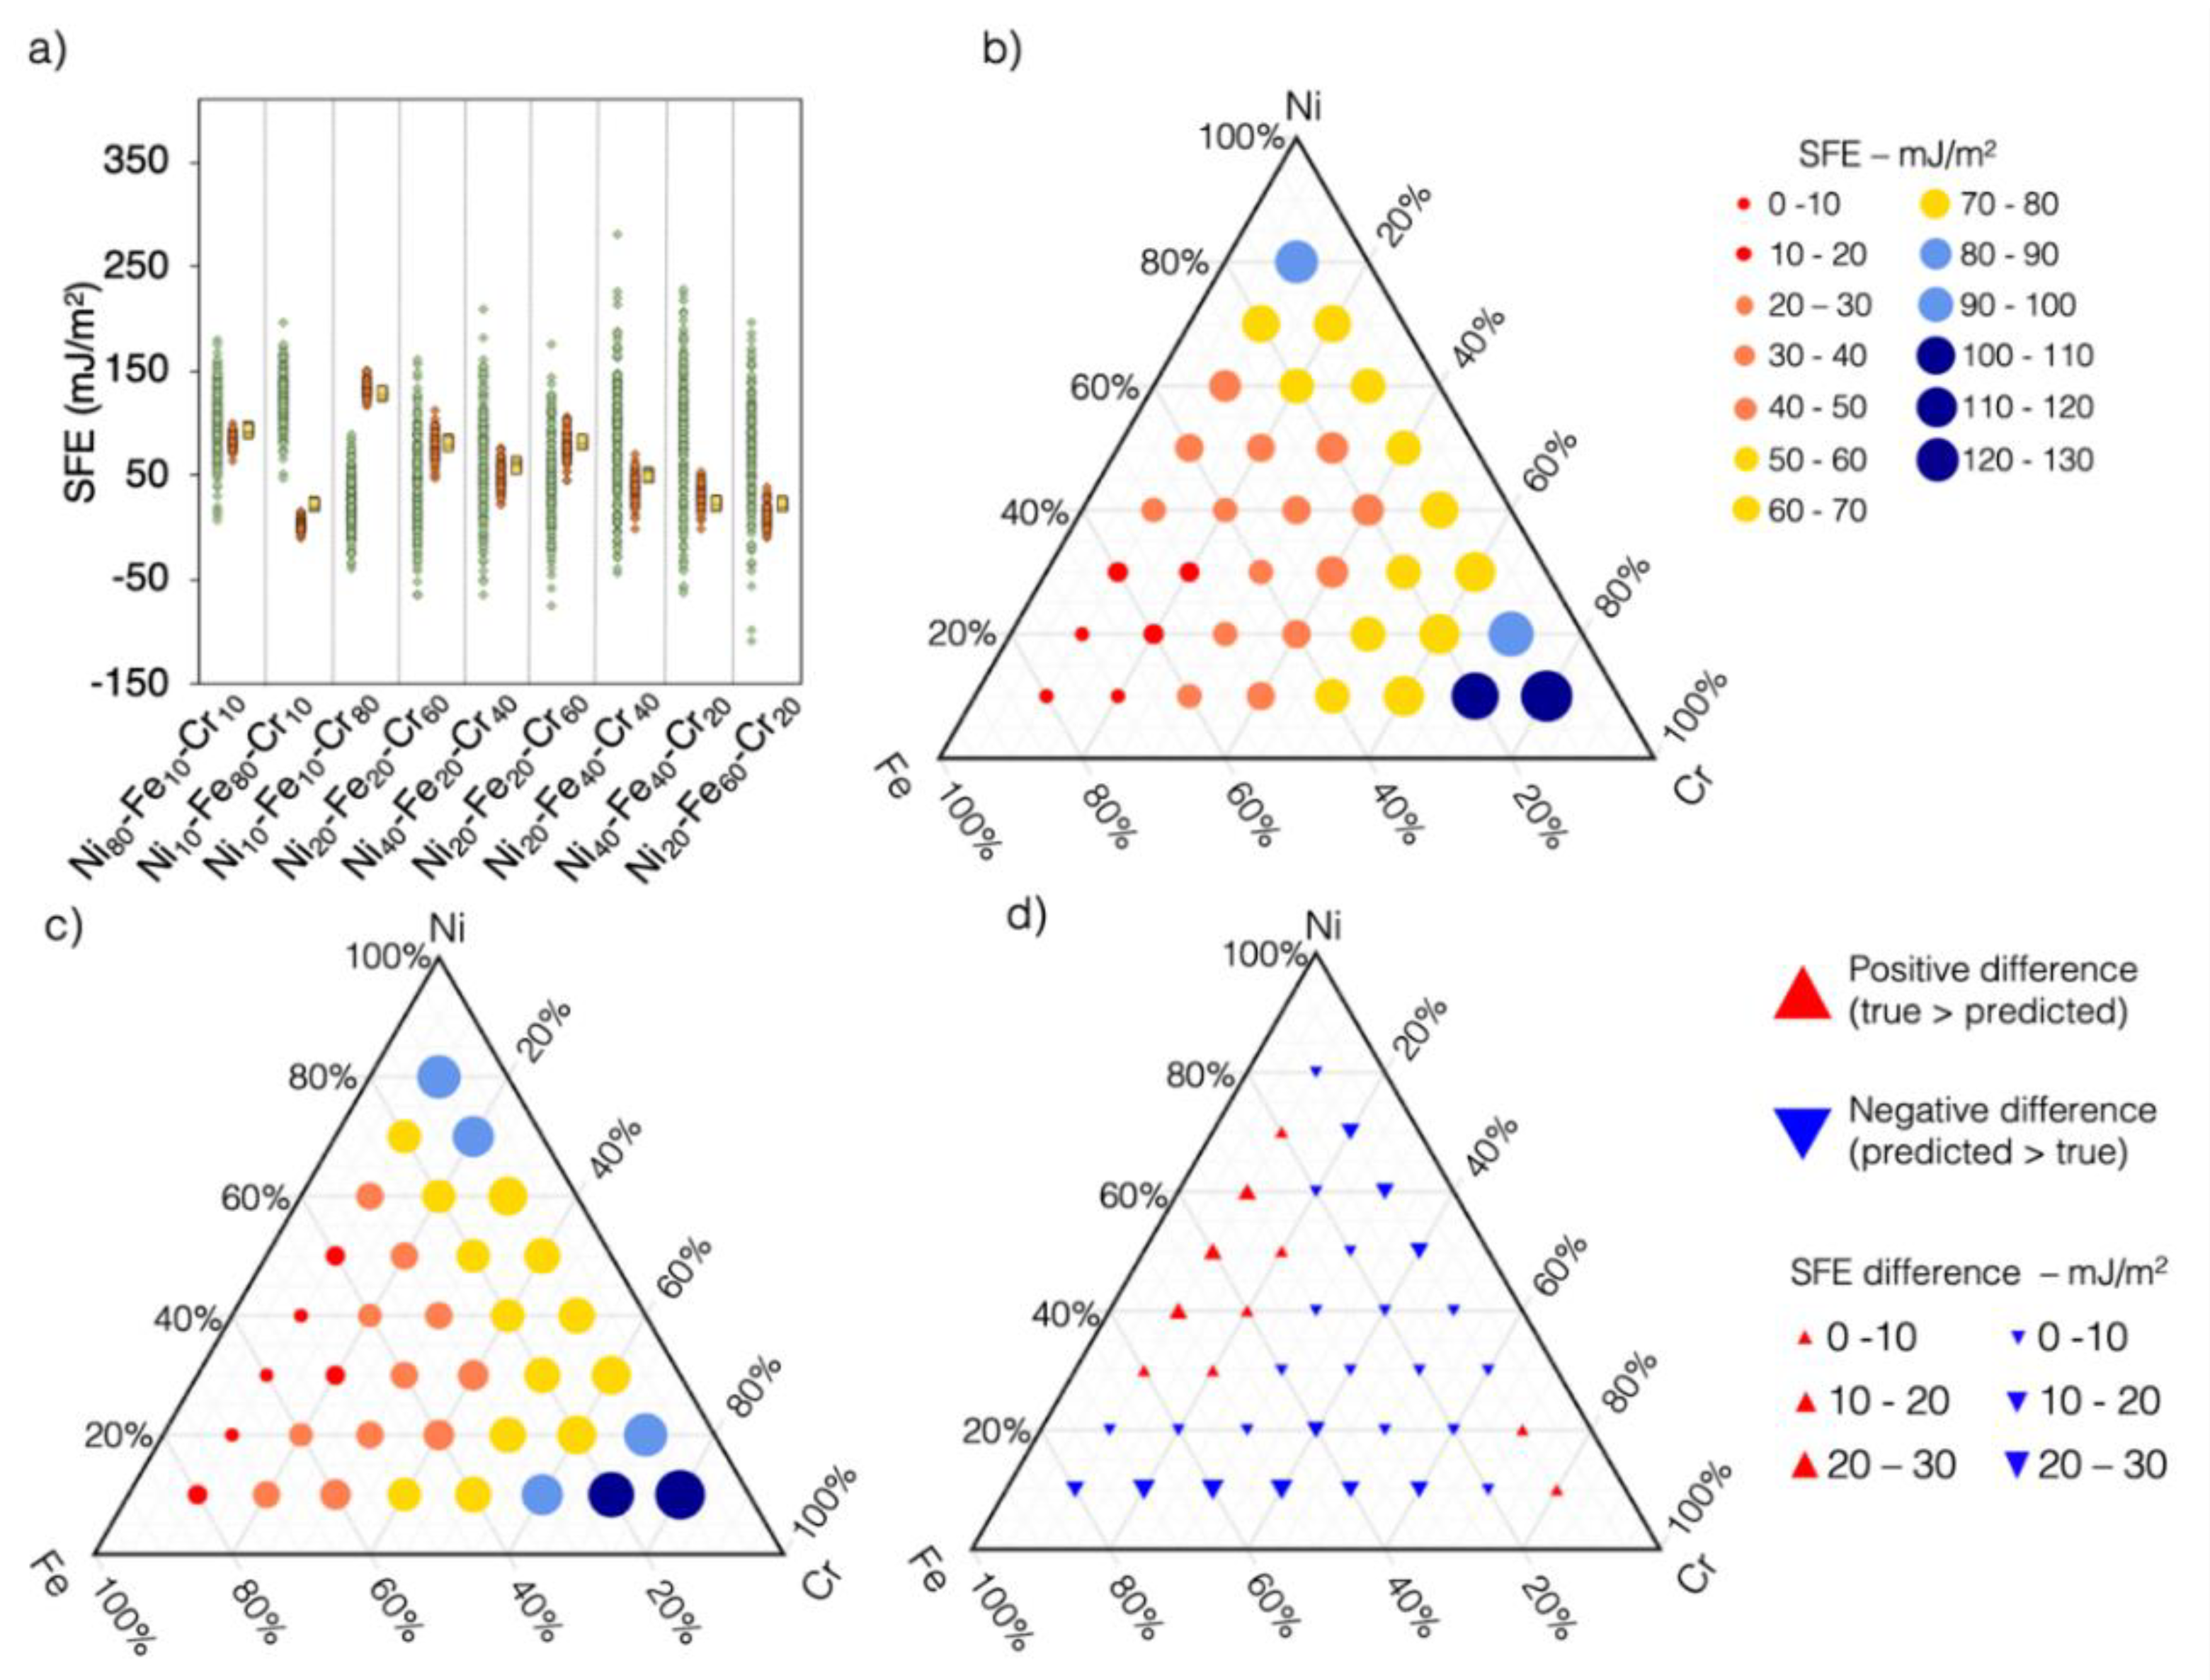
Now, we illustrate the applicability of the framework to ternary alloys in Ni-Fe-Cr phase space. Note that the predictions are made by training the model using the information of the binary alloys, i.e., Ni-Fe, Ni-Cr, and Fe-Cr. Figure 11a shows a comparison of the variations obtained from true SFE data of 480-atom and ML-predictions on 12,000-atom supercells. We find that that the variation in the ML predictions is within 7.81 mJ/m2 which is significantly smaller than the true data of 480-atom supercells.
Finally, we computed SFE across the Ni-Fe-Cr ternary phase diagram. Hundred supercells are used to compute the average SFE for each composition. The true SFE values are calculated by performing the simulations on the supercell exhibiting ternary composition across the whole composition range, as shown in Figure 11b. The ML model is used to predict the SFE of the same compositions as shown in Figure 11c. The difference between the two SFE datasets is shown in Figure 11d for the corresponding ternary compositions. We find that the difference between the true and predicted SFE is less than 20 mJ/m2, except for three compositions that lie between 20–30 mJ/m2. These results thus show that the ML-framework has the ability to predict SFE of ternary compositions from binary compositions.

4. Discussion

In the recent literature, the large variation in SFE has been attributed to limited system sizes used in DFT calculations. In this work, we have presented a ML-based methodology to overcome this limitation. The ML model allows predicting SFE with reduced variation. In addition, it enables predicting SFE of ternary alloys from a binary database. This capability opens a door to predict SFE in multi-elemental alloys from a binary systems database. As the database would grow, the opportunity lies in predicting SFEs of various compositions possibly circumventing the need to perform expensive calculations from scratch for every new composition. It is to be recognized that coherent potential approximation (CPA) method provides as alternative route to calculate SFE in concentrated alloys [12,46,47,48,49]. CPA averages over the scattering given by all possible configurations as found from the Green’s function; as a result, it is not plagued by the limited system size. The CPA method thus provides a platform to compare and improve the predictions of our method, which we plan to perform in near future.
There are certain limitations and assumptions within which the first version of this framework has been developed. The current version relies on the interatomic potential, and the SFE values predicted here may not necessarily agree quantitatively with DFT or experiments. However, developing such agreement is not the main purpose of this paper; rather, we demonstrate that the SFE values if available (either from interatomic potentials or DFT) could be used to build a framework for predicting SFE with minimized variations. While this work serves as the proof-of-concept, we are working on building a DFT-based binary database. In similar vein, we note that, because we have performed calculations using inter-atomic potentials, the magnetic states of atoms are not captured, which have been found to have a significant effect on SFE. Similarly, recent studies have reported that specific elements segregate to the stacking faults which can influence the SFE. For example, Ikeda et al. [40] reported SFE increase with increase in local Ni concentration close to the SF layer in NiCoCr. These authors showed that the SFE increased by 100 mJ/m2, when the layer near the SF is fully occupied with Ni. A similar effect was observed for Cr segregation as well. The effect of short-range order, which is currently a highly debated topic in the HEA community, has also been observed. Ding et al. [32] showed that short range order can significantly change the SFE in NiCoCr. Although it remains to be tested, it is possible the ML model can be potentially trained for specific atomic configurations, including short-range order or segregation-based atomic environments to predict SFE.

5. Conclusions

In conclusion, we built an ML-based framework that can predict the SFE of multi-elemental alloys, while relying only on the input of binary alloys. This framework reduces large variation in the SFEs that have been commonly observed in the recent literature. This framework will contribute towards the rational design of low SFE HEAs, which show a unique combination of high strength and high ductility.

Author Contributions

Conceptualization, G.A. and D.S.A.; Data curation, G.A.; Funding acquisition, D.S.A.; Methodology, G.A. and D.S.A.; Project administration, D.S.A.; Software, G.A.; Supervision, D.S.A.; Writing—original draft, G.A.; Writing—review & editing, G.A. and D.S.A. All authors have read and agreed to the published version of the manuscript.

Funding

This work was supported as part of the Energy Dissipation to Defect Evolution (EDDE), an Energy Frontier Research Center funded by the US Department of Energy, Office of Science, Basic Energy Sciences.

Acknowledgments

We acknowledge the support of computational resources from Advanced Research Computing Center (ARCC) at the University of Wyoming.

Conflicts of Interest

The authors declare that they have no competing financial or non-financial interests.

References

  1. Yeh, J.W.; Chen, S.K.; Lin, S.J.; Gan, J.Y.; Chin, T.S.; Shun, T.T.; Tsau, C.H.; Chang, S.Y. Nanostructured high-entropy alloys with multiple principal elements: Novel alloy design concepts and outcomes. Adv. Eng. Mater. 2004, 6, 299–303. [Google Scholar] [CrossRef]
  2. Yeh, J.W. Recent progress in high-entropy alloys. Ann. Chim. Sci. des Mater. 2006, 31, 633–648. [Google Scholar] [CrossRef]
  3. Tsai, M.H.; Yeh, J.W. High-entropy alloys: A critical review. Mater. Res. Lett. 2014, 2, 107–123. [Google Scholar] [CrossRef]
  4. Gao, M.C.; Liaw, P.K.; Yeh, J.W.; Zhang, Y. High-Entropy Alloys: Fundamentals and Applications; Springer: Cham, Switzerland, 2016. [Google Scholar]
  5. Gorsse, S.; Miracle, D.B.; Senkov, O.N. Mapping the world of complex concentrated alloys. Acta Mater. 2017, 135, 177–187. [Google Scholar] [CrossRef] [Green Version]
  6. Miracle, D.B.; Senkov, O.N. A critical review of high entropy alloys and related concepts. Acta Mater. 2017, 122, 448–511. [Google Scholar] [CrossRef] [Green Version]
  7. Gao, M.C.; Miracle, D.B.; Maurice, D.; Yan, X.; Zhang, Y.; Hawk, J.A. High-entropy functional materials. J. Mater. Res. 2018, 33, 3138–3155. [Google Scholar] [CrossRef] [Green Version]
  8. Miracle, D.B. High entropy alloys as a bold step forward in alloy development. Nat. Commun. 2019, 10, 1–4. [Google Scholar] [CrossRef] [PubMed]
  9. George, E.P.; Raabe, D.; Ritchie, R.O. High-entropy alloys. Nat. Rev. Mater. 2019, 4, 515–534. [Google Scholar] [CrossRef]
  10. Otto, F.; Dlouhý, A.; Somsen, C.; Bei, H.; Eggeler, G.; George, E.P. The influences of temperature and microstructure on the tensile properties of a CoCrFeMnNi high-entropy alloy. Acta Mater. 2013, 61, 5743–5755. [Google Scholar] [CrossRef] [Green Version]
  11. Luo, H.; Li, Z.; Raabe, D. Hydrogen enhances strength and ductility of an equiatomic high-entropy alloy. Sci. Rep. 2017, 7, 1–7. [Google Scholar] [CrossRef] [Green Version]
  12. Huang, S.; Huang, H.; Li, W.; Kim, D.; Lu, S.; Li, X.; Holmström, E.; Kwon, S.K.; Vitos, L. Twinning in metastable high-entropy alloys. Nat. Commun. 2018, 9, 1–7. [Google Scholar] [CrossRef] [PubMed]
  13. Zaddach, A.J.; Scattergood, R.O.; Koch, C.C. Tensile properties of low-stacking fault energy high-entropy alloys. Mater. Sci. Eng. A 2015, 636, 373–378. [Google Scholar] [CrossRef]
  14. Joo, S.H.; Kato, H.; Jang, M.J.; Moon, J.; Tsai, C.W.; Yeh, J.W.; Kim, H.S. Tensile deformation behavior and deformation twinning of an equimolar CoCrFeMnNi high-entropy alloy. Mater. Sci. Eng. A 2017, 689, 122–133. [Google Scholar] [CrossRef]
  15. Liu, J.; Chen, C.; Xu, Y.; Wu, S.; Wang, G.; Wang, H.; Fang, Y.; Meng, L. Deformation twinning behaviors of the low stacking fault energy high-entropy alloy: An in-situ TEM study. Scr. Mater. 2017, 137, 9–12. [Google Scholar] [CrossRef]
  16. Steinmetz, D.R.; Jäpel, T.; Wietbrock, B.; Eisenlohr, P.; Gutierrez-Urrutia, I.; Saeed–Akbari, A.; Hickel, T.; Roters, F.; Raabe, D. Revealing the strain-hardening behavior of twinning-induced plasticity steels: Theory, simulations, experiments. Acta Mater. 2013, 61, 494–510. [Google Scholar] [CrossRef]
  17. Mohammadzadeh, M.; Mohammadzadeh, R. Effect of interstitial and substitution alloying elements on the intrinsic stacking fault energy of nanocrystalline fcc-iron by atomistic simulation study. Appl. Phys. A Mater. Sci. Process. 2017, 123, 1–9. [Google Scholar] [CrossRef]
  18. Pierce, D.T.; Jiménez, J.A.; Bentley, J.; Raabe, D.; Wittig, J.E. The influence of stacking fault energy on the microstructural and strain-hardening evolution of Fe-Mn-Al-Si steels during tensile deformation. Acta Mater. 2015, 100, 178–190. [Google Scholar] [CrossRef]
  19. Chen, L.; Zhao, Y.; Qin, X. Some Aspects of High Manganese Twinning-Induced Plasticity (TWIP) Steel, A Review. Acta Met. Sin. (Engl. Lett.) 2013, 26, 1–15. [Google Scholar] [CrossRef] [Green Version]
  20. Li, Z.; Pradeep, K.G.; Deng, Y.; Raabe, D.; Tasan, C.C. Metastable high-entropy dual-phase alloys overcome the strength-ductility trade-off. Nature 2016, 534, 227–230. [Google Scholar] [CrossRef]
  21. Liu, S.F.; Wu, Y.; Wang, H.T.; Lin, W.T.; Shang, Y.Y.; Liu, J.B.; An, K.; Liu, X.J.; Wang, H.; Lu, Z.P. Transformation-reinforced high-entropy alloys with superior mechanical properties via tailoring stacking fault energy. J. Alloys Compd. 2019, 792, 444–455. [Google Scholar] [CrossRef]
  22. Kim, J.H.; Lim, K.R.; Won, J.W.; Na, Y.S.; Kim, H.S. Mechanical properties and deformation twinning behavior of as-cast CoCrFeMnNi high-entropy alloy at low and high temperatures. Mater. Sci. Eng. A 2018, 712, 108–113. [Google Scholar] [CrossRef]
  23. Deng, Y.; Tasan, C.C.; Pradeep, K.G.; Springer, H.; Kostka, A.; Raabe, D. Design of a twinning-induced plasticity high entropy alloy. Acta Mater. 2015, 94, 124–133. [Google Scholar] [CrossRef]
  24. Wang, Z.; Baker, I.; Cai, Z.; Chen, S.; Poplawsky, J.D.; Guo, W. The effect of interstitial carbon on the mechanical properties and dislocation substructure evolution in Fe40.4Ni11.3Mn34.8Al7.5Cr6 high entropy alloys. Acta Mater. 2016, 120, 228–239. [Google Scholar] [CrossRef] [Green Version]
  25. Hartford, J.; von Sydow, B.; Wahnström, G.; Lundqvist, B. Peierls barriers and stresses for edge dislocations in Pd and Al calculated from first principles. Phys. Rev. B. 1998, 58, 2487–2496. [Google Scholar] [CrossRef]
  26. Zhao, S.; Stocks, G.M.; Zhang, Y. Stacking fault energies of face-centered cubic concentrated solid solution alloys. Acta Mater. 2017, 134, 334–345. [Google Scholar] [CrossRef]
  27. De Campos, M.F. Selected values for the stacking fault energy of face centered cubic metals. Mater. Sci. Forum 2008, 591–593, 708–711. [Google Scholar] [CrossRef]
  28. Zhang, P.; An, X.H.; Zhang, Z.J.; Wu, S.D.; Li, S.X.; Zhang, Z.F.; Figueiredo, R.B.; Gao, N.; Langdon, T.G. Optimizing strength and ductility of Cu – Zn alloys through severe plastic deformation. Scr. Mater. 2012, 67, 871–874. [Google Scholar] [CrossRef]
  29. Shang, S.L.; Zacherl, C.L.; Fang, H.Z.; Wang, Y.; Du, Y.; Liu, Z.K. Effects of alloying element and temperature on the stacking fault energies of dilute Ni-base superalloys. J. Phys. Condens. Matter 2012, 24, 1–14. [Google Scholar] [CrossRef]
  30. Yu, P.; Zhuang, Y.; Chou, J.P.; Wei, J.; Lo, Y.C.; Hu, A. The influence of dilute aluminum and molybdenum on stacking fault and twin formation in FeNiCoCr-based high entropy alloys based on density functional theory. Sci. Rep. 2019, 9, 1–8. [Google Scholar] [CrossRef] [Green Version]
  31. Zhang, Y.H.; Zhuang, Y.; Hu, A.; Kai, J.J.; Liu, C.T. The origin of negative stacking fault energies and nano-twin formation in face-centered cubic high entropy alloys. Scr. Mater. 2017, 130, 96–99. [Google Scholar] [CrossRef]
  32. Ding, J.; Yu, Q.; Asta, M.; Ritchie, R.O. Tunable stacking fault energies by tailoring local chemical order in CrCoNi medium-entropy alloys. Proc. Natl. Acad. Sci. USA 2018, 115, 8919–8924. [Google Scholar] [CrossRef] [PubMed] [Green Version]
  33. Zhang, Z.; Sheng, H.; Wang, Z.; Gludovatz, B.; Zhang, Z.; George, E.P.; Yu, Q.; Mao, S.X.; Ritchie, R.O. Dislocation mechanisms and 3D twin architectures generate exceptional strength-ductility-toughness combination in CrCoNi medium-entropy alloy. Nat. Commun. 2017, 8, 1–8. [Google Scholar] [CrossRef] [PubMed]
  34. Niu, C.; LaRosa, C.R.; Miao, J.; Mills, M.J.; Ghazisaeidi, M. Magnetically-driven phase transformation strengthening in high entropy alloys. Nat. Commun. 2018, 9, 1–9. [Google Scholar] [CrossRef] [PubMed]
  35. Chandran, M.; Sondhi, S.K. First-principle calculation of stacking fault energies in Ni and Ni-Co alloy. J. Appl. Phys. 2011, 109, 103525. [Google Scholar] [CrossRef]
  36. Wang, X.; Niu, L.; Wang, S. Energetics analysis of interstitial loops in single-phase concentrated solid-solution alloys. J. Nucl. Mater. 2018, 501, 94–103. [Google Scholar] [CrossRef]
  37. Siegel, D.J. Generalized stacking fault energies, ductilities, and twinnabilities of Ni and selected Ni alloys. Appl. Phys. Lett. 2005, 87, 1–3. [Google Scholar] [CrossRef] [Green Version]
  38. Laplanche, G.; Kostka, A.; Reinhart, C.; Hunfeld, J.; Eggeler, G.; George, E.P. Reasons for the superior mechanical properties of medium-entropy CrCoNi compared to high-entropy CrMnFeCoNi. Acta Mater. 2017, 128, 292–303. [Google Scholar] [CrossRef]
  39. Liu, S.F.; Wu, Y.; Wang, H.T.; He, J.Y.; Liu, J.B.; Chen, C.X.; Liu, X.J.; Wang, H.; Lu, Z.P. Stacking fault energy of face-centered-cubic high entropy alloys. Intermetallics 2018, 93, 269–273. [Google Scholar] [CrossRef]
  40. Ikeda, Y.; Körmann, F.; Tanaka, I.; Neugebauer, J. Impact of Chemical Fluctuations on Stacking Fault Energies of CrCoNi and CrMnFeCoNi High Entropy. Entropy 2018, 20, 655. [Google Scholar] [CrossRef] [Green Version]
  41. Zhang, J.; Dou, Y.; Liu, G.; Guo, Z. First-principles study of stacking fault energies in Mg-based binary alloys. Comput. Mater. Sci. 2013, 79, 564–569. [Google Scholar] [CrossRef]
  42. Plimpton, S. Fast parallel algorithms for short-range molecular dynamics. J. Comput. Phys. 1995, 117, 1–19. [Google Scholar] [CrossRef] [Green Version]
  43. Bonny, G.; Castin, N.; Terentyev, D. Interatomic potential for studying ageing under irradiation in stainless steels: The FeNiCr model alloy. Model. Simul. Mater. Sci. Eng. 2013, 21, 085004. [Google Scholar] [CrossRef]
  44. Liu, Y.; Zhao, T.; Ju, W.; Shi, S. Materials discovery and design using machine learning. J Mater. 2017, 3, 159–177. [Google Scholar] [CrossRef]
  45. Muller, A.C.; Guido, S. Introduction to Machine Learning with Python: A Guide for Data Scientists; O’Reilly Media: Sebastopol, CA, USA, 2017. [Google Scholar]
  46. Huang, S.; Li, W.; Lu, S.; Tian, F.; Shen, J.; Holmström, E.; Vitos, L. Temperature dependent stacking fault energy of FeCrCoNiMn high entropy alloy. Scr. Mater. 2015, 108, 44–47. [Google Scholar] [CrossRef]
  47. Li, W.; Lu, S.; Hu, Q.M.; Kwon, S.K.; Johansson, B.; Vitos, L. Generalized stacking fault energies of alloys. J. Phys. Condens. Matter 2014, 26, 265005. [Google Scholar] [CrossRef]
  48. Li, R.; Lu, S.; Kim, D.; Schönecker, S.; Zhao, J.; Kwon, S.K.; Vitos, L. Stacking fault energy of face-centered cubic metals: Thermodynamic and ab initio approaches. J. Phys. Condens. Matter 2016, 28, 395001. [Google Scholar] [CrossRef] [Green Version]
  49. Kibey, S.; Liu, J.B.; Curtis, M.J.; Johnson, D.D.; Sehitoglu, H. Effect of nitrogen on generalized stacking fault energy and stacking fault widths in high nitrogen steels. Acta Mater. 2006, 54, 2991–3001. [Google Scholar] [CrossRef]
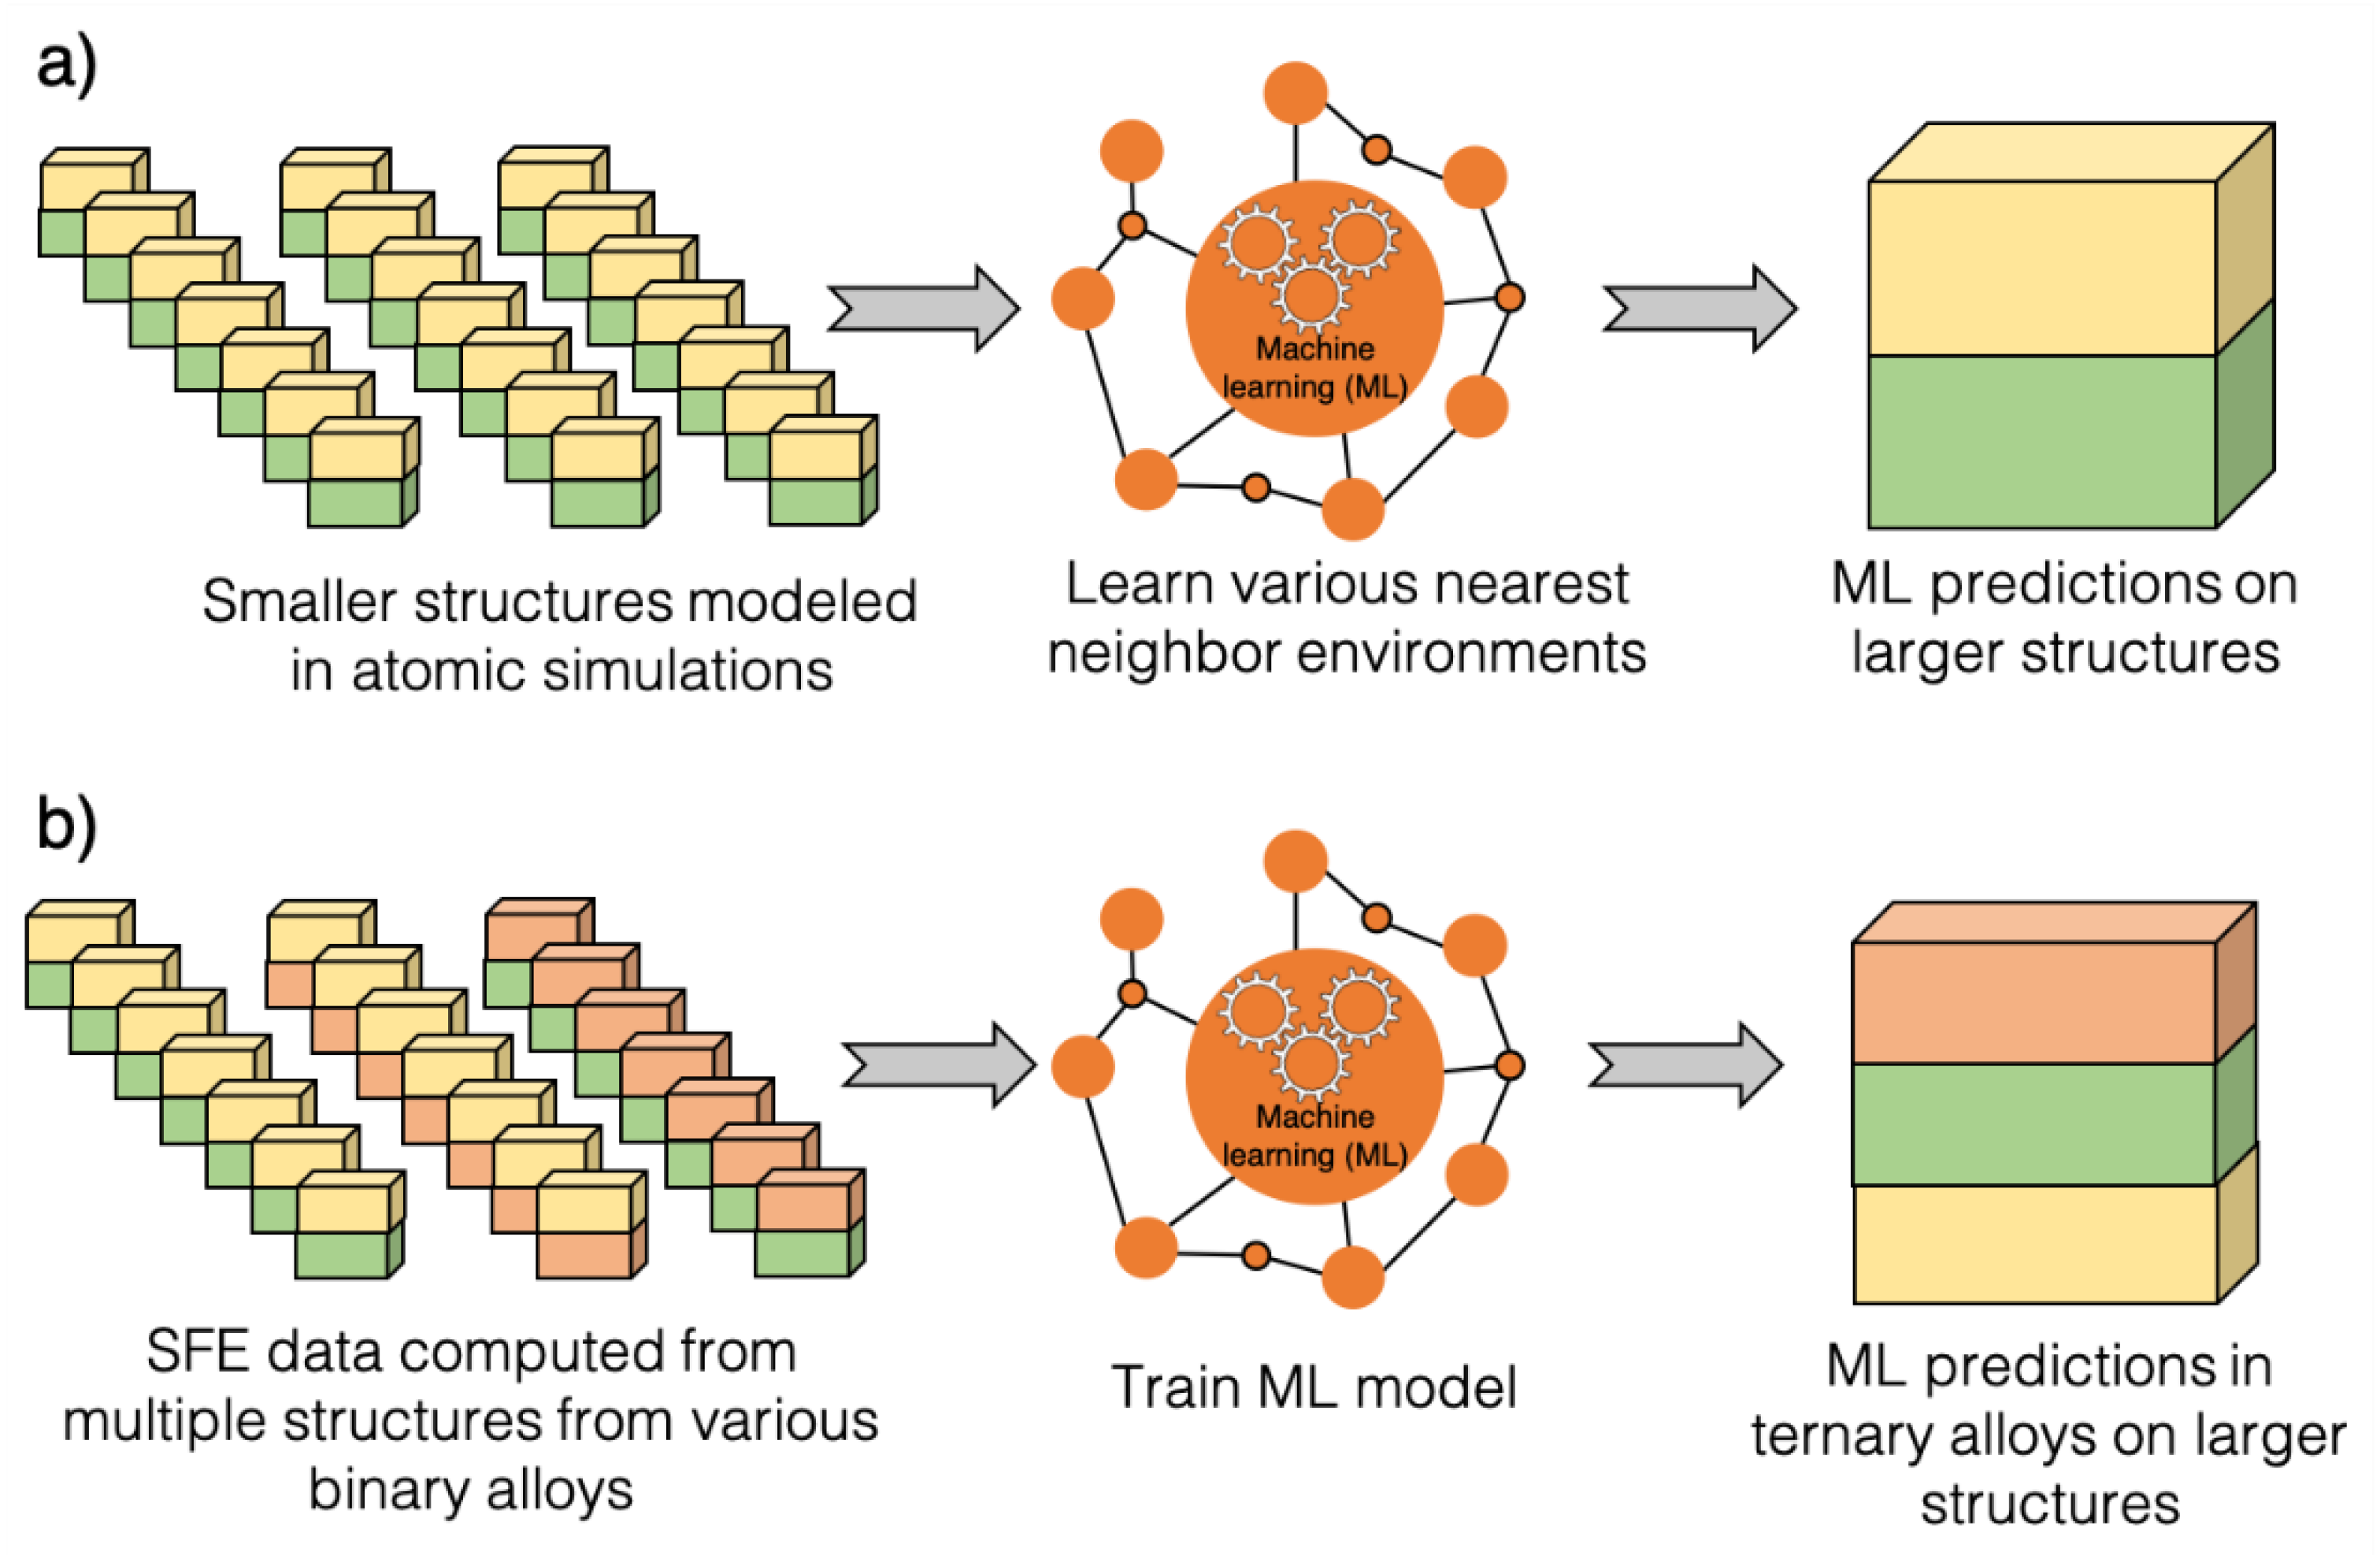
Figure 1. Schematic representation of the methodology used to train and predict SFE (stacking fault energy) using ML (machine learning). (a) The SFE and the nearest neighbor information is extracted from smaller supercells, which is used to train ML model to predict SFE of larger supercells. (b) SFE and the nearest neighbor information is extracted from various binary alloys, which is used to train ML model to predict SFE of ternary alloys.
Metals 10 01072 g001
Figure 2. (a) ABCABC… planar stacking in the fcc structure. (b) Stacking fault in the planar sequence resulting in local hcp structure as shown by red colored atoms. (c) Schematic representing a minimum distance between two periodically repeating stacking faults used in the simulations.
Metals 10 01072 g002
Figure 3. Representation of the data in the form of spreadsheet used to train the machine learning model to predict SFE of (a) binary alloys and (b) ternary alloys. In (a), separate spreadsheets are created for perfect and faulted structures. The bond lengths for each type of A-A, B-B, and A-B bonds are documented up to 7 Å and are binned at an interval of 0.1 Å. The number of bonds of each type under corresponding bond length are included. The resulting SFE for each structure is included into the spreadsheet. In (b), shaded boxes represent the bond information of a particular bond type, while empty boxes represent no information for that particular bond type. The zoomed-in view of a shaded box shows the bond length information used to train the model, similar to (a).
Metals 10 01072 g003
Figure 4. Effect of system size on the distribution of SFE. Four systems sizes, i.e., 48 atoms (green bar), 120 atoms (orange bar), 480 atoms (yellow bar), and 6000 atoms (blue bar) are shown. Data is collected by performing 100 simulations for each system size. A As the system size increases the variation in the SFE decreases. The data is shown only for one alloy composition, i.e., Ni50-Fe50.
Metals 10 01072 g004
Figure 5. Two different atomic structures used to compute SFE for Ni50-Fe50 alloy. Large SFE variation (−98.72 mJ/m2 vs 202.53 mJ/m2) is observed. Resulting nearest neighbor environments can be significantly different between perfect and faulted structures when a stacking fault is created. Enlarged insets show such significantly different nearest neighbor environments between the perfect and faulted structures. (Gold and green colors represent A and B atoms of a binary alloy).
Metals 10 01072 g005
Figure 6. SFE variation across the composition range in (ac) Ni-Fe, (df) Ni-Cr, and (gi) Fe-Cr at an interval of 5% in 480, 4320, and 108,000-atom systems. SFE variation decreases as the system size increases due to increasing number of nearest neighbor environments that are captured in large system sizes. SFE variation is maximum for the composition near the center of the phase diagram due to larger number of possible nearest neighbor environments compared to the ends of the composition range.
Metals 10 01072 g006
Figure 7. Effect of alloy chemistry on the average SFE in Ni-Fe, Ni-Cr, and Fe-Cr alloys computed in 108,000-atom supercells. Data from Figure 6 is used to calculate the average for each alloy chemistry. The SFE for Ni-Fe and Fe-Cr system varies almost linearly in contrast to parabolic behavior in Ni-Cr.
Metals 10 01072 g007
Figure 8. (ac) Ni-Fe, (df) Ni-Cr, and (gi) Fe-Cr. (a,d,g) SFE comparison among true data for 480-atom (blue circles), true data for 4320-atom (pink circles), and ML-predicted data for 4320-atom supercells (brown circles).The SFE variation from ML prediction, which is trained on 480-atom supercells, is almost of the same range as that of the true data of 4320-atom supercells, indicating the ability of ML to learn and predict SFE with high accuracy. (b,e,h) Average SFE comparison between true and predicted data for 4320-atom supercells. (c,f,i) Pearson plot between true and predicted value for 4320-atom supercells. Pearson coefficient of 0.99 indicates excellent match between true and predicted values.
Metals 10 01072 g008
Figure 9. Comparison between true and predicted SFE for both 4320-atom and 108,000-atom supercells for Ni50-Fe50, Ni50-Cr50, and Fe50-Cr50 compositions. Significantly reduced various is observed in 108,000-atom compared to 4320-atom supercells. The variation in the ML predictions is of the same range as that of the true-data for both structure sizes, indicating the ability of the model to learn and predict for various nearest neighbor environments. Color scheme: green diamonds—true data for 4320-atom supercell, green squares—predicted data for 4320-atom supercell, orange diamonds—true data for 108,000-atom supercell, and orange squares—predicted data for 108,000-atom supercell.
Metals 10 01072 g009
Figure 10. Correlation between the number of 480-atom supercells used to train the model and the variation in the ML-predicted SFE. Diamonds show the average SFE.
Metals 10 01072 g010
Figure 11. (a) SFE comparison between true-data for 480-atom and predicted-data for 12,000-atom supercells for nine different Ni-Fe-Cr ternary composition. True data for the 480-atom and 12,000-atom system is shown in green and brown color diamonds, while predicted data for 12,000-atom system in shown by yellow squares. Significantly reduced SFE variation is observed in both 12,000-atom ML-predicted compared to 480-atom true supercells. (b) True and (c) predicted SFEs in ternary Ni-Fe-Cr phase diagram. (d) Difference between true and predicted SFE from (b) and (c) for each composition. Very small difference between the two is observed illustrating the robustness of the ML model.
Metals 10 01072 g011
Table 1. SFE average (avg.), range of variation (r.v) and standard deviation (std.) for Ni50-Fe50 compositions obtained from 100 different structures each for 48, 480, 6,000 and 108,000-atom supercells.
System Size48 atoms480 atoms6000 atoms108,000 atoms
Parametersavg.r.vstd.avg.r.vstd.avg.r.vstd.avg.r.vstd.
Ni-Fe53.17537.5990.9428.00264.6949.8430.4081.1719.2933.6518.373.68
Ni-Cr64.95337.6860.4163.07201.9433.9564.3270.4515.6564.8411.982.64
Fe-Cr45.17500.5596.9645.81252.0548.0045.81100.8823.7352.8017.743.71
Table 2. Root mean square error (RMSE) and Pearson coefficient values of Ni-Fe, Ni-Cr, and Fe-Cr for 4320-atom supercells.
CompositionRMSEPearson Coefficient
Ni-Fe2.760.996
Ni-Cr1.300.998
Fe-Cr0.570.998