Abstract
The realization of the increasing automation of production systems requires the guarantee of process security as well as the resulting workpiece quality. For this purpose, monitoring systems are used, which monitor the machining based on machine control signals and external sensors. These systems are challenged by innovative design concepts such as hybrid components made of different materials, which lead to new disturbance variables in the process. Therefore, it is important to obtain as much process information as possible in order to achieve a robust and sensitive evaluation of the machining. Feeling machines with force sensing capabilities represent a promising approach to assist the monitoring. This paper provides, for the first time, an overview of the suitability of the feeling machine for process monitoring during turning operations. The process faults tool breakage, tool wear, and the variation of the material transition position of hybrid shafts that were researched and compared with a force dynamometer. For the investigation, longitudinal turning processes with shafts made of EN AW-6082 and 20MnCr5 were carried out. The results show the feeling machine is sensitive to all kinds of examined errors and can compete with a force dynamometer, especially for roughing operations.
1. Introduction
In production, the aim is to achieve full automation of manufacturing through autonomous machining processes. In this context, process monitoring systems are an important part of modern production plants. They protect machines and machine operators from damage, reduce downtime, and improve workpiece quality by eliminating chatter [1]. Rehorn et al. estimated, if the computer numerical control (CNC) machine tool is equipped with a monitoring system, downtime can be reduced by up to 20% while productivity can be raised by 50%. Machine utilization even increases by more than 40% [2]. The increasing complexity of series production represents a challenge for process monitoring. This also includes the use of new design strategies, e.g., by combining different materials in hybrid workpieces. These workpieces with locally adapted properties offer a promising approach for designing components with energy-efficient applications while reducing the use of high-alloy materials. This is the main focus of the Collaborative Research Center (CRC) 1153, where material combinations are joined and formed with different processes and then machined [3,4]. Due to different material properties and chemical compositions, the machining properties and chip formation mechanisms change during the cutting process and pose challenges for machining. In particular, the force gradient during material transition can lead to increased tool wear and the various material properties affect the workpiece geometry and surface quality. In addition, the trend to single part production or small batch sizes as well as the high demands on surface quality and manufacturing tolerances pose further challenges. For this reason, modern process monitoring systems must be provided with process information of the highest possible quality.
In this context, more monitoring approaches that combine different signals and features are being researched [5,6,7]. A process parameter that offers a high level of information regarding various production errors is the process force [2,8]. Balsamo et al. showed that a catastrophic tool failure during turning can be monitored by multi-sensor signal processing of force and acoustic emission [9]. Jie et al. successfully developed an approach for tool condition monitoring during the machining of titanium alloys, which is also based on the force and acoustic emission signal [10]. In addition, the development of a cloud-based framework for monitoring manufacturing processes for online process monitoring services takes into account process force information due to its high sensitivity [11]. In general, the machine tool does not provide detailed information about forces. Therefore, various approaches have been studied in the past to extract this information parallel to the machining. A method to obtain information about the process force is to extract the process components from control signals [12,13]. This is associated with a high modelling effort, which has to be carried out for each machine due to manufacturing and assembly tolerances. By using external sensors, process forces can be measured with high sensitivity [14,15]. These sensor systems require high acquisition costs, are limited in their flexibility, and restrict the installation space for workpieces [16]. Further approaches to determine process force information have focused on modelling forces by virtual processing [17]. The simulations reach their limits if tool wear and thermal effects are to be considered in real time. In addition, a high modeling effort is required to take the structural dynamic effects into account. To overcome these challenges, Denkena et al. developed the idea of the "feeling" machine tool. They integrated sensory machine components, which are placed close to the process and are located directly in the force flow. These sensory components are equipped with strain gauges that measure the structural strain caused by the process force. Forces are then reconstructed from the strains. With this approach, the static and dynamic behavior of the machine structure is generally maintained and a flexible force measurement is realized. In milling machines, the spindle slides have been modified to become a sensory machine component. Based on the force sensing properties of the slide, the static tool deflection was determined during the process. The workpiece quality was improved by online adaptation of the tool position using an axis offset [18]. The monitoring of geometrical errors of the workpiece was investigated by a feeling clamping system for a milling process. Therefore, holes were drilled into the workpiece to represent a material defect for a subsequent flank milling operation. A dynamometer was used as a reference. The errors could be detected by both measuring systems based on confidence limits. However, due to a lower signal-to-noise ratio, the feeling clamping system had a lower sensitivity to the error [19]. Denkena et al. integrated metallic strain gauges in four carriages of a linear guide of a spindle-driven position axis [20]. The load on the carriages could be measured in two directions orthogonally to the direction of travel. The quality of the recorded measurement signals was suitable for detecting parallelism errors in the linear guide. Based on the achieved force, sensitivity process monitoring could not be performed.
This paper focuses for the first time on the investigation of the suitability of a feeling machine for process monitoring of turning operations. In this context, the process force is measured based on a feeling turret during machining and is compared with the measured forces of a dynamometer. Individual process errors, which affect the process and workpiece quality, are investigated. These include tool breakage, tool wear, and the varying material transition position of hybrid workpieces. Based on the considered process errors and the measuring accuracy of the feeling turret, the sensitivity of the monitoring is discussed for various process parameters.
2. Materials and Methods
2.1. Materials
When researching the system, different investigations were performed with two different materials, which were presented in Table 1. The samples were shafts with a diameter of 30 or 40 mm and a length of 120 mm. Mono-material components were selected to investigate tool breakage and tool wear. When studying the performance of material detection friction-welded specimens, two mono-material shafts were used.

Table 1.
Material properties.
2.2. Machining and Data Acquisition
Experimental tests were carried out on the turning center Gildemeister CTX420 linear (Germany). An industrial personal computer (IPC) was connected to an open platform communication server and fieldbus interface of the Siemens Powerline 840D machine control (München, Germany) as well as to the CAN bus of the feeling turret. For the longitudinal turning, an indexable insert DNMG150404-FP5 by Walter AG (Tübingen, Germany) was used. The machining operations were all carried out without the use of cooling lubricant. The process force was measured by the sensory abilities of the turret, which is equipped with strain gauges (HBM, Darmstadt, Germanycountry). The strain gauges were set up as a Wheatstone-bridge and glued into the notch ground. The notches were designed by finite element simulation to increase the measured strain. A total of six strain gauges were set up as Wheatstone-bridges are placed on the turret. The signals are digitized by electronic devices close to the measuring position and transmitted to the IPC via a CAN-BUS [21]. According to the occurring strains during machining, the forces were calculated. The determined force resolution of the feeling turret is 64 N in the x-direction, 43 N in the y-direction, and 44 N in the z-direction. A dynamometer (Kistler 9129A, Winterthur, Switzerland) was used as a reference for the force measurement. Both systems have a sampling rate of 1000 Hz. The low-pass frequency for the feeling turret is 25 Hz and 30 Hz for the dynamometer. The passive force Fp acts in the x-direction, the cutting force Fc acts in the y-direction, and the feed force Ff acts in the z-direction. The numerical control (NC) provided the axis positions with a frequency of 83 Hz. The measurement setup is shown in Figure 1.
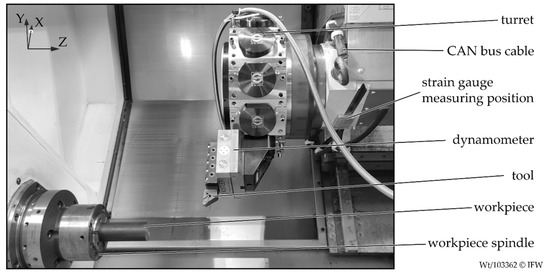
Figure 1.
Presentation of the measurement setup.
Within the evaluation, the process force was also simulated to investigate the process parameter range in smaller steps. The force model was used according to Kienzle [22]. The Kienzle parameters applied for the modelling were determined experimentally on the presented test set-up for the material and tool combinations. These parameters are shown in Table 2.
Table 2.
Summary of Kienzle parameters.
2.3. Simulation of Process Errors
A tool breakage can result in a sudden increase in process force. This can be caused by the broken cutting-edge jamming between the tool and workpiece. Afterward, the process force decreases because the gap between tool and workpiece must first be overcome by the travel movement. Then the remaining part of the tool collides with the workpiece, which increases the process forces again [23]. The described drop in force was simulated in the experiments by a material defect depicted in Figure 2a. The missing material results in an identical force characteristic as in the case of a tool breakage. The advantage of these simulated errors is the reproducibility and the fact that the machine tool components are not critically stressed. To investigate, if tool wear can be identified with the systems, the resulting force for machining with a new and a worn tool was measured. The worn tool exhibits a cutting-edge failure with a length of 465 µm, which is depicted in Figure 2b.
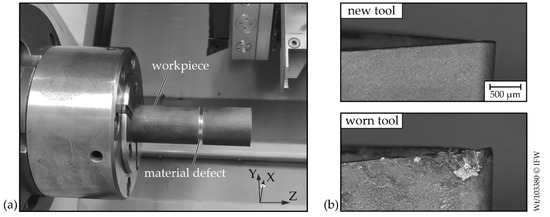
Figure 2.
(a) Prepared workpiece and (b) presentation of the new and worn tool.
2.4. Monitoring
The confidence limits for monitoring tool breakage were calculated by performing 10 longitudinal turning operations. The measured cutting forces were used to calculate the upper Lup and lower Llow confidence limits. Thus, the confidence estimator approach according to Brinkhaus was used [24]. The confidence limits were updated after each process based on the expected mean value standard deviation σ, and a safety value Csaftey for each running measurement value i. The safety value influences the distance between and the confidence limits. A safety value of Csaftey = 6 was used, which is usually the default setting of a monitoring system.
In order to take account of temporal fluctuations, the confidence limit was calculated for a function h(i). This function determines an envelope for the expected value x(i), which allows a time lag for a specified time K. During the investigations, K was set to 100 ms. Based on this value, no false alarms occurred after four processes in the teach-in phase.
According to the combination of Equations (1) and (2), the shift of time and amplitude was taken into account when calculating the confidence limits. The values of h and σ were calculated by a moving average to allow dynamic weighting of the different measurements.
For detecting the currently machined material, the material-specific cutting force MatFc was monitored [25]. In this approach, the cutting force Fc was normalized by the material removal rate Qw. The material removal rate was calculated online using a dexel-based cutting simulation. Input parameters for the simulation were the axis positions from the machine control. A material compound was subsequently monitored on the basis of a defined boundary surface.
3. Results and Discussion
3.1. Tool Breakage
In cutting operations, process errors typically lead to an increase or decrease of the process force. For this reason, the process force is well suited for a sensitive and robust monitoring in machining. To determine the sensitivity of force measuring systems, material defects can be applied to the workpiece. Similar to tool breakage, missing material lead to a drop in the process force. This characteristic was used in order to compare the cutting force Fc,SG, which was determined by the feeling turret, and the cutting force Fc,dyn, which was measured with the dynamometer. A longitudinal turning process was carried out with a new tool for a cutting speed of 300 m/min and a feed rate of 0.1 mm. During machining, the depth of cut was reduced stepwise from 1 to 0.1 mm. This process was repeated 10 times. Afterward, a shaft was machined, which was prepared with a groove that had a width of 3 mm. The missing material causes a decrease in cutting force at each depth of cut, depicted in Figure 3.
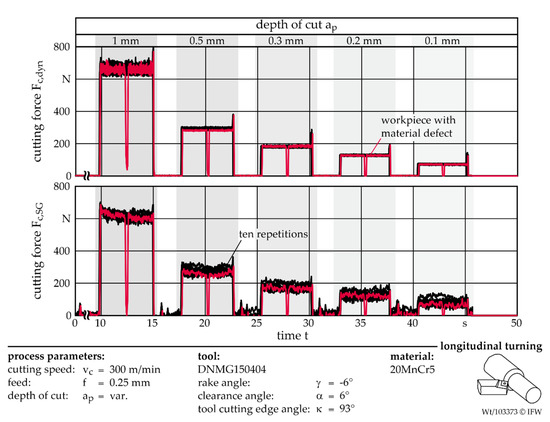
Figure 3.
Longitudinal turning with and without a material defect for different depths of the cut.
The comparison of the two force measurement systems showed that they have an identical time behavior with regard to the signal change. The amplitude of the decreasing cutting force is also identical for both systems. Therefore, it can be concluded that both systems are highly sensitive to a change in cutting force due to tool breakage. However, by comparing the signals of the 10 good processes, it becomes clear that the cutting force Fc,SG has a lower signal-to-noise ratio (SNR).
The SNR was determined for each depth of cut ap by the mean value of the amplitude µ and the standard deviation σ of the signal. The results of the SNR for both measuring systems are summarized in Table 3.
Table 3.
Signal-to-noise ratio for the measured cutting force by using the dynamometer and feeling turret.
The SNR was determined for each depth of cut ap by the mean value of the amplitude µ and the standard deviation σ of the signal. At an ap of 0.5 mm, Fc,dyn exhibits an SNR of 149. With a decreasing ap, the SNR also decreases further. For ap = 0.1 mm, the SNR is still 70. The measured cutting force by the dynamometer has the lowest SNR for ap = 1 mm with 46. The deviation to the other depths of cut is caused by different chip formation, which led to a higher vibration of the system. For ap = 1 mm, the Fc,SG shows a similar SNR with 40. However, with each reduction of ap, the signal-to-noise ratio decreases for the signal Fc,SG. For the depth of cut of ap = 0.1 mm, the SNR is 7 and, thus, lower by a factor of 10 compared to Fc,dyn. The repeatability of the individual measurements also shows a different quality for both signals. The evaluation of the 10 good processes demonstrates that the cutting force Fc,SG has larger variations between the measurements than Fc,dyn. With a depth cut of ap = 1 mm, the standard deviation σi for the mean amplitudes of the different workpieces is for both systems being almost identical with approximately 15 N. By changing the process parameters to a lower ap, the standard deviation decreases for Fc,dyn to σi = 1.7 N while σi of Fc,SG is around 10 N.
If confidence limits are used to monitor the signal, the higher signal-to-noise ratio and variation of the mean amplitude leads to a widening of the statistical limits and, thus, to a decreasing monitoring sensitivity. In order to compare Fc,SG and Fc,dyn with regard to their qualification for confidence limit based monitoring, the feature of the normed bandgap (NB) was determined [26]. The normed bandgap indicates the range in which the normalized signal has to be changed to trigger an alarm. For this purpose, the confidence limit was calculated based on the distribution of the signal around its long-term average. After eight processes, the limits had become close to the process. A further approximation was only possible in very small steps due to the high standard deviation of the measured signal. It can be assumed that 10 measurements are sufficient to generate the confidence limit and calculate the NB.
To evaluate the monitoring quality, the gap between the mean value and the upper confidence limit Lup was evaluated. The distance k between and Lup was normalized to the average. Figure 4 shows the confidence limits after 10 processes for the cutting forces Fc,dyn and Fc,SG and the comparison of the normed bandgap (NB) for both measuring systems.
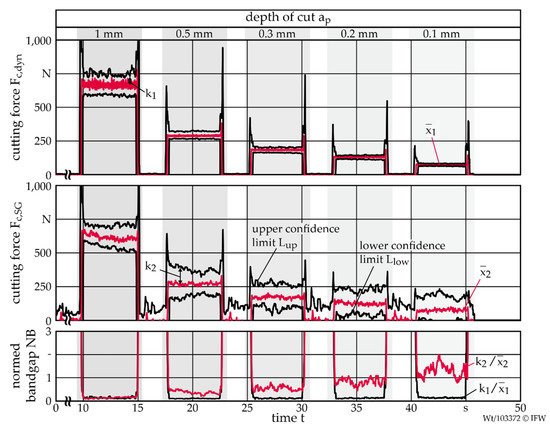
Figure 4.
Confidence limits and normed bandgaps for Fc,dyn and Fc,SG during a longitudinal turning process with different depths of cut.
The sensitivity of the confidence limit, which is calculated based on the cutting force of the feeling turret, declines with decreasing force. This is reflected by the increasing normed bandgap. For an ap of 1 mm, both signal sources achieve a similar monitoring performance. At a normed bandgap of 0.3, a process error must result in a signal change of 30% to trigger the alarm. The ratio remains between NB = 0.1–0.2 for all examined depths of cut if the cutting force is measured with the dynamometer (Kistler, Winterthur, Switzerland). If the feeling turret is used, the normed bandgap for ap = 0.3 mm shows a maximum of NB = 0.8. The NB increases to 2 with a reduction of ap to 0.1 mm. Thus, the sensitivity of the dynamometer is higher by a factor of 10 compared to the feeling turret. The fact that the feeling turret has a significantly lower sensitivity at low process forces is based on the lower measurement resolution of the system relative to the dynamometer. This is primarily due to a higher signal-to-noise ratio, which has an increasing impact on the stochastic distribution of the signal for lower cutting forces. A generalized statement about the required NB of a signal cannot be made since each error is represented differently in the signal. However, based on the investigations, it is considered when no finishing operations can be monitored by the feeling turret. For roughing operations, on the other hand, a similar monitoring quality as with the dynamometer can be achieved.
3.2. Tool Wear
Tool wear generally leads to a change in process force. With increasing flank wear, friction increases, which, in turn, leads to an increasing cutting force and cutting temperatures. If the wear is mainly caused by crater wear, the change in rake angle can lead to a decrease in cutting force. Consequently, the change in cutting force is also an indicator for monitoring the type of wear that will influence the process and the workpiece quality. Tool wear is usually monitored by a static limit. Therefore, the average measured cutting force with a new tool is determined for a predefined tool path. Based on empirical values, a maximum tolerable change in force is defined as the limit for the tolerable wear. If the limit is exceeded, the monitoring system initiates a tool change before an intolerable influence on the workpiece quality occurs. In contrast to the confidence limits, the influence of the signal-to-noise ratio on the monitoring quality is significantly lower since the average value is evaluated over a defined range of the monitored signal. For a sensitive and robust monitoring of tool wear, the repeat accuracy is mostly important. In addition to the 10 good processes with a new tool, three measurements were carried out with a tool, which has a high chipping length of 465 µm. During the machining, identical process parameters of ap, f, and vc were used as for the previous longitudinal turning operations, depicted in Figure 5.
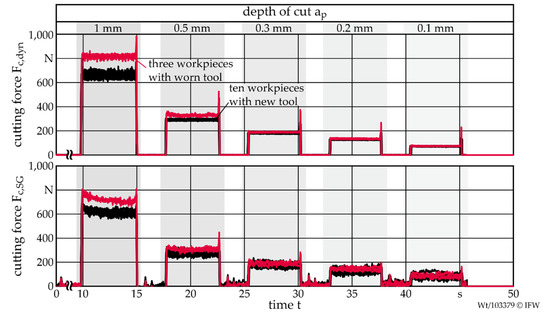
Figure 5.
Cutting force characteristics for new and worn tool for different depths of cut.
Tool wear results in an increasing cutting force, which varies according to the depth of cut. At a depth of cut of ap = 1 mm, an increase of 24% occurs with 158.5 N for Fc,dyn. With a reduction to ap = 0.5 mm, the wear lead to an average increase in the cutting force of 38.6 N, which represents a percentage change of 13%. The triple standard deviation of the measurements with the new tool is 3σ = 9 N for Fc,dyn. Assuming tool wear can be detected, if this value is lower than the resulting change in cutting force, monitoring can be performed for both ap. The increase of Fc,dyn at an ap of 0.3 mm is, therefore, with 7.5 N too small to detect the current tool wear for the defined process parameters. For the feeling turret, a 3σ for Fc,SG of 53 N is determined at a depth cut of 1 mm. Thus, the tool wear can be robustly identified for ap = 1 mm. For the remaining process parameters, the variation of the average cutting force is too low to realize tool wear monitoring.
As shown by the different depths of cut, no general statement can be made about the effect of tool wear on the percentage change in cutting force. Therefore, it is not possible to make a universal prediction of the ability to monitor tool wear. The influence of the wear mechanisms on the cutting force vary significantly based on the selected process parameters. For this reason, it is more relevant to compare what change in cutting force caused by tool wear can be theoretically identified with different signals. For this purpose, the cutting force was modelled according to Kienzle for a new tool and three wear-related force increases. The variation of the cutting speed has a smaller influence on the force compared to the feed and depth of cut. For this reason, the cutting speed was fixed for the research at vc = 300 m/min. Based on the modelled cutting forces, an increase in force was determined for a combination of process parameters. It is assumed that the change can be monitored if the difference is higher than the triple standard deviation 3σ of the cutting force measurement. Based on the previous investigation, 3σ was set to Fc,dyn,3σ = 9 N and Fc,SG,3σ = 53 N. For both measuring systems, it process parameters were researched at which a force difference of 10%, 20%, and 30% results can be detected by the individual system, which was depicted in Figure 6. This investigation was carried out for a steel (20 MnCr5) and an aluminum (EN AW-6082).
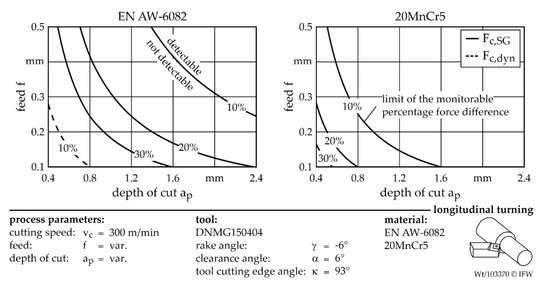
Figure 6.
Representation of the monitorable percentage increase of the cutting force for EN AW-6082 and 20MnCr5 based on the feeling turret and dynamometer.
With the dynamometer, almost the total process parameter range considered for both materials can be monitored with regard to the three selected percentile cutting force changes. Only for aluminum, the theoretical detection is not possible for low depths of cut and low feeds. In this case, the cutting force difference caused by a wear-related force increase of 10% is too low. The evaluation of the cutting force measured by the feeling turret shows the potential for monitoring tool wear for a wide range of process parameters. Especially for steel, a large range is covered. For aluminum, higher ap and f are required due to the different material properties. For the highest expected change of 30%, this includes process parameters of ap = 0.5 mm and f = 0.17 mm. In the case of aluminum, large parts of the considered process parameter range can theoretically not be monitored, especially if the cutting force changes by only 10% due to tool wear. In general, higher ap and f are used for machining aluminum than for steel. Then tool wear can also be monitored for aluminum during roughing operations.
3.3. Material Detection
The online detection of the machined material is needed to realize a material-specific machining of hybrid components. For this reason, the sensitivity of monitoring a material compound based on the material-specific cutting force was investigated. A longitudinal turning process of EN AW-6082 and 20MnCr5 was performed and the signals of the dynamometer and the feeling turret were compared by the statistical overlap factor (SOF). The SOF determines the degree of separation of the material-specific cutting force between the first and second material. If a signal shows a high degree of separation due to different material properties, the SOF increases. In addition to the resulting standard deviation when measuring the cutting force, the influence of the variance of the simulated material removal rate Qw was considered. The determined triple standard deviation for the simulation of Qw is 3–4%. With Qw,min, the value at the lower end of the triple standard deviation is taken into account for the first material i. In contrast, Qw,max is assumed for the second material j. This results in the material-specific cutting force being calculated too low for steel and too high for aluminum in order to obtain the highest possible variation. To guarantee robust monitoring, an SOF greater than six is necessary to separate two materials during machining.
With a constant ap of 1 mm, the SOF was calculated for a varying feed rate of f = 0.1–0.4 mm and a cutting speed of vc = 200–400 m/min, which are depicted in Figure 7. The influence of the simulation error of Qw on the calculated SOF can be neglected. For the investigated aluminum-steel compound, the SOF decreases by a maximum of 5% if the highest possible variation of Qw is considered instead of assuming a constant value for Qw. The significant impact is, therefore, the measuring accuracy and the signal-to-noise ratio of the cutting forces.
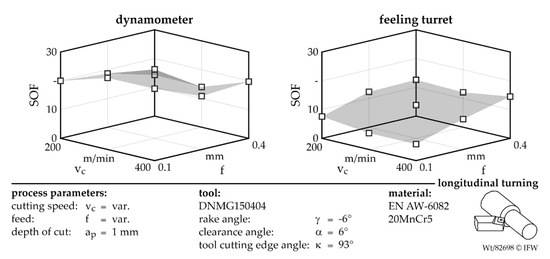
Figure 7.
Material-specific cutting force for varying feed and cutting speed.
For the feeling turret, the sensitivity of the monitoring system improves if the the feed and, thus, the cutting force is increased. This is because the SNR is much more significant in the signal of the structure-integrated strain gauges compared to the signals of the dynamometer. Consequently, the SNR has a larger impact on the measurement of Fc and, subsequently, on the quality of the material identification at lower process forces. For a feed of f = 0.1 mm, the average measured SOF is 6.0, while, at f = 0.4 mm, the average SOF increases to 12.6. With the dynamometer, this effect does not appear due to the lower SNR. However, the SOF also varies for the material-specific cutting force measured by the dynamometer over the examined process parameter range. This is caused by the higher sensitivity to varying chip formation. Different chip forms results in changing peak2peak values of the signal and, consequently, in different standard deviations of the force signal. This effect is less significant for strain gauges due to the higher damping of the turret structure. In general, a higher SOF value and, thus, better sensitivity is achieved by using the dynamometer for all considered process parameters. The maximum statistical overlap factor is 23.9 while the minimum SOF is 13.5. Both measuring systems are, therefore, qualified to robustly monitor the material during the machining of the aluminium-steel compound for the examined process parameter range.
4. Conclusions
This paper presents the investigation of the application of a feeling machine for process monitoring. In order to replace the dynamometer, a feeling turret was used, which determines process forces based on the structure’s integrated strain gauges. The monitoring quality was compared with the performance of a dynamometer regarding the detection of tool breakage, tool wear, and material transitions of hybrid components. Investigations have shown that, especially in roughing operations, which are characterized by higher process forces, the feeling turret has a good monitoring performance. At depths of cut of ap = 1 mm, similar sensitivities were determined for monitoring with confidence limits as with a dynamometer. If steel is machined, tool wear can be detected with the cutting force of the feeling turret for roughing and finishing processes. For aluminum, on the other hand, only monitoring roughing processes can be realized. However, it must be assumed that the tool wear also leads to a significant change in cutting force of 10–30%. Similar to the dynamometer, the feeling turret is suitable for monitoring the materials of aluminium-steel compound (EN AW-6082/20MnCr5). For the examined process parameter range, the statistical overlap factor was higher than six. Consequently, a classification of the materials based on the material-specific cutting force can be achieved. In further steps, it will be investigated how the fusion of signals from the feeling machine and process data from the machine control and external sensors can be used to improve the monitoring quality.
Author Contributions
Conceptualization, M.W. and B.B.; funding acquisition, B.D. and B.B.; investigation, M.W.; methodology, M.W. and B.B.; supervision, B.D.; validation, B.B.; writing—original draft, M.W.; writing—review & editing, B.D. and B.B. All authors have read and agreed to the published version of the manuscript.
Funding
The results presented in this paper were obtained within the Collaborative Research Centre 1153 “Process chain to produce hybrid high performance components by Tailored Forming” in the subproject B5 (252662854). The authors would like to thank the German Research Foundation (DFG) for its financial and organisational support of this project.
Conflicts of Interest
The authors declare no conflict of interest.
References
- Tönshoff, H.K.; Wulfsberg, J.P.; Jals, H.J.J.; König, W.; Van Luttervelt, C.A. Developments and Trends in Monitoring and Control of Machining Processes. CIRP Ann. 1988, 37, 611–622. [Google Scholar] [CrossRef]
- Rehorn, A.G.; Jiang, J.; Orban, P.E. State-of-the-art methods and results in tool condition monitoring: A review. Int. J. Adv. Manuf. Technol. 2005, 26, 693–710. [Google Scholar] [CrossRef]
- Behrens, B.A.; Chugreev, A.; Selinski, M.; Matthias, T. Joining zone shape optimisation for hybrid components made of aluminium-steel by geometrically adapted joining surfaces in the friction welding process. In AIP Conference Proceedings, Proceedings of the 18th International Conference on Positron Annihilation, Vitoria-Gasteiz, Spain, 8–10 May 2019; AIP Publishing: Melville, NY, USA, 2019. [Google Scholar] [CrossRef]
- Behrens, B.A.; Chugreeva, A.; Mildebrath, M.; Diefenbach, J.; Barroi, A.; Lammers, M.; Hermsdorf, J.; Hassel, T.; Overmeyer, L. Manufacturing of High-Performance Bi-Metal Bevel Gears by Combined Deposition Welding and Forging. Metals 2018, 8, 898. [Google Scholar] [CrossRef]
- Abellan-Nebot, J.V.; Subirón, F.R. A review of machining monitoring systems based on artificial intelligence process models. Int. J. Adv. Manuf. 2010, 47, 237–257. [Google Scholar] [CrossRef]
- Teti, R. Advanced IT Methods of Signal Processing and Decision Making for Zero Defect Manufacturing in Machining. Procedia CIRP 2015, 28, 3–15. [Google Scholar] [CrossRef]
- Siddhpura, A.; Paurobally, R. A review of flank wear prediction methods for tool condition monitoring in a turning process. Int. J. Adv. Manuf. 2013, 65, 371–393. [Google Scholar] [CrossRef]
- Lauro, C.H.; Brandão, L.C.; Baldo, D.; Reis, R.A.; Davim, J.P. Monitoring and processing signal applied in machining processes—A review. Measurement 2014, 58, 73–86. [Google Scholar] [CrossRef]
- Balsamo, V.; Caggiano, A.; Jemielniak, K.; Kossakowska, J.; Nejman, M.; Teti, R. Multi Sensor Signal Processing for Catastrophic Tool Failure Detection in Turning. Procedia CIRP 2016, 41, 939–944. [Google Scholar] [CrossRef]
- Sun, J.; San, W.Y.; Soon, H.G.; Rahman, M.; Zhigang, W. Identification of Feature Set for Effective Tool Condition Monitoring-A Case Study in Titanium Machining. In Proceedings of the IEEE Conference on Automation Science and Engineering, Arlington, VA, USA, 23–26 August 2008; IEEE Xplore: Washington, DC, USA; pp. 273–278. [Google Scholar] [CrossRef]
- Caggiano, A. Cloud-based manufacturing process monitoring for smart diagnosis services. Int. J. Comput. Integr. Manuf. 2018, 31, 612–623. [Google Scholar] [CrossRef]
- Altintas, Y. Prediction of cutting forces and tool breakage in milling from feed drive current measurement. J. Manuf. Sci. Eng. 1992, 114, 386–392. [Google Scholar] [CrossRef]
- Aslan, D.; Altintas, Y. Prediction of cutting forces in five-axis milling using feed drive current measurements. IEEE/ASME Trans. Mechatron. 2018, 23, 833–844. [Google Scholar] [CrossRef]
- Möhring, H.C.; Nguyen, Q.P.; Kuhlmann, A.; Lerez, C.; Nguyen, L.T.; Misch, S. Intelligent tools for predictive process control. Procedia CIRP 2016, 57, 539–544. [Google Scholar] [CrossRef]
- Brecher, C.; Eckel, H.M.; Motschke, T.; Fey, M.; Epple, A. Estimation of the virtual workpiece quality by the use of a spindle-integrated process force measurement. Ann. CIRP 2019, 68, 381–384. [Google Scholar] [CrossRef]
- Teti, R.; Jemielniak, K.; Odonnell, G.; Dornfeld, D. Advanced Monitoring of Machining Operations. Ann. CIRP 2010, 59, 717–739. [Google Scholar] [CrossRef]
- Altintas, Y.; Kersting, P.; Biermann, D.; Budak, E.; Denkena, B.; Lazoglu, I. Virtual process systems for part machining operations. Ann. CIRP 2014, 63, 585–605. [Google Scholar] [CrossRef]
- Denkena, B.; Boujnah, H. Feeling machines for online detection and compensation of tool deflection in milling. Ann. CIRP 2018, 67, 423–426. [Google Scholar] [CrossRef]
- Denkena, B.; Dahlmann, D.; Kiesner, J. Production Monitoring Based on Sensing Clamping Elements. Procedia Technol. 2016, 26, 235–244. [Google Scholar] [CrossRef]
- Denkena, B.; Park, J.K.; Bergmann, B.; Schreiber, P. Force sensing linear rolling guides. In Proceedings of the Euspen’s 18th International Conference & Exhibition, Venice, Italy, 4–8 June 2018. [Google Scholar]
- Bergmann, B.; Witt, M. Feeling machine for material-specific machining. Ann. CIRP 2020, 69. [Google Scholar] [CrossRef]
- Kienzle, O. Die Bestimmung von Kräften und Leistungen an spanenden Werkzeugmaschinen. Zeitschrift des Vereines Deutscher Ingenieure 1952, 94, 299–305. [Google Scholar]
- Tlusty, J.; Andrews, G.C. A Critical Review of Sensors for Unmanned Machining. Ann. CIRP 1983, 32, 563–572. [Google Scholar] [CrossRef]
- Brinkhaus, J.W. Statistische Verfahren zur selbstlernenden Überwachung spanender Bearbeitungen in Werkzeugmaschinen: (Statistical Methods for Self-Teaching Monitoring of Machining Operations in Machine Tools). Ph.D. Thesis, Leibniz University, Hannover, Germany, 18 December 2008. [Google Scholar]
- Denkena, B.; Bergmann, B.; Witt, M. Automatic process parameter adaption for a hybrid workpiece during cylindrical operation. Int. J. Adv. Manuf. Technol. 2017, 95, 311–316. [Google Scholar] [CrossRef]
- Denkena, B.; Dahlmann, D.; Damm, J. Self-adjusting process monitoring system in series production. Procedia CIRP 2015, 33, 233–238. [Google Scholar] [CrossRef]


© 2020 by the authors. Licensee MDPI, Basel, Switzerland. This article is an open access article distributed under the terms and conditions of the Creative Commons Attribution (CC BY) license (http://creativecommons.org/licenses/by/4.0/).