Article

Mechanical Performance Evaluation of the Al-Mg-Si-(Cu) Aluminum Alloys after Transient Thermal Shock through an Novel Equivalent Structure Design and Finite Element Modeling

1
State Key Laboratory of Advanced Design and Manufacturing for Vehicle Body, College of Mechanical and Vehicle Engineering, Hunan University, Changsha 410082, China
2
Jianglu Machinery & Electronics Group Co., Ltd., Hunan University, Xiangtan 411100, China
*
Author to whom correspondence should be addressed.
Metals 2020, 10(4), 537; https://doi.org/10.3390/met10040537
Submission received: 17 March 2020 / Revised: 16 April 2020 / Accepted: 17 April 2020 / Published: 21 April 2020

Abstract

:
In this paper, the microstructure evolution and mechanical performance of the Al-Mg-Si-(Cu) aluminum alloy after transient thermal shock were investigated through experimental tests and finite element simulations. A novel equivalent structure was designed as a typical case in which one side of the plate was welded therefore the other side was thermally shocked with different temperature distribution and duration. The temperature gradient which influences most importantly the mechanical properties was simulated and experimentally verified. Through cutting layers and tensile testing, the mechanical response and material constitutive relation were obtained for each layer. Gurson-Tvergaard-Needlemen (GTN) damage parameters of these samples under large strains were then obtained by the Swift law inverse analysis approach. By sorting the whole welded joint into multi-material composed structure and introducing the obtained material constitutive relation and damage parameters, tensile properties were precisely predicted for typical types of weld joint such as butt, corner, and lap joints. The results show that precipitate coarsening, phase transformation from β″ phase to Q′ phase, and dissolving in the temperature range of 243.3–466.3 °C during the thermal shock induced a serious deterioration of the mechanical properties. The highest reduction of the ultimate tensile strength (UTS) and yield strength (YS) would be 38.6% and 57.4% respectively. By comparing the simulated and experimentally obtained force-displacement curves, the error for the above prediction method was evaluated to be less than 8.1%, indicating the proposed method being effective and reliable.

1. Introduction

The Al-Mg-Si-(Cu) aluminum alloys have potential applications in the light weighting vehicle bodies owing to their excellent properties, high strength to weight ratio, good formability, excellent corrosion resistance, etc., [1,2,3]. Precipitation and solid solution strengthening mechanisms contribute to the main strength of these alloys, which are largely determined by the solid solution and aging heat treatment processes. Abundant research work has been carried out regarding to the influences of the heat treatment route on the strengthening of the Al-Mg-Si-(Cu) aluminum alloys [4,5]. The heating during the processing and service processes of these alloys, intended or un-excepted, would also influence their strength. The reason is that the state of the precipitates and solute atoms, including their type, morphology, size, and distribution etc., will change greatly, if the temperature reaches the aging temperature level or even higher. Therefore, their strengthening effects are largely influenced.
During the production and usage of the components made of Al-Mg-Si-(Cu) aluminum alloys, they may meet various short-time heating processes, thermal cutting, mechanical or thermal joining, heat exposure during paint baking etc. Taking the welding as an example, such as fusion welding, laser welding and friction stir welding etc., the base material in different locations of the joint would be suffered to different temperatures and durations. Such transient thermal shock is complex because the thermal courses are rather different. The temperature varies from room temperature to even nearing the melting point at different locations in the joint. Inhomogeneity in the microstructure and properties will be induced. A large amount of studies have been taken out on such variations after welding. Hardness and tensile testing, microscopic techniques are the constantly adopted methods. Subzones in the joints have been defined as weld zone (WZ) at the weld seam, fusion zone (FZ) at the edge of the weld seam, heat-affected zone (HAZ) between the base materials and the weld seam, etc., [6,7,8]. Hardness distributions within the whole joint, microstructure variation in the subzones and strength of the total joint are their representative properties [7]. Hardness deterioration, grain size coarsening and precipitate dissolving in the heat-affected zone are well-known phenomena that happened in the Al-Mg-Si-(Cu) aluminum welded joints. The strength and elongation, strength coefficient of the overall joint are always concerned.
Though a lot of the mechanical features of the welded joint have been well mastered, the results obtained from the traditional methods are still insufficient for engineering applications. Higher requirements have been raised up, when the Al-Mg-Si-(Cu) aluminum components are used for vehicles in the situations where transient thermal shocks would take place, e.g., thermal welding, flow drill screw or heating during paint baking, etc., [9]. In some occasions, more mechanical property details about the short-time heated sub-areas are necessary for evaluating the performance of these components, through computer-assisted analysis (CAE) for example. Requirement includes several aspects: (i) The strength-related data of different subzones, including yield and tensile strength, elongation and strain hardening coefficient, etc.; (ii) the failure behavior of the material or the joint, after suffering to thermal shock with different temperatures and durations; (iii) exact materials constitutive relation. These first-hand data help in the figuring out the failure mode, the safety designing and performance evaluating of the structure. Related reasons are: (i) The gradient of the mechanical properties along the joints and structures are large because the temperature gradient is large when heated by the mechanical work-induced heat or welding heat source; (ii) a clear figuring out of the weak spot is highly necessary for the finite element modeling (FEM) analysis; (iii) an exact materials constitutive relation is highly desired for obtaining a good numerical analysis. Therefore, researches about the effect of such transient thermal shock on the mechanical properties of the Al-Mg-Si-(Cu) aluminum alloys are of strong demand. However, related studies are still few. Difficulties exist, of which the most important one may be that producing tensile specimens representing the exact subzones are always hard because of the small size of the joint or structure.
Based upon the issues, the current study was carried out aiming to make a detailed description about the microstructure and mechanical strength evolution of shortly heated sub-areas in the Al-Mg-Si-(Cu) aluminum alloys after a transient thermal shock. A novel structural sample equivalent to the welded joint was designed, which facilitates in preparing equivalent tensile specimens for different sub-zones in the weld joint. The temperature distribution and duration in subzones of the structure were recorded and simulated. Accordingly, tensile tests were carried out to evaluate the mechanical properties. Using this data and together with the numerical simulation technique, a precise FEM model was built with multi-layer material constitute relation for a traditional weld joint and its accuracy was evaluated. The final mechanical properties of the joint were successfully simulated and predicted. The proposed method was validated experimentally.

2. Materials and Methods

A typical Al-Mg-Si-Cu aluminum alloy AA6061 in the form of extruded plate was used as the base material (BM). The cross section sizes of the plates are 10 × 150 mm2. They were heat-treated to the T6 state by solutionizing at 550 °C for 1 h followed by immediate water quenching and then artificial aging at 180 °C for 4 h. Welding experiments were carried out employing the double pulse melt inner gas (MIG) welding technique on a FAST MIG 450, (Kemppi, Rachti, Finland), welding machine equipped on an automatic manipulator. ER5356 aluminum wire with a diameter of 1.2 mm was used as the filler material. The chemical compositions of the 6061 aluminum alloy and welding wire are shown in Table 1.
A structural sample equivalent to the ordinary welded joint was designed, as depicted in Figure 1. The aim was to obtain temperature gradient distribution along the width direction of the joint structure. The total length of the sample was 300 mm. The aluminum plate was fixed vertically with the width direction upward before welding. The weld seam was then obtained on the side face of the sheet. Welding parameters adopted were 170 A, 22.6 V, and 60 cm/min, respectively. Pure argon with purity of 5N was used as the shielding gas. In order to record the thermal history of the sub-areas, K-type thermal couples were used. They were fixed in holes with a diameter of 1.0 mm and depth of 2.5 mm drilled on the side surface in a line perpendicular to the seam. The thermal history of layers with different distances from the fusion line was real-time monitored during the whole welding process. The distance between the neighboring points was 5 mm. The thermal history of each layer was also calculated by numerical simulation, through the Simufact.welding v6.0 software (Simufact Engineering GmbH, Hamburg, Germany) to simulate the thermal shock processes and verify the upon temperature testing method. A three-dimensional finite element model was built with material parameters the same to those of the experimentally used ones, as shown in Figure 2a. The thermal and mechanical properties are obtained by JMatPro v10.0 software (Sente Software Ltd., Guildford, UK), as shown in Figure 2b. The melting point, solidus temperature, and latent heat are 633 °C, 589 °C, and 3.9 E+11 mm2/s2 respectively. A double ellipsoid heat source formulation has been used in the simulation model.
After welding, a serial of specimens for hardness and tensile testing, microstructure observations were prepared through slow wire-electrode cutting with a 0.02 mm cutting wire. The locations of these specimens in the welded structure are shown in Figure 1. Vickers micro-hardness tests were measured using a HV-1000 hardness tester (Huayin Testing Instrument Co. Ltd., Changsha, China) with 1 kgf load and holding time of 15 s. The location of the first testing sample for hardness and tensile testing was 0.5 mm away from the fusion line. In the hardness testing line, the interval between the neighboring points was 0.5 mm in the first 7 mm, and in the subsequent 17.5 mm, the interval is 1.0 mm. The data points in the hardness curves are generally averages of ten indenters along the thickness direction as shown in Figure 1. The tensile tests were carried out at a stretching rate of 2 mm/min on an INSTRON 3392 tester according to the ASTM E8M-04 standard [10]. The dimensions of the tensile specimen with a gauge length of 30 mm are shown in Figure 1. The fracture surface of the tested sample was examined by FEI Quanta 200 scanning electron microscope (FEI, Hillsboro, OR, USA). All the sample preparing and mechanical tests were performed at room temperature.
Grain microstructure and precipitate morphology of the transient thermal shocked samples after 10 days of natural aging were investigated through electron back-scattering diffraction (EBSD), transmission electron microscopy (TEM), and high resolution TEM (HRTEM). Specimens for EBSD examination were mechanically grinded, polished, and then electrolytically polished in the solution (HClO4:C2H5OH = 1:9) for 3 s at an applied voltage of 25 V and current of 60 mA. They were examined on the ZEISS EVO 18 SEM (ZEISS, Oberkochen, Germany) with an Oxford Instruments EBSD detector, scanning step is 2.5 μm, pattern resolution is 1028 × 768, confidence indices are greater than 85%, and the data were analyzed using the Channel 5 software v2.0. For TEM testing, thin foil specimens were cut from the samples, first grinded mechanically to a thickness of about 100 μm, punched into disks with a diameter of 3 mm, and then thinned via twin-jet electro-polishing with the electrolyte of 30 vol% nitric acid and 70 vol% methanol at −30–−25 °C, 18 V and 80 mA. TEM observations were performed on a Tecnai F20 TEM system (FEI, Hillsboro, OR, USA) operated at 200 kV. Gatan US4000 4k × 4k CCD was used.

3. Results and Discussion

3.1. Temperature Distribution

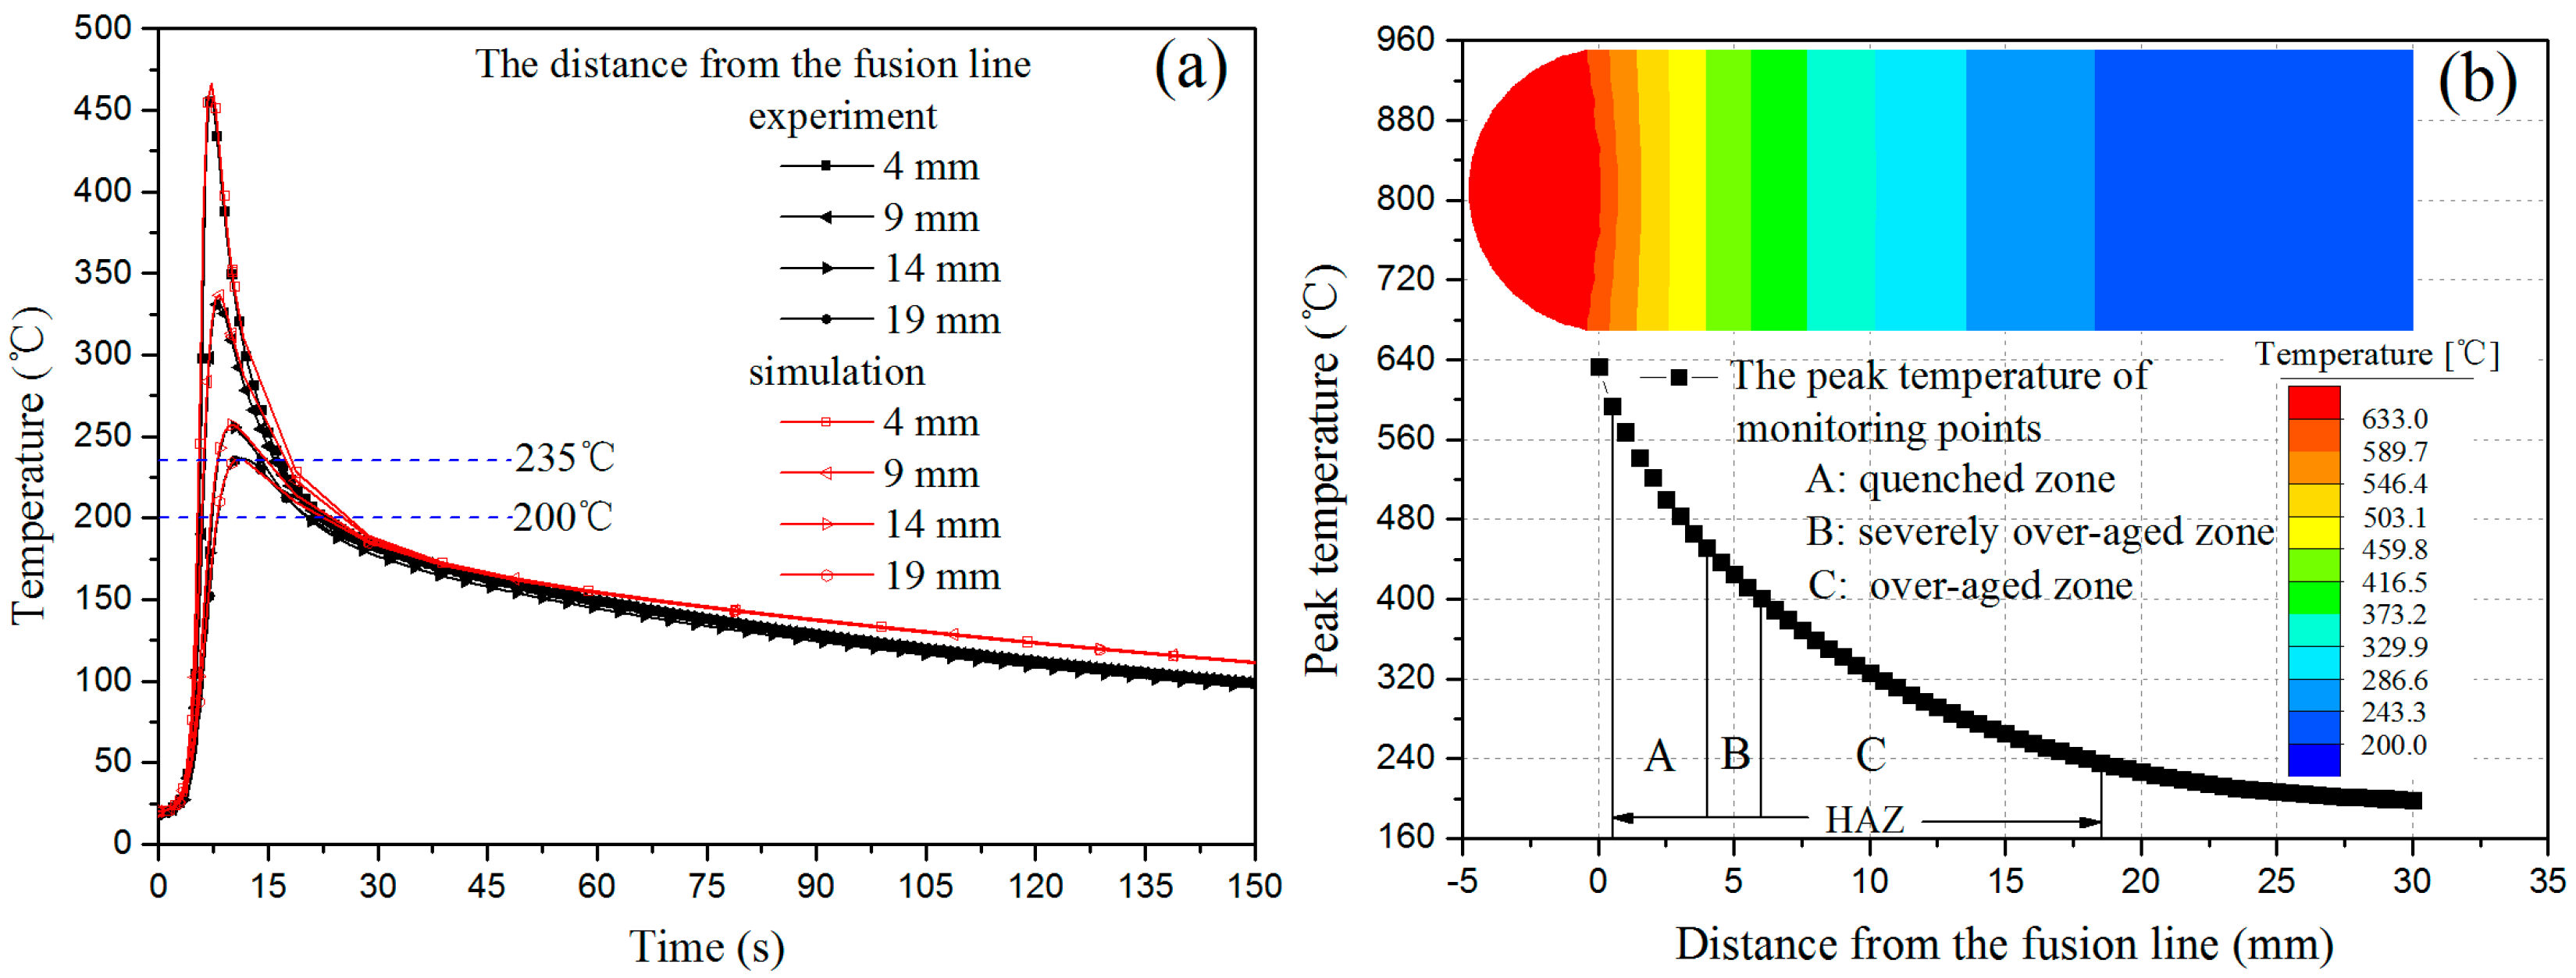
The temperature distribution among the heating area during the transient thermal shock is the key point for determining and predicting the mechanical properties of the raw material. For this aim, the real-time testing during the welding and numerical simulation methods were both employed in our current study to capture the thermal history. Typical results are shown in Figure 3.
Figure 3a shows the thermal history curves measured experimentally as well as those by means of numerical simulation, for different testing points corresponding to the schematic representation shown in Figure 1. The tested and simulated curves overlap very well in the whole heating and cooling processes, indicating an excellent model had been built for the numerical simulation. Every point of the specimen was first rapidly heated to a peak temperature, in less than 10 s, and then cooled down slowly. Figure 3b presents the temperature distribution and highest temperature of every point from the fusion line obtained by numerical simulation. As can be seen, the temperature is distributed in a gradient; the nearer the distance from the fusion line the higher the maximum temperature. As the distance from the fusion line increases, the change rate of the peak temperature decreases. At the fusion line, the highest temperature reached to about 582 °C, which is higher than the solid solution temperature for the AA6061.
As the peak temperature increases, the rate of heating is accelerated markedly. The heating rate is 185.8, 99.8, 57.1, and 45.3 °C/s for the testing points distance from the fusion line 4, 9, 14, and 19 mm respectively. As reported in our previous studies [9], thermal shock to the AA6082 aluminum alloy with temperature higher than 235 °C would induce variations in grain and precipitate structures, which will weaken the mechanical strength in the 6000 series aluminum alloys. Therefore, the area with distance of 0.5–18.5 mm to the fusion line (as depicted in Figure 3b) was defined as the heat-affected zone (HAZ) which is also the defined region for the observation of EBSD.
Another thing that should be mentioned is the dwelling time and cooling rate from peak temperature to 235 °C decreased with the increase in distance from the fusion line, as shown in Table 2. Taken the point with distance of 4 mm as an example, the peak temperature, dwelling time, and cooling rate are 465.8 °C, 11.01 s, and 20.96 °C/s. As reported in literature [11], a fast cooling from 460 °C can be regarded as the quenching process for the 6000 serials aluminum alloys. Therefore, the range with distance 0.5–4.0 mm from the fusion line (extracted from Figure 3b) can be considered to have experienced a short time solid solution (less than 15 s as shown in Figure 3a) and a thereafter quenching process.

3.2. Mechanical Properties

3.2.1. Hardness Variation

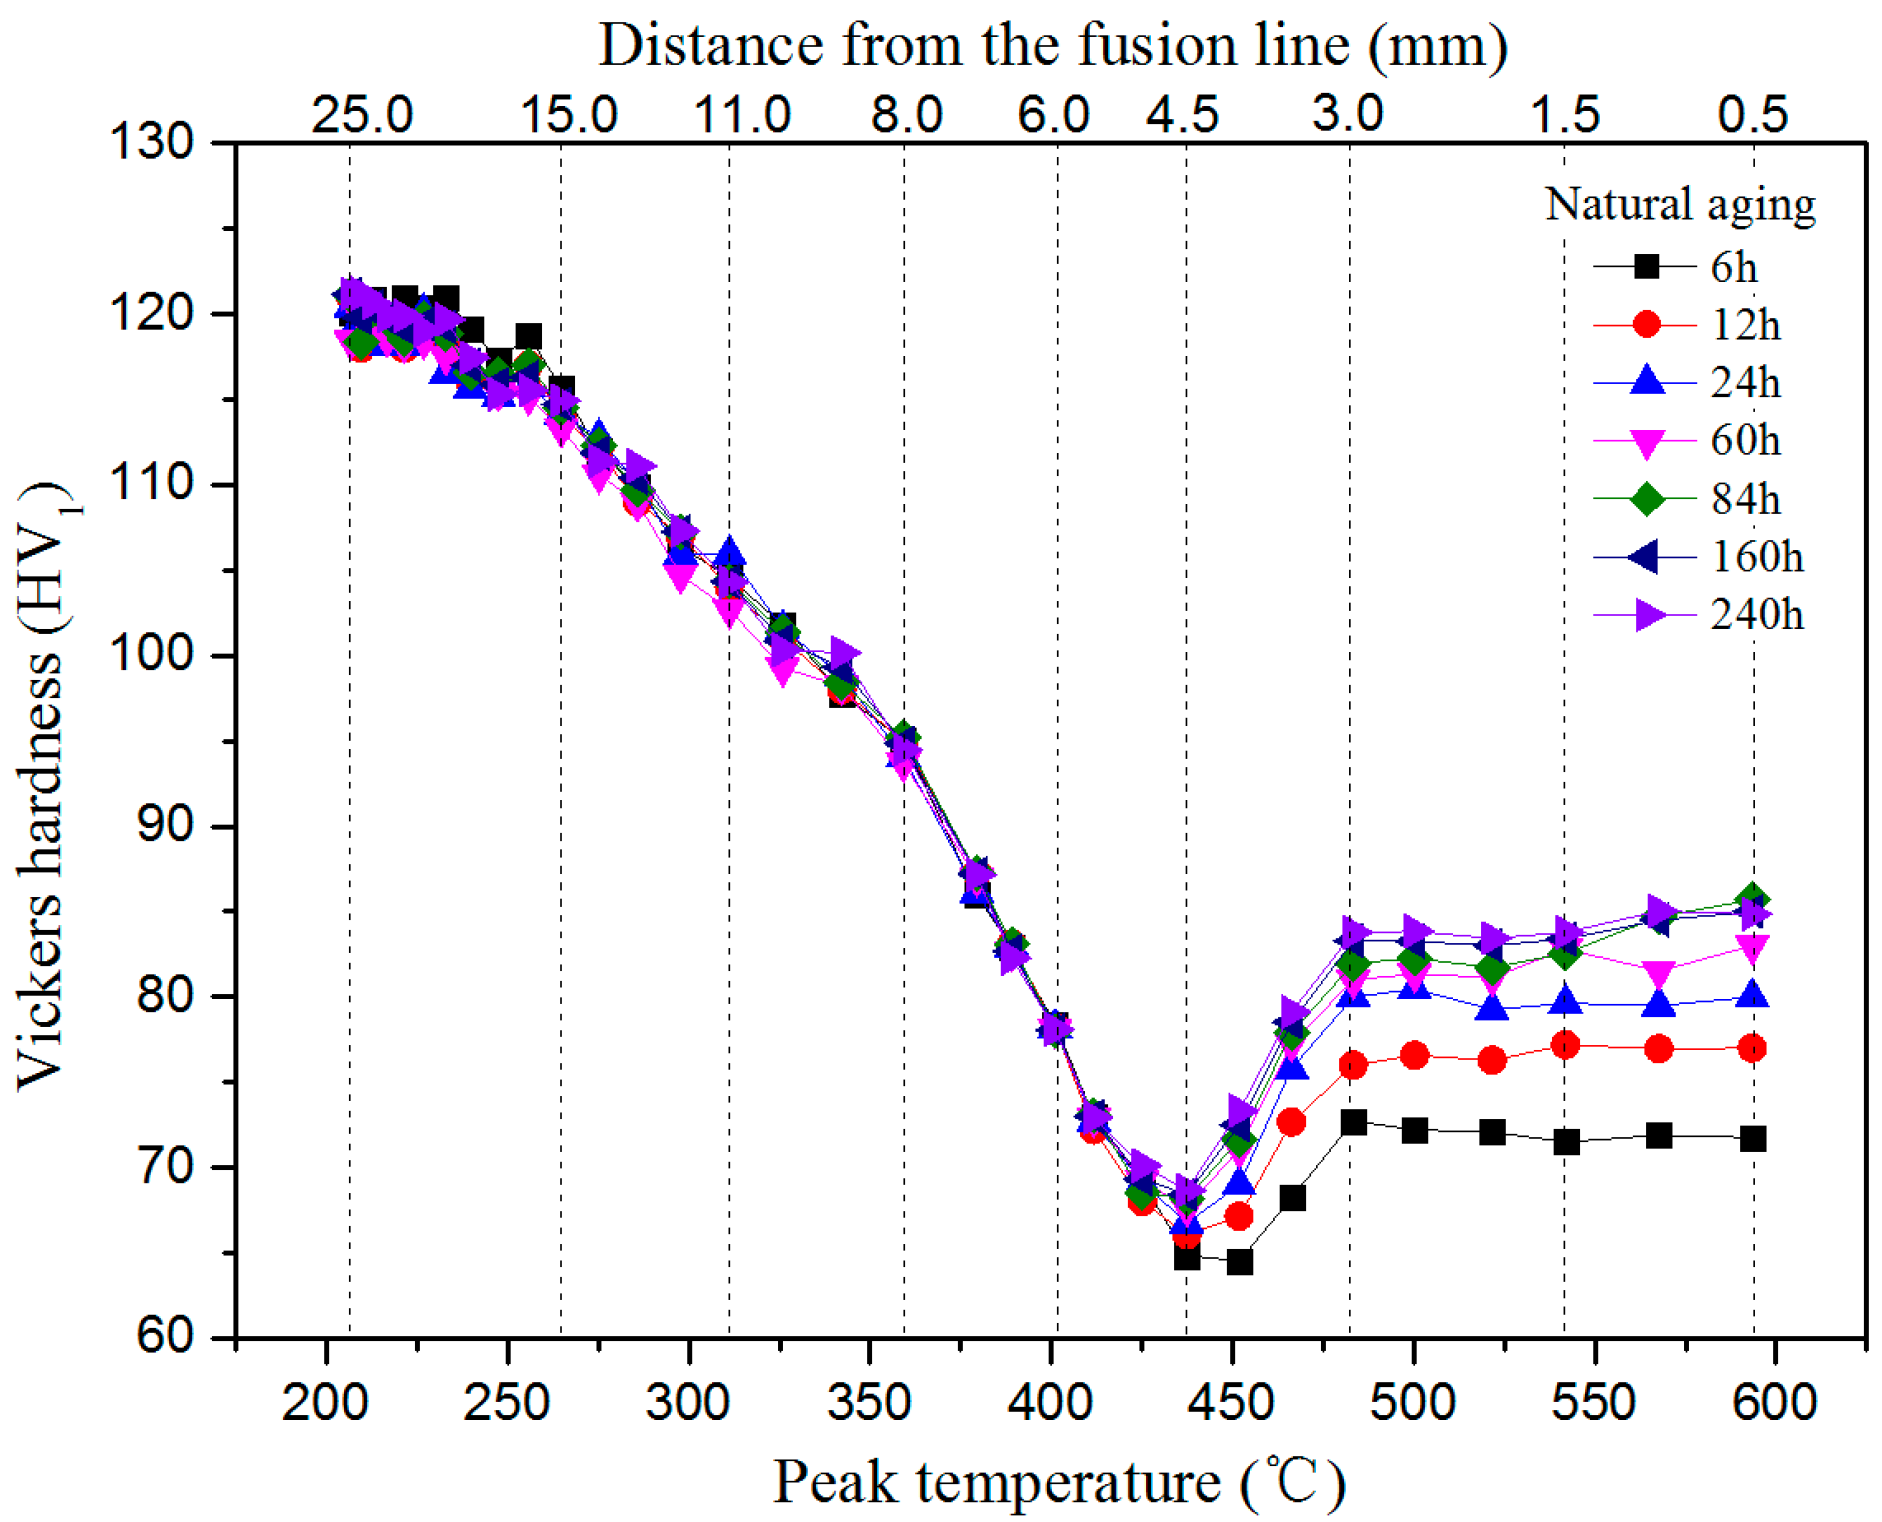
In order to determine the effect of the transient thermal shock by the welding process in 6061-T6 alloy, Vickers hardness measurement was carried out first. Figure 4 shows the Vickers hardness distribution curves along the cross section of the designed structure after the transient thermal shock with different natural aging time. The hardness distribution displays a skew valley shape. With the increase of distance from the fusion line, the hardness forms a plateau first, and then decreases rapidly to a minimum value, finally increases to a steady-state value of about 120 HV1. The lowest hardness is 64.52 HV1 and 68.17 HV1 at natural aging of 6 h and 240 h respectively. The location is 4 mm and 4.5 mm away from the fusion line. An interesting phenomenon observed in Figure 2 is that the hardness values at the platform increases obviously with the prolonging of the natural aging time. However, when the natural aging time reaches 240 h, this increasing trend cannot be observed again, which means that the whole mechanical properties of the structure have reached a stable state. With the increase of distance from 0.5 mm to 4.5 mm, the hardness increment decreases gradually from 13.93 HV1 to 3.33 HV1 by comparing those for the samples after natural aging of 6 h and 240 h.
By comparing the temperature curves during welding and hardness distribution after welding, as shown in Figure 3b and Figure 4, the features for whole structure can be divided into three parts. The highest temperature during the thermal shock for the first part is in the range of 466.3–593.4 °C which shows the right plateau in the mirrored skew valley shape. For the area in the valley, the highest temperature during welding is in the range of 236.2–466.3 °C. For the left part in the mirrored skew valley shape, the temperature during welding is below 236.2 °C and the hardness showed less fluctuation.

3.2.2. Tensile Properties and Fracture Morphology

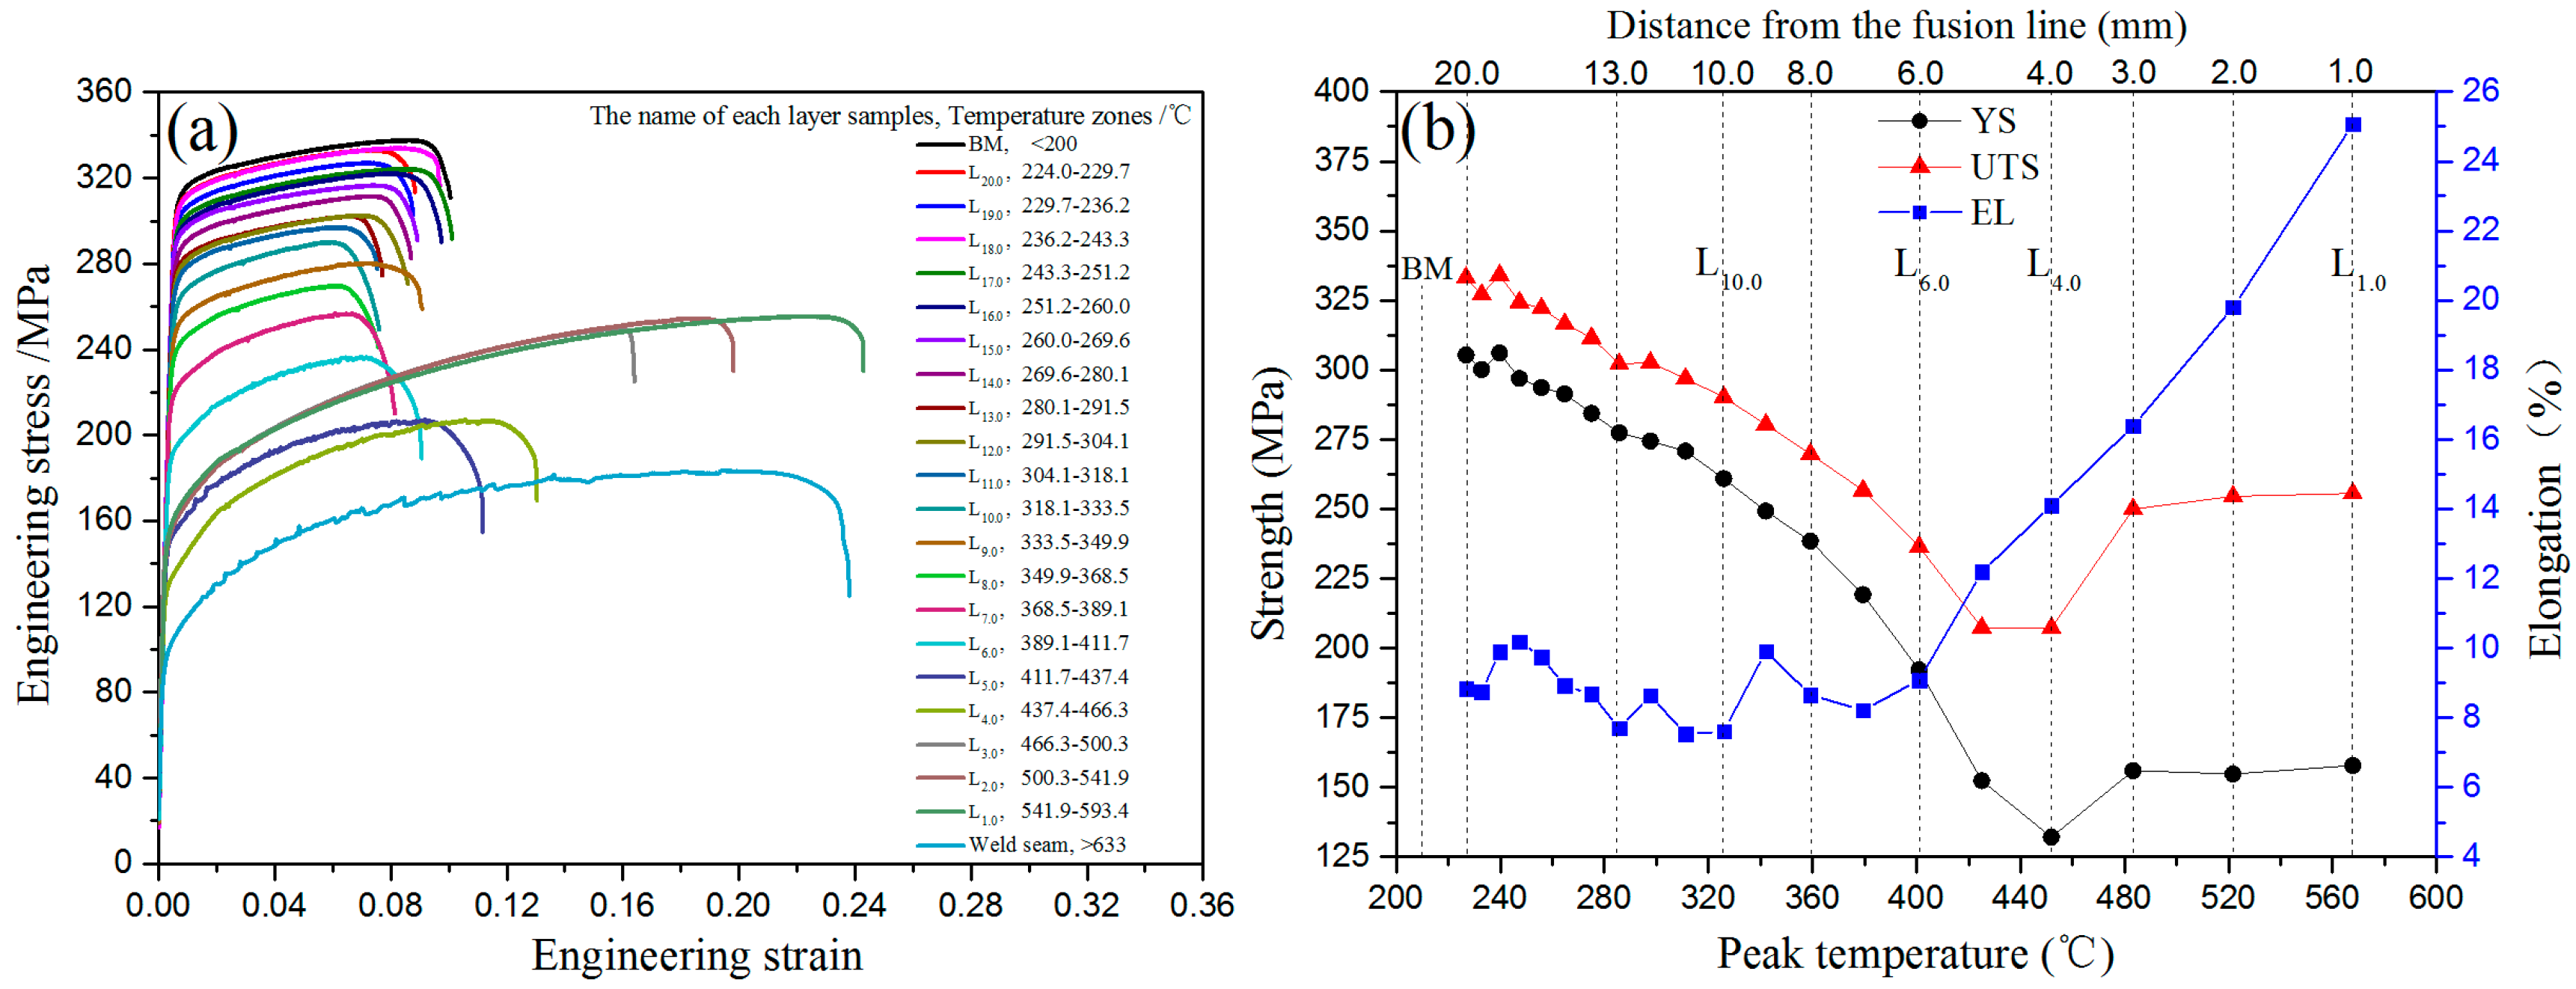
Figure 5a shows engineering stress–strain curves of the samples after natural aging for 240 h obtained in different temperature layers through the method as described in Figure 1. For the convenience of discussion, these samples are named as L1.0–L20.0, and the numerical subscripts represent the distance from the fusion line. The interval between the each neighboring layer is 1.0 mm. From Figure 5b, it can be seen that the transient thermal shock considerably influences the mechanical properties of the samples. The ultimate tensile strength (UTS), yield strength (YS), and elongation (EL) of the samples compared with BM are shown in Figure 5b. The BM showed the highest YS and UTS, 310.43 MPa and 337.77 MPa, respectively. After the thermal shock, the materials showed different kind of strain hardening effect in the stress–strain curves. The variations in the UTS which also show a skew valley shape in the curves are in the same trend with that showed in the hardness test results. When the peak temperature of the thermal shock is below 236.2 °C, the mechanical properties of the samples did not change significantly. As the temperature increases, the UTS and YS of the samples gradually decrease. The L4.0 has the lowest strength in 437.4–466.3 °C, 132.12 MPa (YS) and 207.24 MPa (UTS), respectively. When temperature is in a range of 466.3–593.4 °C, the YS and UTS are at a plateau. The trend of the interpolation between UTS and YS is an open-end style, the maximum value is 99.67 MPa in 500.3–541.9 °C. It can be seen that the EL increased from 9.08% at L6.0 to 25.06% at L1.0 in 411.7–593.4 °C. The variation of the mechanical properties is due to grain coarsening, partial dissolution, over-aging, and the evolution of precipitate phase during the thermal shock process [12]. Coarsening of the grain and precipitates mainly change the fracture model of the material which results in rather different elongation value. Therefore, we further studied this through the fracture morphology of the tensile samples through SEM and the variation of the precipitate variation by TEM.
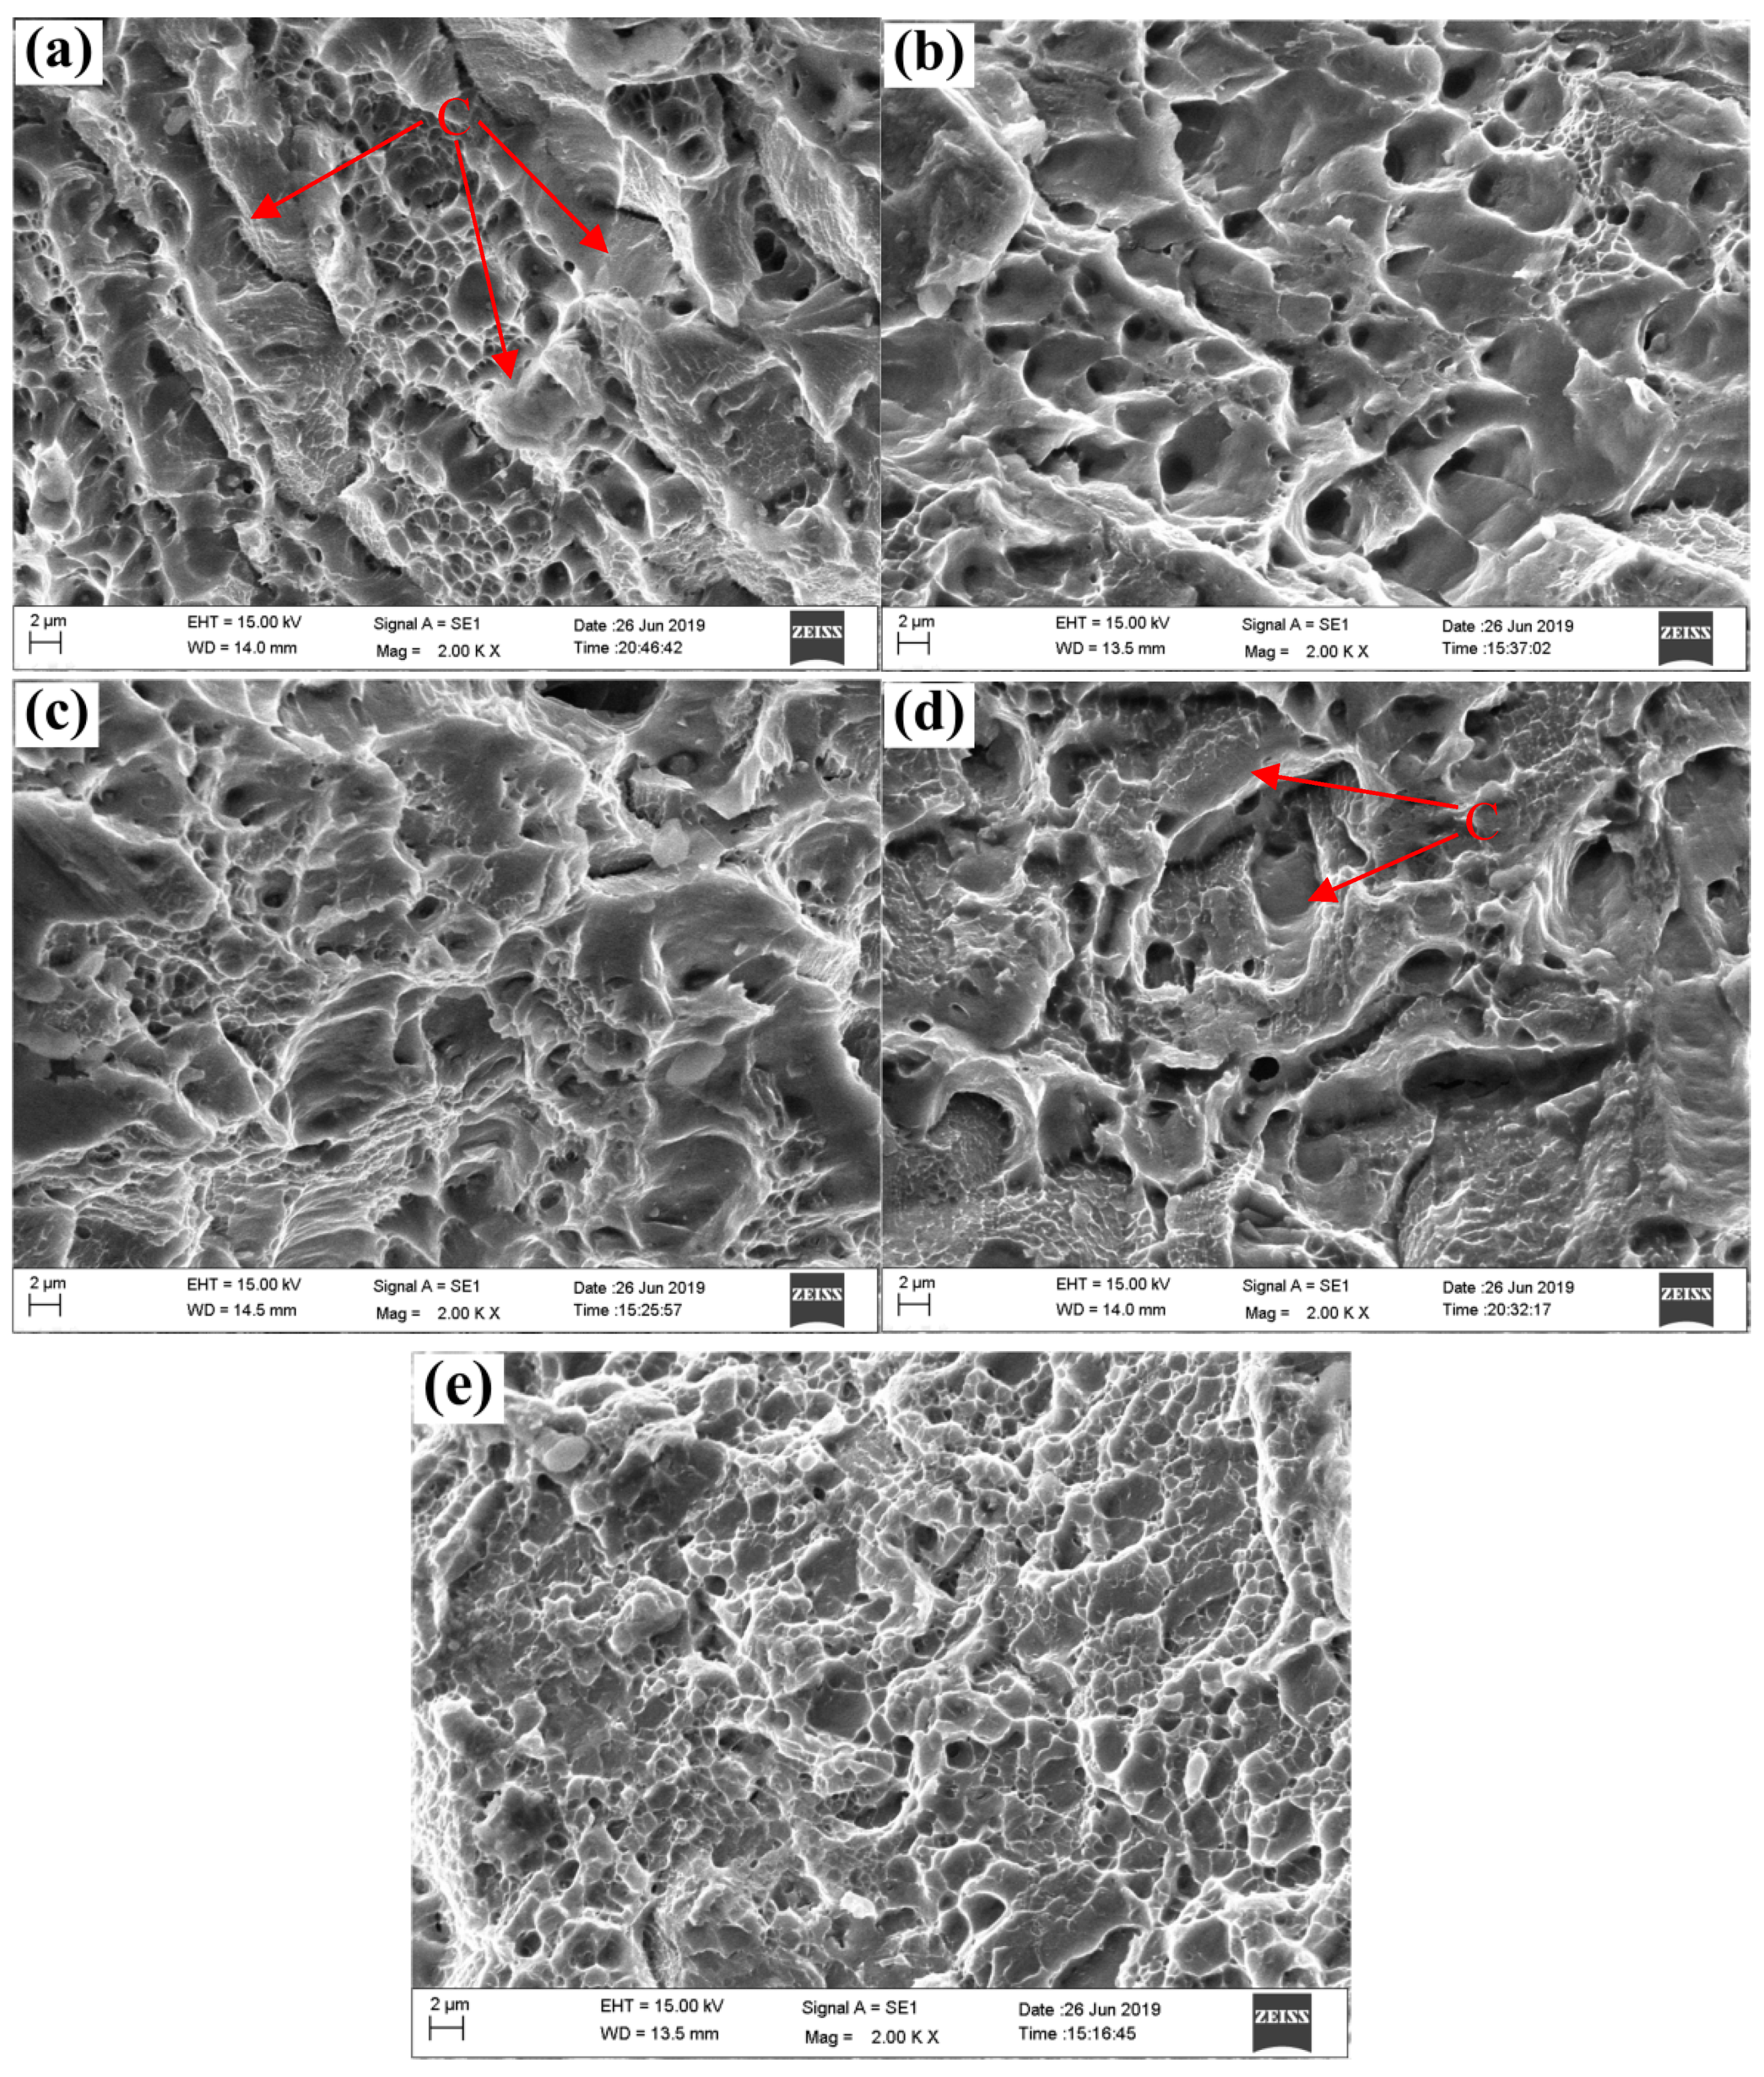
Figure 6 shows the fracture surfaces of five typical tensile testing samples observed through SEM. Cleavage surfaces and fine local dimples can be both found in the BM as shown in Figure 6a. The existence of the cleavage surfaces can cause the shear failure leading to a reduction in EL [13]. Figure 6b illustrates the fracture surface of the L10.0 which had suffered a thermal shock in temperature range of 318.1–333.5 °C. Compared with BM, the L10.0 shows larger dimples (increased from 1.6 μm to 2.5 μm) and smoother cleavage surfaces (as shown by the symbol “C”), indicating that the grain size in this location has increased. This explains the reason for that this sample shows the lowest elongation. When the temperature of thermal shock rises to 411.7–437.4 °C, the cleavage surface becomes to be the main component in the fracture surface, L6.0 for example. As the temperature increases further, cleavage surface, fine dimples, deeper dimples are also appeared in the fracture surface of L4.0 (Figure 6d). Fine dimples with high density are mainly observed in the fracture surface of L1.0 (Figure 6e), which reveals a typical ductile failure mode.

3.3. Microstructures

3.3.1. Grain Structure Evolution

From the hardness and tensile results, it can be seen that the transient thermal shock with different temperature contributes different influence on the mechanical properties. The 6061-T6 aluminum alloy was mainly strengthened through precipitation strengthening, and the grain boundaries also contribute to the strength [14]. The grains in FZ, HAZ, and BM were analyzed by EBSD, and the results are shown in Figure 7. The low-angle grain boundaries (LAGBs) between 2° and 15° are represented by white lines, and the high-angle grain boundaries (HAGBs) with a misorientation angle above 15° are represented by black lines. The FZ which is indicated by the two white dashed lines in Figure 7a has obvious finer grains than the coarse grains of the WZ and HAZ. The columnar grains of the WZ near the FZ are distributed in the direction of the large temperature gradient, owing to the high cooling rate of the WZ during the welding process [8]. The average grain size is 50.44 μm in the HAZ (Figure 7a) and 54.25 μm in the BM (Figure 7b). From these results, it can be inferred that the contribution from the grain boundary in the strengthening may be small. However, from the results of the hardness testing, there is indeed large difference between the HAZ and the BM. Therefore, it gives out clues that such difference is mainly due to the variation of the precipitates. Therefore, it was further checked through TEM observations.

3.3.2. Precipitation Evolution

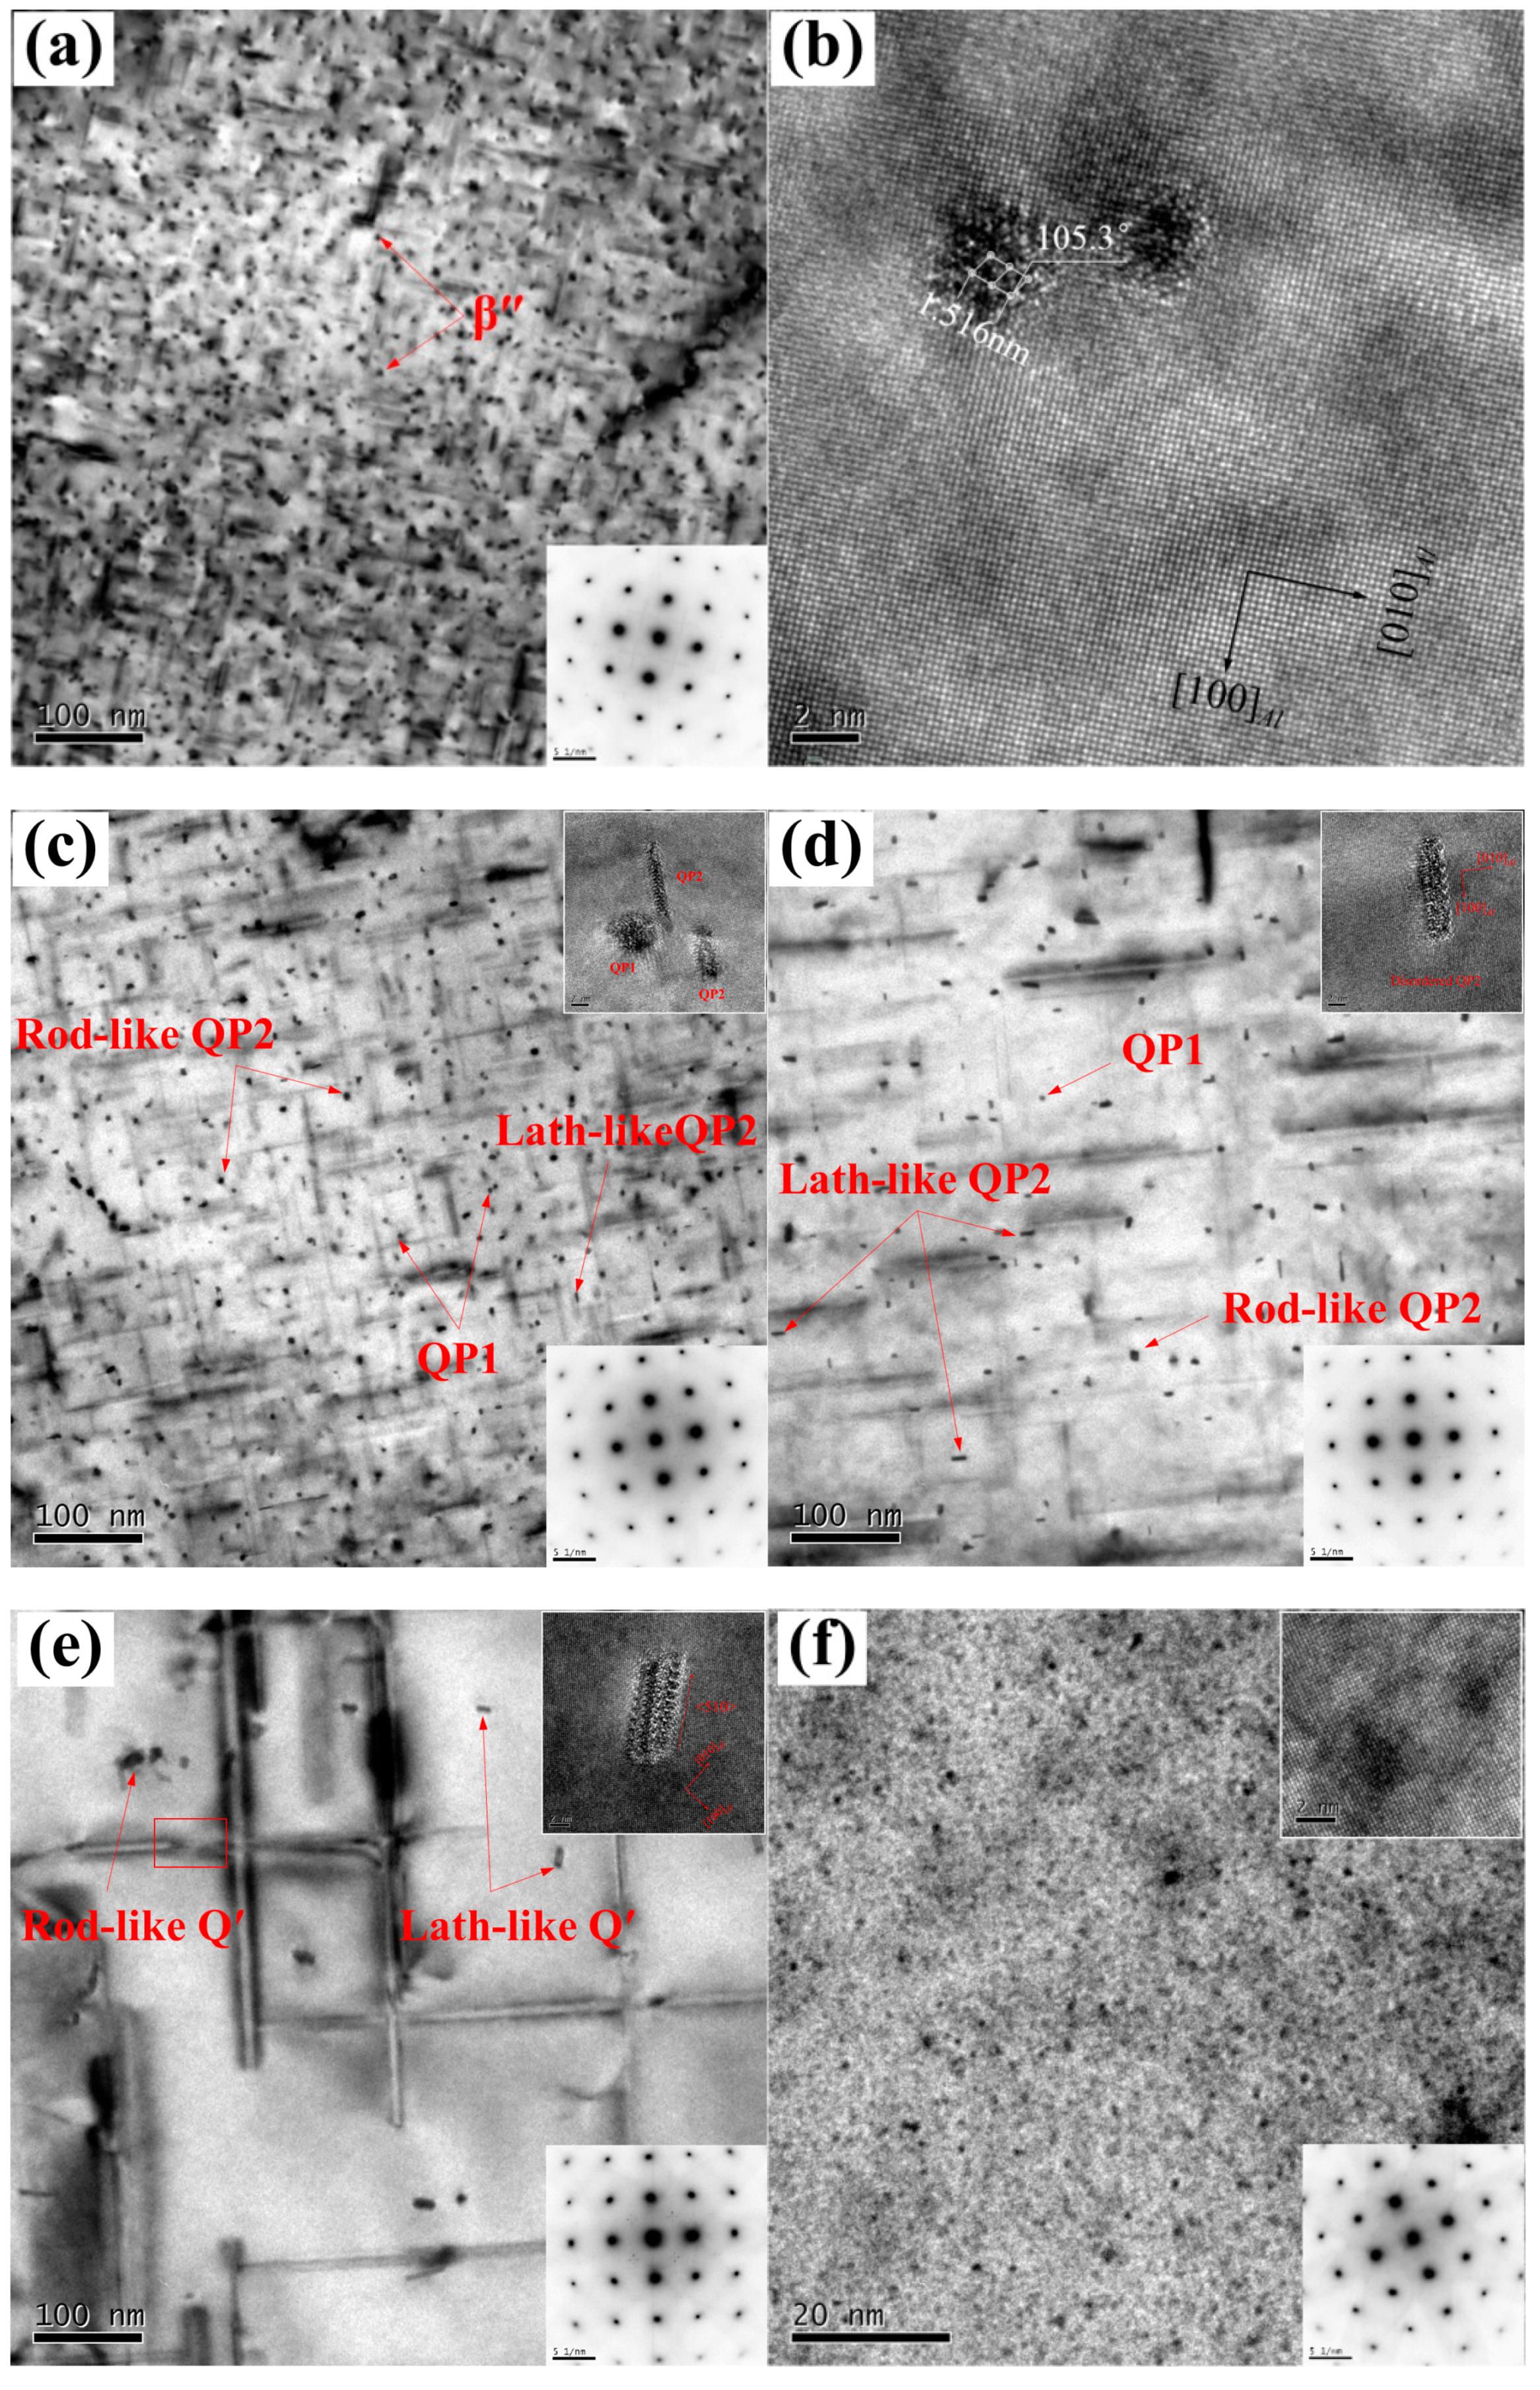
It can be seen from the results of EBSD that grain boundary strengthening shows no obvious contribution to the degradation of mechanical properties in transient thermal shock. Therefore, the effect of the transient heat shock on the solid solution and precipitates would result in more obvious influence on the strength. They are further studied through TEM and typical results are shown in Figure 8.
The precipitation sequence of Al-Mg-Si-Cu alloys is reported as: SSSS→Atomic clusters→GP zones→β″, L/S/C, QP, QC→β′, Q′→Q, Si [15]. The needle-shaped precipitates are β″ which are considered as the main strengthening phase in Al-Mg-Si alloy [16]. The unit cell of β″ precipitates is monoclinic with lattice parameters a = 1.534 ± 0.012 nm, b = 0.405 nm, c = 0.683 ± 0.015 nm, and β= 106 ± 1.5° [17], and is coherent with the Al matrix.
Figure 8a shows the microstructure features of the BM observed through TEM viewing from the zone axes direction. The inset figures are the corresponding selected area diffraction patterns (SADPs) figures. Needle-shaped precipitates with high density were observed in the 6061-T6 matrix. Their size is about 8.5–92.1 nm in length and 2.2–4.1 nm in diameter. Figure 8b shows the corresponding HRTEM image under the [001]Al zone axis. As can be seen, the β″ precipitates show high coherency along the needle direction (b-axis) with the <100>Al direction.
As shown in Figure 8c, the number of β″ phase precipitate in the sample labeled as L10.0 is obviously reduced and they are partially replaced by precipitates with a larger size distributed unevenly along the <100>Al direction. This sample suffered a thermal shock with highest temperatures of 292–307 °C. A few metastable QP phases appeared at this stage. The QP phase has a non-periodic atomic arrangement because the Cu atoms entered the unit cell of β″ [18,19]. According to the local ordered zones, the common QP phase is divided into QP1 phase and QP2 phase [20]. The size of needle-like QP1 phases is 17.1–89.6 nm in length and 2.4–5.2 nm in diameter. The average section size of lath-like QP2 phases is 7.1–8.5 nm in length and 1.5–2.8 nm in width. Coarsening of these precipitates weakens the obstacles for dislocation movement [21]. Therefore, the UTS, YS, and EL were reduced by 12.9%, 14.6%, and 13.8% respectively compared to the BM.
The decrease in the density of the precipitates was clearly observed in L6.0 sample under the thermal shock of 389.1–411.7 °C, as learned from Figure 8d. These precipitates are still distributed along the <100>Al direction, but its size has been increased to 65.1–326.9 nm in length and 5.1–7.8 nm in the diameter. The double line strain-contrast scene of the large-size precipitates is typical for the needle-like precipitates viewed perpendicular to their length [15]. The needle-like precipitates are still the disordered QP1 phases which are precursors of the Q′ phase. There are a lot of lath-like QP2 precipitates observing from the dark spots in <100>Al direction. The size of the cross-section is increased by 11.6–13.2 nm in length and 3.0–4.4 nm in width, in addition, the cross-section shape is more regular compared with the QP2 phase in L10.0. The mechanical strength of the material are further reduced, the UTS and YS were reduced by 30.0% and 38.1% compared to BM, but without obvious change in the EL.
Figure 8e shows the precipitation evolution of the sample L4.0 where the thermal shock temperatures was about 437.4–466.3 °C. It is prominent that the precipitates coarsening appreciably and interleaved with each other. The density of the precipitates decreased obviously. Two types of Q′ precipitates can be found indicated by solid arrow, respectively. The needle-like Q′ precipitates are 161.5–743.5 nm in length and 6.7–11.5 nm in diameter, the lath-like Q′ precipitates are 11.5–12.5 nm in length and 4.6–6.1 nm in thickness. Its long axis parallels to the <510>Al direction [20]. The lattice parameters of rod-like and lath-like Q′ precipitates are in accordance with the reported ones as a hexagonal unit structure and lattice parameters of a = 0.715 nm and c = 1.215 nm [22]. Since the thermal shock temperature has reached the solid solution temperature, phase dissolution occurred at the same time. The typical large-size Q′ precipitates break into several parts marked by red rectangles as shown in Figure 8e. Low density and large-size precipitates leads to the lowest strength of L4.0 sample, the UTS and YS were reduced by 38.6% and 57.4%, but the EL was increased by 38.4% compared with BM.
Compared to sample L4.0, the sample L1.0 was suffered to even higher thermal shock temperatures of 541.9–593.4 °C, the original precipitates were completely dissolved into Al matrix and spherical GP zones with high density were found in this region after NA for 10 days (Figure 8f). There are fully coherent relationships between spherical GP zones and Al matrix, indicating the alike lattice parameters for both of them [17]. These fine GP zones can improve the strengthening effect by means of the interactions of dislocations moving [23]. Thus the hardness values increase obviously after NA, as shown by Figure 3. However, the size of GP zones is too small than other precipitates. Therefore, the strengthening effect of the GP zones is weaker than other metastable phase. This is also confirmed by the comparison of the YS and UTS between L1.0 and BM in Figure 5. Even though, the small size feature of the GP zones brings an excellent EL.
To summary up, the heating suffered during the transient thermal shock mainly influences the precipitate state, which thereafter induced the variations of the mechanical properties. It is mainly related to the temperature level. When the temperature is below 224.0 °C, where the distance to the fusion line is over 20.5 mm, there is little influence in the mechanical performance. This is due to the fact that the precipitate state is hardly influenced compared to that of the BM. When the temperature is in rang of 224.0–411.7 °C, the precipitate coarsening (as shown by Figure 8c–e) are the main change in the microstructure. As known from the literature [24], such coarsening will weaken the dislocation moving preventing effect and thus reduce the strengthening effect. Therefore, the hardness and mechanical strength are both lower than those of the raw material. When the temperature is in 411.7–466.3 °C, this effect is rather obvious, which induces the valley shape in the hardness curves as shown in Figure 3. When the temperature is over 541.9 °C, materials in this area experience a fast heating and quenching process [10]. Precipitate dissolving and solutionizing processes take place. Therefore, after the thermal shock, this area is in the solid solution state. During the thereafter natural aging process, GP zones (Figure 8f) form gradually, which become the main strengthening precipitates and supplied the mechanical strength.

3.4. Material Constitutive Relation and Damage Model

Since the tensile properties in different area of the designed structure after the transient thermal shock are quite different, the constitutive relation and damage parameters differ a lot. They were determined through FEM calculation and fitting of the experimental stress–strain curves. The FEM model was built using the eight-node reduced-integration solid elements of C3D8R. The element size is about 0.5 mm. MAT_120 (*MAT_GURSON) material model was used to characterize the stress–strain relationship and fracture failure behavior. After that, explicit finite element simulations were performed for all experimental samples using LS-DYNA software package [25]. Special attention was paid to the following points.
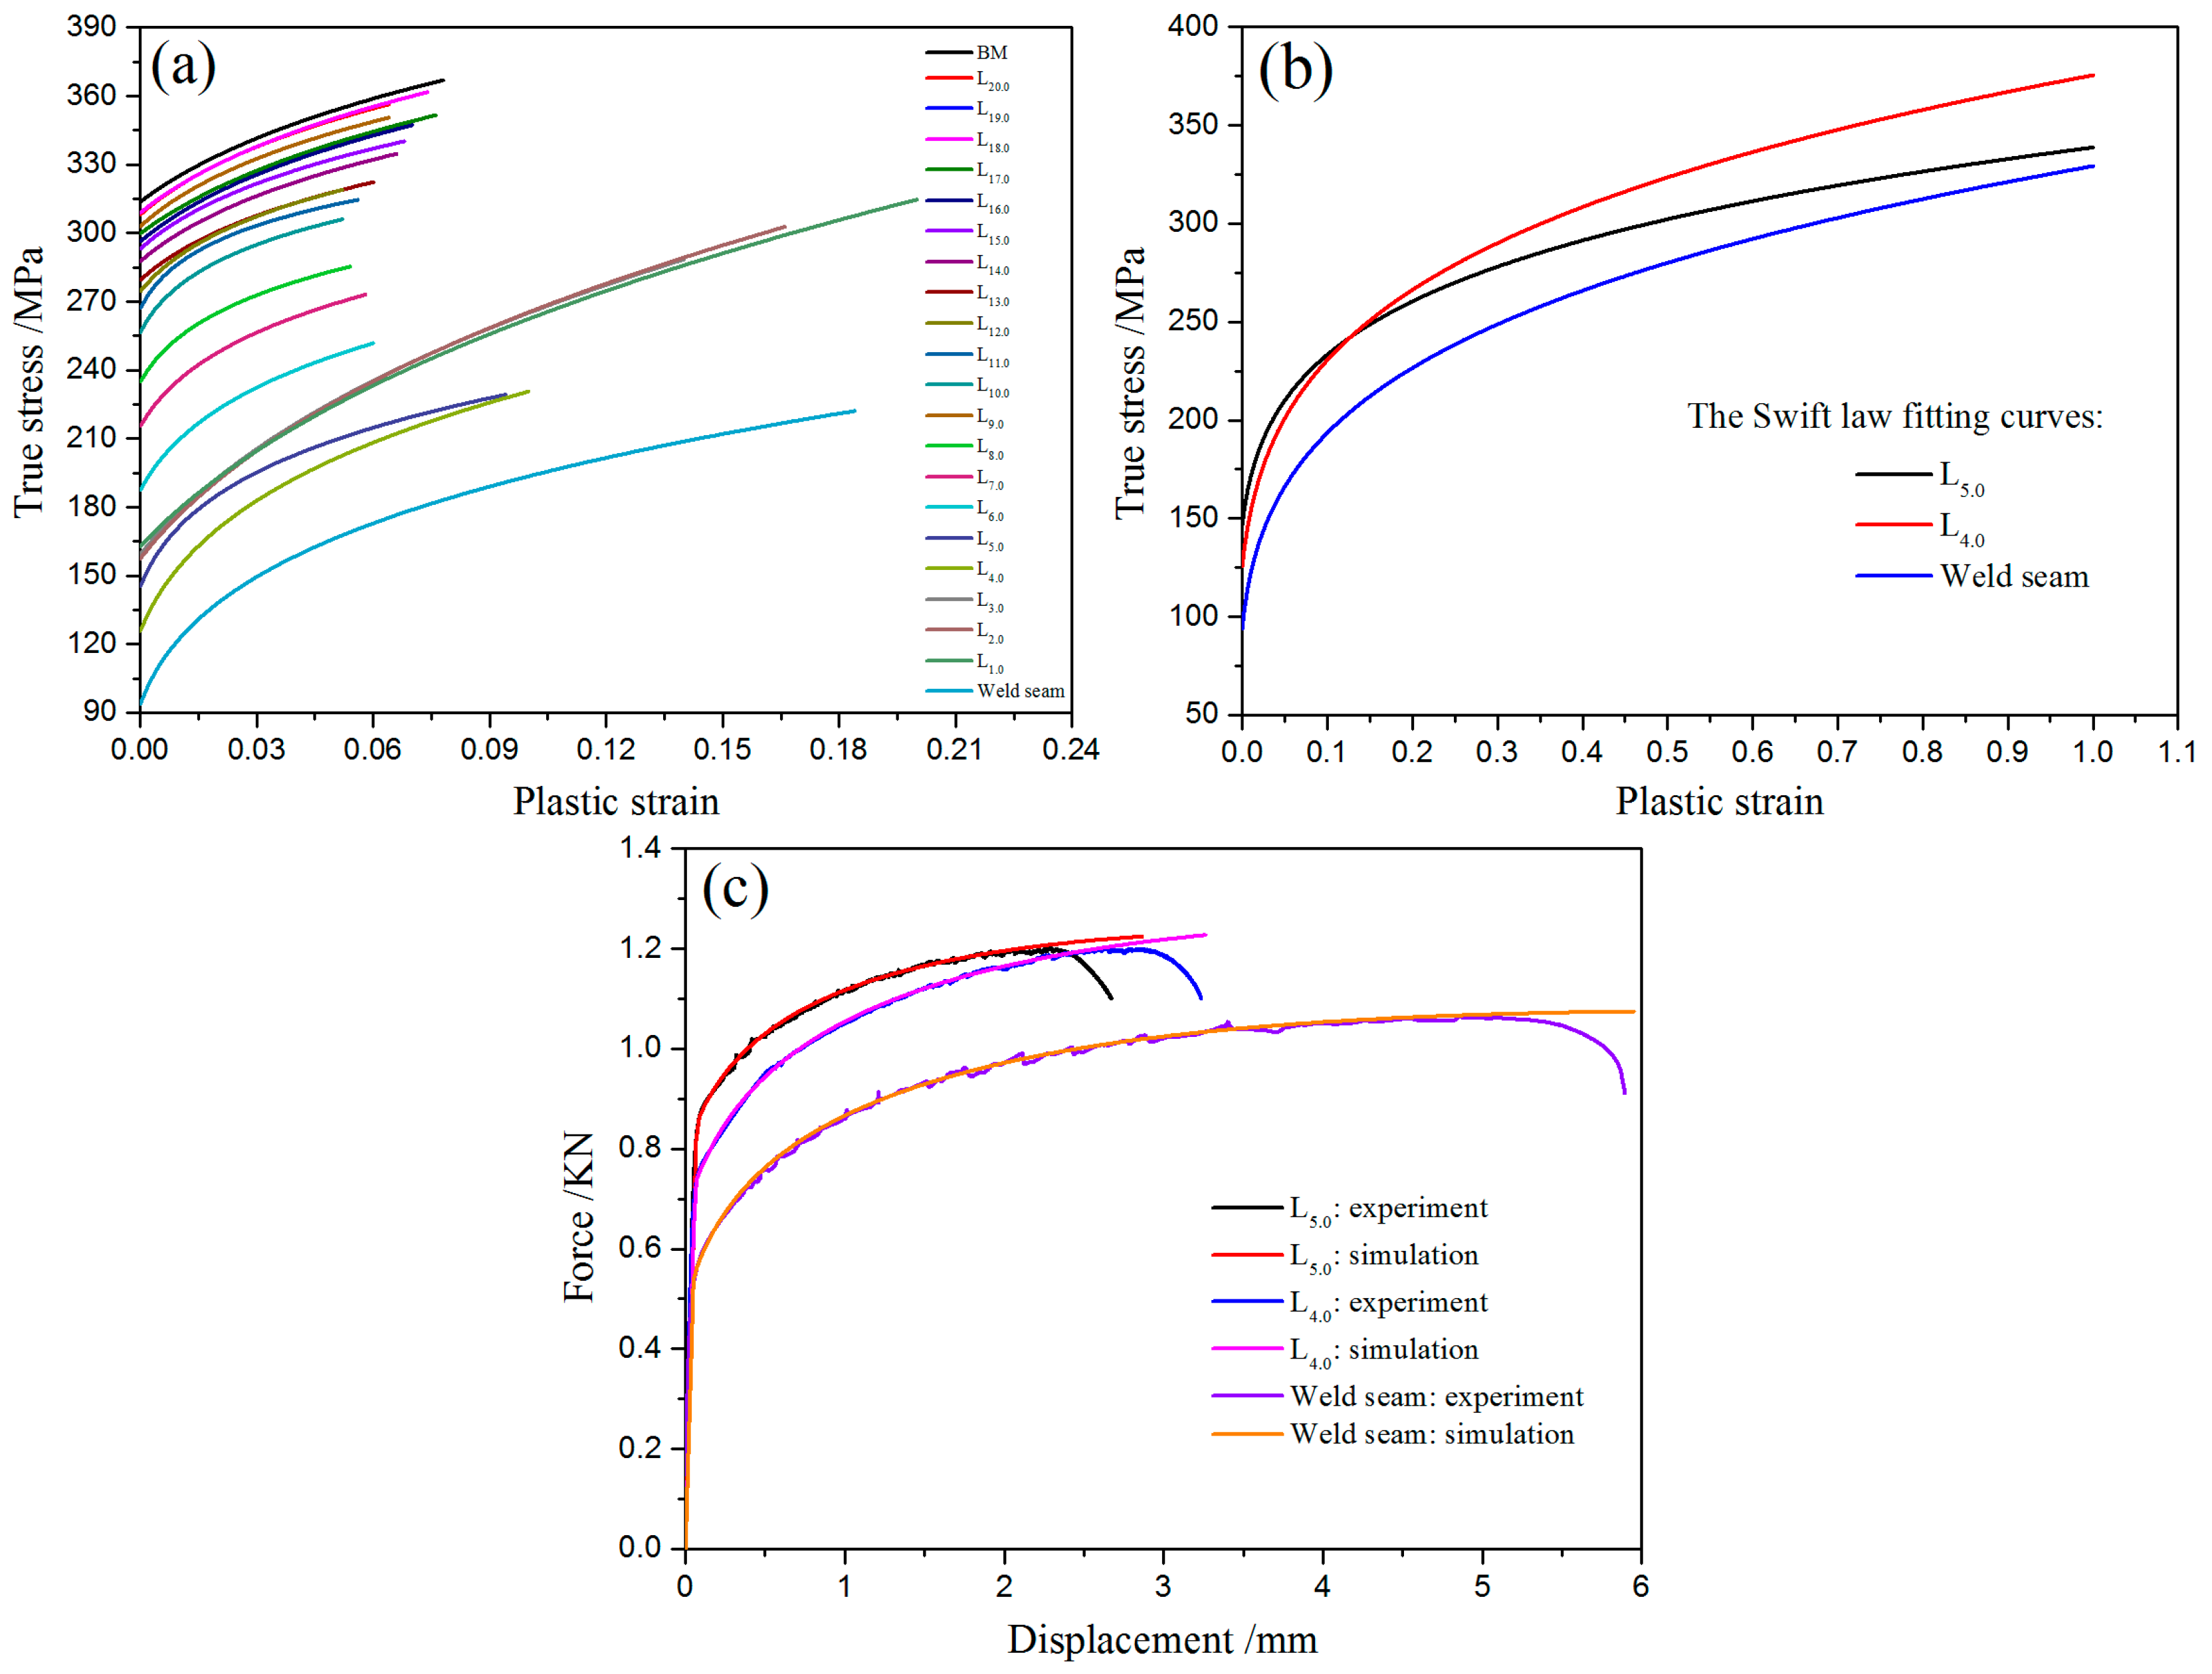
(1) The first thing is determining the material constitutive relation for each samples. The plastic strain-true stress curves of twenty samples with different temperature, together with that of the BM before necking are shown in Figure 9a. Because of the fact that the material deformed unevenly after necking, the post-necking stress–strain curve obtained by uniaxial tensile test is not real. In the present study for describing the hardening behavior of the large strain zones, the widely used Swift law was applied:
σ T = K ( ε 0 + ε ¯ P ) n
where σ T is the true stress, K is the strengthening coefficient, ε 0 is the yield strain, ε ¯ P is the equivalent plastic strain. Three samples namely the weld seam, L5.0 (411.7–437.4 °C) and L4.0 (437.4–466.3 °C), which showed relatively low mechanical strength, were selected for hardening curve fitting and the Swift parameters are listed in Table 3. There is a good agreement between the simulated and experimental force-displacement curves before the maximum force point, as shown in Figure 9b. Because of the fact that the softening and damage parameters are not determined in the constitutive model, the curves still show continuous hardening without necking, as shown in Figure 9c.
(2) The second important thing is the determination of the damage model. As reported in the literature, the Gurson-Tvergaard-Needlemen (GTN) damage model [26,27,28] was established to predict the large deformation and fracture of the tensile experiment. The Gurson flow function is defined as:
Φ = σ M 2 σ Y 2 + 2 q 1 f * cosh ( 3 q 2 σ H 2 σ Y ) 1 ( q 1 f * ) 2 = 0
where σ M is the equivalent von Mises stress, σ Y is the yield stress, σ H is the mean hydrostatic stress, q 1 and q 2 are the Gurson flow function parameter, f * is the effective void volume fraction. The f * is defined as:
f * ( f ) = { f f f c f c + 1 / q 1 f c f F f c ( f f c ) f > f c
where f is the void volume fraction, f c is the critical void volume fraction, f F is the void volume fraction in fracture. The growth of void volume fraction includes two parts: void nucleation ( f ˙ G ) and void growth ( f ˙ N ). The formula is defined as:
f ˙ = f ˙ G + f ˙ N
It is assumed that the plastically deformed matrix material is incompressible. The growth of existing voids is defined as:
f ˙ G = ( 1 f ) ε ˙ k k p
f 0 is the initial void volume fraction. Nucleation of new voids is defined as:
f ˙ N = A ε ˙ p
with the function:
A = f N S N 2 π exp ( 1 2 ( ε p ε N S N ) 2 )
where f N is the void volume fraction of nucleating particles, ε N is the mean nucleation strain, S N is the standard deviation of nucleation stain, ε ˙ p is the equivalent plastic strain.
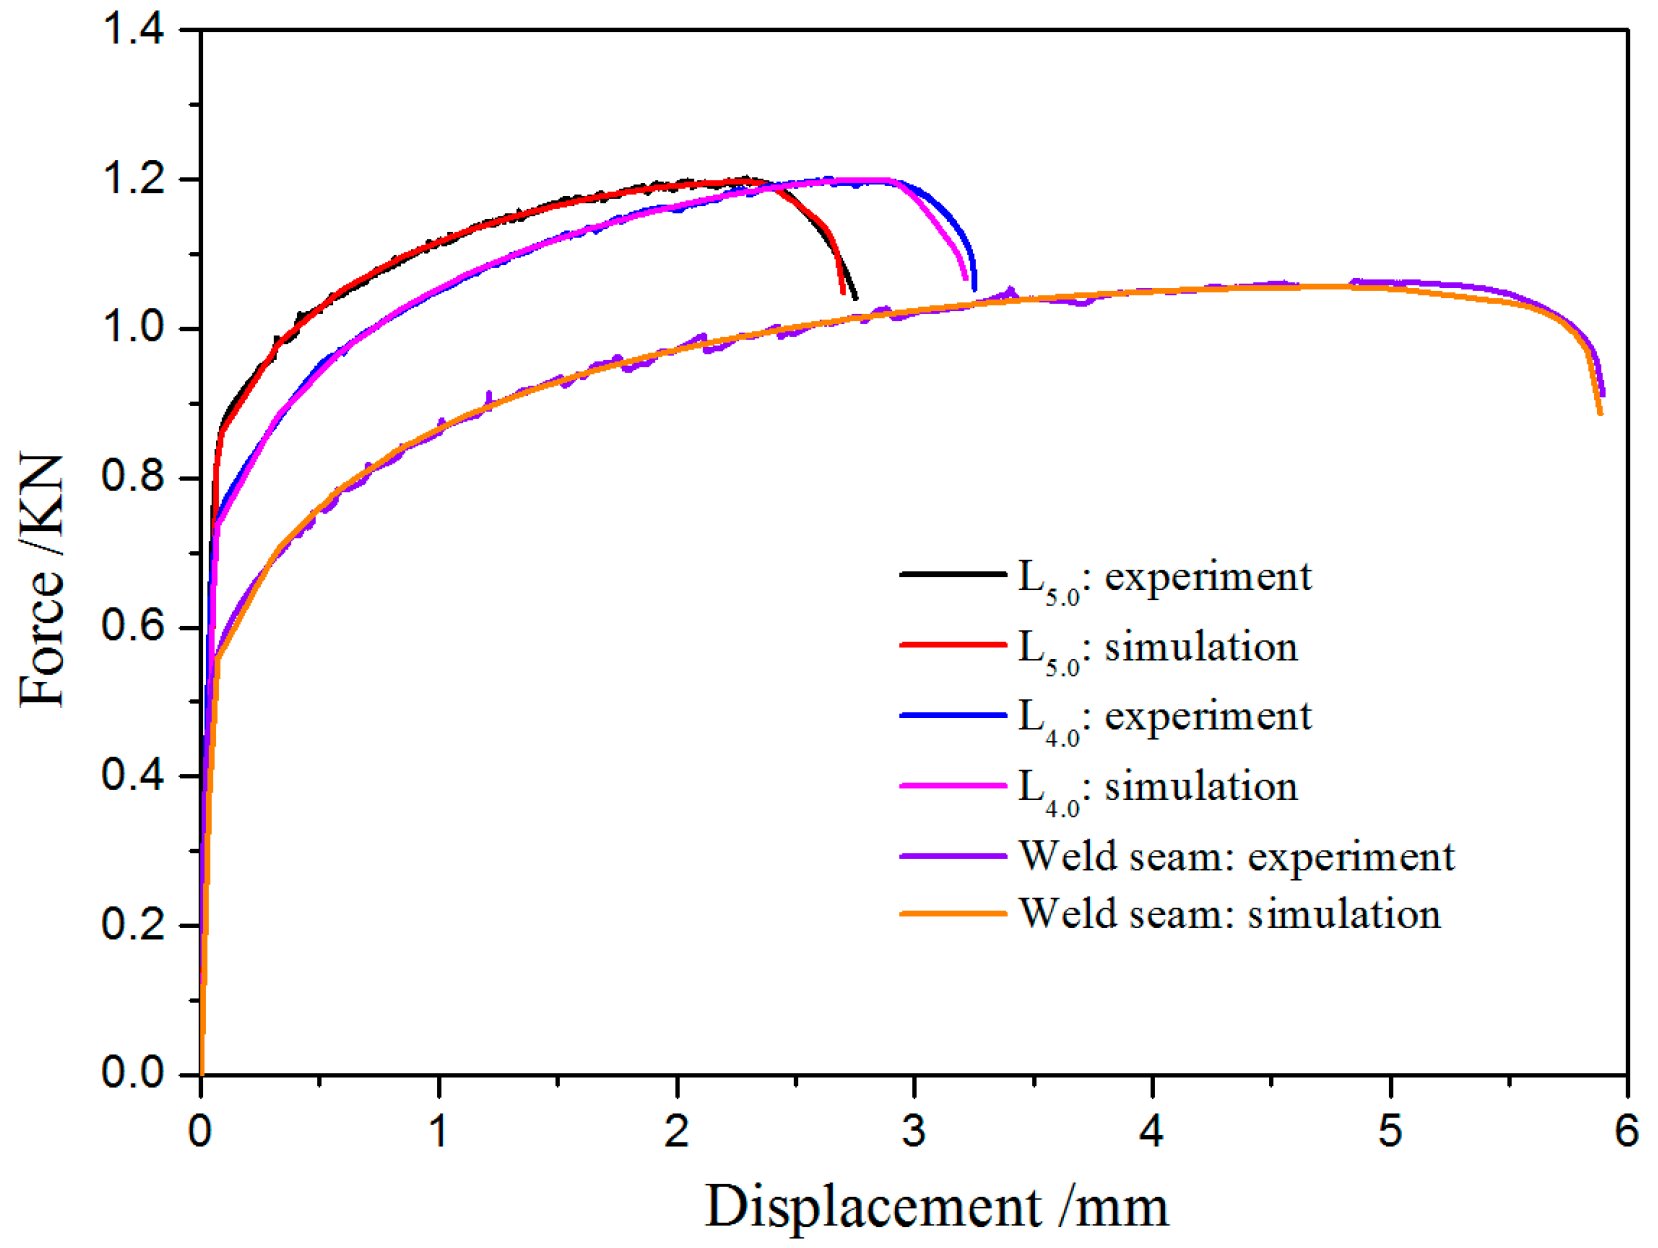
Determination of eight parameters is needed for the application of GTN model to perform the fracture failure analysis, including the coefficients of yield function ( q 1 and q 2 ), void nucleation parameters ( f 0 , ε N , f N , S N ), and void volume fractions of coalescence and fracture ( f c , f F ), respectively. The parameters q 1 and q 2 depend strongly on both of the strain hardening (n) and the ratio of yield strength over Young’s modulus (YS/E) [29]. The values for q 1 and q 2 of the selected three samples were then solved based on the parameters as shown in Table 2. According to previous studies [30], voids exist at the interface matrix or precipitate in 10% pre-strained aluminum alloy, but the voids do not exist when the load is not applied. Thuillier [30] and Brunet [31] have confirmed that the initial void nonzero value did not lead to significant changes for the results. Moreover, the initial void which was defined as zero also obtained good results in their papers. So the value of f 0 was set as zero in our present study. Void nucleation mainly occurs during the necking process. Therefore, the mean nucleation strain ε N was considered to be equal to the strain when necking appears [32]. The ε N values of L5.0, L4.0 and weld seam were 0.105, 0.125, and 0.183 respectively corresponding to the true strain in UTS. The remained GTN model parameters contain the nucleation rate function parameter S N and the void volume fraction parameters ( f N , f c , f F ). These parameters cannot be obtained directly neither by microstructure observation nor through tensile experiment [33,34]. In this case, we adopted the reverse approach by fitting the softening behavior of the material after necking as shown in the stress–strain curves. The obtained GTN damage parameters are listed in Table 4. In this way, the stress–strain curves were then simulated, and the typical results are shown in Figure 10. As can be seen, it is concluded that an accurate prediction in both force-displacement and fracture response has been achieved after a detailed comparison of the experimental and simulation results. The simulated curve of elastic and plastic strain ranges before necking is highly coincident with the experimentally obtained curve. The maximum force in the simulated curve is a little lower than the experimental value owing to the addition of the void nucleation and growth coefficient in GTN damage model. The GTN damage parameters predict accurately the softening tendency of materials in large strain ranges. The error for the prediction of the fracture displacement was 2.6%, indicating an excellent simulation has been reached.

3.5. Prediction of the Stress–Strain Response of Typical Welding Joints

The material constitutive relationships after different transient thermal shock were then applied to simulate the mechanical response of typical butt joints. At the same time, the effectiveness and accuracy of the proposed method was examined. Here, taking the butt joint for example, every step is as follows and also depicted in Figure 11. First of all, the temperature distribution in the butt was obtained by welding simulation. Then the structure was divided into different layers according to the temperature distribution, as shown in Figure 11a. With this layer marks, each layer was assigned with different material constitutive relation parameters, obtained through the method described in “Section 3.4.” When building the FEM model, these layers were connected by merging adjacent nodes.
Figure 11 shows the FEM results of a butt joint simulation case. As shown by Figure 11a, the temperature distribution shows a symmetrical feature with weld seam in the center. As the distance to the weld center increases, the temperature gradually decreases. Then the whole structure was divided into 20 layers according the temperature distribution. For comparison and verifying the simulated results, the same real butt sample was also prepared and tested experimentally. They were prepared using the same MIG welding method as mentioned in “Section 2” and the 6061-T6 material but with thickness of 3 mm. The tensile tests were carried out with the same parameters. Figure 11b shows the comparison of the simulation results of the force-displacement curve of both the simulated and experimentally tested curves. It can be seen that the simulation describes accurately the mechanical behavior of the welded joint before fracture. The maximum force in simulation is a little higher than that in the experimental curve, and the errors of the maximum force and the fracture location are 2.5% and 8.1% respectively. By the results, it is proved safely that the FEM method proposed in the current study is applicable for mechanical performance simulation and prediction for the Al-Mg-Si-Cu aluminum structures after a transient thermal shock.

4. Conclusions

The mechanical property variation and the thermal softening mechanisms of the Al-Mg-Si aluminum alloys under transient thermal shock were characterized systematically taking the welding as a typical case. By an equivalent structure design and building numerical simulations, the material constitutive relation for different layers that have suffered to thermal shock with different temperature and duration was established. The stress–strain response and fracture behavior of the typical butt joint were analyzed and predicted. Main conclusions can be drawn as follows:
  • The designed method of cutting layers can obtain accurate stress–strain response of the materials in different sub-areas at different transient thermal shock temperature levels.
  • The transformation of the precipitates is the key factor affecting the mechanical properties under the transient thermal shock. The transient thermal shock can be divided into over-aged zone (236.2–411.7 °C), seriously-over-aged zone (411.7–466.3 °C), and quenched zone (466.3–593.4 °C). As the temperature increases, the UTS and YS decrease gradually in over-aged and well-over-aged zones. The EL is increased in the quenched zone.
  • Through refined FEM with exact material constitutive relations of sub-areas in thermally shocked structure, the force-displacement response can be simulated and predicted. With a careful determination of the GTN damage parameters, the fracture behavior can also be well predicted using the supposed FEM model building method.

Author Contributions

Conceptualization, C.X. and H.H.; methodology, K.L.; software, X.Z.; validation, C.X., H.X. and X.Z.; formal analysis, H.X.; investigation, X.Z.; resources, H.H.; data curation, H.X.; writing—original draft preparation, C.X.; writing—review and editing, H.H.; visualization, L.L.; supervision, L.L.; project administration, L.L.; funding acquisition, K.L. All authors have read and agreed to the published version of the manuscript.

Funding

This work was funded by the National Natural Science Foundation of China [grant number 51975201, U1664252] and the Natural Science Foundation of Hunan Province, China [grant number 2019JJ50054], the Fundamental Research Funds for the Central Universities, China [grant number 15074923630] and the National Key Research and Development Program of China [grant number 2016YFB0101700].

Conflicts of Interest

The authors declare no conflict of interest.

References

  1. Jo, H.; Cho, H.; Lee, K.; Kim, Y. Extrudability improvement and energy consumption estimation in Al extrusion process of a 7003 alloy. J. Mater. Process. Technol. 2002, 130, 407–410. [Google Scholar] [CrossRef]
  2. Xu, C.; He, H.; Yu, W.; Li, L. Influence of quenching temperature on peak aging time and hardness of Al-Mg-Si-Cu alloys strengthened by nano-sized precipitates. Mater. Sci. Eng. A 2019, 744, 28–35. [Google Scholar] [CrossRef]
  3. Händel, M.; Nickel, D.; Lampke, T. Effect of different grain sizes and textures on the corrosion behaviour of aluminum alloy AA6082. Mater. Werkstofftech. 2011, 42, 606–611. [Google Scholar] [CrossRef]
  4. Chen, J.; Costan, E.; Van Huis, M.; Xu, Q.; Zandbergen, H. Atomic pillar-based nanoprecipitates strengthen AlMgSi alloys. Science 2006, 312, 416–419. [Google Scholar] [CrossRef] [Green Version]
  5. Jin, S.; Ngai, T.; Zhang, G.; Zhai, T.; Jia, S.; Li, L. Precipitation strengthening mechanisms during natural ageing and subsequent artificial aging in an Al-Mg-Si-Cu alloy. Mater. Sci. Eng. A 2018, 724, 53–59. [Google Scholar] [CrossRef]
  6. Hori, H. Effect of heat-affected zone on joint strength of welded Al–Mg–Si System. Weld. Int. 2011, 25, 737–741. [Google Scholar] [CrossRef]
  7. Nie, F.; Dong, H.; Chen, S.; Li, P.; Wang, L.; Zhao, Z.; Li, X.; Zhang, H. Microstructure and mechanical properties of pulse MIG welded 6061/A356 aluminum alloy dissimilar butt joints. J. Mater. Sci. Technol. 2018, 34, 551–560. [Google Scholar] [CrossRef]
  8. Zhang, W.; He, H.; Xu, C.; Yu, W.; Li, L. Precipitates Dissolution, Phase Transformation, and Re-precipitation-Induced Hardness Variation in 6082-T6 Alloy during MIG Welding and Subsequent Baking. JOM USL 2019, 71, 2711–2720. [Google Scholar] [CrossRef]
  9. Zhang, W.; He, H.; Shan, Y.; Sun, C.; Li, L. Diffusion assisted hardness recovering and related microstructural characteristics in fusion welded Al–Mg–Si alloy butt. Mater. Res. Express. 2019, 6, 066549. [Google Scholar] [CrossRef]
  10. ASTM E8M-04. Standard Test Methods for Tension Testing of Metallic Materials; ASTM International: West Conshohocken, PA, USA, 2016. [Google Scholar]
  11. Miao, W.F.; Laughlin, D.E. Precipitation hardening in aluminum alloy 6022. Scr. Mater. 1999, 40, 873–878. [Google Scholar] [CrossRef]
  12. Maisonnette, D.; Suery, M.; Nelias, D.; Chaudet, P.; Epicier, T. Effects of heat treatments on the microstructure and mechanical properties of a 6061 aluminium alloy. Mater. Sci. Eng. A 2011, 528, 2718–2724. [Google Scholar] [CrossRef] [Green Version]
  13. Siddiqui, R.A.; Abdullah, H.A.; Al-Belushi, K.R. Influence of aging parameters on the mechanical properties of 6063 aluminium alloy. J. Mater. Process. Technol. 2000, 102, 234–240. [Google Scholar] [CrossRef]
  14. Dorward, R.; Bouvier, C. A rationalization of factors affecting strength, ductility and toughness of AA6061-type Al–Mg–Si–(Cu) alloys. Mater. Sci. Eng. A 1998, 254, 33–44. [Google Scholar] [CrossRef]
  15. Marioara, C.; Andersen, S.; Stene, T.; Hasting, H.; Walmsley, J.; Van Helvoort, A.; Holmestad, R. The effect of Cu on precipitation in Al–Mg–Si alloys. Philos. Mag. 2007, 87, 3385–3413. [Google Scholar] [CrossRef]
  16. Buchanan, K.; Colas, K.; Ribis, J.; Lopez, A.; Garnier, J. Analysis of the metastable precipitates in peak-hardness aged Al-Mg-Si (-Cu) alloys with differing Si contents. Acta Mater. 2017, 132, 209–221. [Google Scholar] [CrossRef]
  17. Huis, M.A.V.; Chen, J.H.; Sluiter, M.H.F.; Zandbergen, H.W. Phase stability and structural features of matrix-embedded hardening precipitates in Al–Mg–Si alloys in the early stages of evolution. Acta Mater. 2007, 55, 2183–2199. [Google Scholar] [CrossRef]
  18. Cayron, C.; Sagalowicz, L.; Beffort, O.; Buffat, P. Structural phase transition in Al-Cu-Mg-Si alloys by transmission electron microscopy study on an Al-4 wt% Cu-1 wt% Mg-Ag alloy reinforced by SiC particles. Philos. Mag. A 1999, 79, 2833–2851. [Google Scholar] [CrossRef]
  19. Cayron, C.; Buffat, P. Transmission electron microscopy study of the β’phase (Al–Mg–Si alloys) and QC phase (Al–Cu–Mg–Si alloys): Ordering mechanism and crystallographic structure. Acta Mater. 2000, 48, 2639–2653. [Google Scholar] [CrossRef]
  20. Ding, L.; Jia, Z.; Nie, J.F.; Weng, Y.; Cao, L.; Chen, H.; Wu, X.; Liu, Q. The structural and compositional evolution of precipitates in Al-Mg-Si-Cu alloy. Acta Mater. 2018, 145, 437–450. [Google Scholar] [CrossRef]
  21. Deschamps, A.; Brechet, Y. Influence of predeformation and ageing of an Al–Zn–Mg alloy—II. Modeling of precipitation kinetics and yield stress. Acta Mater. 1998, 47, 293–305. [Google Scholar] [CrossRef]
  22. Matsuda, K.; Ikeno, S.; Uetani, Y.; Sato, T. Metastable phases in an Al-Mg-Si alloy containing copper. Metall. Mater. Trans. A 2001, 32, 1293–1299. [Google Scholar] [CrossRef]
  23. Aruga, Y.; Kozuka, M.; Takaki, Y.; Sato, T. Effects of natural aging after pre-aging on clustering and bake-hardening behavior in an Al–Mg–Si alloy. Scr. Mater. 2016, 116, 82–86. [Google Scholar] [CrossRef] [Green Version]
  24. Granholt, J.D.D.A. Precipitate Structure Changes during Overaging in an Al-Mg-Si Alloy. Master’s Thesis, Institutt for fysikk, Trondheim, Norway, 2012. [Google Scholar]
  25. Hallquist, J.O. Nonlinear Dynamic Analysis of Structures in Three Dimensions; LS-DYNA3D; Livermore Software Technology Corp.: Livermore, CA, USA, 1994. [Google Scholar]
  26. Gurson, A.L. Continuum theory of ductile rupture by void nucleation and growth: Part I—Yield criteria and flow rules for porous ductile media. J. Eng. Mater. Technol. 1977, 99, 2–15. [Google Scholar] [CrossRef]
  27. Tvergaard, V. Influence of voids on shear band instabilities under plane strain conditions. Int. J. Fract. 1981, 17, 389–407. [Google Scholar] [CrossRef]
  28. Tvergaard, V. Influence of void nucleation on ductile shear fracture at a free surface. J. Mech. Phys. Solids. 1982, 30, 399–425. [Google Scholar] [CrossRef]
  29. Faleskog, J.; Gao, X.; Shih, C.F. Cell model for nonlinear fracture analysis—I. Micromechanics calibration. Int. J. Fract. 1998, 89, 355–373. [Google Scholar] [CrossRef]
  30. Thuillier, S.; Le Maoût, N.; Manach, P.Y. Influence of ductile damage on the bending behaviour of aluminium alloy thin sheets. Mater. Des. 2011, 32, 2049–2057. [Google Scholar] [CrossRef]
  31. Brunet, M.; Mguil, S.; Klocker, H. On the determination of true stress triaxiality in sheet metals. J. Mater. Process. Technol. 2007, 184, 272–287. [Google Scholar]
  32. Yan, Y.; Sun, Q.; Chen, J.; Pan, H. The initiation and propagation of edge cracks of silicon steel during tandem cold rolling process based on the Gurson–Tvergaard–Needleman damage model. J. Mater. Process. Technol. 2013, 213, 598–605. [Google Scholar] [CrossRef]
  33. Chhibber, R.; Arora, N.; Gupta, S.; Dutta, B. Estimation of Gurson material parameters in bimetallic weldments for the nuclear reactor heat transport piping system. Proc. Inst. Mech. Eng. Part C 2008, 222, 2331–2349. [Google Scholar] [CrossRef]
  34. Zhang, Z.; Thaulow, C.; Ødegård, J. A complete Gurson model approach for ductile fracture. Eng. Fract. Mech. 2000, 67, 155–168. [Google Scholar] [CrossRef]
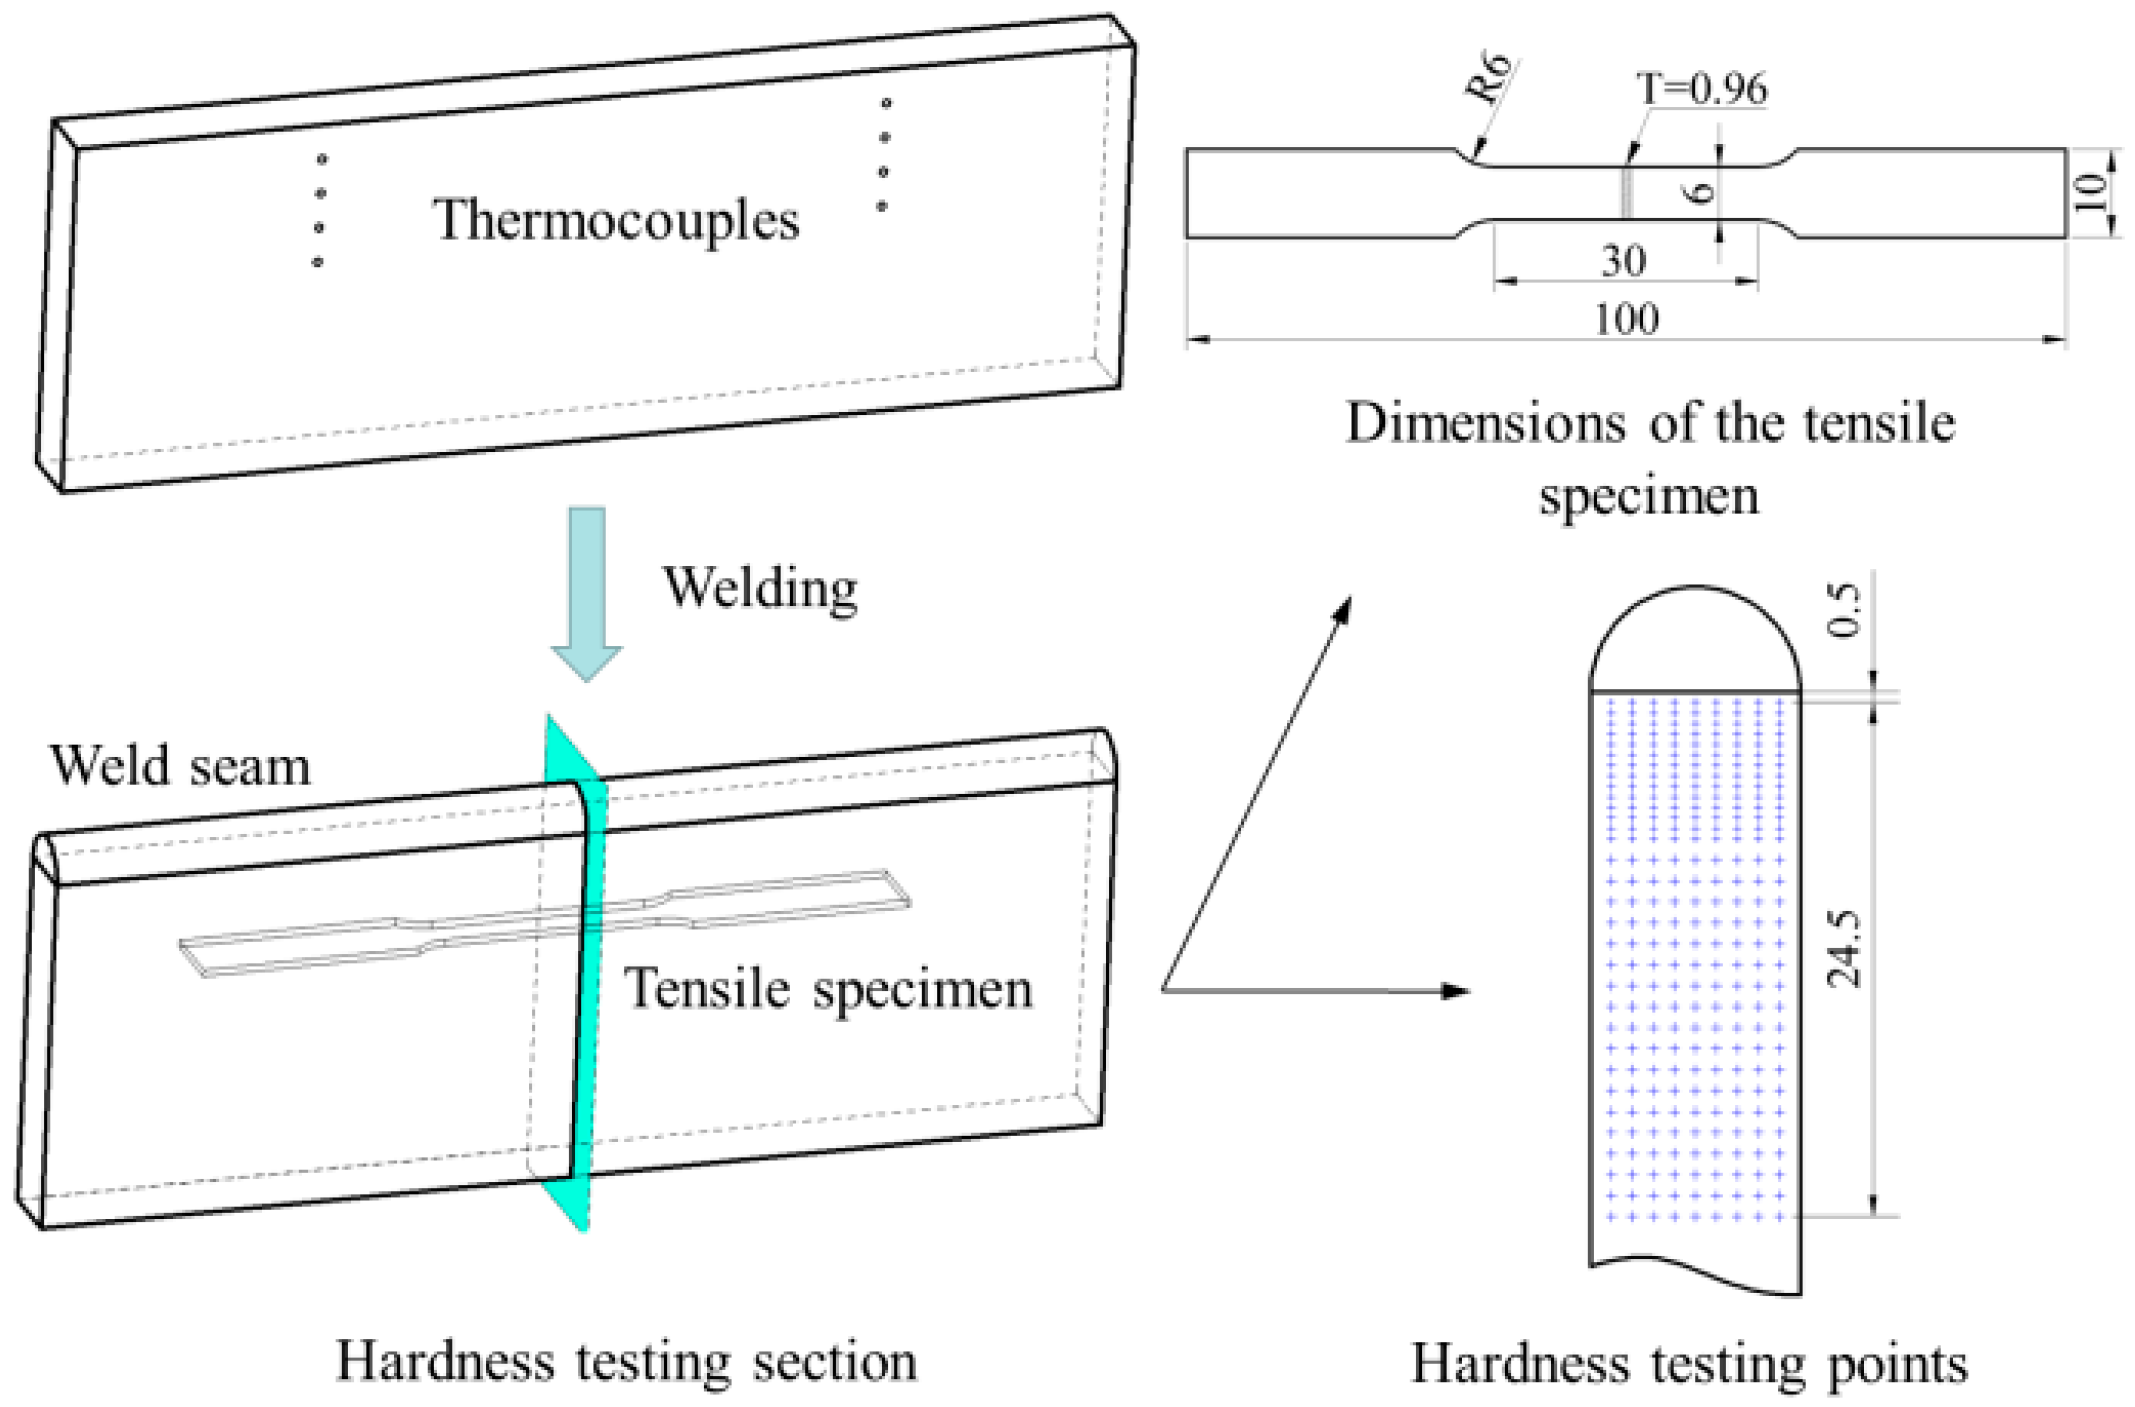
Figure 1. A schematic diagram of the welding process and testing sample locations.
Metals 10 00537 g001
Figure 2. (a) A schematic diagram of the numerical temperature simulation model; (b) the thermal and mechanical properties for AA6061.
Metals 10 00537 g002
Figure 3. Thermal history of transient thermal shock on the designed structure: (a) Temperature evolution in different locations; (b) the maximum temperature of the points with different distance to the fusion line.
Metals 10 00537 g003
Figure 4. Hardness curves of the sample at different natural aging time.
Metals 10 00537 g004
Figure 5. Tensile testing results of the specimens: (a) Engineering stress–strain curves; (b) strength/elongation-peak temperature curves.
Metals 10 00537 g005
Figure 6. Scanning electron microscopy (SEM) images of fracture surfaces (a) BM, (b) L10.0, (c) L6.0, (d) L4.0, (e) L1.0.
Metals 10 00537 g006
Figure 7. Inverse pole figures of the different zones of the transient thermal shock sample: (a) Weld zone (WZ), fusion zone (FZ), heat-affected zone (HAZ); (b) base material (BM).
Metals 10 00537 g007
Figure 8. Transmission electron microscopy (TEM) micrographs of precipitate dispersions at different zones: (a) and (b) BM; (c) L10.0; (d) L6.0; (e) L4.0; (f) L1.0.
Metals 10 00537 g008
Figure 9. Identification of a reliable strain hardening curve to large strains: (a) The plastic strain-true stress curves of the twenty samples, BM, and weld seam; (b) the strain hardening extrapolations by Swift law; (c) predictions of the force-displacement response using Swift law.
Metals 10 00537 g009
Figure 10. Prediction results of the force-displacement response for samples of L5.0, L4.0 and the weld seam samples using Swift law and GTN damage model.
Metals 10 00537 g010
Figure 11. The finite element modeling (FEM) results of the butt joint: (a) The process of combination between thermal and structural mechanics simulation; (b) the prediction of the force-displacement response.
Metals 10 00537 g011
Table 1. Chemical composition of the 6061 aluminum alloy and ER5356 welding wire (weight %).
MaterialMgSiFeCuCrMnZnTiAl
6061-T60.910.640.130.360.090.070.020.02Bal.
ER5356data4.90.040.10.010.130.010.09Bal.
Table 2. The peak temperature, dwelling time, and cooling rate in different point.
The Distance from the Fusion Line (mm)Peak Temperature (°C)Dwelling Time from Peak Temperature to 235 °C (s)Cooling Rate
(°C/s)
4465.811.0120.96
9335.89.1611.0
14256.64.684.62
19235.00-
Table 3. The Swift law parameters for the samples L5.0, L4.0, and weld seam.
Sample NameK/MPa ε 0 n
L5.0338.40.006620.166
L4.0375.00.006520.217
Weld seam328.90.004860.235
Table 4. The Gurson-Tvergaard-Needlemen (GTN) damage parameters for the samples L5.0, L4.0 and weld seam.
Samples
Name
Temperature
Range/°C
q 1 q 2 f 0 f N ε N S N f c f F
L5.0411.7–437.41.760.83400.040.1050.020.040.118
L4.0437.4–466.31.930.78100.040.1250.0180.0350.13
Weld seam>6332.00.7800.0180.1830.040.020.08 3