Abstract
Laser solid forming (LSF) is a promising additive manufacturing technology. In the LSF process, deformation behaviors dictate the accuracy of the produced parts. In this study, by using a laser displacement detector based on laser triangulation principle, an accurate and effective real-time detection method was established to monitor the real-time deformation behavior of the key position during the LSF of a thin-wall structure. The results confirmed that increasing thin-wall length results in increasing final deformation of the edge. The displacement fluctuation range and value in the middle of thin wall are both smaller than that of the positions near the end, while the entire displacement changing direction in the middle is opposite to that of the end positions. When the deposition process is paused, the deformation of the thin wall during the cooling stage will deviate the position of the deposited thin wall, resulting in the dislocation between the subsequent deposited part and that before the pause, which affect the dimensional accuracy of the thin wall structure. This non-contact real-time detection method also confirmed the ability to monitor the initiation of cracking during the LSF process, and a potential to be used for the on-line feedback control of deformation of detected key position of deposited structure.
1. Introduction
The Laser solid forming (LSF) process is an advanced additive manufacturing technology. During manufacturing process, metal powder is required to be transported by gas flow simultaneously to a molten pool created by laser beam on substrate composed of original or previously-deposited material. Nd: YAG [1,2] or CO2 [3,4] type lasers are usually utilized as energy source to create high thermal gradients, which drives the Marangoni convection to ensure excellent mixing of the materials and substrates [5]. The movement of the laser beam solidifies the molten pool and forms a deposited layer with full-density, crack-free deposit, and full-strength fusion bond to the substrate under appropriate operating conditions [6]. This process has been used for the direct fabrication of metal parts, surface coating, and repairing damaged components [7,8,9], and can also be used to produce functional-gradient materials [10,11] and composite materials [12,13], both of which cannot be fabricated via conventional means. Many pieces of research focused on the process, microstructure, and properties of LSF technology [14,15,16].
During the LSF process, stresses due to thermal gradients will cause significant deformation (especially thin wall structure deposition), which could even lead to cracking. Deformation behavior caused by stress is important towards the quality of the deposited metal parts, which is also harmful to the subsequent deposition process, sometimes causing deposition failure. Therefore, understanding stress and deformation during the LSF process, especially deformation evolution, is the key towards optimizing the process parameters, scanning route, and structure design to ensure dimensional precision. The numerical simulation is a good way to help us to understand the process. However, simulations were unable to track sudden statuses during the LSF process, such as the change of process parameters and cracking. It is also difficult to verify the simulations by real time detection method during deposition. Instead, verification was made via measurements of residual stress and deformations of the final part. Chew et al. [17] developed a three-dimensional finite element model to simulate residual stress induced for laser cladding, and performed X-ray diffraction (XRD) stress measurements to validate the model. Yang et al. [18] measured the final distortion of a thin substrate using a laser 3-D scanner to validate a numerical simulation model. Afazov et al. [19] compared the final distortion deviation to a reference model after the fabrication of a blade. However, the residual stress and deformation are unevenly related to the stress and deformation during the LSF process due to the many factors influencing the formation of residual stress and deformation, such as the removed fixture, placed time, and machining processes. Therefore, the on-line measurement of actual stress and deformation evolution, especially its deformation behavior, is necessary to understand the LSF process. Some on-line monitoring systems had been developed to detect the dimensional change during the deposition process. Heralic et al. [20] used two cameras and a projected laser line to develop a monitoring system to detect the top contour of single-bead wall for on-line control of the top surface stability of a single-bead wall. Donadello et al. [21] developed a coaxial laser triangulation method to monitor the laser metal deposition height from the top surface of deposited layer, which can be used to feedback control the deposition height. However, these methods were not aimed at the deformation behavior during deposition process. There are few reports on the real-time deformation measurement during the laser deposition process. Michaleris et al. [22,23] built an on-line measurement apparatus to detect the cantilevered substrate distortion of the free end by a laser displacement sensor that can only reflect the real-time deformation of the specially designed substrate rather than that of the deposited structure. Xie et al. [24] and Biegler et al. [25] obtained the continuous full-field strain of thin-wall deposition using the Digital Image Correlation (DIC) method, but the device is complex and the subsequent image processing and analysis costly, which is not suitable for the process detection requiring rapid responses. In fact, many deposited structures can be used, as long as the dimensional accuracy of key positions meets the design requirements. However, the deformation of the formed key position is affected by the thermal cycle of the subsequent deposition, which may make the deformation of the position exceed the design requirements. Therefore, the understanding and control of deformation of the formed key position under the subsequent thermal cycle are of great engineering application value. Moreover, if only key positions need to be monitored and controlled, it will greatly reduce the technical difficulty. Thus, it has an important value to establish a simple, fast, stable, and reliable on-line deformation monitoring method for key positions.
In this study, by using a laser displacement detector based on laser triangulation principle, an accurate and effective on-line detection method was established to monitor the key position (the middle and end position) during the LSF of thin-wall structure, so the real-time deformation evolution of the key position on the thin wall deposited were investigated.
2. Materials and Methods
2.1. Experimental System
In this study, a non-contact real-time measuring device for the deformation of thin-wall sample during laser solid forming was established using a laser displacement sensor, LDS (laser displacement sensor) (LOD5-500W200) provided by LEAZE Ltd (Germany). The LSF experiment system consists of a 300W YAG pulsed laser (HANS PB300CE) provided by Han’s Laser (Guangdong, China), a self-assembled three-axis CNC (computerized numerical control) system, a glove box, a high precision powder feeder, and a coaxial nozzle (as shown in Figure 1a). Based on the laser triangulation method, which is an accepted high-precision distance measurement method, as shown in Figure 1b, the specific principle is: the detecting laser beam is projected to the measuring point on the thin-wall sample surface, and is diffusely reflected due to the rough surface of the sample, so a bright spot can be seen on the surface of the thin wall. The bright spot image is then captured by the linear image sensor in laser displacement detector, so there is a triangular relationship between the detecting laser, sample surface, and the linear image sensor, as shown in Figure 1b. The distance change between the laser and sample surface can be calculated. In the actual deposition process, when the sample deforms and the displacement d is generated at the measured point, the laser displacement sensor records the change on the line. The performance parameters of the sensor are tabulated in Table 1.
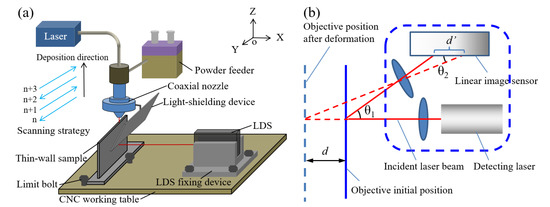
Figure 1.
Real time detection of deformation behavior during thin-wall sample deposition: (a) schematic diagram of detection system, (b) principle schematic of laser displacement sensor.

Table 1.
The performance parameters of the laser displacement detector.
As shown in Figure 1a, in the experiment, the substrate was firstly placed on one end of the working table, and the limit bolt was used to limit and clamp the substrate in order to ensure that it does not move or warp during the deposition process. A displacement sensor was placed at the other end of the working table. It was first installed in a fixed device, then installed on the workbench together with the fixed device via a limit bolt so that the sensor does not move relative to the workbench. In the experiment, the thin-wall sample was deposited parallel to the Y-direction, and the measurement beam was incident perpendicularly on the sample measurement surface (parallel to the X-direction). Sensors and computers were connected for data transmission and logging, and the data sampling frequency was set to every 0.5 s. The deformation in the positive direction of the X-axis was defined as a positive deformation. Therefore, the deformation at a specific position during the thin wall forming can be monitored in real time. During the experiment, the relative positions of the sample and sensor remain unchanged to ensure the consistency of the experimental conditions. The probe laser used in our study has a wavelength of 658 nm. Correspondingly, under the effect of the filter in the detector, the sensor can only capture the light with a 658 nm center wavelength to avoid the interference of other light. Since the laser melt pool radiation has a full band characteristic, in order to prevent radiation of the molten pool from interfering with the sensor, a light-shielding device, which is a metallic plate, as shown in Figure 1a, was installed to shelter the sensor from radiation. When the height of the deposited sample exceeds that of the light-shielding device, the light from the melt pool is completely blocked by the device, and monitoring began at this time. This method effectively prevents the melt pool from disturbing the measurement.
Before the experiment, accuracy calibration was performed using the method shown in Figure 2a. A calibration thin-wall sample perpendicular to the XOY-plane was fixed on the working table, the length direction of the thin-wall sample was parallel to the Y-direction of the working table via a limiting bolt, and a displacement detector was fixed outside the working table. The measurement beam emitted by the sensor was incident on the surface of the thin-wall sample (measurement plane) perpendicularly. In this study, the side surface of the thin wall toward the detector was used as the monitoring plane. When the distance between the thin wall and the detector H = 240 mm, it was considered as the initial distance for the calibration experiment. When the thin wall was moved ∆X along −X direction, the theoretical distance between the thin wall and the detector was H + ∆X (this can be considered as the position of the reference surface), but due to the measurement error δ of the detector, the distance displayed by the detector might be H + ∆X + δ. Therefore, the measurement deviation at different measurement distances can be obtained by subtracting the theoretical distance from the detected value. In addition, since the monitoring experiments were always performed on the similar surface of the thin wall, the measurement deviation caused by the surface status will be offset and can be ignored. The monitoring error distribution is shown in Figure 2b, and it can be seen that within the selected range (240–260 mm), the measurement error is basically within ± 10 μm, with only a few measurement errors appearing to drift. If the influence of error drift is neglected, the maximum relative error can be considered to be 10%, which confirms that the real-time monitoring of deformation using this monitoring system is feasible.
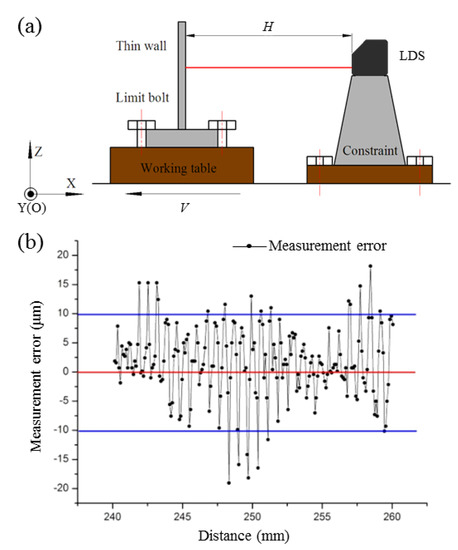
Figure 2.
Measurement accuracy calibration: (a) schematic of the calibration method, (b) the error distribution with working table stepping per 100 μm.
2.2. Materials
The powder of Ti-6Al-4V with particle sizes of 45–200 μm (the powder morphology is shown in Figure 3) was used for experiment, and its chemical composition is as follows: 6.15 wt% Al, 4.05 wt% V, 0.15 wt% O, 0.037 wt% H, 0.001 wt% N, 0.0178 wt% Si, 0.005 wt% C, 0.09 wt% Fe, and Ti balance. Ti-6Al-4V substrates with geometry dimension 140 mm × 50 mm × 6 mm were used, and the surface was polished and cleaned before experiment. For removing moistures, the powder was dried at 120 °C ± 10 °C for 2 h in a vacuum oven (DHG-9003), provided by Zuoke (Shanghai, China).
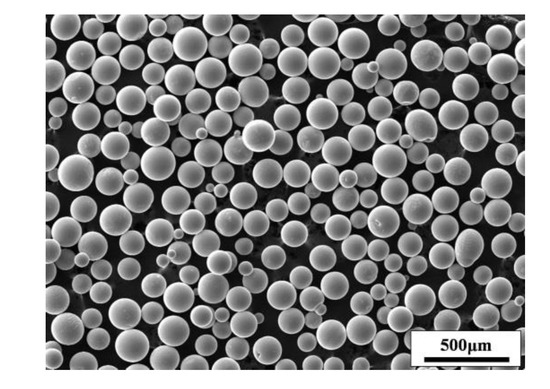
Figure 3.
SEM morphology of Ti-6Al-4V powder.
2.3. Deposition of Thin-wall Sample and Detection of Deformation
Ti-6Al-4V thin-wall sample is deposited by the pulse LSF technology. The specific process parameters are shown in Table 2. The scanning path used is a single-pass "back and forth" scanning strategy, as shown in Figure 1a. In the deposition experiments, the three-axis CNC unit was used to control the movement of working table along Y-axis and lift of Z-axis (build direction).
Table 2.
Processing parameters of low power pulse LSF process.
In order to understand the deformation behavior of the thin wall deposition, a series of thin-wall samples with a thickness of 1 mm was deposited using the process parameters in Table 2. The end and middle typical positions of the thin-wall samples were selected as the measurement points, and the real-time measurements of the deformation behavior at the measurement points were performed in the subsequent deposition process. Figure 4 is a schematic showing the deposited thin-wall samples with different sizes and the positions of the measuring points, where the red dot positions are the measuring points for the real-time deformation monitoring. The measurement points of the samples in Figure 4a–c are selected near the right end of the wall samples, 5 mm from the right end and 10 mm from the upper edge. In Figure 4d, the measuring point is selected in the middle position of the thin-wall sample with 10 mm from the upper edge. For laser additive manufacturing, the local thermal expansion is very small and less than the measurement accuracy of our method, so the effects of thermal transverse expansion on the deformation was not considered in this study.
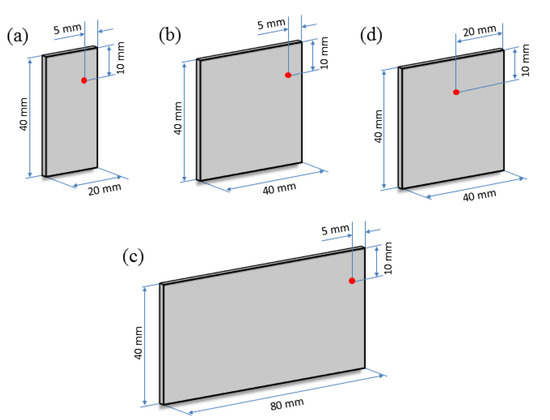
Figure 4.
Schematic of deposited thin-wall sample size and measured points position: (a) sample 1 (20 mm × 40 mm × 1 mm and measuring near the end), (b) sample 2 (40 mm × 40 mm × 1 mm and measuring near the end), (c) sample 3 (80 mm × 40 mm × 1 mm and measuring near the end), (d) sample 4 (40 mm × mm × 1 mm and measuring in the middle).
3. Results and Discussion
3.1. Effect of the Thin Wall Length on the Measurements
The real-time deformation monitoring of the measuring points (the right end of the wall samples) shown in Figure 4a–c was performed to record the deformation at the edges of different length thin-wall samples of different lengths. Figure 5 shows the deformation results at the monitoring points during the LSF on samples 1, 2, and 3. From Figure 5a, it can be seen that the end displacement of the 20-mm long sample continuously fluctuates during the forming process (grey area in Figure 5a), and the average displacement at the beginning stage slightly increases to ~20 μm as the fluctuation range from −15 to +30 μm. After the completion of the LSF process, the deposited thin wall is under the cooling stage, and the deformation gradually recovers, therefore, the displacement at the measuring point gradually decreases from +22 to 0 μm, and subsequently stabilizes. So, it can be declared that the final ends deformation of the 20 mm long thin wall is very small. Figure 5b shows the deformation characteristics at the measured end position when the adjacent layers are deposited under the "back and forth" scanning strategy. The blue lines connect the displacement values at the beginning and end of each layer, which reflects the average deformation of the end in each layer. It was found that the deformation directions of the measuring points at the odd layers and even layers are exactly the opposite, which is consistent with the alternative movement mode of the molten pool under "back and forth" scanning strategy. The thermal fields of the adjacent layers are significantly changed due to the back and forth scanning path. This will affect the formation and distribution of the stress, which results in the alternating deformation.
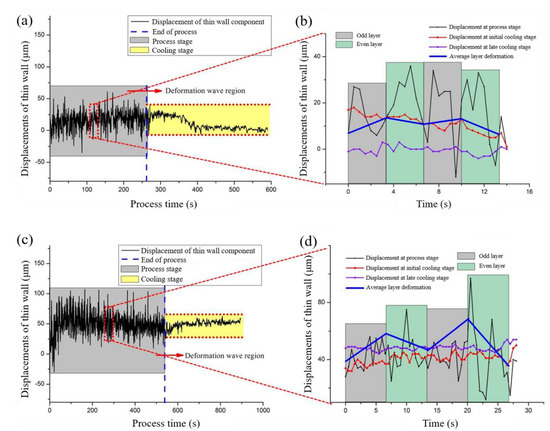
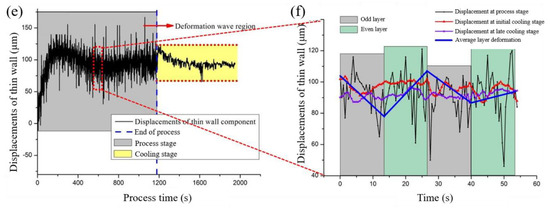
Figure 5.
Real time deformation monitoring of the measured edge points on thin-wall samples with different lengths of: (a,b) 20 mm, (c,d) 40 mm, and (e,f) 80 mm.
Figure 5c presents the real-time deformation monitoring of the end position of the 40-mm long thin-wall sample (shown in Figure 4b). It can be seen that in the initial stage, the average displacement of the end position increases rapidly from 0 to +60 μm, then the average displacement decreases slowly with the deposition process, and when the deposition was terminated, the average displacement decreases to +40 μm. During the cooling stage, the instantaneous average displacement of the end gradually changed from +33 to +50 μm, while the final deformation remained at +50 μm. From Figure 5e, the end displacement fluctuation of the 80-mm long thin-wall sample during the deposition can be found. The average displacement of the end position rapidly rises from 0 to +115 μm during the initial 200 s of deposition, then decrease slowly. When the deposition time is 600 s, the average displacement of the end decreases to +85 μm, and then slowly rises again to +95 μm at the deposition stop. During the cooling stage, the instantaneous displacement of the end of the thin-wall sample gradually decreased from +120 to +90 μm, and the final deformation remained at +90 μm. Figure 5d,f both confirm that the deformation directions of the end position at the odd layer and even layer are exactly the opposite, which is similar to that of the 20-mm long sample.
From the deformation measurement results of the end of different length thin-wall samples, it can be found that the end deformation direction of the thin-wall sample is the +X direction. The deformation during the deposition process and the final deformation of the end position of thin wall both significantly increase with increasing length of the thin-wall sample. The deformation of the end of the 20-mm long thin wall is very small. Compared to 40-mm long thin wall, the maximum deformation of the end position during 80-mm long thin-wall deposition increased by 91.7%, and the final deformation increased by 80%.
3.2. Comparison of Deformation Behaviors at the Middle and End of Thin-Wall Samples
In the above-mentioned studies, the positions of the measuring points were selected on the right edge of the thin-wall sample, which means that only the deformation of the edge of the thin-wall was examined. However, the stress states of the deposited sample in the middle region of the thin-wall differ from that of the edge, thus the deformation should also differ from that of the edge. In order to determine the difference between the deformations of the edge and middle of the thin-wall sample, the deformation of the measuring point shown in Figure 4d (middle of the deposited sample) was monitored in real time, and compared to the results of the measuring points in Figure 5c,d (edge of the deposited sample). Figure 6 shows the experimental measurement results of the deformation of the middle of sample 4. It can be seen from Figure 6a that the displacement fluctuation ranges at the middle of the thin-wall sample is between −60 and +30 μm, which is different from the position change of the edge of the thin-wall sample (Figure 5c). The displacement of the middle of the thin-wall sample is small overall, and the direction of change (along the −X direction) is opposite to the end displacement (along the X direction). During the cooling stage, the average displacement at the measurement point gradually changed from −25 to −30 μm, indicating that the deformation of the middle during cooling stage was significantly smaller than that of the edge at both ends, as well as the final retained deformation. It can also be seen in Figure 6b that the deformation law between the adjacent layers in the middle of the sample is different from that at the end, as the deformation trends of the adjacent two layers at the end are not necessarily opposite of each other.
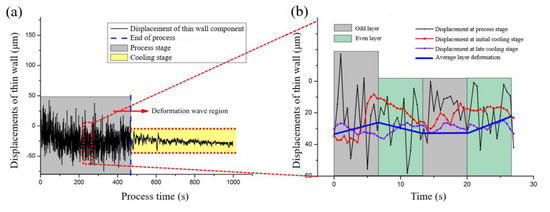
Figure 6.
Real time deformation monitoring of the measured middle points on thin-wall sample with the length of 40 mm. (a) deformation measurement results in the whole process; (b) deformation measurement results in deposition process of the adjacent layers
According to above discussion, it indicates that the developed detection method can quickly obtain deformation information in real time. The deformation information of the key position in the deposited part during the laser solid forming process was monitored. Based on the information, the feedback control strategy can be performed to ensure dimensional accuracy of the key position does not exceed design deviation range. When forming complex geometries, the method can be applied to multiple key positions to obtain overall real-time deformation and dimensional deviation of the formed part, and formulate optimized plan online.
3.3. Effect of Deformation Behavior after Pause Deposition on Accuracy
During the actual forming process, the laser generally undergoes short or long stops in each layer deposition, which allows the formed part to cool. From the experimental results, it can be surmised that the thin-wall sample will undergo different degrees of deformation during the cooling process, which affects its subsequent forming.
Figure 7 is a schematic showing the effect of the pause during thin-wall deposition on the dimensional accuracy of the sample. Figure 7a shows a single-pass "back and forth" deposition of the thin-wall sample under continuous forming conditions, which assumed that the average width of the deposited layer is W1 at this time. It is assumed that the deposition is paused after nth layer. If the sample is relatively stiff, the structure will not undergo significant deformation after the deposition paused (as shown in Figure 7b). However, the deposited layer loses heat after the laser-off, which results in lower substrate temperature. When the (n + 1)th layer is deposited, lower temperature decreases the size of the melt pool and narrow the width of the deposited layer to W2 (W2 < W1). If the stiffness of the thin-wall sample is poor, it will undergo a deformation of δ (as shown in Figure 7c) during the cooling stage after the deposition is paused, and the position of the deposited layer is deviated δ relative to the center line of the powder head when depositing the (n + 1)th layer. Therefore, under the conditions shown in Figure 7c, the accuracy of the thin-wall sample is not only affected by the size of the melt pool, it is also related to the deformation δ of the sample during the laser-off process.
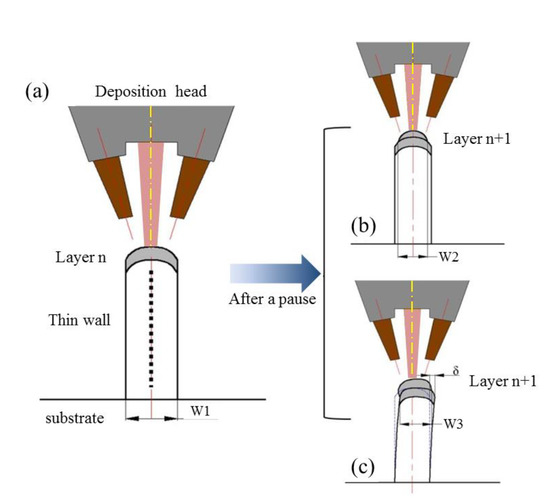
Figure 7.
Schematic of the effect of the pause during thin-wall deposition on the dimensional accuracy: (a) ideal deposition process of thin wall sample (b) continue deposition after a pause on thin wall with enough stiffness (c) continue deposition after a pause on thin wall with low stiffness.
In order to further elucidate the effect of the suspending forming (laser-off during the deposition) on the dimensional accuracy of the thin-wall sample, a novel experiment was designed to suspend the deposition after the thin-wall sample deposited to a certain height. In order to maximize the deformation of the thin wall, the thin wall is given a sufficient cooling time (>92 s), followed by subsequent forming, resulting in an observable degree of deformation at the suspended height, as shown in Figure 8a. The sample was sectioned in the most deformed area, as per the red dotted line in Figure 8a, and the 3-D topography of the front and back of the sample were detected using a laser confocal microscope. Figure 8b shows the scanning result of the 3-D topography of the front of the sample. The upper part of the thin wall, which was deposited after the pause, is significantly lower than the part deposited before the pause. The average height of the upper part is ~40 μm, and the lower part is ~100 μm, with a difference of ~60 μm. Figure 8c shows the scanning result of the 3-D topography of the reverse side of the sample. The average height of the lower part is ~40 μm, while that of upper part is ~100 μm, and the difference between the two is ~60 μm. From the above analysis, it can be confirmed that the suspension of the molding causes a displacement of ~60 μm. The analysis proves that the deformation of the middle part during the laser off and cooling stages will change the original basic position, which will create a misalignment between the subsequent deposition part and the part before the laser off, which affects the dimensional accuracy.
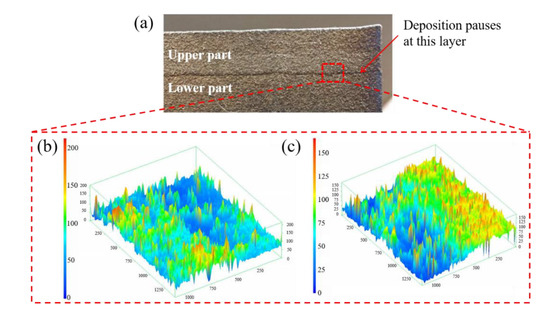
Figure 8.
Morphology of the deposited thin wall through deposition-pause-deposition: (a) deposited thin wall, (b) front surface scanning by laser confocal microscope and (c) reverse surface scanning by laser confocal microscope.
3.4. Monitoring of Cracking Behavior
In this work, the real-time deformation monitoring device was used to successfully capture the cracking moment during the thin-wall deposition process. As can be seen in Figure 9a, opening-type cracks with a length of ~30 mm are present in the deposited thin-wall sample, which is the result of the cracks formed during the forming process, and it continues to expand in the subsequent formation (the higher magnification of the crack is shown in Figure 9c). Figure 9b shows the real-time deformation curve at the measuring point of the Ti-6Al-4V thin-wall sample. It can be seen that the displacement value recorded by the sensor fluctuates significantly within 0–500 s, which was caused by the interference of the splashing around the melt pool in the initial stage on the actual monitoring process. In the subsequent monitoring within 500 ~ 1900 s, the monitoring process is stable due to the shielding effect of the shading device, and the displacement fluctuation range at the measuring point of the thin-wall sample is ~52 μm. Compared to the thickness of thin-wall sample (1 mm), it can be considered that the deformation of thin-wall sample at this stage does not exceed 3.5% of its own wall thickness. However, when the deposition progressed to 1923 s, the displacement of the measurement point suddenly changed from −6 to +52 μm, that is, the position of the thin-wall measurement point momentarily wobbled along the positive direction of X. After 1923 s, the variation range of the displacement at the measuring point of the thin-wall is within 25 μm, and the range of change becomes significantly smaller. Compared to the thin-wall sample with the thickness of 1 mm, it can be considered that the deformation of the thin-wall sample at this stage does not exceed 1.7% of its own wall thickness. Until 3500 s, the deposition is completed and the cooling stage begins. The displacement changes at the measuring point of the thin-wall stabilizes.
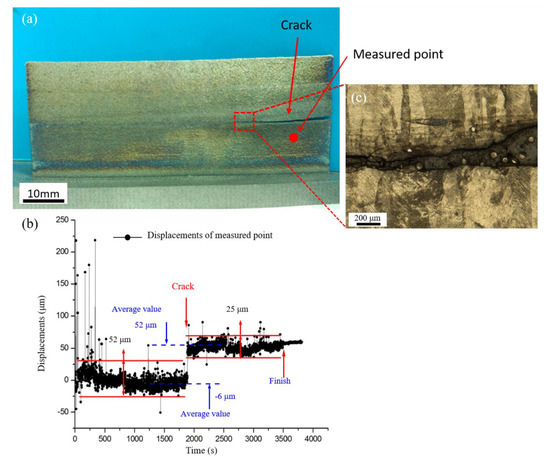
Figure 9.
Monitor of the thin-wall sample deposition process with cracking: (a) the thin-wall sample deposited with cracking, (b) the real-time deformation curve at the measuring point during the deposition of the Ti-6Al-4V thin-wall sample, (c) observation of cracking position.
According to the monitoring results, it can be seen that for a continuous deposition process, the deformation behavior of the deposited thin-wall sample should be continuous, and the sudden change in the displacement of the thin-wall sample at ~1923 s must be caused by factors inducing discontinuity of deformation. It was confirmed that the severe cracks occurred above the measuring points, and it can be surmised that during the thin-wall deposition process, as the internal stress accumulates, cracks are initiated. Microscopic observation of the cracked part of the sample is shown in Figure 9c, and it can be seen that there are unfused powder particles at the cracked place, indicating that the bonding strength is weaker in this area, making it fragile under increased stress conditions. This also confirms that the non-contact real-time deformation-monitoring device of the key parts developed in this research can be used to effectively monitor the occurrence of cracks.
4. Conclusions
In this study, by using a laser displacement detector based on laser triangulation principle, a simple and effective real-time detection method was established to on-line monitor the real-time deformation behavior of the key position (the middle and end position) during the LSF of thin-wall structure. It is concluded that:
(1) For the thin-wall deposition, with increasing thin wall length, the deformation of the edge positions on both sides of the thin-wall sample during deposition process significantly increases, and the final residual deformation of the edges after deposition stop also increases.
During the deposition stage, the fluctuation range and average displacement in the middle of thin wall are both smaller than that of the position near the end, and the whole displacement change direction in the middle is opposite to that of the end. In the cooling stage, the regression deformation and the final retained deformation in the middle of thin-wall sample are both significantly less than that of the end. Moreover, the deformation directions near the end of thin wall in two adjacent layers are exactly opposite, which is consistent with the reciprocating scanning path, but not in the middle of the thin wall.
(2) The pause of the deposition process will significantly affect the forming accuracy of a thin-walled structure. As the deposition process pauses for a certain time, the deformation of thin wall during the cooling stage will make the position of the deposited thin wall deviate from the theoretical deposition point. When the subsequent depositions are performed, the dislocation between the subsequent deposited part and that before the deposition process pause will form, thus affecting the dimensional accuracy of the thin-wall sample. It also demonstrates the ability to detect the occurrence of cracking in the LSF process. When a small displacement of more than ten microns caused by the crack, it will be detected.
(3) It indicates that the developed detection method can quickly obtain the deformation information of deposited thin wall in real time, which was not realized by the reported approach. Due to its advantages of being simple, fast, stable, and reliable, it has a potential to be used for the online fault alarm and feedback control of the dimensional accuracy at a key position of deposited structure.
Author Contributions
Methodology, H.T.; formal analysis, H.T., Y.C., Z.F., W.H., and W.F.; investigation, Y.C., Z.F., W.H., and W.F.; writing—original draft preparation, H.T. and W.H.; writing—review and editing, H.T., Y.C., and X.L.; All authors have read and agreed to the published version of the manuscript.
Funding
This research was funded by the National Key Research and Development Program of China, grant number 2018YFB1106302 and the National Natural Science Foundation of China, grant number 51475380.
Conflicts of Interest
The authors declare no conflicts of interest.
References
- Yu, J.; Rombouts, M.; Maes, G. Cracking behavior and mechanical properties of austenitic stainless steel parts produced by laser metal deposition. Mater. Des. 2013, 45, 228–235. [Google Scholar] [CrossRef]
- Roberts, I.A.; Wang, C.J.; Esterlein, R.; Stanford, M.; Mynors, D.J. A three-Dimensional finite element analysis of the temperature field during laser melting of metal powders in additive layer manufacturing. Int. J. Mach. Tools Manuf. 2009, 49, 916–923. [Google Scholar] [CrossRef]
- Polanski, M.; Kwiatkowska, M.; Kunce, I.; Bystrzycki, J. Combinatorial synthesis of alloy libraries with a progressive composition gradient using laser engineered net shaping (LENS): Hydrogen storage alloys. Int. J. Hydrog. Energy 2013, 38, 12159–12171. [Google Scholar] [CrossRef]
- Liu, J.C.; Li, L.J. Effects of process variables on laser direct formation of thin wall. Opt. Laser Technol. 2007, 39, 231–236. [Google Scholar] [CrossRef]
- Toyserkani, E.; Khajepour, A.; Corbin, S. 3-D finite element modeling of laser cladding by powder injection: Effects of laser pulse shaping on the process. Opt. Laser Eng. 2004, 41, 849–867. [Google Scholar] [CrossRef]
- Hao, M.Z.; Sun, Y.W. A FEM model for simulating temperature field in coaxial laser cladding of TI6AL4V alloy using an inverse modeling approach. Int. J. Heat Mass Tranf. 2013, 64, 352–360. [Google Scholar] [CrossRef]
- Frazier, W.E. Metal additive manufacturing: A review. J. Mater. Eng. Perform. 2014, 23, 1917–1928. [Google Scholar] [CrossRef]
- Lewandowski, J.J.; Seifi, M. Metal Additive Manufacturing: A Review of Mechanical Properties. Annu. Rev. Mater. Res. 2016, 46, 151–186. [Google Scholar] [CrossRef]
- Vilar, R.; Almeida, A. Repair and manufacturing of single crystal Ni-based superalloys components by laser powder deposition-A review. J. Laser Appl. 2015, 27, S17004. [Google Scholar] [CrossRef]
- Li, W.; Karnati, S.; Kriewall, C.; Liou, F.; Newkirk, J.; Taminger, K.M.B.; Seufzer, W.J. Fabrication and characterization of a functionally graded material from Ti-6Al-4V to SS316 by laser metal deposition. Addit. Manuf. 2017, 14, 95–104. [Google Scholar] [CrossRef]
- Bobbio, L.D.; Otis, R.A.; Borgonia, J.P.; Dillon, R.P.; Shapiro, A.A.; Liu, Z.K.; Beese, A.M. Additive manufacturing of a functionally graded material from Ti-6Al-4V to Invar: Experimental characterization and thermodynamic calculations. Acta Mater. 2017, 127, 133–142. [Google Scholar] [CrossRef]
- Pouzet, S.; Peyre, P.; Gorny, C.; Castelnau, O.; Baudin, T.; Brisset, F.; Colin, C.; Gadaud, P. Additive layer manufacturing of titanium matrix composites using the direct metal deposition laser process. Mater. Sci. Eng. A 2016, 677, 171–181. [Google Scholar] [CrossRef]
- Ochonogor, O.F.; Meacock, C.; Abdulwahab, M.; Pityana, S.; Popoola, A.P.I. Effects of Ti and TiC ceramic powder on laser-Cladded Ti-6Al-4V in situ intermetallic composite. Appl. Surf. Sci. 2012, 263, 591–596. [Google Scholar] [CrossRef]
- Gharbi, M.; Peyre, P.; Gorny, C.; Carin, M.; Morville, S.; Le Masson, P.; Carron, D.; Fabbro, R. Influence of various process conditions on surface finishes induced by the direct metal deposition laser technique on a Ti-6Al-4V alloy. J. Mater. Process. Technol. 2013, 213, 791–800. [Google Scholar] [CrossRef]
- Sui, S.; Tan, H.; Chen, J.; Zhong, C.; Li, Z.; Fan, W.; Gasser, A.; Huang, W. The influence of Laves phases on the room temperature tensile properties of Inconel 718 fabricated by powder feeding laser additive manufacturing. Acta Mater. 2019, 164, 413–427. [Google Scholar] [CrossRef]
- Carroll, B.E.; Palmer, T.A.; Beese, A.M. Anisotropic tensile behavior of Ti-6Al-4V components fabricated with directed energy deposition additive manufacturing. Acta Mater. 2015, 87, 309–320. [Google Scholar] [CrossRef]
- Chew, Y.; Pang, J.H.L.; Bi, G.; Song, B. Thermo-Mechanical model for simulating laser cladding induced residual stresses with single and multiple clad beads. J. Mater. Process. Technol. 2015, 224, 89–101. [Google Scholar] [CrossRef]
- Yang, Q.C.; Zhang, P.; Cheng, L.; Min, Z.; Chyu, M.; To, A.C. Finite element modeling and validation of thermomechanical behavior of Ti-6Al-4V in directed energy deposition additive manufacturing. Addit. Manuf. 2016, 12, 169–177. [Google Scholar] [CrossRef]
- Afazov, S.; Denmark, W.A.D.; Toralles, B.L.; Holloway, A.; Yaghi, A. Distortion prediction and compensation in selective laser melting. Addit. Manuf. 2017, 17, 15–22. [Google Scholar] [CrossRef]
- Heralić, A.; Christiansson, A.-K.; Ottosson, M.; Lennartson, B. Increased stability in laser metal wire deposition through feedback from optical measurements. Opt. Laser. Eng. 2010, 48, 478–485. [Google Scholar] [CrossRef]
- Donadello, S.; Motta, M.; Demir, A.G.; Previtali, B. Monitoring of laser metal deposition height by means of coaxial laser triangulation. Opt. Laser Eng. 2019, 112, 136–144. [Google Scholar] [CrossRef]
- Denlinger, E.R.; Heigel, J.C.; Michaleris, P.; Palmer, T.A. Effect of inter-Layer dwell time on distortion and residual stress in additive manufacturing of titanium and nickel alloys. J. Mater. Process. Technol. 2015, 215, 123–131. [Google Scholar] [CrossRef]
- Heigel, J.C.; Michaleris, P.; Palmer, T.A. In situ monitoring and characterization of distortion during laser cladding of Inconel (R) 625. J. Mater. Process. Technol. 2015, 220, 135–145. [Google Scholar] [CrossRef]
- Xie, R.S.; Zhao, Y.; Chen, G.Q.; Lin, X.; Zhang, S.; Fan, S.R.; Shi, Q.Y. The full-Field strain distribution and the evolution behavior during additive manufacturing through in-Situ observation. Mater. Des. 2018, 150, 49–54. [Google Scholar] [CrossRef]
- Biegler, M.; Graf, B.; Rethmeier, M. In-situ distortions in LMD additive manufacturing walls can be measured with digital image correlation and predicted using numerical simulations. Addit. Manuf. 2018, 20, 101–110. [Google Scholar] [CrossRef]


© 2020 by the authors. Licensee MDPI, Basel, Switzerland. This article is an open access article distributed under the terms and conditions of the Creative Commons Attribution (CC BY) license (http://creativecommons.org/licenses/by/4.0/).