Article

Comparative Study of Hot Deformation Behavior and Microstructure Evolution of As-Cast and Extruded WE43 Magnesium Alloy

1
Guangdong-Hong Kong Joint Research and Development Center on Advanced Manufacturing Technology for Light Alloys; Guangdong Key Laboratory for Technology and Application of Metal Toughening, Guangdong Institute of Materials and Processing, Guangzhou 510650, China
2
College of Materials Science and Engineering, Chongqing University, Chongqing 400045, China
3
Hong Kong Institute for Advanced Study; Department of Materials Science and Engineering, City University of Hong Kong, Hong Kong 999077, China
4
Guangdong Xingfa Aluminium Co. Ltd., Foshan 528000, China
*
Author to whom correspondence should be addressed.
Metals 2020, 10(4), 429; https://doi.org/10.3390/met10040429
Submission received: 18 February 2020 / Revised: 18 March 2020 / Accepted: 24 March 2020 / Published: 25 March 2020

Abstract

:
Under compressive testing at 400 °C and a strain rate range of 0.05–5 s−1, the hot deformation behavior and microstructure evolution of an as-cast (AC), as-extruded (with a bimodal grain structure (named as Ex-1) or a relatively uniform fine grain structure (Ex-2)) WE43 alloy have been investigated and compared. The results indicate that the AC sample exhibits the highest peak stress, while the Ex-2 sample has the lowest value. Within the AC material, fine grains were firstly formed along the pancake-like deformed grains (as a necklace structure). The necklace structure was also formed within the Ex-1 and Ex-2 materials at high strain rates of 0.5 and 5 s−1. However, a lamellar structure that the coarse elongated grains divided by parallel boundaries was formed within the Ex-1 material. A relatively more homogeneous fine grain structure is achieved after a true strain of 1.0 within the Ex-2 material at a low strain rate of 0.05 s−1. In addition, a discontinuous dynamic recrystallization mechanism by grain boundary bulging is found to occur. After a true strain of 1.2, a (0001) fiber texture, a typical rare earth (RE) texture, and a relatively random texture are formed within the AC, Ex-1, and Ex-2 WE43 alloy material, respectively.

1. Introduction

WE43 magnesium alloy offers an excellent performance of a good casting ability, high strength-to-weight ratio, creep resistance, ignition resistance and superior damping characteristics, which has been widely used in the automotive and aircraft industries [1,2,3,4]. Although it is originally developed as a casting alloy, the WE43 alloy has been developed as a wrought alloy in order to expand its application in the wrought form. There are studies, especially those published recently, dedicated to the mechanical processing of the WE43 alloy, such as extrusion, rolling, and forging [5,6,7,8,9,10,11,12]. As with most conventional Mg alloys, the WE43 alloy has poor workability at room temperature due to its hexagonal close packed (HCP) lattice structure and has to be processed at elevated temperatures to increase the workability [13,14,15,16]. The term of “workability” refers to the ease with which a material can be shaped by plastic flow without the onset of fracture. The workability is not only sensitive to the processing conditions (including deformation temperature, strain rate, strain) but also to the initial microstructure [17]. In order to identify the processing conditions (namely temperature-strain rate window) for hot working, the processing-map (PM) technique has been widely used [17]. It also helps in avoiding the regimes of flow instabilities (e.g., adiabatic shear bands or flow localization), which could lead to a material fracture. The initial microstructure of the starting material in as-cast, homogenized, or extruded conditions could exert a significant effect on the hot workability. It is indicated that a homogenization treatment of as-cast AZ31 alloy or a hot extrusion of as-cast TX31 alloy is beneficial in improving their hot workability [18,19].
As to the WE43 alloy, Jahedi et al. [15] has studied the processing conditions of an as-cast alloy under compressive deformation. It indicated that the as-cast WE43 alloy exhibited relatively high deformation strains (> 1.0 true strain) without fracturing at elevated temperature of 400 °C with a strain rate of up to 10 s−1 or low temperatures with sufficiently low strain rates (e.g., 275 °C and 0.01 s−1, 300 °C and 0. 1 s−1, 350 °C and 1 s−1). For an as-cast and homogenized WE54 alloy (similar to the WE43 alloy), Tang et al. [20] have established a PM at temperature range of 300–500 °C and a strain rate range of 0.001–1 s−1. The PM exhibits a dynamic recrystallization (DRX) domain in the temperature range 450–500 °C and a strain rate of about 0.01s−1, i.e., the optimum processing condition. Wang et al. [14] has studied the hot workability of an as-extruded WE43 alloy with fully fine DRXed grains by PM. Two DRX domains have been identified for hot working (i.e., a temperature range of 350–400 °C with a strain rate range of 0.001–0.1 s−1 and a temperature range of 400–475 °C with a strain rate range of 0.01–0.3 s−1). Avadhani et al. [21] have further studied the PM of a homogenized WE43 alloy in as-extruded condition. It is shown that the WE43 alloy has good workability from 350 to 550 °C at a strain rate of 0.001 to 0.2 s−1. From the above previous studies, the processing conditions for the WE43 alloy with various initial microstructures in as-cast, homogenized, or extruded conditions have been investigated. It can be concluded that a homogenization treatment or a hot extrusion of as-cast WE43 alloy could enhance its hot workability. However, a comparison of their hot deformation behaviors and microstructure evolutions in a one study could be meaningful in designing the optimum processing route to control the final microstructure and mechanical properties of the wrought WE43 alloy. In particular, two typical different initial microstructures of a bimodal grain structure and a fully fine grain structure could be formed during hot extrusion process. However, the effect of the bimodal grain structure of as-extruded WE43 alloy on the hot deformation behavior has not been studied according to our best knowledge.
Therefore, a comparative study of the hot deformation behavior and microstructure evolution, including the texture of the WE43 alloy in as-cast and two as-extruded (i.e., obtaining a bimodal grain structure or a fully fine grain structure) conditions under hot compressive deformation has been conducted. An optimum hot compressive temperature of 400 °C with a strain rate range of 0.05–5.0 s−1 has been selected according to the above previous studies of the processing conditions of the WE43 alloy.

2. Materials and Methods

The as-cast (AC) and two as-extruded (Ex) WE43 alloys with a chemical composition of Mg-3.78Y-2.05Nd-1.15Gd-0.56Zr (in wt%) have been studied. The AC material was fabricated by semi-continuous direct-chill casting (DC). The two Ex bars with a partially DRXed bimodal grain structure or a fully DRXed fine grain structure have been produced by the hot extrusion process using the homogenized DC casting bars (at 525 °C for 8 hours) at 400 °C with an extrusion ratio of 10 or 20 and are assigned as Ex-1 and Ex-2, respectively.
Cylindrical AC and Ex-1 and Ex-2 specimens with a dimension of Φ10 × 12 mm were prepared by machining from their corresponding bars along the casting or extruding direction for hot compression testing. Isothermal uniaxial compression testing was carried out on a Gleeble-3500 thermo-simulation machine at a constant temperature of 400 °C. Various strain rates of 0.05, 0.5, and 5 s−1 were operated with a true strain of 1.0 and various true strains of 0.2, 0.4, 0.8, and 1.2 were performed at a strain rate of 0.05 s−1. At different strain rates, three specimens were tested for every strain rate in order to achieve a typical true stress–strain curve and a reliable peak stress (σp) and strain (εp), while at different true strains one specimen was tested for each true strain for the observation of microstructure evolution during the hot compression. Graphite foils were used for lubrication between the ends of the specimen and platens to minimize the effect of friction on deformation. A thermocouple was welded at the mid-height of the specimen surface for temperature measurement and control. The specimen was resistance-heated to the preset temperature of 400 °C at a rate of 10 °C/s and held at this temperature for 3 min to ensure temperature uniformity. All specimens were compressed along the casting or extrusion direction and quenched in water immediately after testing.
The initial microstructures of the AC, Ex-1, and Ex-2 specimens along the centerline in the casting or extrusion direction and transversal direction were examined by optical microscopy (OM, Leica DMI3000M) and a scanning electron microscope (SEM, NANOSEM430) after a standard metallographic preparation. A nitric-acid-based etchant of 4 vol. % HNO3 in ethanol was used for the grain structure examination. After compression testing, the deformed specimens were sectioned longitudinally along the centerline in the compression direction and one of the cut-surface was hot-mounted in an epoxy resin matrix. By using a standard metallographic preparation, the deformed microstructures were also examined by OM and SEM. It was etched for 20–30 s by a picric-acid-based etchant of 10 g picric acid, 25 ml acetic, 25 ml distilled water, and 200 ml ethanol for the grain structure examination. The grain size was measured by the line intercept method. In order to identify the texture evolution and DRX mechanism, electron backscattering diffraction (EBSD) tests were performed for the initial and selected hot compressed specimens. The EBSD tests were conducted on a Hitachi S-3400N SEM equipped with a HKL-EBSD system, which was operated at 20 kV. The specimens were grounded by using SiC papers from 400 grit to 3000 grit and electro polished in a solution of 10 vol.% HClO4 acid and 90 vol.% ethanol at a direct voltage of 15 V and a temperature of −30 °C for 30 s. For orientation mapping, a relatively large scan step size of 1–3 μm for the initial specimens and a small of 0.12 μm for the deformed specimens were used. The EBSD data were acquired and analyzed using HKL Channel 5 software (HKL Technology, Denmark). A noise reduction procedure was applied for all of the data analysis. It is worth noting that the cleaning up procedure has a negligible effect on the orientation measurement of the grain crystal.

3. Results and Discussion

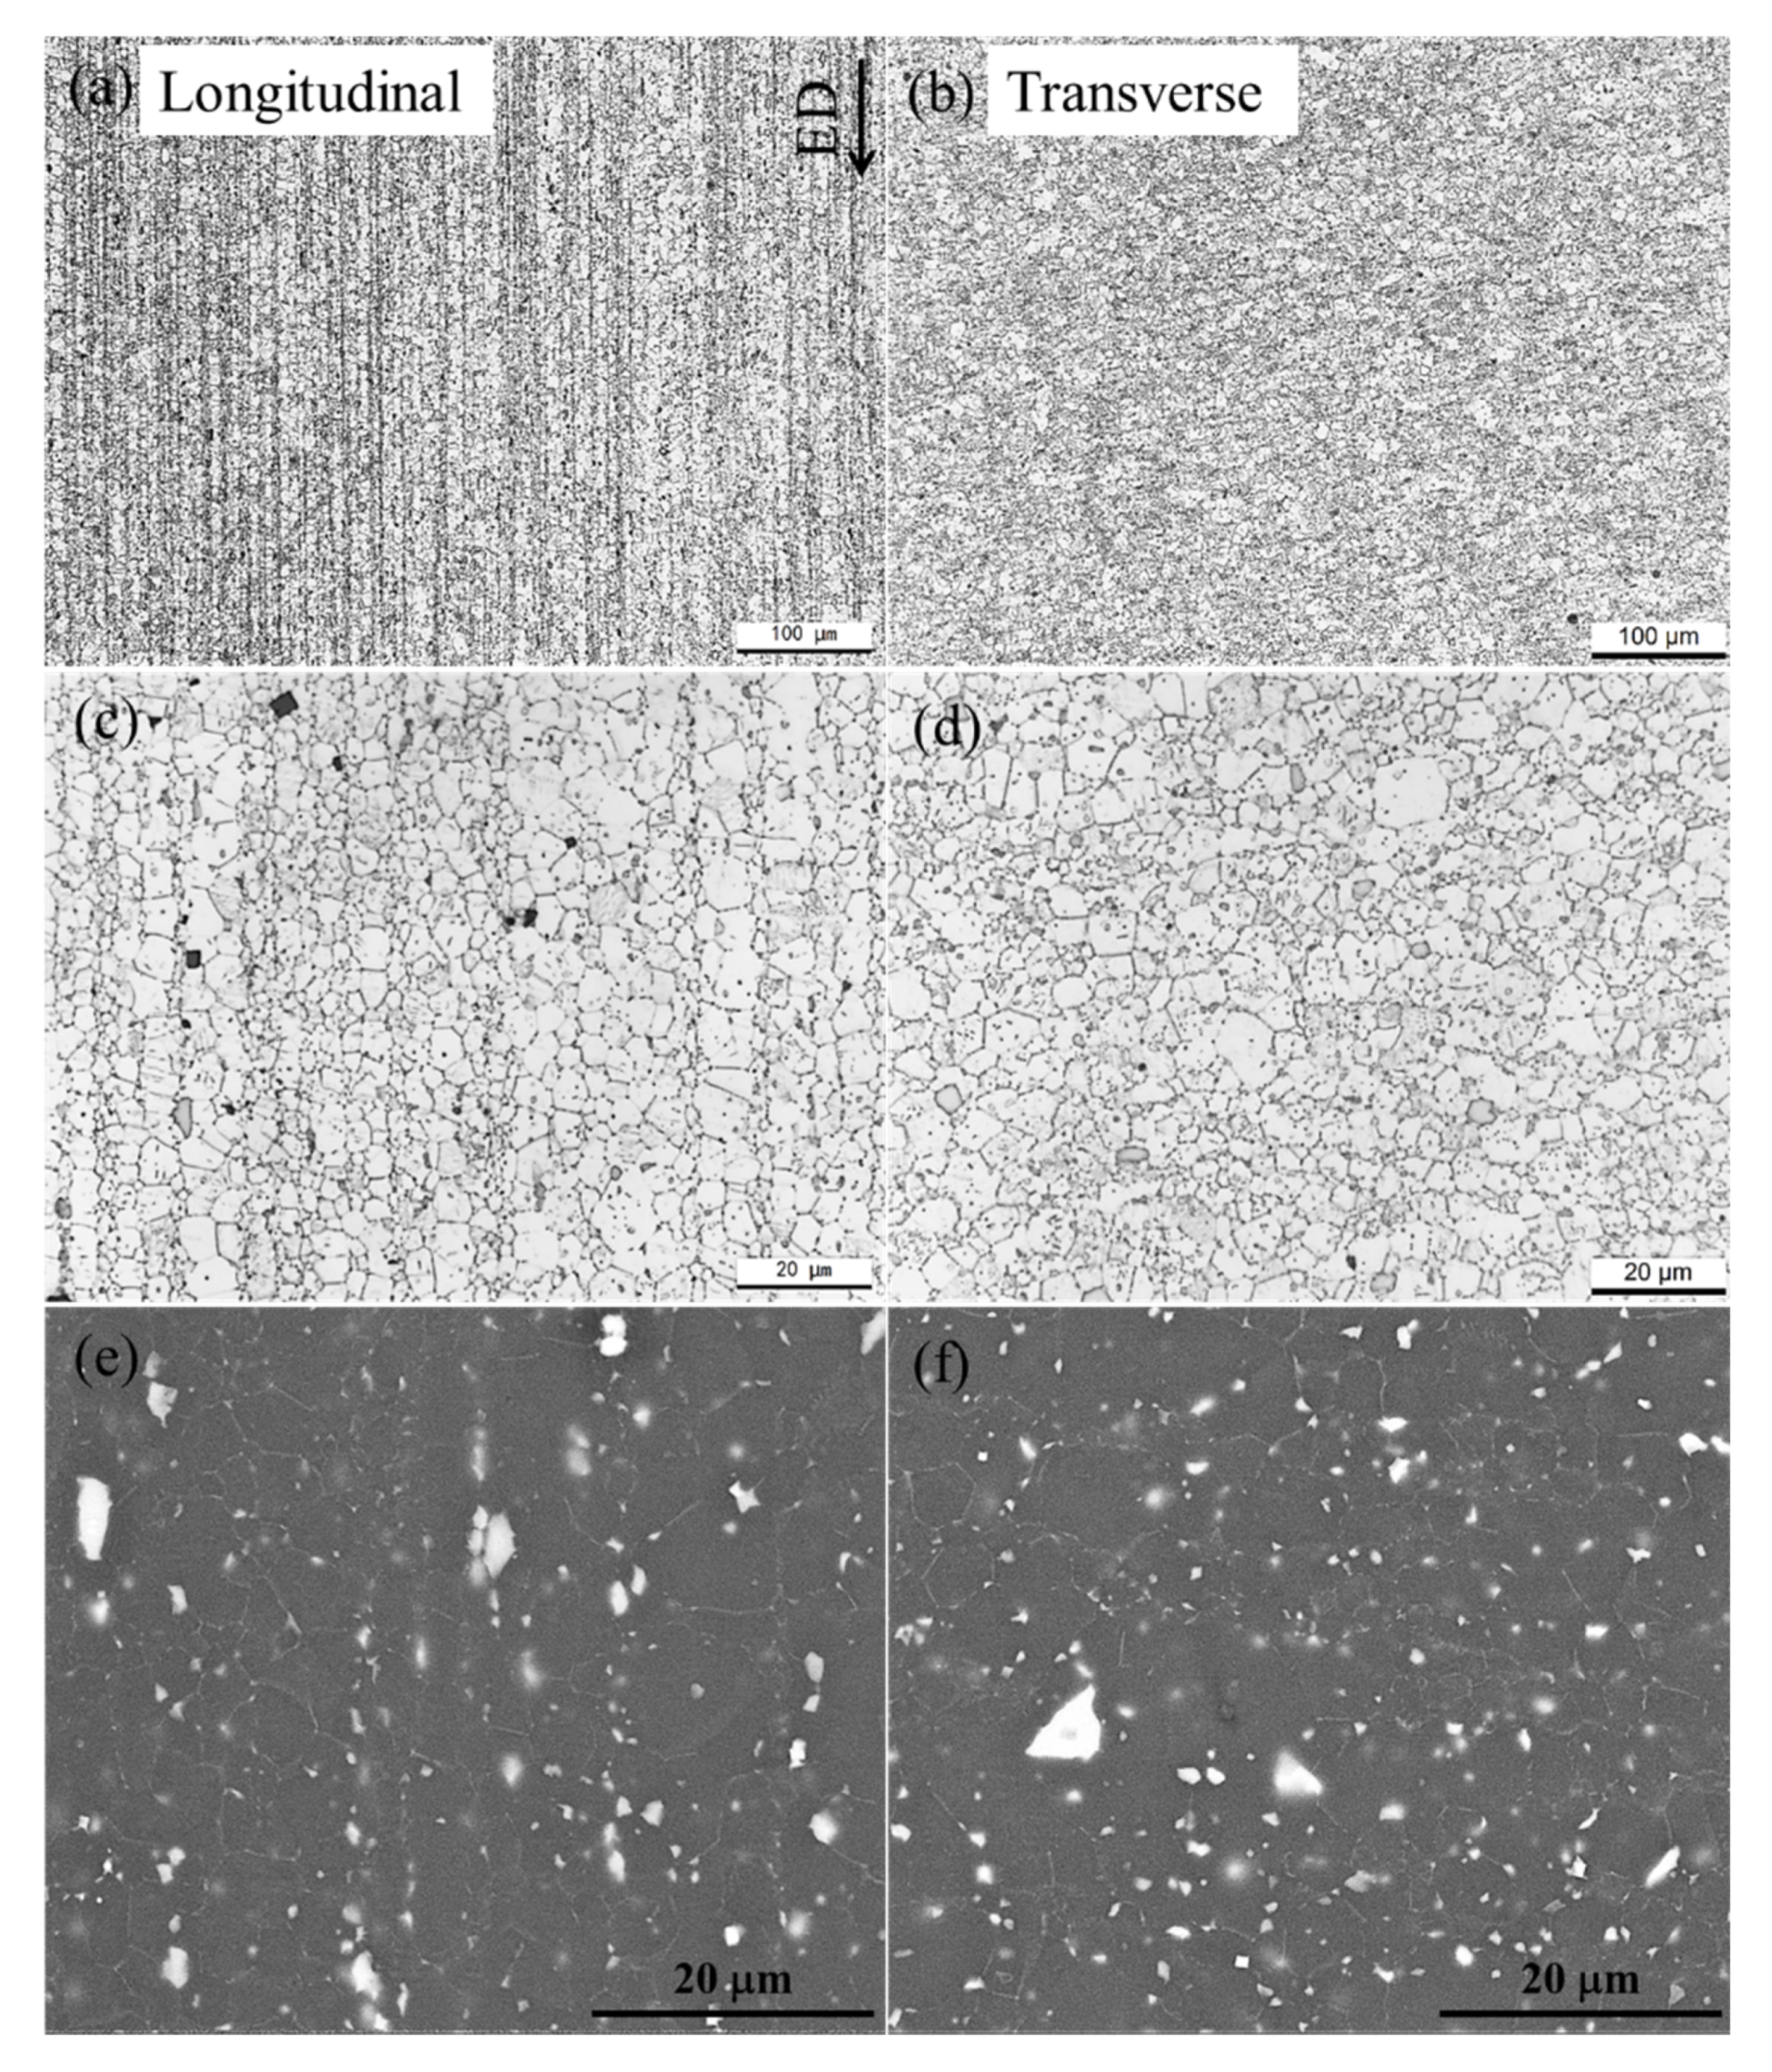
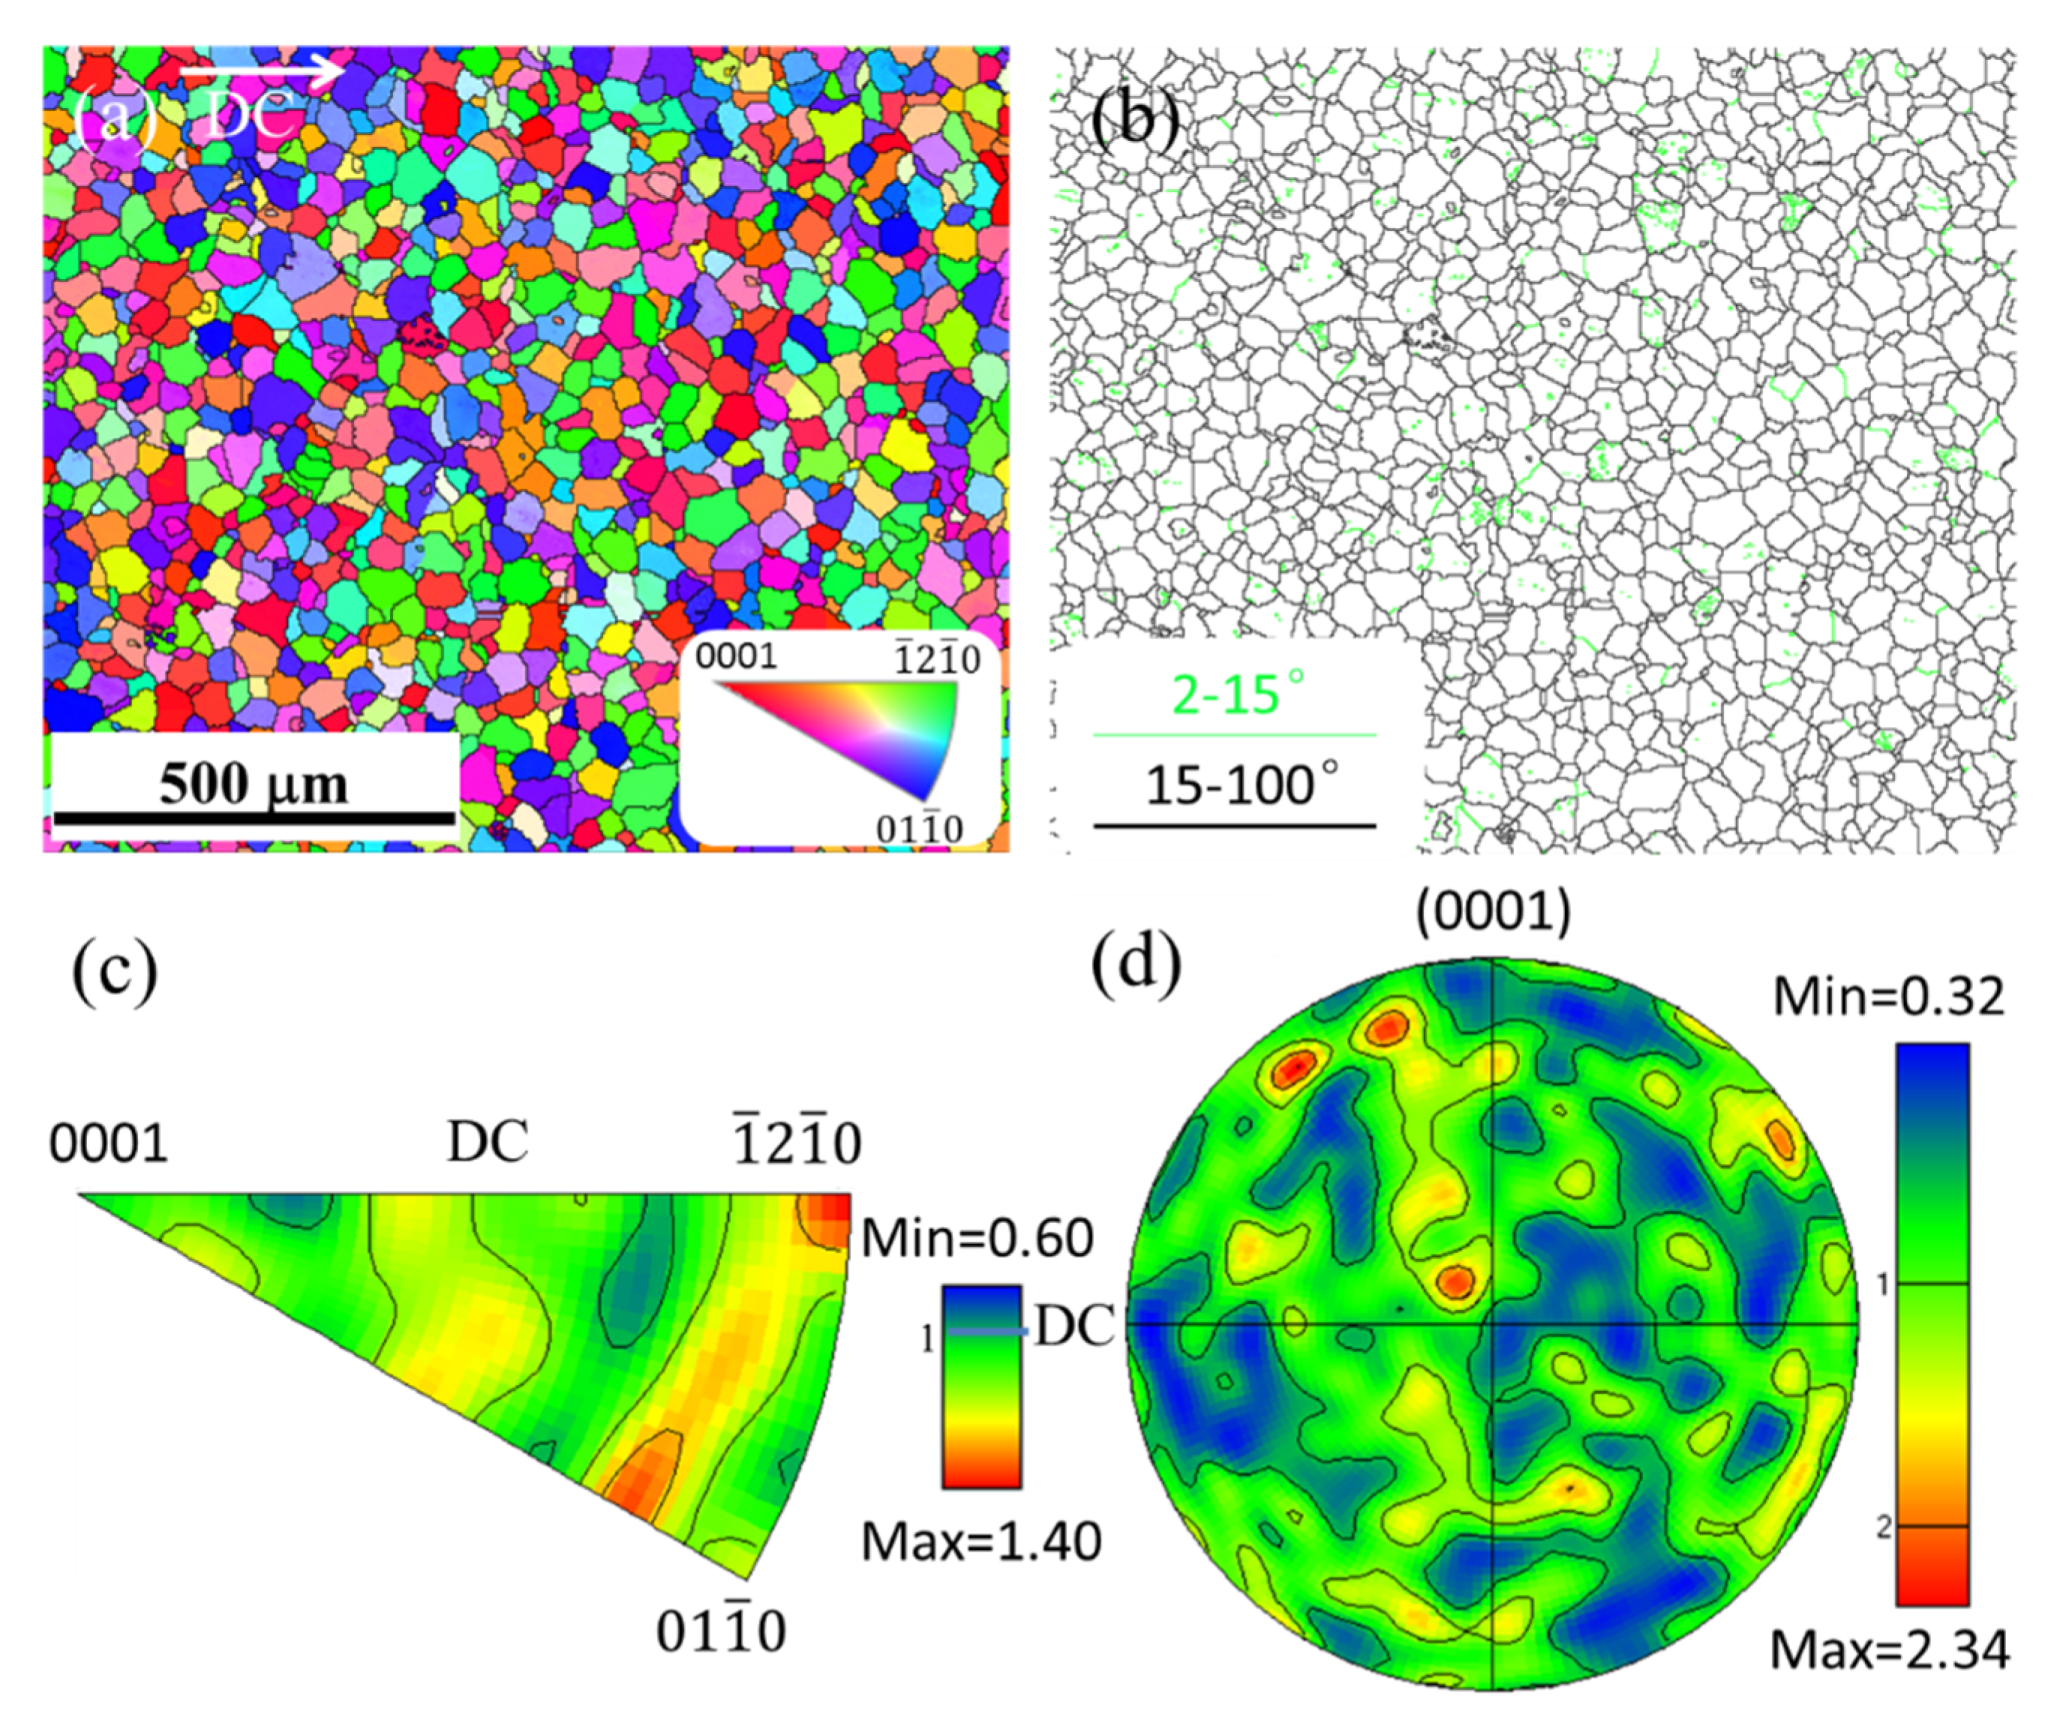
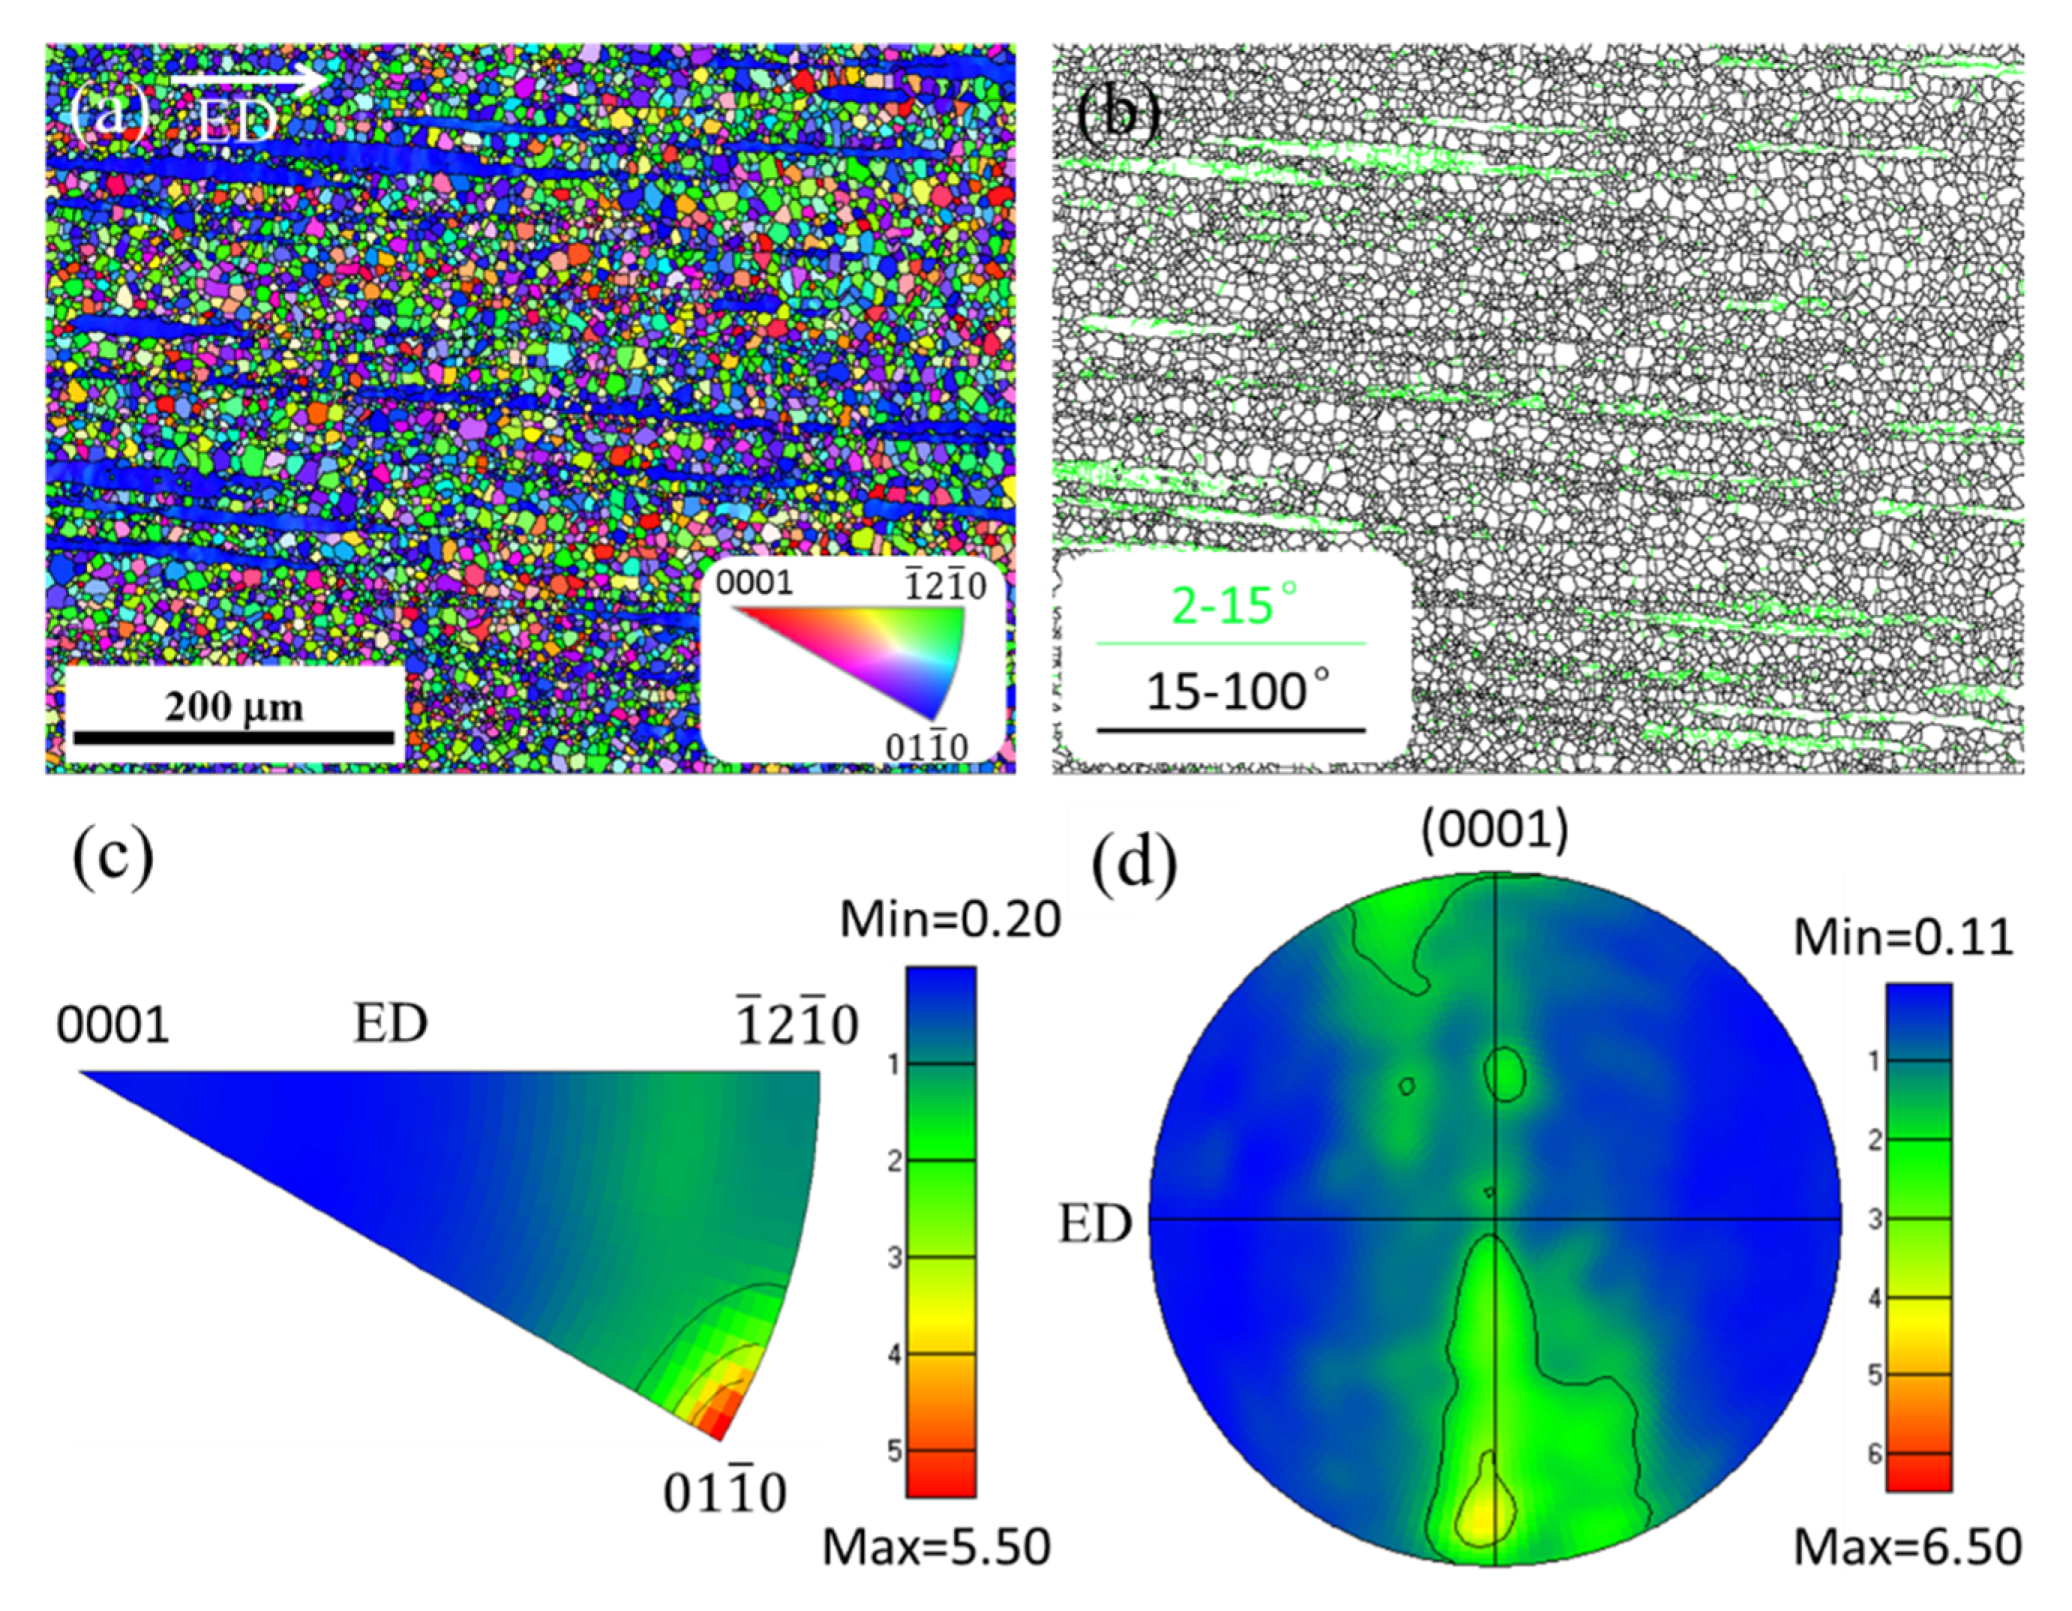
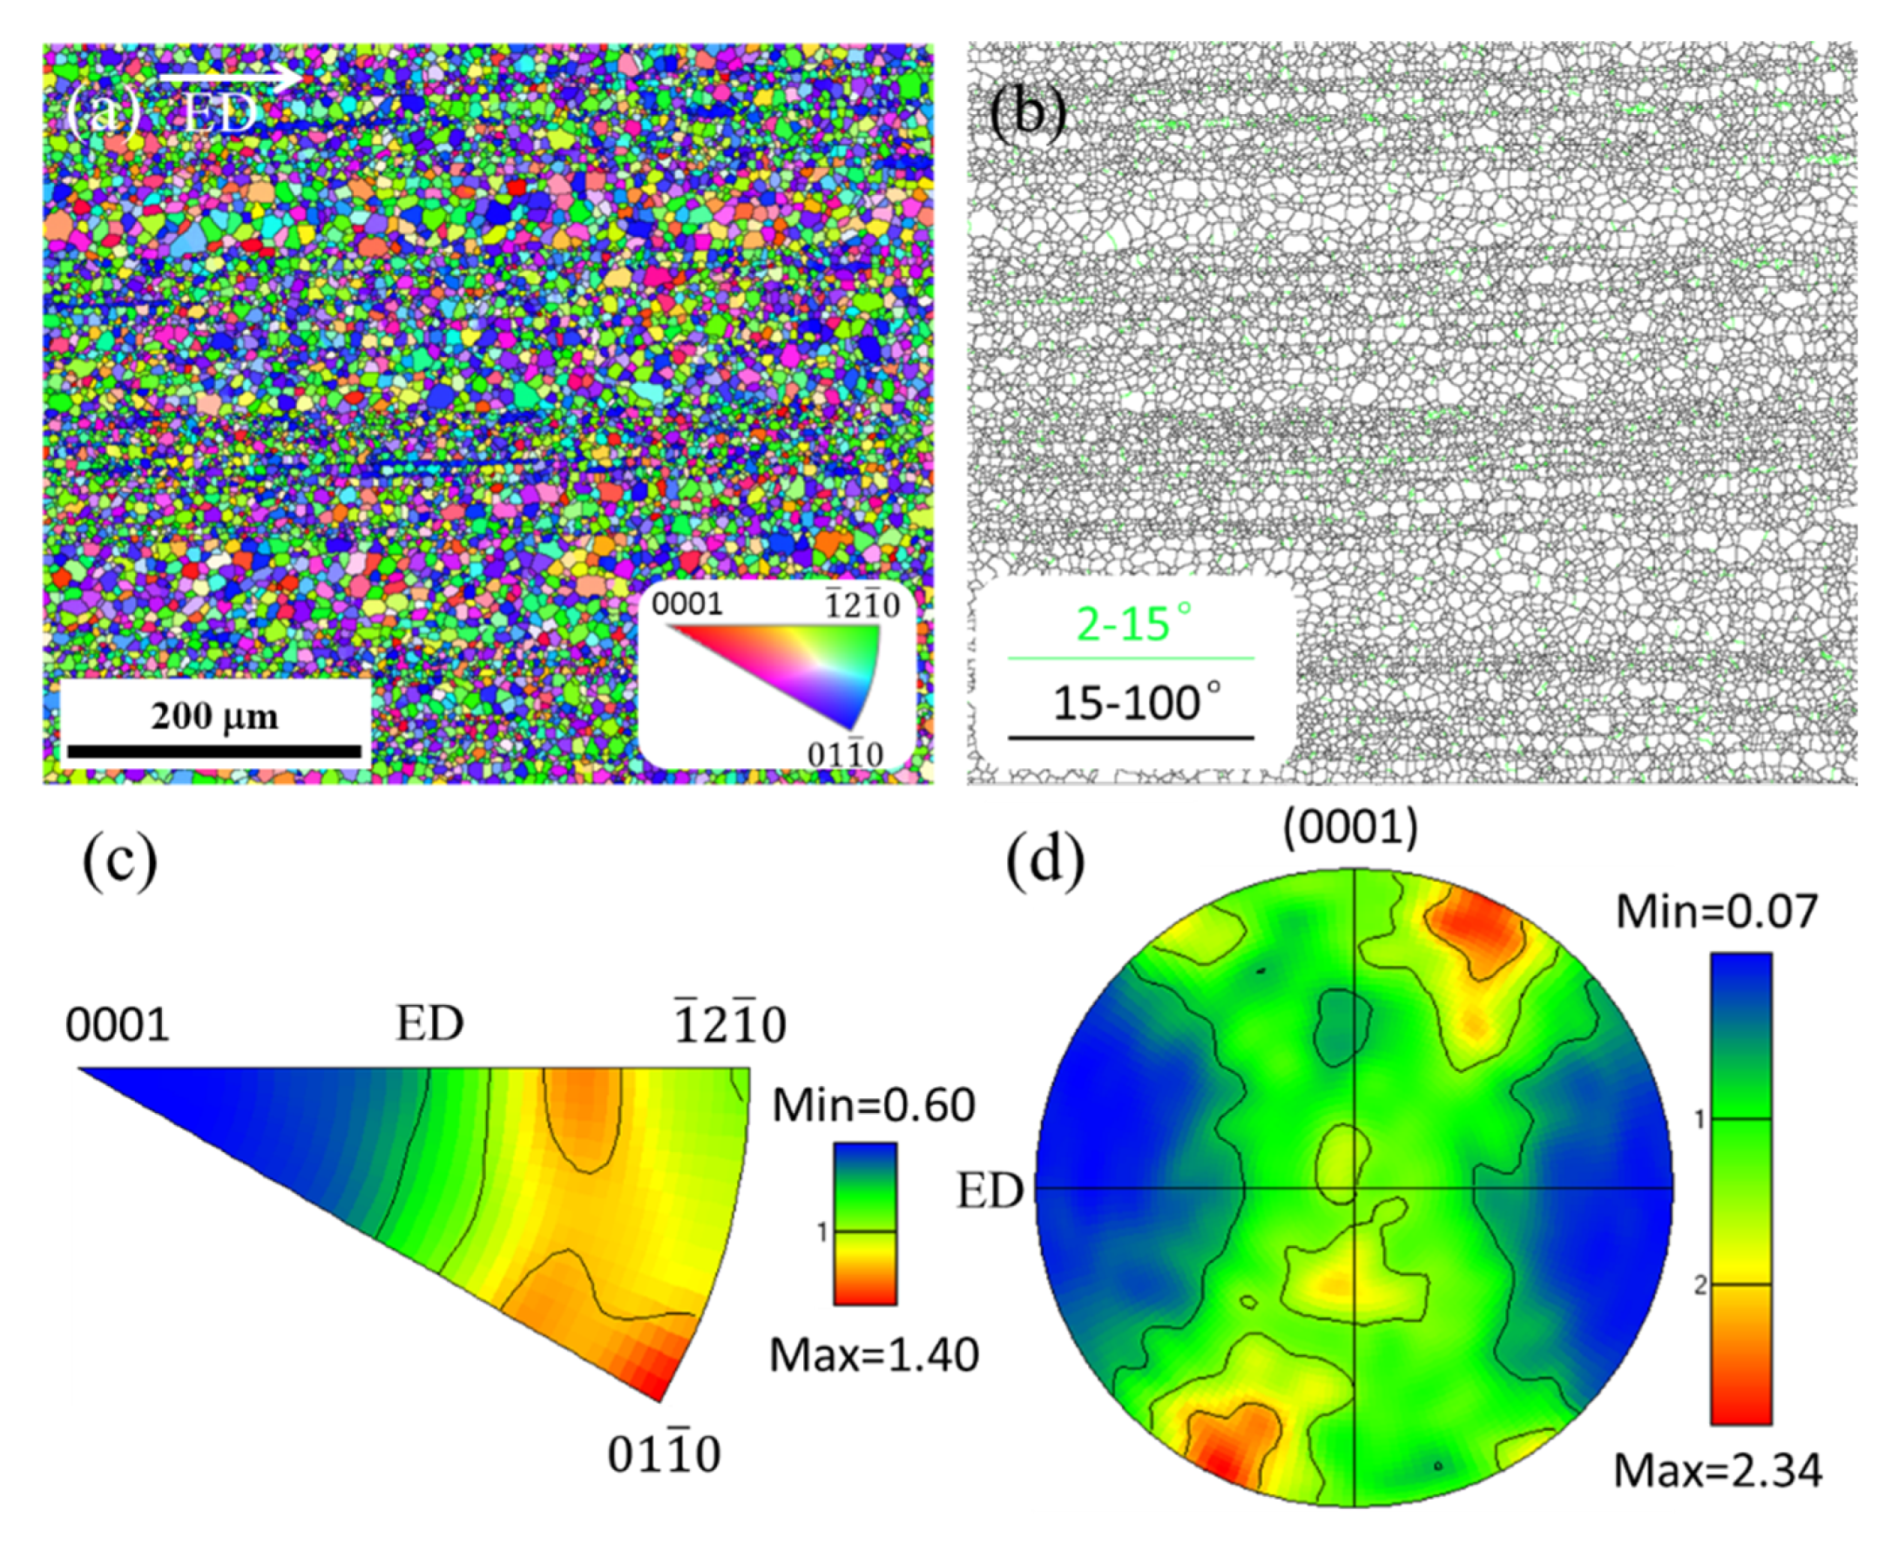
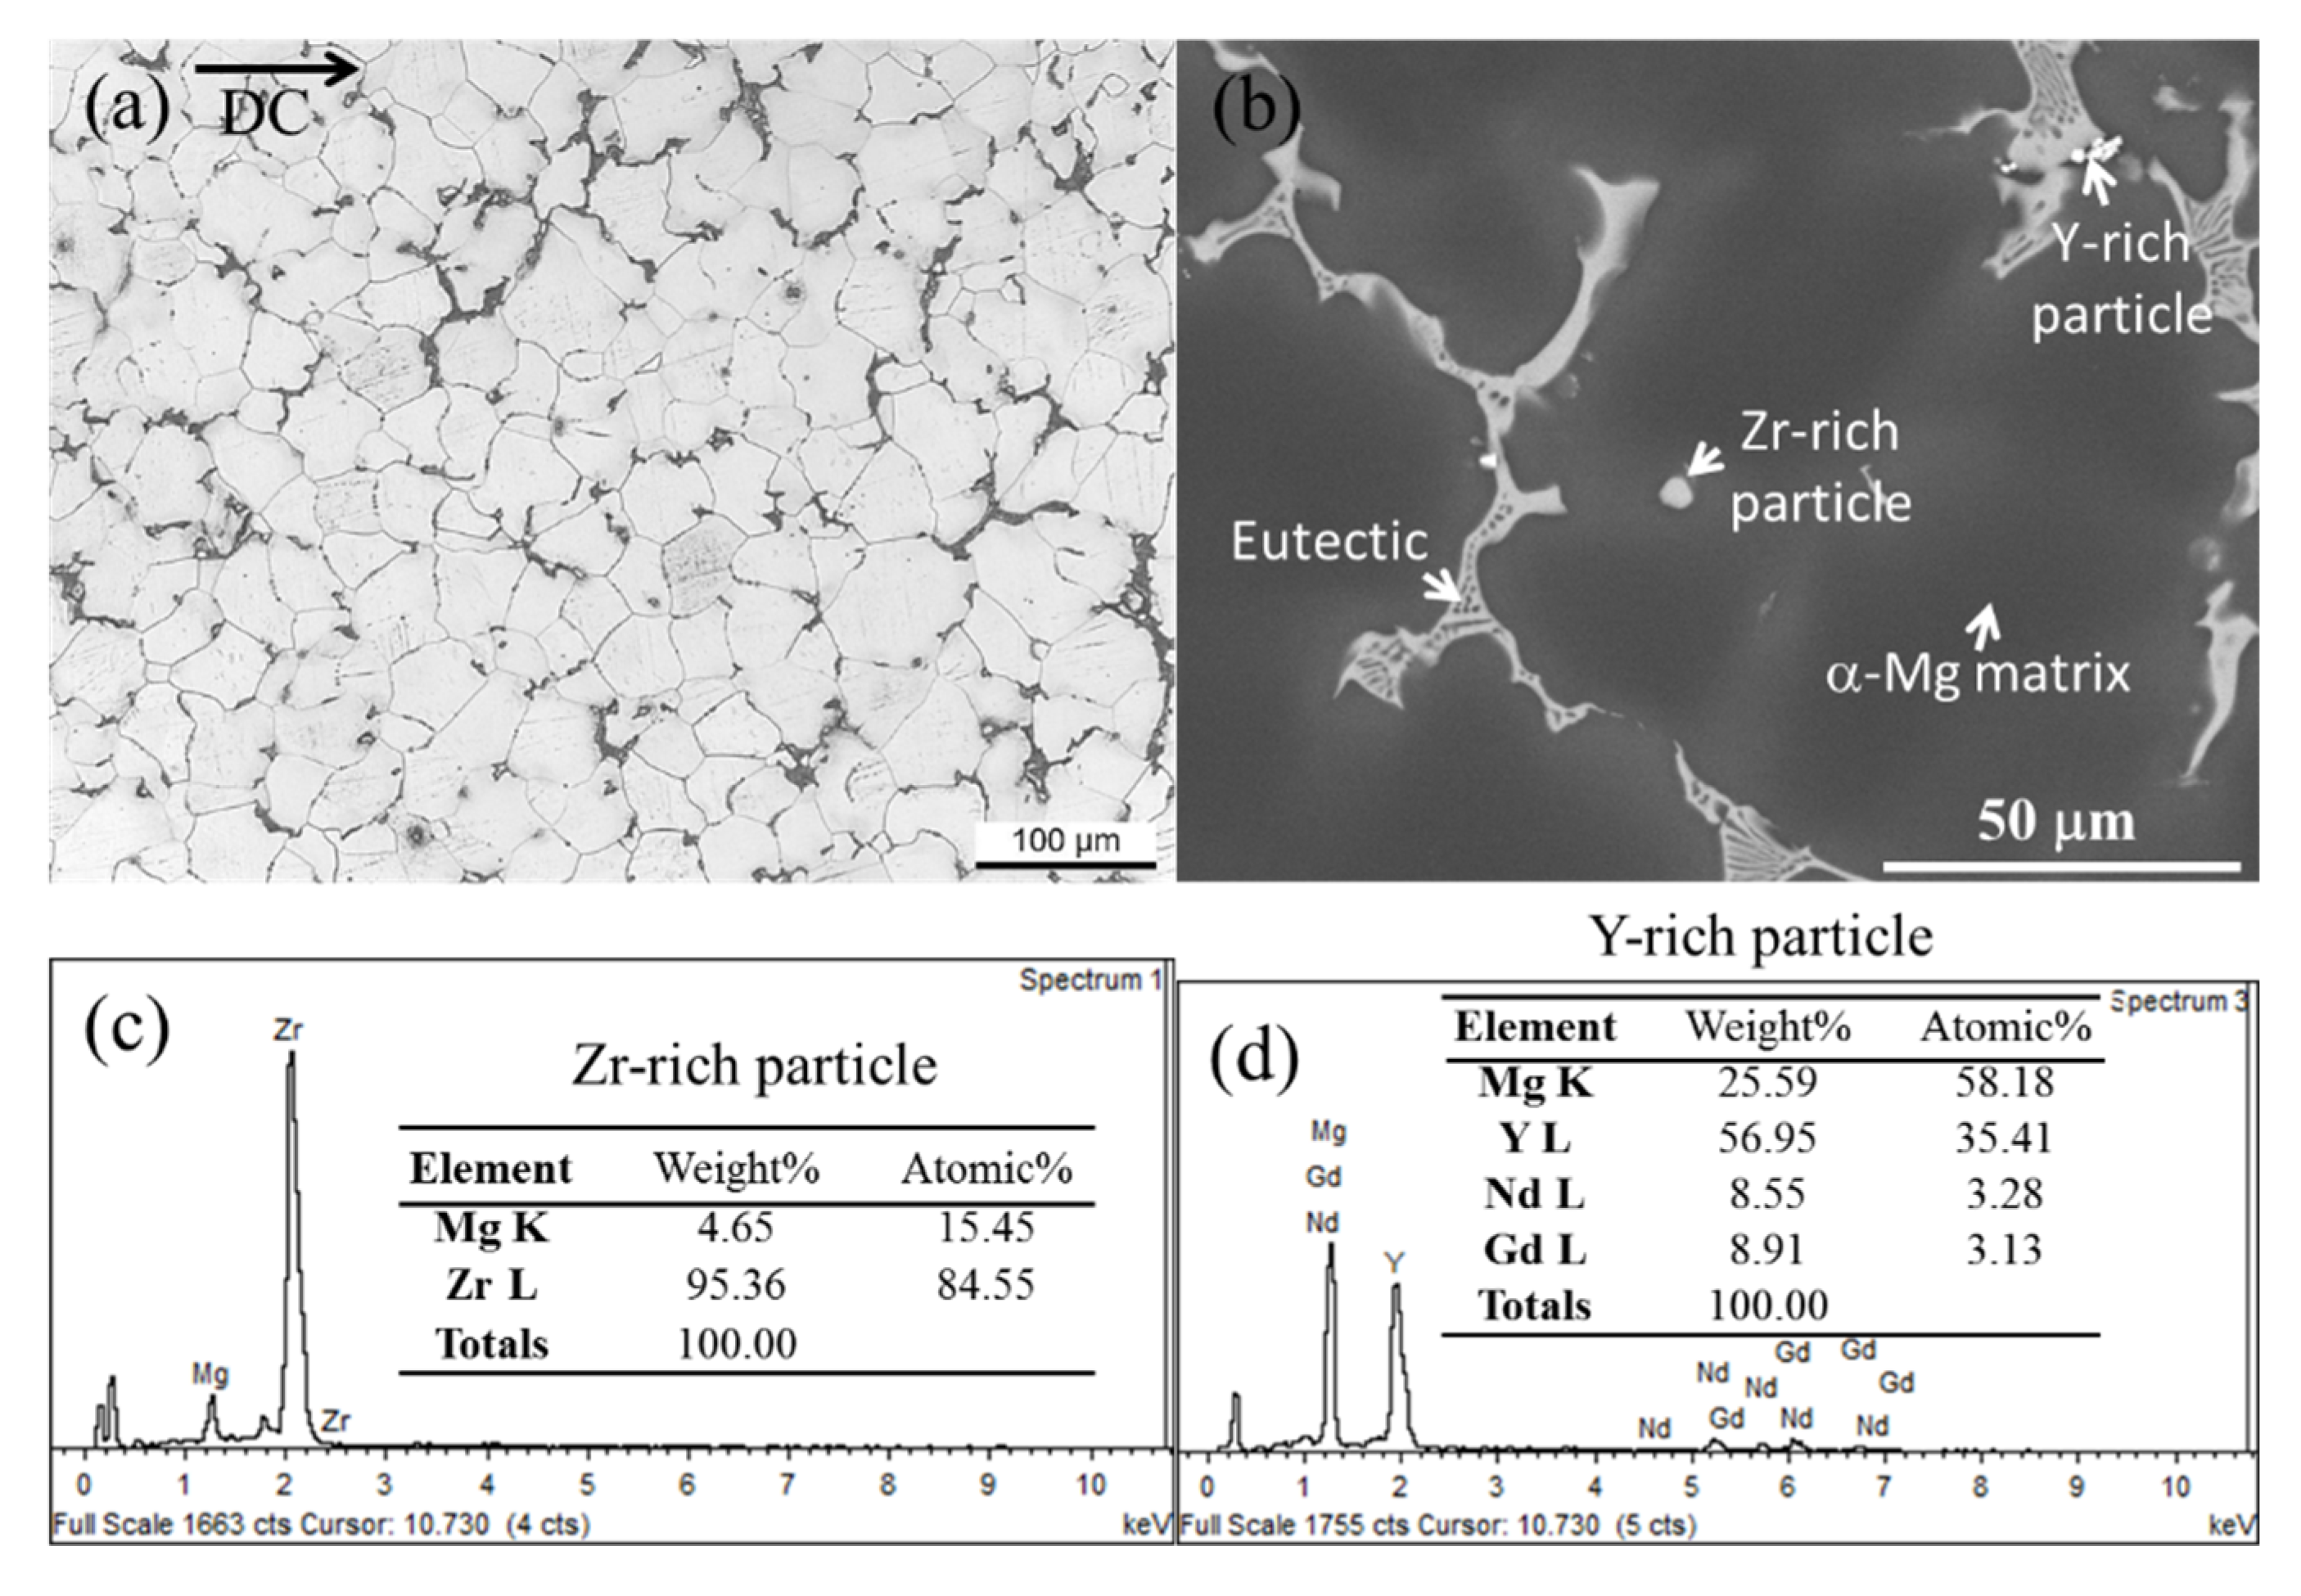
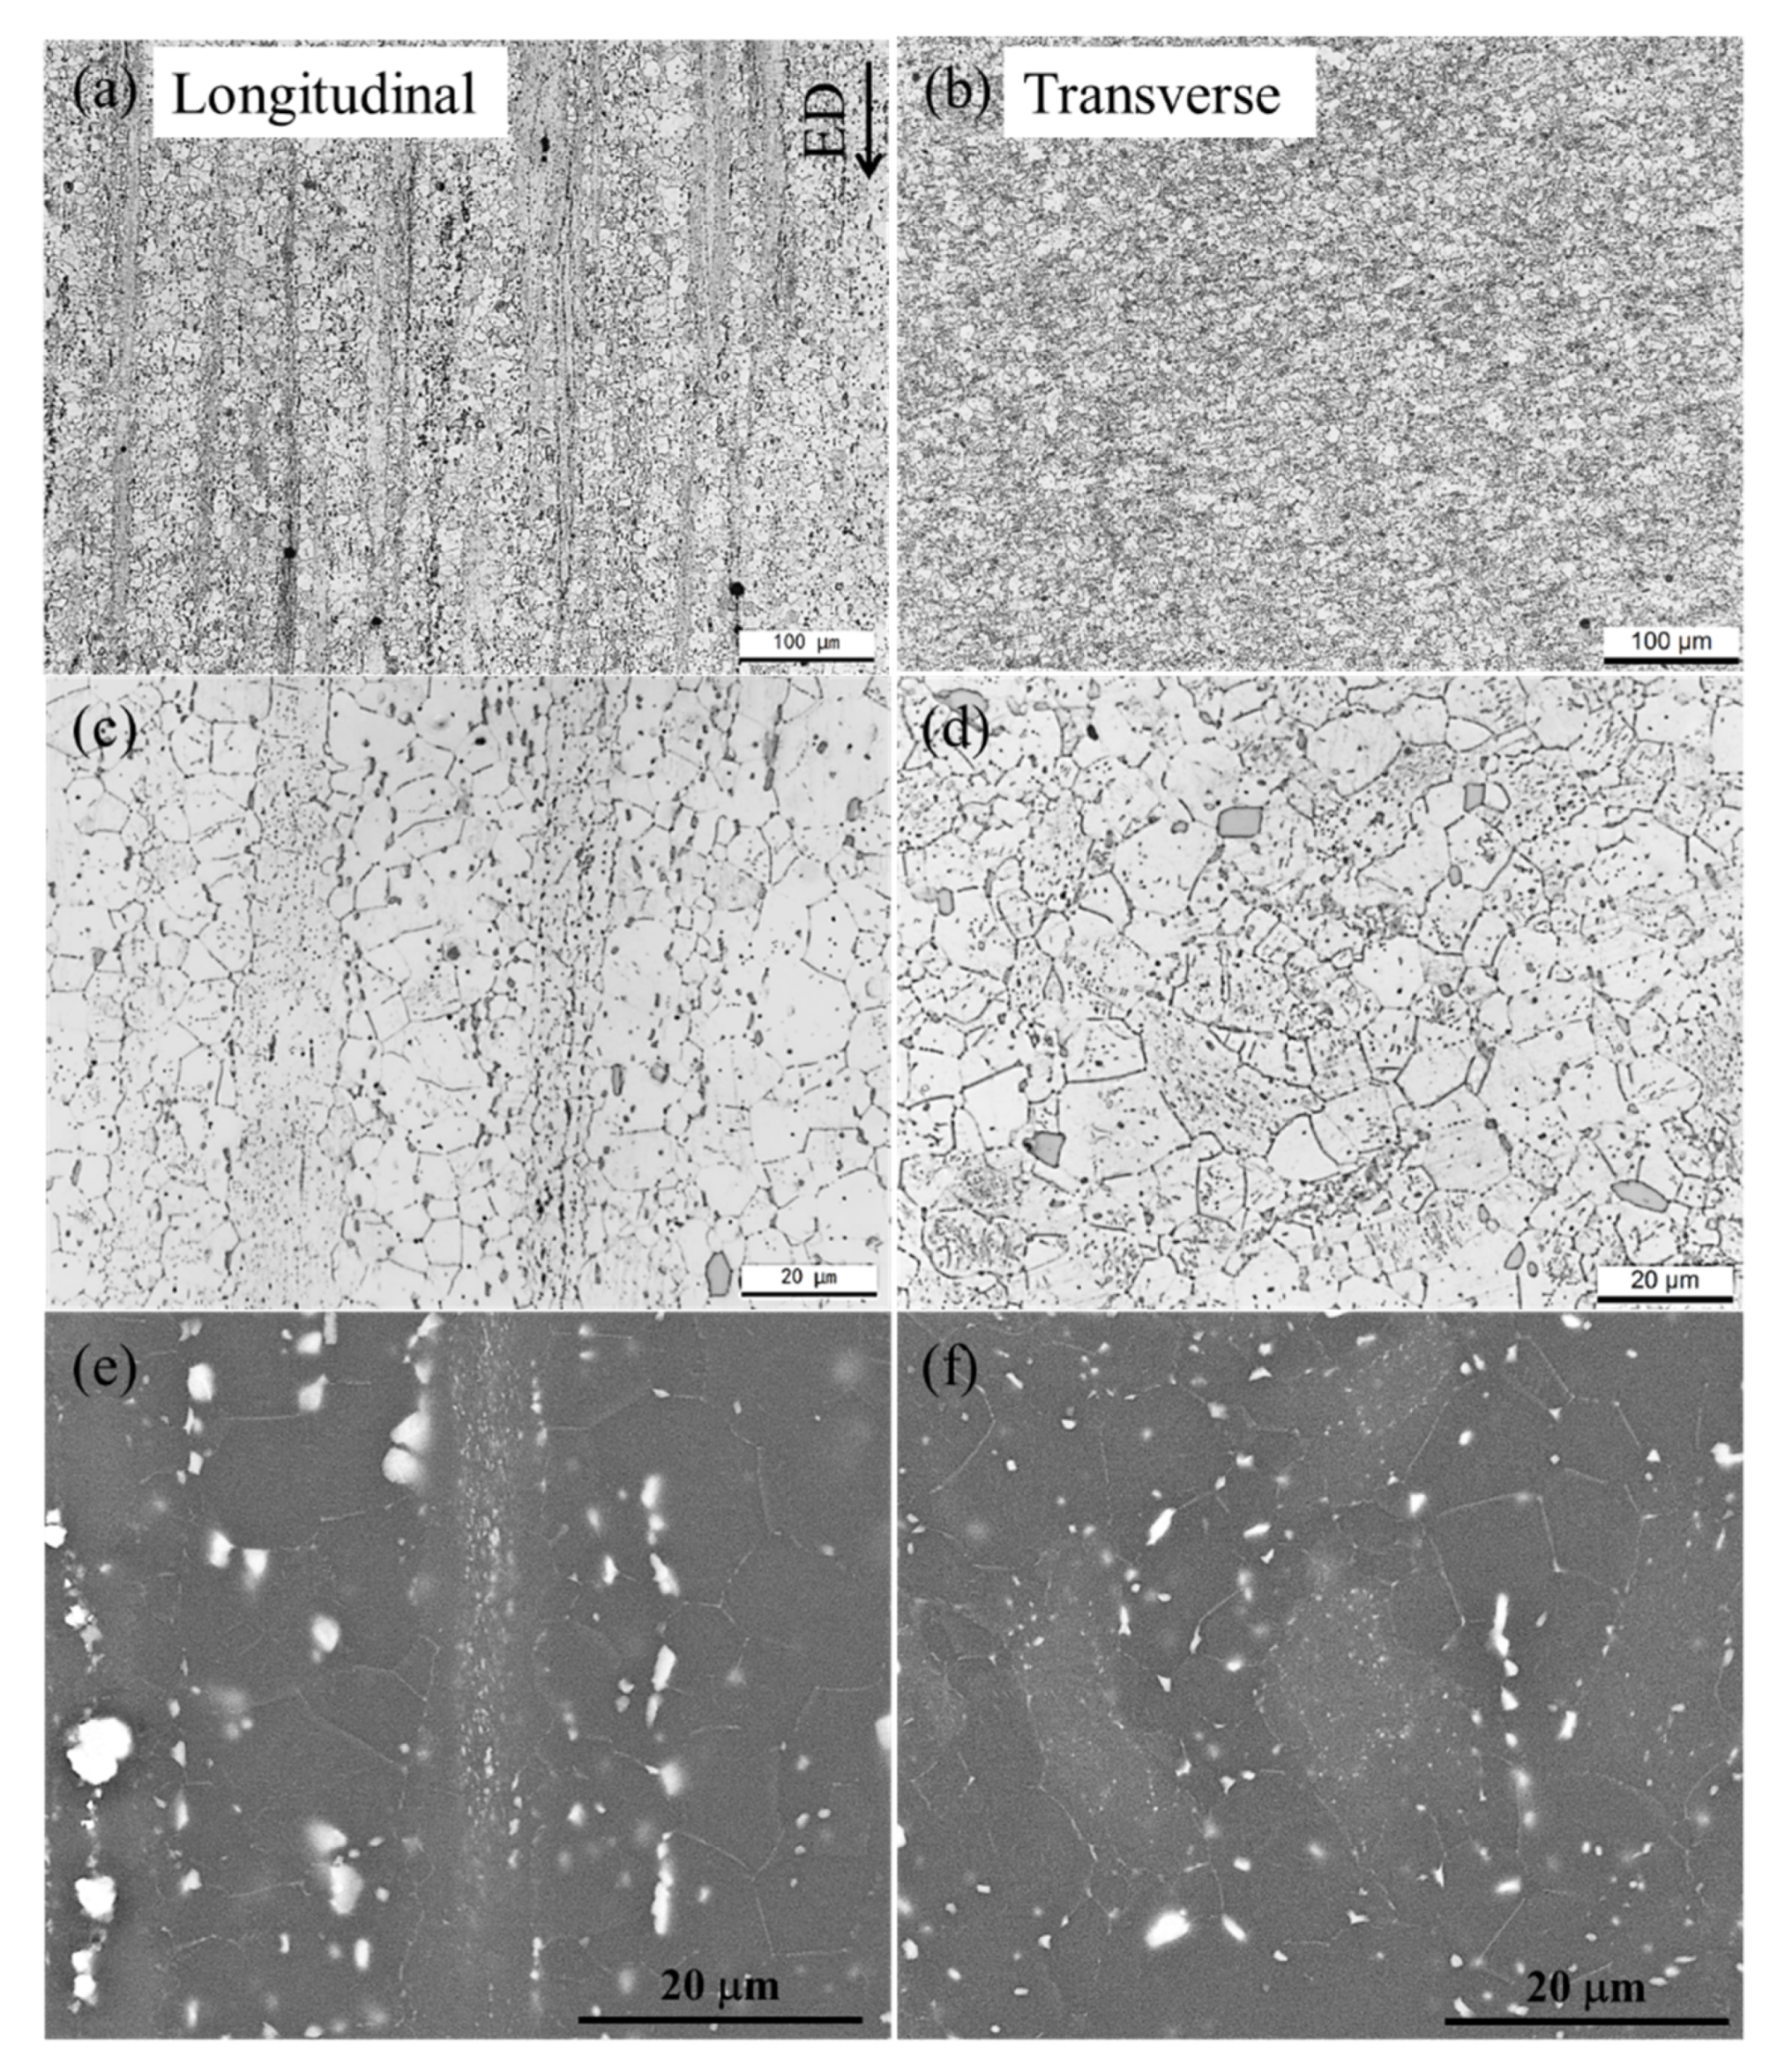
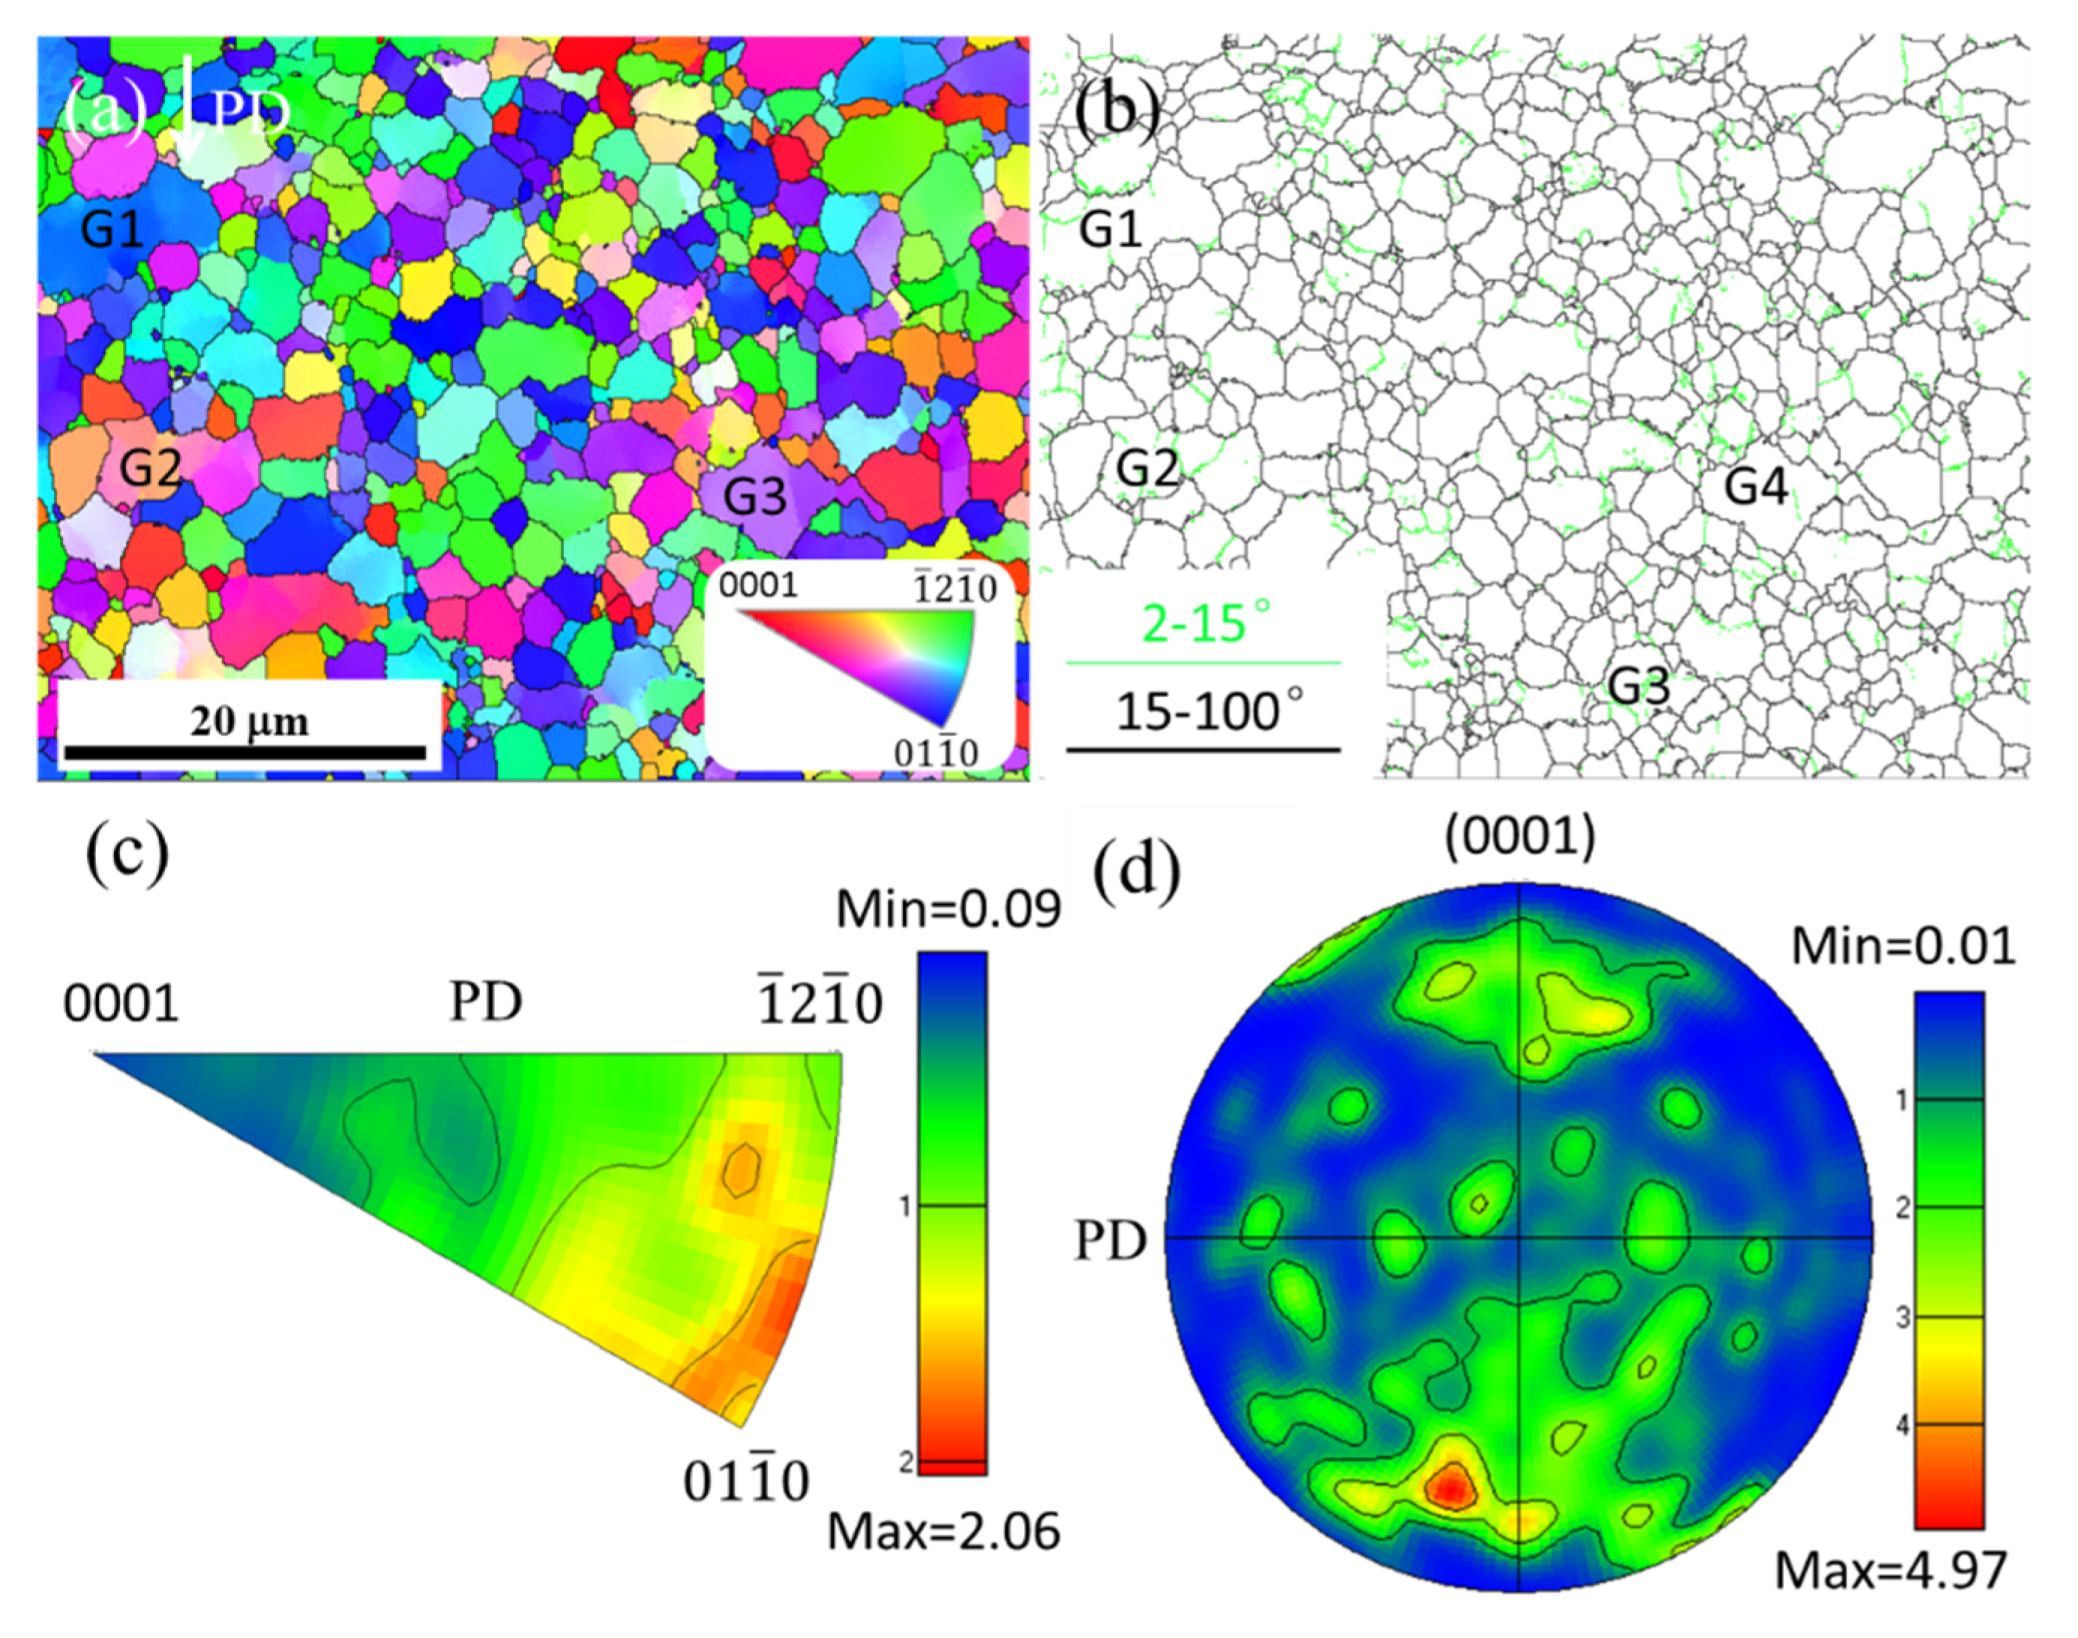
3.1. Starting Microstructures

The initial microstructures of the WE43 alloy in as-cast (AC), as-extruded Ex-1 and Ex-2 conditions are shown in Figure 1, Figure 2 and Figure 3, respectively. The as-cast (AC) microstructure has an equiaxed grain structure and the average grain diameter is 63 ± 4.8 μm (Figure 1a). It mainly consists of α-Mg matrix and an eutectic phase, which is distributed around the grain boundaries (Figure 1a–b). Besides, there is a small volume fraction of Zr-rich and Y-rich particles in the as-cast (AC) microstructure (Figure 1b–d). The eutectic phase has an irregular morphology and a volume fraction of 3.8 %, which was measured by ImageJ software. Apps et al. [22] has analyzed that the eutectic phase has a face centered cubic (FCC) crystal structure (with a lattice constant a ≈ 2.2 nm) and a composition of Mg5 (Y, Nd, Gd). The Zr-rich particles are heterogeneous nucleation sites for the primary α-Mg crystals, and thus significantly refine the grain size [23]. The Y-rich particles have an average size of 3.0 ± 0.5 μm and locate with the eutectic phase along the grain boundaries (Figure 1b), which may well be Mg24Y5 phase or possible rare earth hydrides [24,25].
The as-extruded Ex-1 microstructure has a bimodal grain structure, which consists of fine equiaxed grains and coarse elongated grains along the extrusion direction (ED) (Figure 2). The fine grains have an average diameter of 15 ± 2.4 μm and the coarse elongated grains have a length of 150-400 μm and a width and thickness of about 20 μm. The volume fraction of the coarse elongated grains is no more than 28%. The bimodal grain structure is formed due to an occurrence of partially dynamic recrystallization (DRX) during hot extrusion. The coarse elongated grains are not recrystallized and formed from the as-cast grains under the material flow along the ED. Through fully DRX, the as-extruded Ex-2 microstructure has a relatively uniform fine grain structure and the average diameter is 10 ± 2.3 μm (Figure 3). Both the Ex-1 and Ex-2 microstructures contain a large number of fine intermetallic particles and most of them are aligned in the ED, which leads to the formation of particle strips (Figure 2 and Figure 3). The intermetallic particles have been identified as Mg24Y5 phase and equilibrium β phase by Kubásek et al. [26]. We consider that the cuboid Mg24Y5 particles come from the as-cast microstructure because they are not dissolved during solution treatment. Besides, the fine Zr-rich particles with a small volume fraction also remain in the microstructure after solution treatment. In particular, a high density of very fine particles is within the interior of coarse elongated grains (Figure 2e). Furthermore, the grains with the particle strips have a smaller size than that without the particle strips (Figure 3c,d). This implies that the intermetallic particles hinder the grain growth.
Figure 4, Figure 5 and Figure 6 further present the typical EBSD analysis of the initial as-cast (AC), as-extruded Ex-1 and Ex-2 WE43 alloy microstructure, respectively. Among the figures, the inverse pole figure (IPF) map presents the orientation of the direct-chill casting (DC) or extruding direction (ED) axis with respect to the local crystal lattice frame by colors according to the IPF triangle (Figure 4a,Figure 5a,Figure 6a, and their insets). A statistical analysis of this orientation measurement is shown by the IPF (Figure 4c,Figure 5c and Figure 6c). Besides, a (0001) pole figure (PF) is also presented (Figure 4d, Figure 5d and Figure 6d). For the as-cast (AC) WE43 alloy, the grains show different colors and without specific color (Figure 4a), which indicates that the grains own different orientations and no preferential orientation. Although there is a very weak intensity of 1.40 in the orientation of < 1 ¯ 2 1 ¯ 0>//DC observed from the IPF, the as-cast (AC) microstructure shows a random texture (Figure 4c). The random texture is further demonstrated by the (0001) PF (Figure 4d). Furthermore, there are few gradients of color within the interior grains, which indicates no disorientation occurring within the grains. This is further verified by the boundary map, in which the low angle grain boundaries (LAGBs, 2° ≤ θ ≤ 15°) indicate in green color and high angle grain boundaries (LAGBs, θ ≥ 15°) in black color that only a few LAGBs are introduced by the specimen preparation (Figure 4b). The as-cast (AC) WE43 alloy microstructure is consistent with the previous reports [15,27].
As to the as-extruded Ex-1 alloy with a partially DRX, a moderate <01 1 ¯ 0>//ED fiber texture with a very weak rare earth (RE) texture is revealed from the IPF (Figure 5c) and (0001) PF (Figure 5d). The RE texture refers to the texture component between [ 1 ¯ 2 1 ¯ 1]//ED and [ 1 ¯ 2 1 ¯ 3]//ED. It was firstly reported by Ball et al. [28] in an extruded WE43 alloy and they attributed this texture type to the results of particle-stimulated nucleation (PSN) during DRX, but its formation mechanism is still in debate [29]. From the IPF map (Figure 5a), the fine equiaxed grains (namely DRXed region) show different colors, which lead to the RE texture (Figure 5c). However, the coarse elongated grains (i.e., unDRXed regions) are all shown in the blue color and result in the formation of <10 1 ¯ 0>//ED fiber texture (Figure 5a,c). Although the unDRXed region has only a small volume fraction, it obtains a moderate intensity (= 5.50) of the fiber texture. This evidently indicates that the texture of the extruded Ex-1 alloy is mainly dependent on the texture state of the unDRXed regions. Within the unDRXed coarse elongated grains, there is a high density of LAGBs and leads to the formation of substructures, while few LAGBs are within the fine DRXed grains (Figure 5b). In contrast, a typical RE texture with a relatively weak <01 1 ¯ 0>//ED fiber texture (intensity of 1.40) is revealed for the as-extruded Ex-2 alloy with a fully DRX (Figure 6c,d). Within the fully DRXed microstructure, few LAGBs are observed (Figure 6b). As depicted above, the fine particle strips along the ED lead to the finer grains more effectively than without the particle strips. This can be more clearly observed in the IPF and the boundary map (Figure 6a,b).

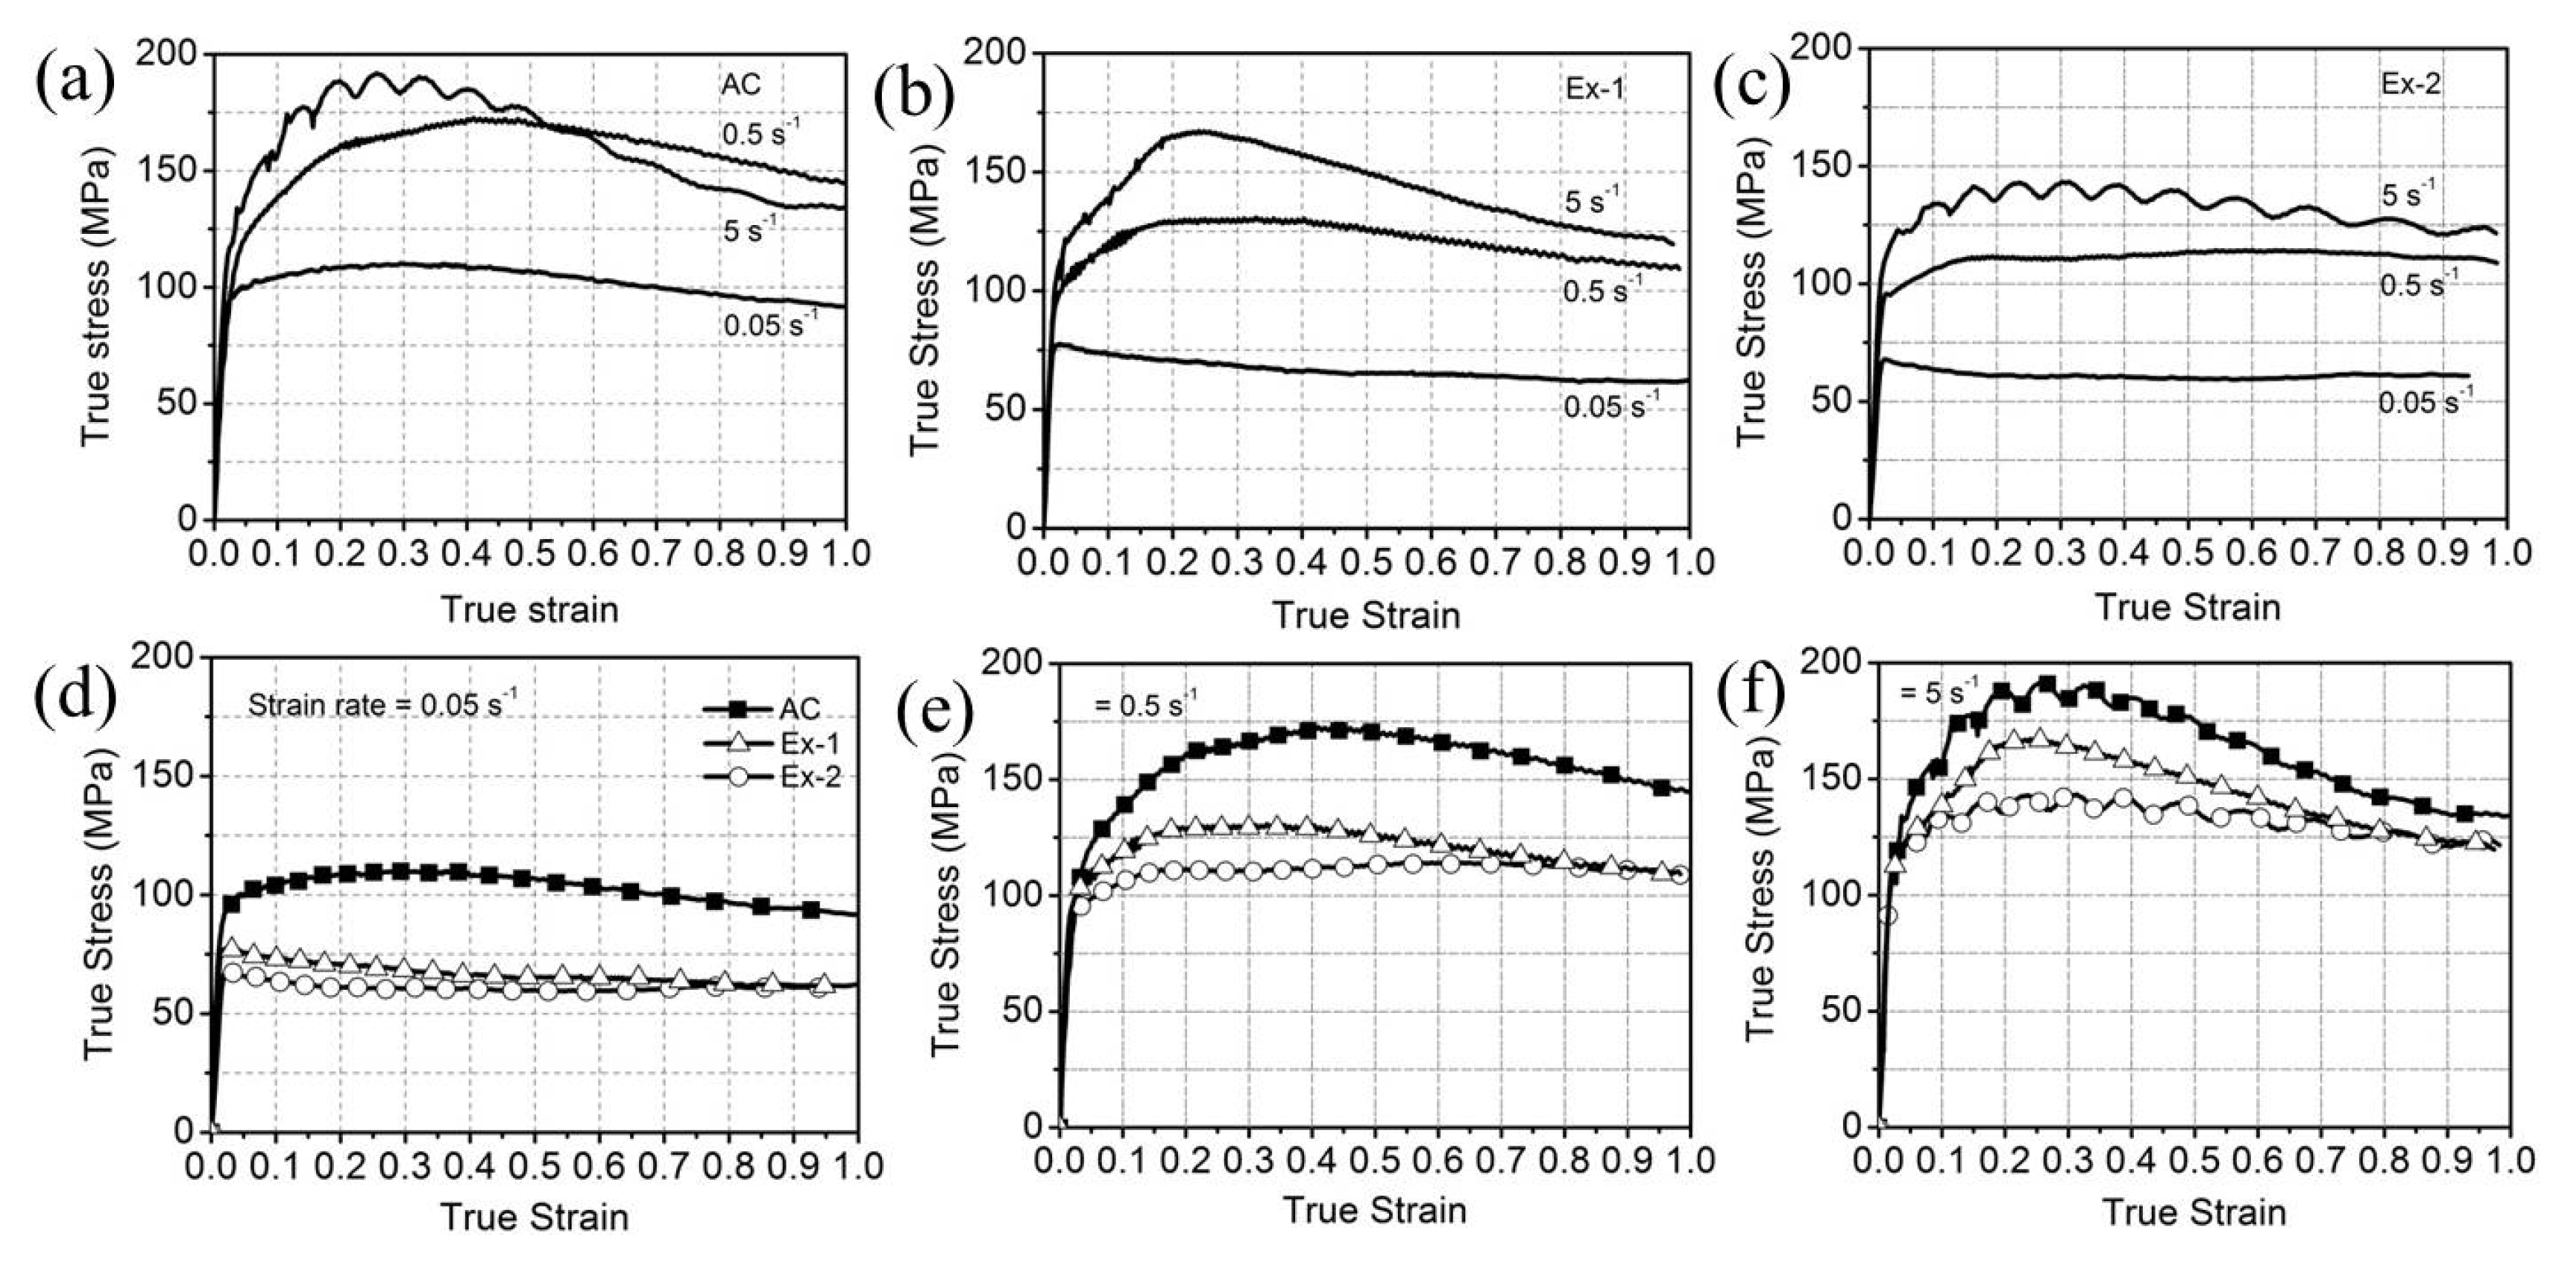
3.2. Stress–Strain Behavior

The true stress–strain curves of the WE43 alloy in the as-cast (AC), as-extruded Ex-1 and Ex-2 conditions at various strain rates of 0.05-5 s−1 with a constant temperature of 400 °C are presented and compared in Figure 7. It is worth noting that a maximum temperature rise of 42 °C, 33 °C, and 35 °C was measured in the AC, Ex-1 and Ex-2 specimen when tested at a high strain rate of 5 s−1, respectively. The cause is that the heat generated by the work of deformation cannot all be removed in a timely fashion from the specimen when the strain rate is as high as 5 s−1, and thus leads to an adiabatic heating. The corresponding stress–strain curves are not corrected for the temperature rise in the present work, but it has negligible influence on the following analysis. All of these curves show a common feature that the flow stress initially increases to a peak stress (σp) and then decreases to a steady state flow stress (σs) (Figure 7a–c). This flow stress behavior is consistent with previous reports [14,15]. During the initial stage of deformation, dislocations generate and accumulate, which leads to the rapid stress increase, i.e., work hardening. As the dislocation density rises with the strain increase, dislocation rearrangement is activated to develop dynamic recovery and further DRX, which results in a stress decrease, i.e., work softening [30]. After a critical strain, the work hardening and softening could obtain a dynamic equilibrium. This results in a steady state flow stress. The flow stress behavior, consistent with a work hardening and softening regime, represents the typical DRX features [14,31].
The strain rate sensitivity index, m, at the temperature of 400 °C for the three materials is calculated using the equation [32]:
m = ( l n σ ¯ l n ε ˙ ¯ )   ε , T   = ( l n σ σ 0 l n ε ˙ ε 0 ˙ )   ε , T = l n ( σ h / σ l ) l n ( ε h ˙ / ε l ˙ )
where the normalized flow stress and normalized strain rate are denoted by σ ¯ and ε ˙ ¯ , respectively, while the actual flow stress and strain rate are σ and ε ˙ , respectively; σ 0 is the reference stress and ε ˙ 0 the reference strain rate. The low strain rate (LSR) and high strain rate (HSR) is denoted by the subscript l and h, respectively. In the present calculation, the LSR and HSR are selected of 0.05 s−1 and 0.5 s−1, respectively. The reason is that there is a temperature rise at a strain rate of 5 s−1. This results in a decrease in the flow stress. The flow stress and strain rate sensitivity, m, of the three WE43 alloy materials at strains of 2%, 10%, and 30% are presented in Table 1. It is worth noting that the strain rate sensitivity is positive in all of these three materials and increased with the strain. It was explained by Chen et al. [32] that this strengthening comes from the positive rate sensitivity of the critical resolved shear stress (CRSS) for deformation slip systems, particularly prismatic and pyramidal slip (non-basal slip), when the non-basal slip is more and more activated as the strain increases. At the same strain, the strain rate sensitivity is also increased from the AC to Ex-2 material, except for a strain of 30 %. This could indicate that the non-basal slip is more activated within the Ex-2 material.
In comparison, the as-cast (AC) material obtains the largest σp and εp, while the as-extruded Ex-2 material has the lowest value and the as-extruded Ex-1 material has the middle value at every strain rate (Figure 7d–f and Table 2). The reason that it is possible for an earlier DRX to be activated in the fine-grained as-extruded Ex-1 and Ex-2 materials is that there is a higher numbers of grain boundary DRX nuclei than that of the coarse-grained AC material, which results in an earlier work softening, and thus the lower of σp and εp value. An additional cause for the Ex-1 material when compared with the Ex-2 material could be that the Ex-1 material owns a relatively more intense <01 1 ¯ 0> fiber texture due to the presence of coarse elongated grains (compared the Figure 5a and Figure 6a). This leads to a low schmid factor (SF) for basal slip due to their slip planes being parallel to the compression direction. Thus, the basal slip is restricted to activate although the basal slip has a lowest CRSS. In addition, the prismatic slip is also restricted to activate due to its slip planes being perpendicular to the compression direction. In this case, the pyramidal slip should dominate the plastic deformation in the coarse elongated grains (i.e., unDRXed regions). It has been reported by Agnew et al. [33] that the CRSS for the basal, prismatic, and pyramidal slip of the WE43 alloy could be 12, 78, and 130 MPa, respectively. The pyramidal slip CRSS is much higher than that of the basal slip. Thus, the deformation stress should be higher to initiate the pyramidal slip in the Ex-1 material when compared to the basal slip in the Ex-2 material at the same SF. As a result, the σp value for the Ex-1 material is higher than that of the Ex-2 material.

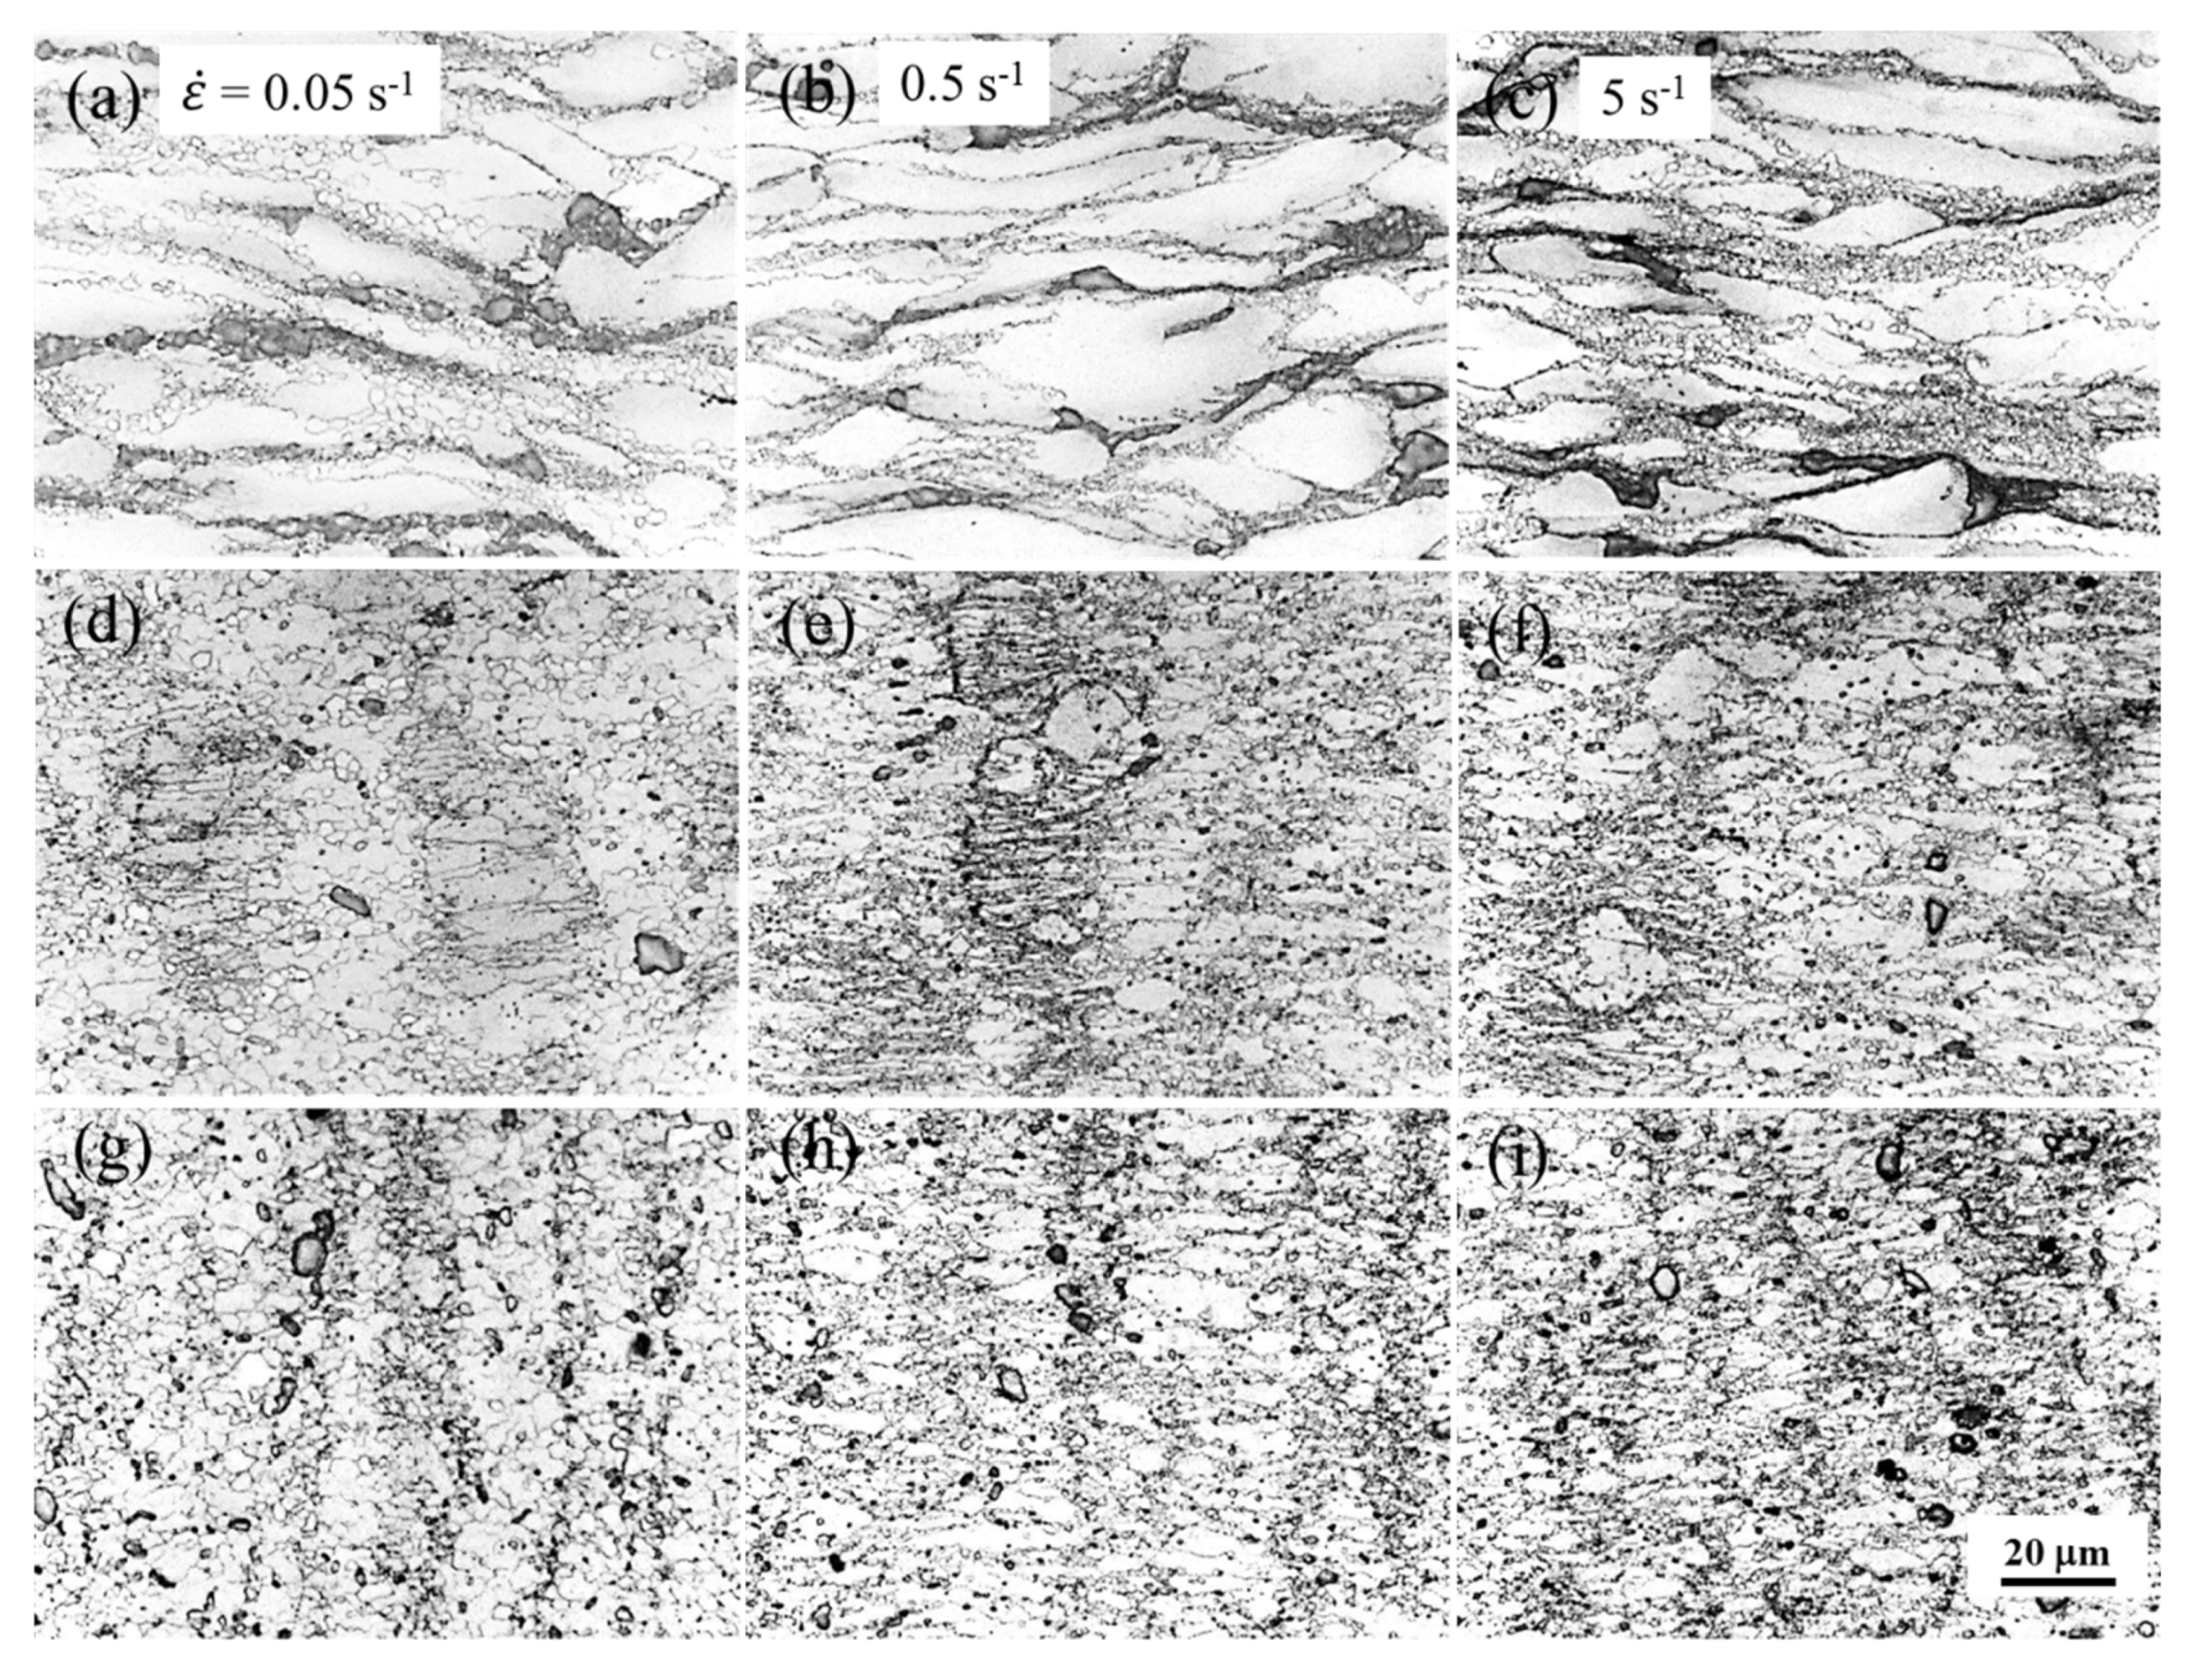
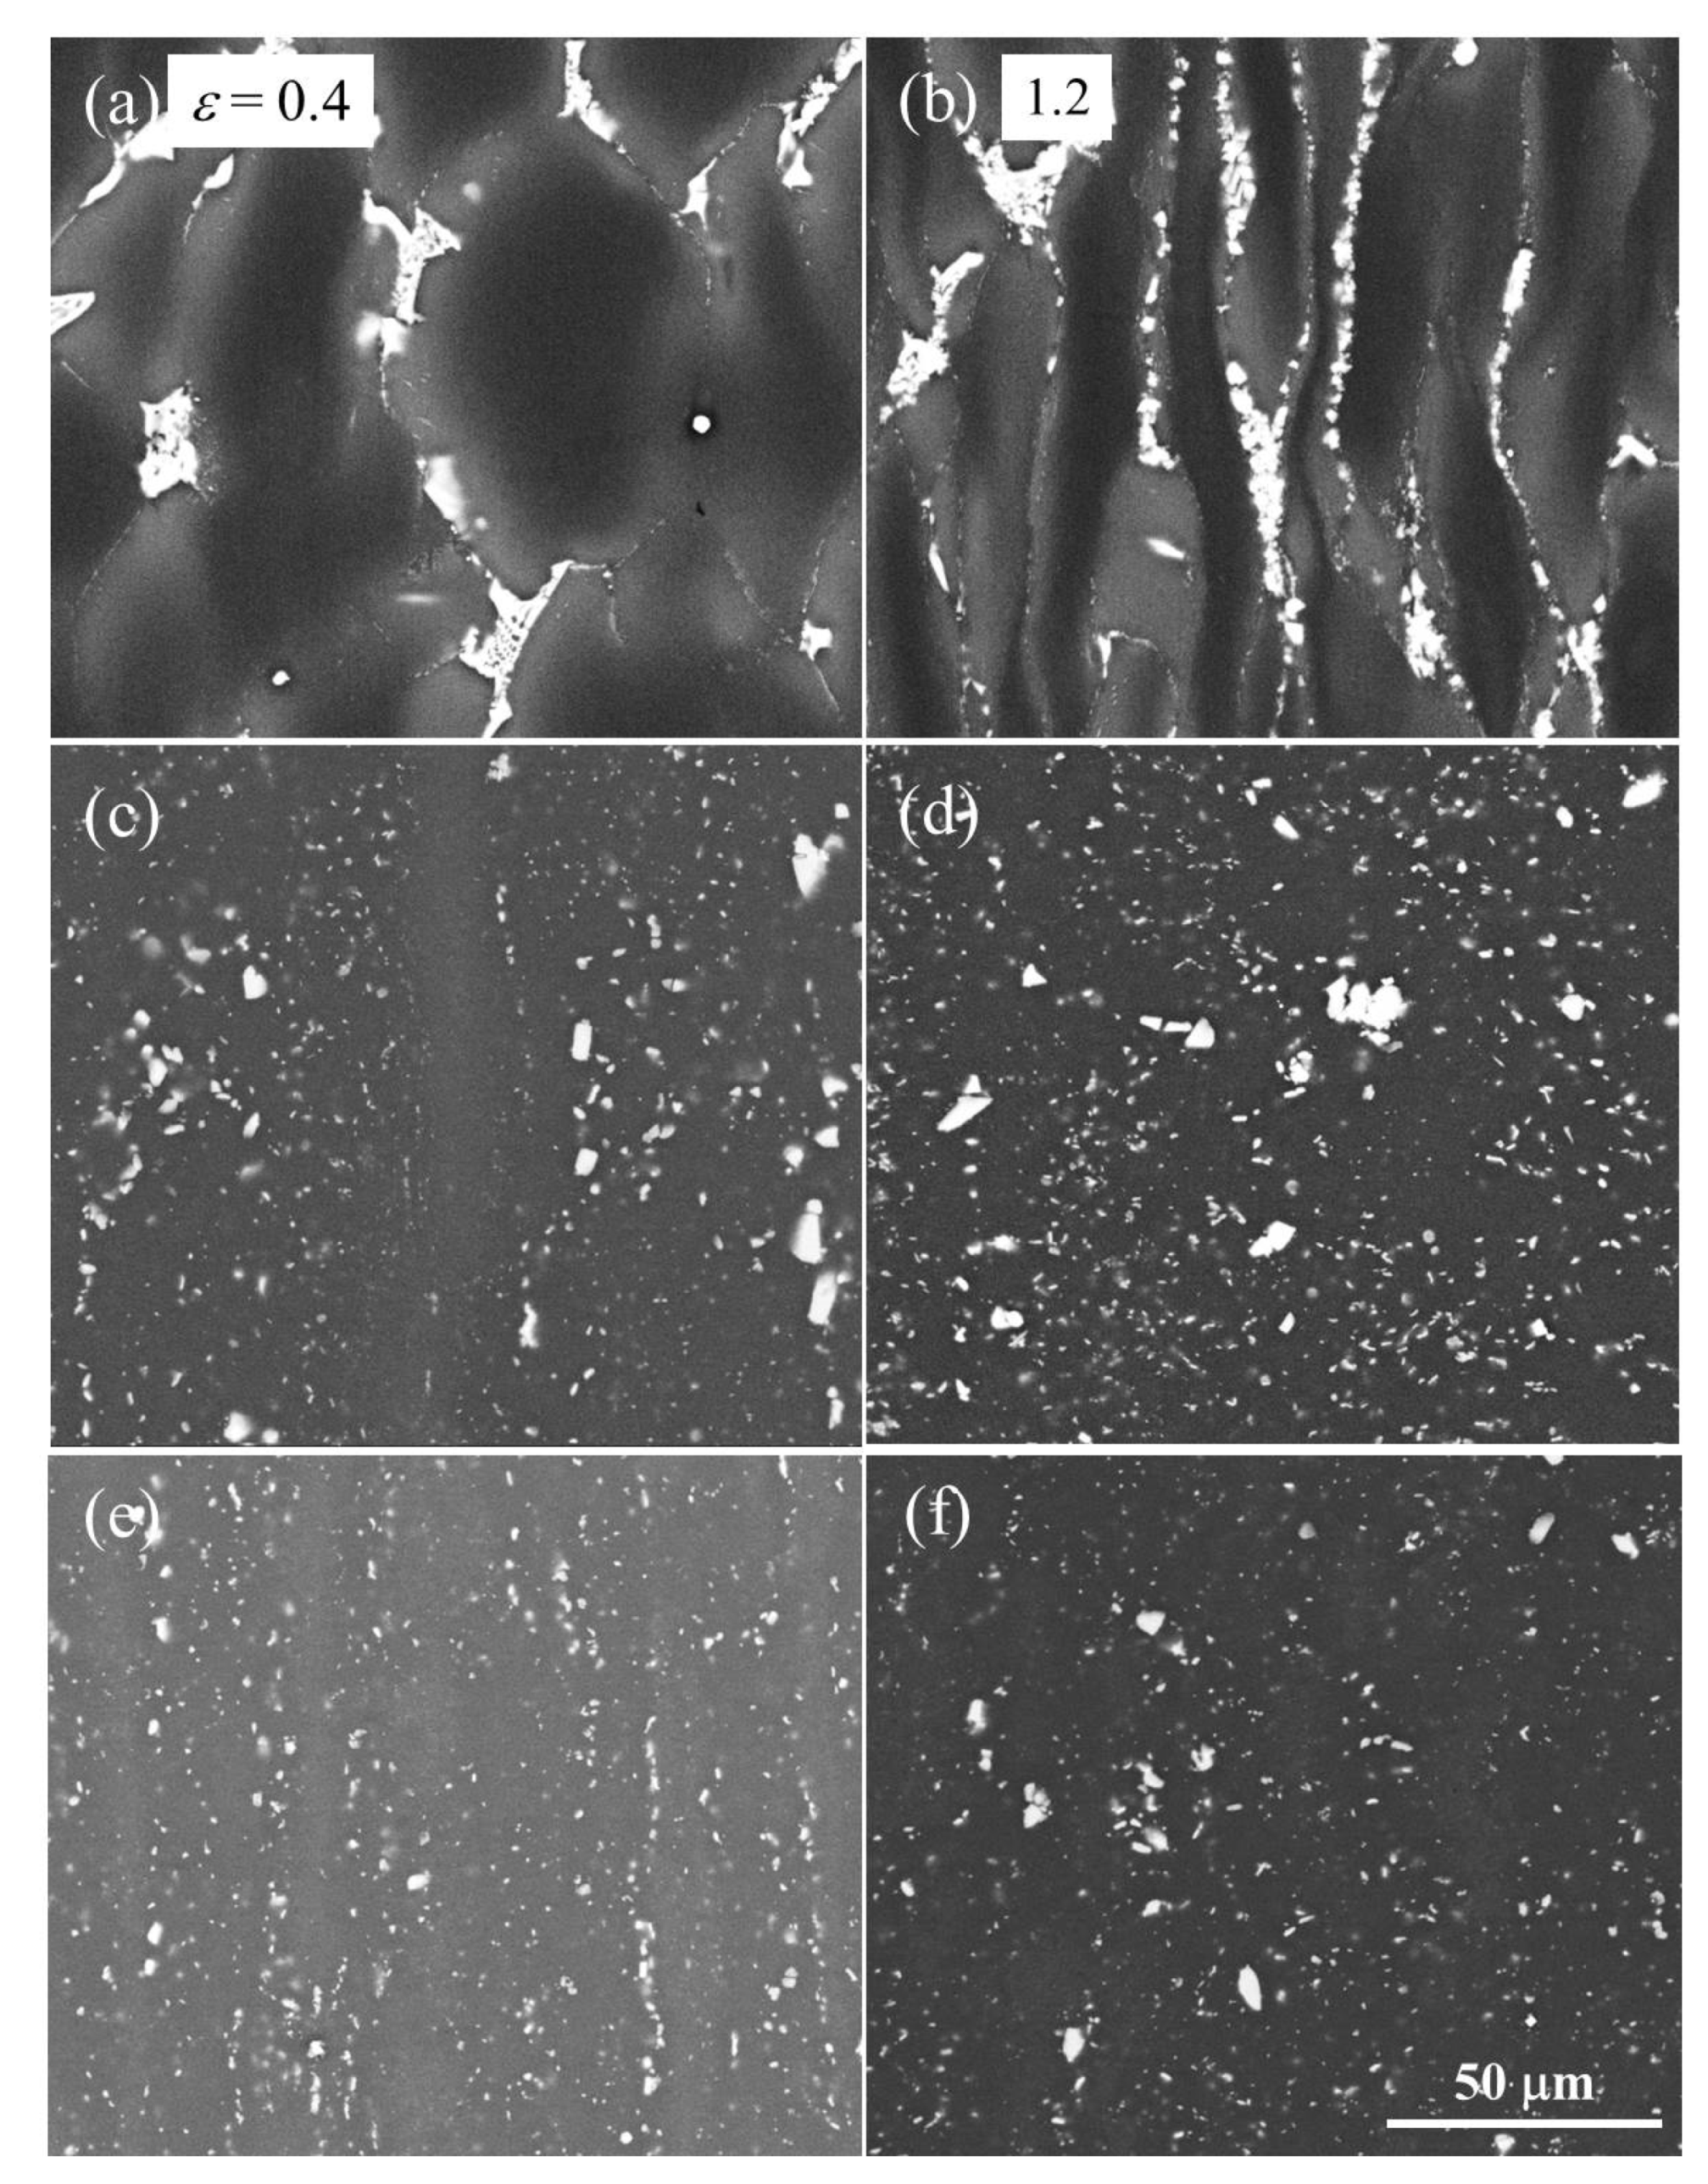
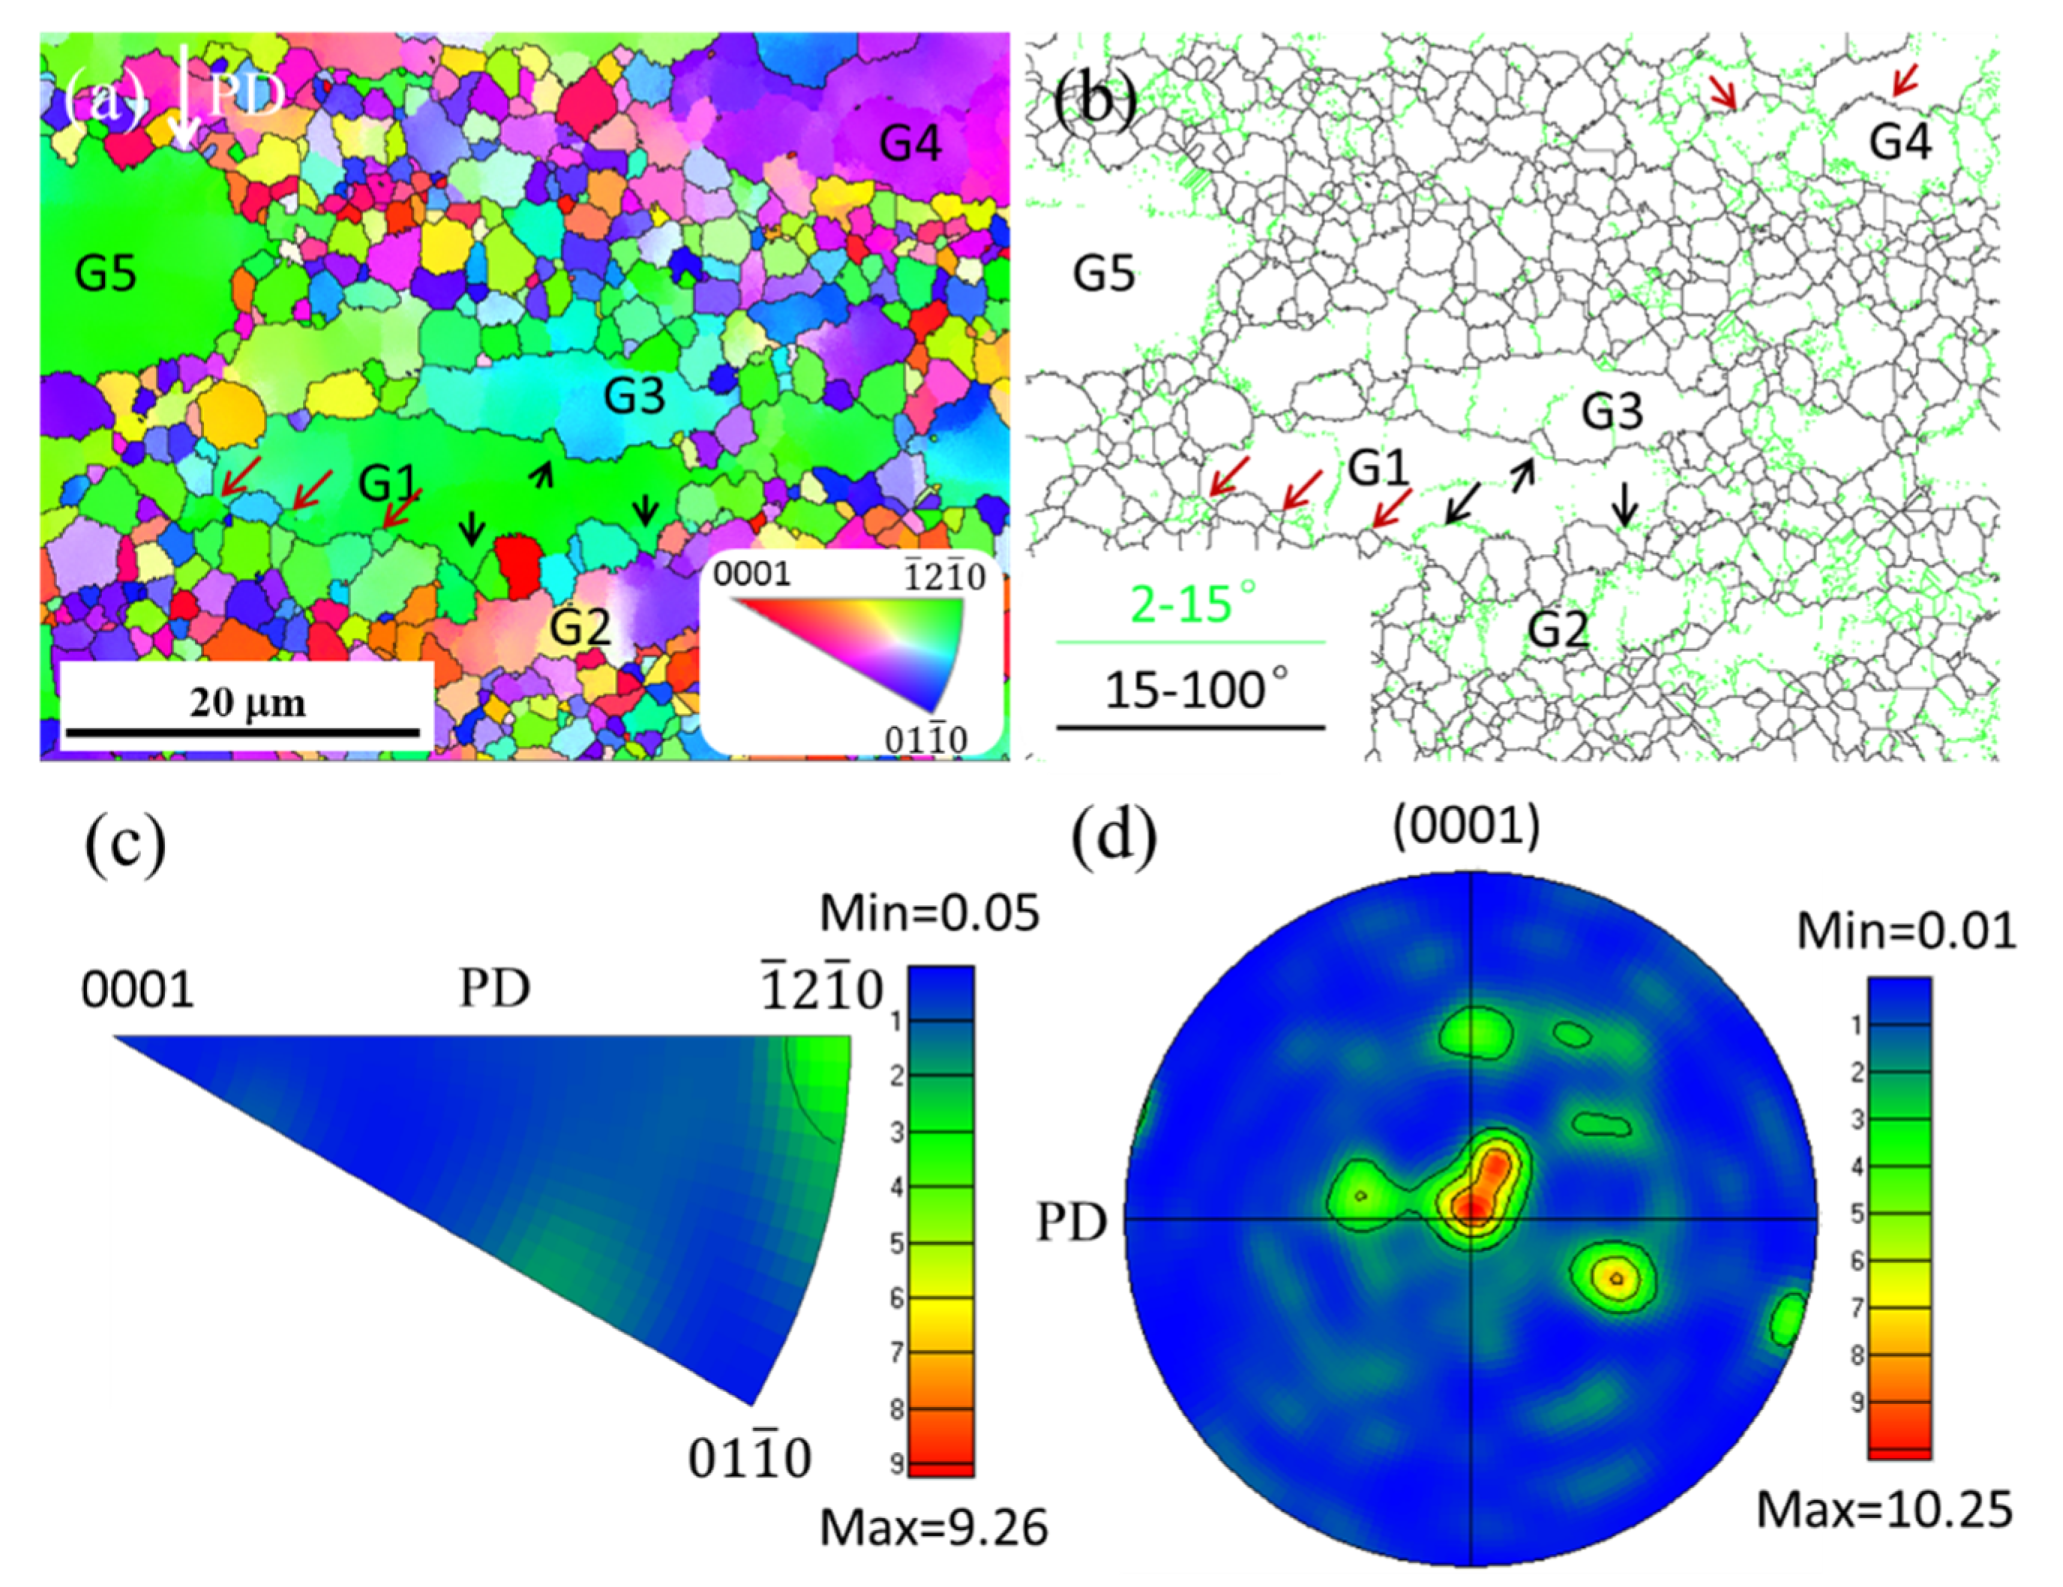
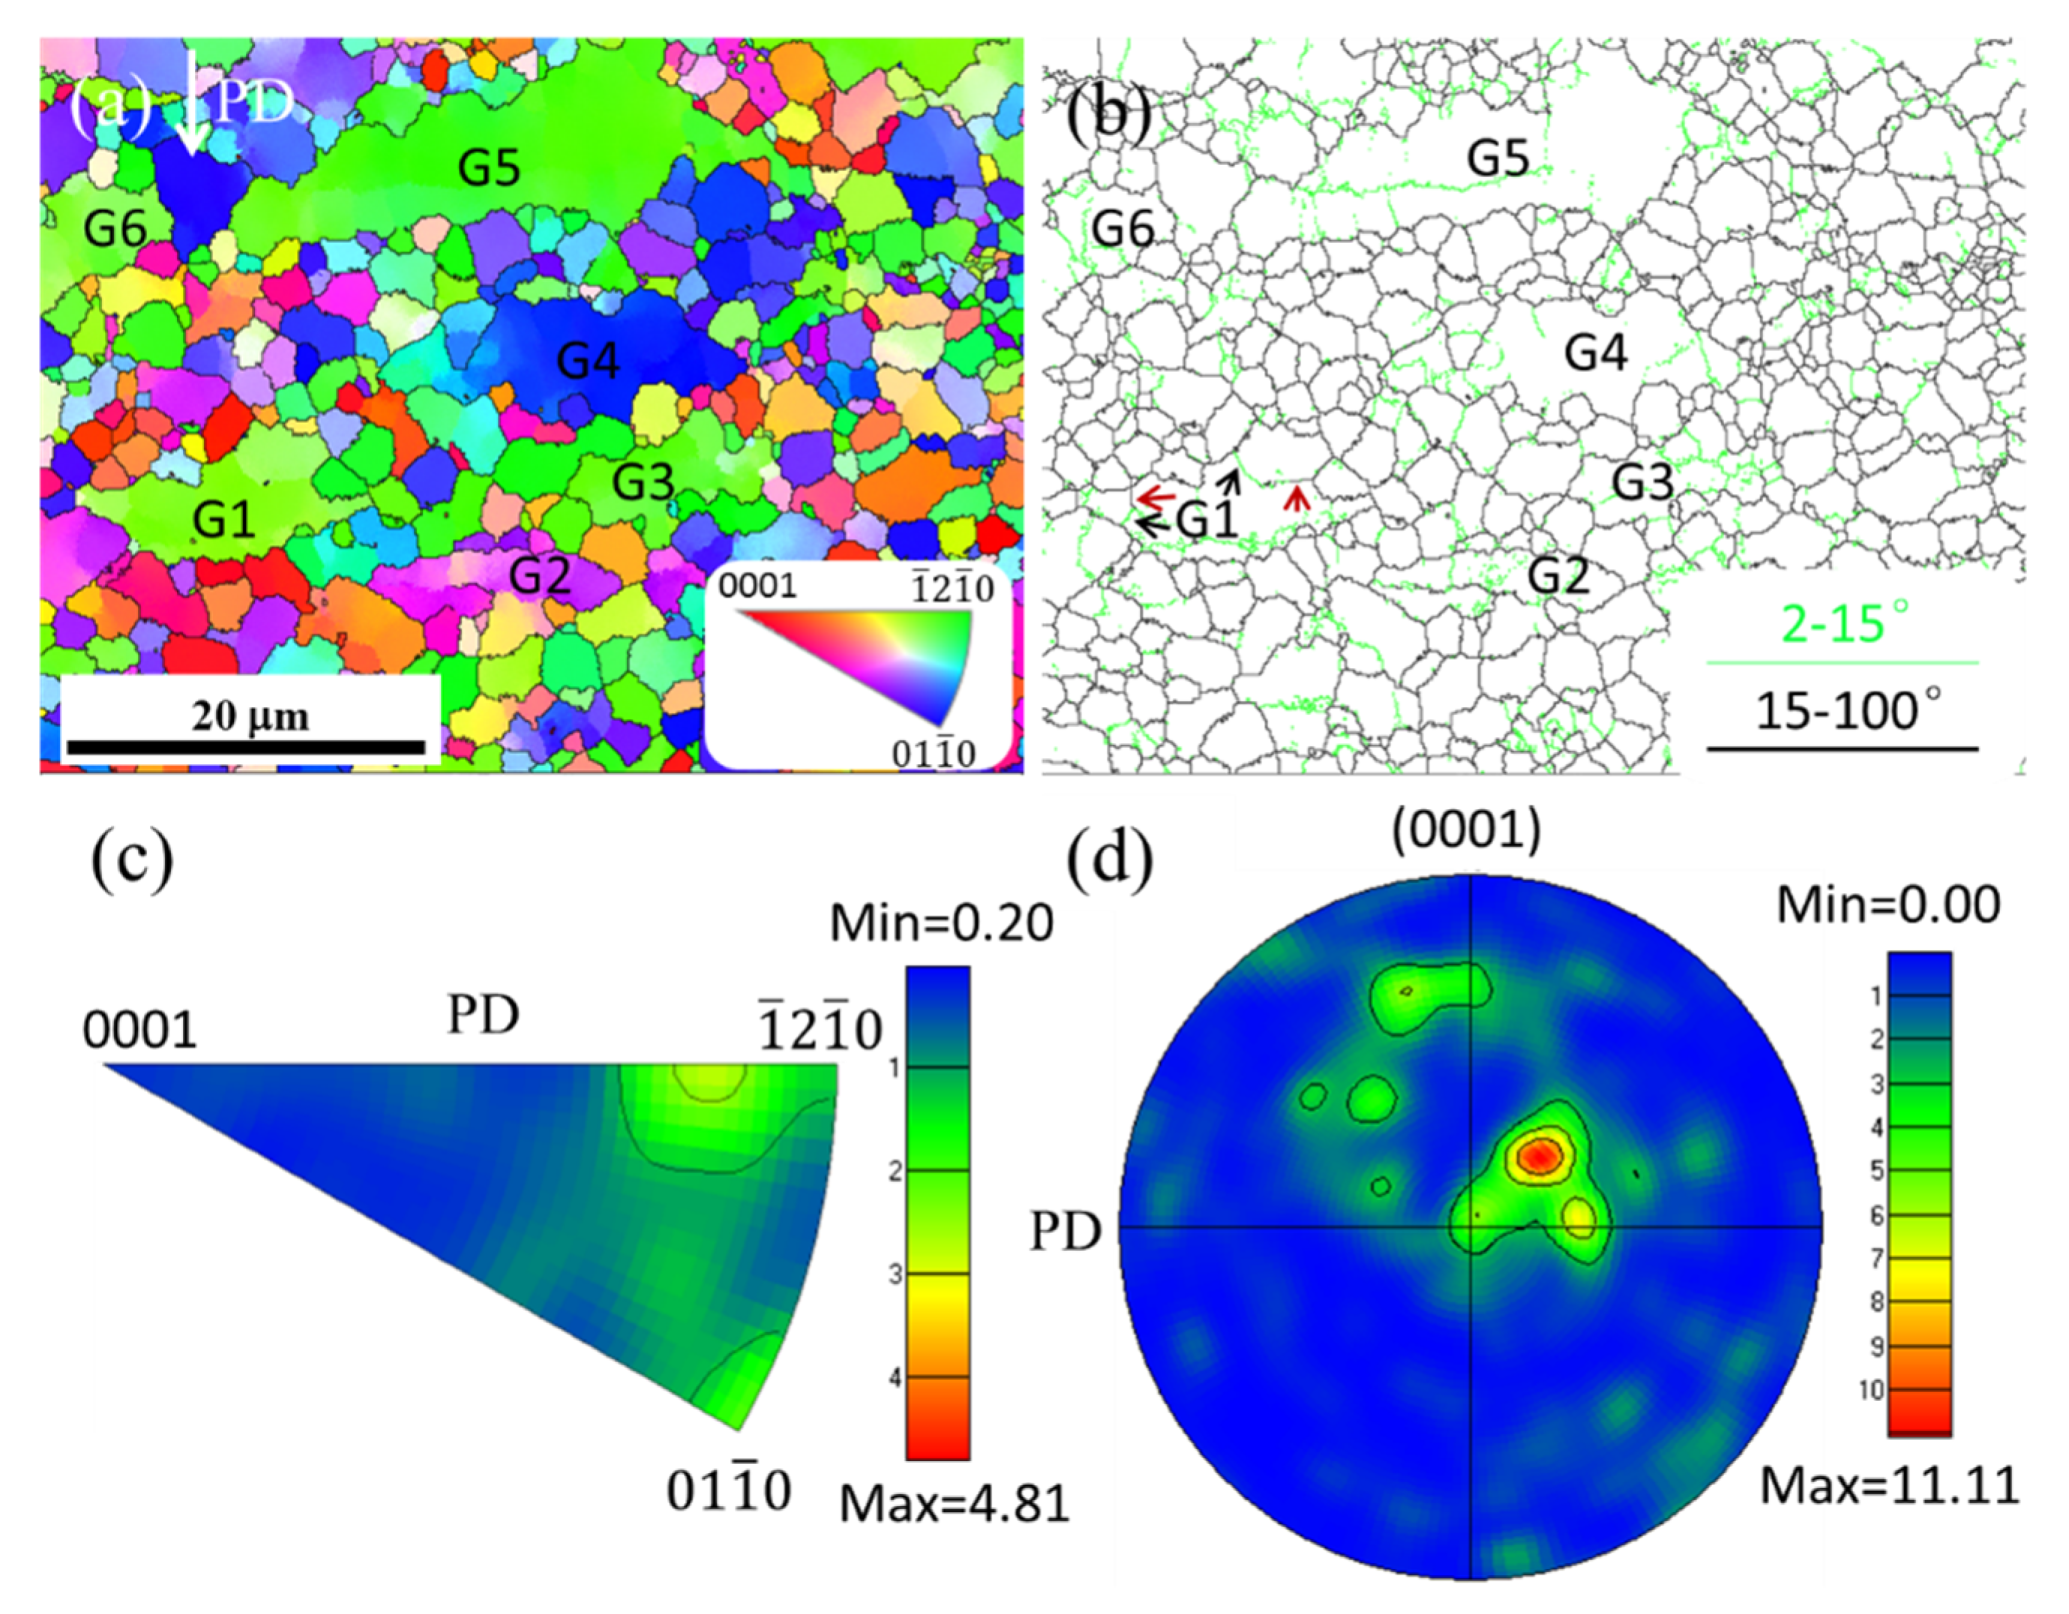
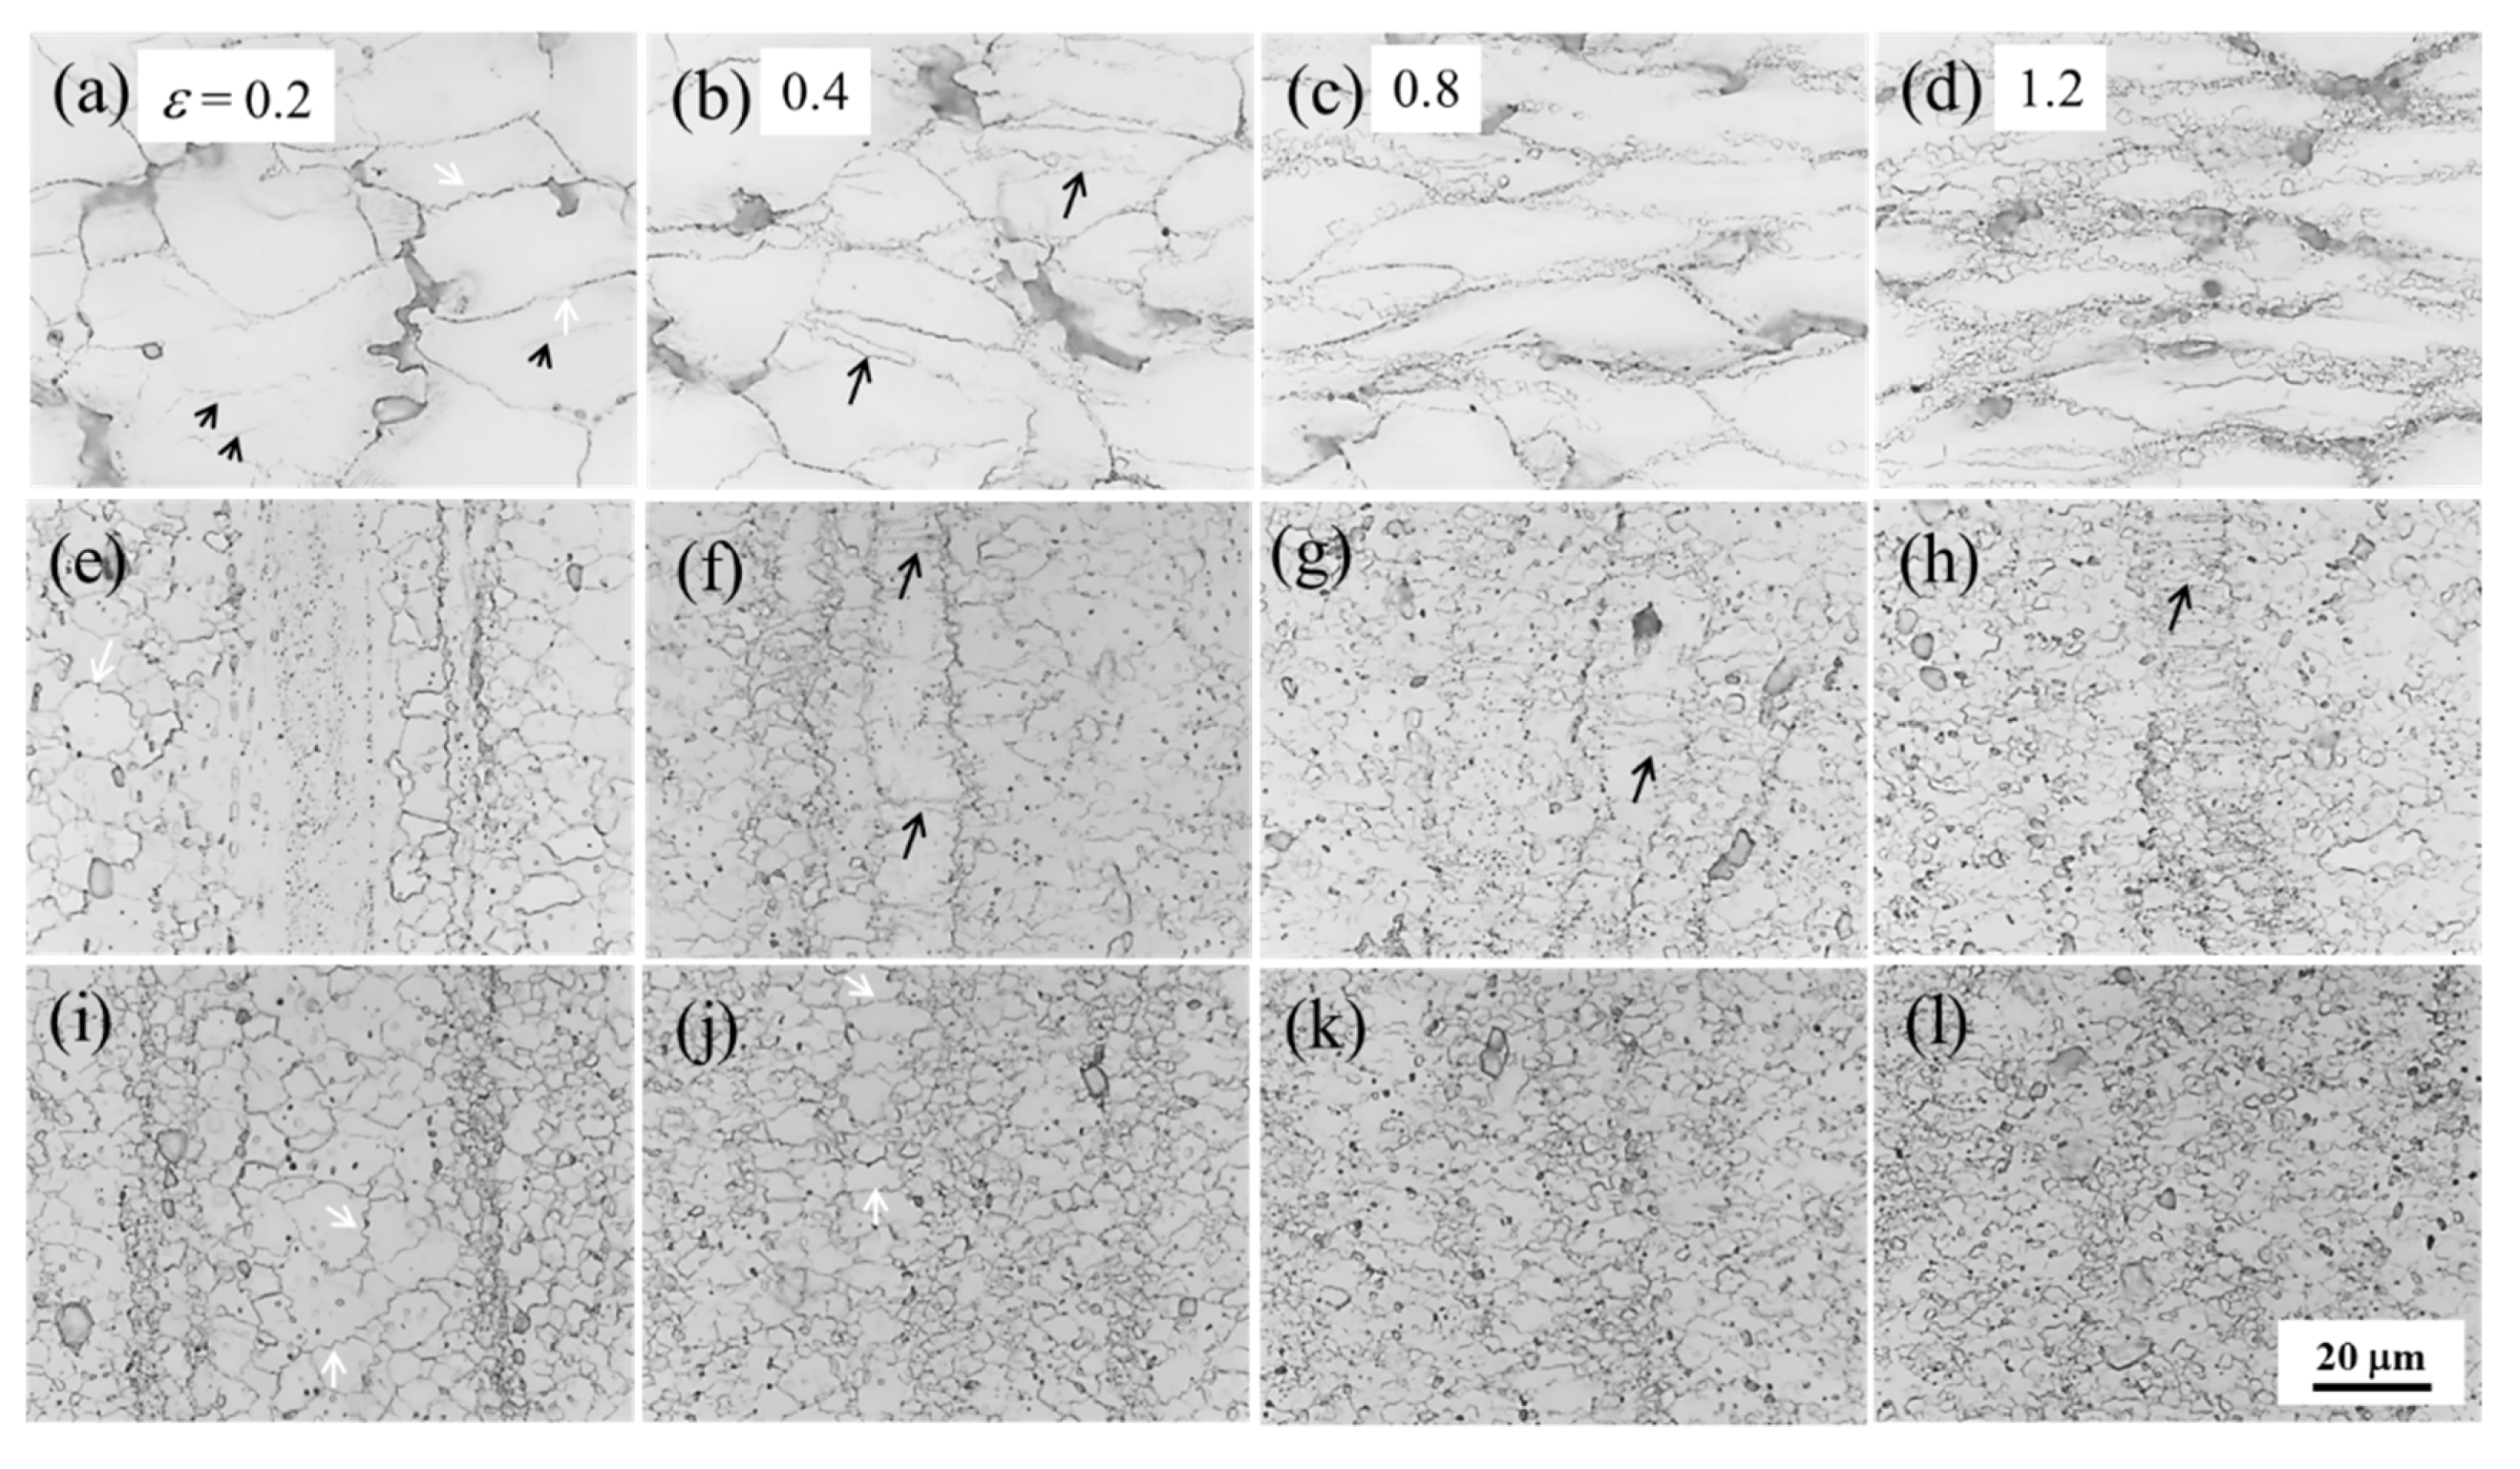
3.3. Microstructure Evolution

After being compressed at various strain rates of 0.05, 0.5, and 5 s−1 up to a true strain of 1.0, the typical microstructures of the WE43 alloy in the as-cast (AC), as-extruded Ex-1 and Ex-2 conditions are shown in Figure 8. Within the as-cast (AC) material, fine DRXed grains were formed around the pancake-like coarse deformed grains at all of these strain rates (Figure 8a–c). It indicates a partial DRX, which results in the formation of a typical necklace structure. The necklace structure is also observed for the as-extruded Ex-1 and Ex-2 materials when compressed at a high strain rate of 0.5 and 5 s−1 (Figure 8e,f,h,i), respectively). In particular, large numbers of boundaries almost in parallel are observed within the coarse elongated grains of the as-extruded Ex-1 material, which are nearly normal to the compression direction and divide the elongated coarse grains (as shown in Figure 8d–f). Only for the Ex-2 material at the low strain rate of 0.05 s−1 does it obtain a relative homogenous grain structure (Figure 8g). It is observed that the fine DRXed grains have been mainly formed at the grain boundaries. Furthermore, the DRXed grain size (dDRX) is obviously reduced with the strain rate increase. The cause is made possible so that a higher dislocation density can be introduced into the material at a higher strain rate, which results in an earlier formation of subgrains and subsequently the finer DRX grains. In addition, a higher strain rate provides a shorter time for the growth of the new grains. These two causes are all beneficial to the finer dDRX. It is interesting to note that at the same strain rate all of the three materials have a similar dDRX. This is consistent with the previous reports [34,35].
The microstructure evolution as a function of strain at a strain rate of 0.05s−1 for the AC, Ex-1, and Ex-2 materials is shown in Figure 9, respectively. As the strain is 0.2, in the coarse-grained AC material, a portion of original grain boundaries has become serrated and a number of bulges at these serrated grain boundaries can be observed (indicated by white arrows in Figure 9a). This similar feature is also possessed by the Ex-1 and Ex-2 materials, especially within the relatively large grains. The bulged areas would be expected to develop into new DRX grains and indicates the initiation of DRX. This indicates a typical discontinuous DRX (DDRX) mechanism [36,37,38]. Besides, new boundaries are found to dissect the coarse deformed grains within the AC material (indicated by black arrows in Figure 9a). However, few of these featured boundaries are observed in the Ex-1 and Ex-2 materials (Figure 9e,i); they have been reported as high angular grain boundaries (HAGBs, θ ≥ 15°) in an extruded WE43 alloy [28]. However, in the initial microstructure of the present as-extruded Ex-1 WE43 alloy, only LAGBs are found within the coarse elongated grains, which was observed by EBSD (Figure 5b). With the strain increase to 0.4, these featured boundaries are also observed within the coarse elongated grains in the Ex-1 material. They are almost parallel to each other and divide the elongated grain into lamellar structure (indicated by black arrows in Figure 9f). With the increase in strain, its density is largely increased and leads to a fine lamellar structure within the elongated grain (Figure 9g,h). Meanwhile, the formation of DRXed grains around the pancake-like deformed grain boundaries can be obviously observed in all of these materials when the strain increases to 0.8, especially for the AC material (Figure 9c,g,k). After a strain of 1.2, a typical necklace structure, i.e., many DRXed grains surrounding the pancake-like deformed grains, is produced for the AC material (Figure 9d). In contrast, the Ex-1 material consists of a fine grain structure and a small portion of fine lamellar structure, which originated from the initial coarse elongated grains (Figure 9h). For the Ex-2 material, a uniform fine grain structure is obtained (Figure 9l). It is evident that the DRX grain volume fraction increases with the strain. A previous report indicates that it increases with strain in a sigmoid curve [35]. For the Ex-2 material, an almost fully fine DRXed microstructure is obtained after a strain of 1.2. Under the same strain, the DRX volume fraction is relatively higher than that of the AC material. This is because the fine grain boundaries can provide more effective nucleation sites for DRX in the extruded material. The higher nucleation density can accelerate the kinetic of DRX.
Figure 10 presents the size and distribution evolution of second phase within the AC, Ex-1 and Ex-2 materials after a true strain of 0.4 and 1.2. Under the compression deformation, the eutectic phase within the AC material was resolved into many small particles with the strain increase up to 1.2 (Figure 10a,b). For the Ex-1 and Ex-2 materials, the large particles are observed to fragment and the fine particle strips consisted of particles along the ED are evenly distributed within the matrix with the strain increase (Figure 10c–f). In addition, the solid solubility of the rare earths (Y, Nd, and Gd) would increase in these materials at the high deformation temperature of 400 °C. It is well known that the solute and second phase could have an effect on the deformation mechanism, and that this further affects the recrystallization behavior and texture [31].
The microstructure and texture evolution of the AC, Ex-1 and Ex-2 materials at the strain of 1.2 were further investigated by EBSD. Figure 11 shows a typical EBSD analysis of the compressed AC material and the compression direction is assigned as PD in the figure. The typical necklace structure consisted of coarse deformed grains (assigned as G1-5 in the figure), and surrounding the structure with fine DRX grains means that it can be more clearly observed from the IPF and its corresponding boundary map (Figure 11a,b). The coarse deformed grains contain a high density of LAGBs that developed during deformation, while most of the surrounding small DRX grains contain little or no deformation substructure of LAGBs. The average DRX grain size is about 3 μm. Within the G1 grain, six grain boundary bulges are indicated by black and red arrows (Figure 11a,b). For three bulges (indicated by black arrows), their bridging subgrain boundaries have been developed as seen from the boundary map (Figure 11b). Furthermore, the bridging boundaries of the other three bulges (indicated by red arrows) have been developed to HAGBs and become three new grains (Figure 11 b). This clearly indicates the operating of the conventional DDRX, which has been identified in Mg alloys by a number of workers [36,37,38]. It is further observed that the three new DRX grains have the same green color as the parent G1 grain, which indicates they own similar orientation (Figure 11a). Combined with the IPF (Figure 11c) and (0001) PF (Figure 11d), it can find that they lead to the formation of (0001) < 1 ¯ 2 1 ¯ 0> fiber texture. The reason is that the hexagonal crystal structure of WE43 alloy severely limits its available slip systems and slip occurs predominantly on the basal planes, which leads to their alignment parallel to the direction of material flow. Within the G2-4 grains, a number of LAGBs divides the coarse parent grains (seen from the Figure 11b) into subgrains, which consist of LAGBs and partly of parent HAGBs. Its formation mechanism is also consistent with the DDRX. It is worth noting that a relative large disorientation indicated by different colors is formed between the subgrains in the G2 grain. This implies the orientation of these new DRX grains can be modified during the subsequent growth. Thus, it is observed that the DRX grains own different colors, i.e., different orientations, and result in no special texture. However, the (0001) PF indicates a relative strong (0001) < 1 ¯ 2 1 ¯ 0> fiber texture (Figure 11d), which is very different with the initial random texture (Figure 4d). This is also because that the texture intensity mainly depends on the texture state of the unDRXed regions (i.e., deformed parent grains).
For the compressed Ex-1 material, an EBSD analysis is presented in Figure 12. Necklace structure of fine DRX grains along the coarse deformed parent grains (assigned as G1-6 in the figure) is also formed within the Ex-1 material (seen from the Figure 12a,b). In addition, the DRX grain has a similar average grain size of about 3 μm to the AC material. It is also found that a large number of LAGBs divides the G1-6 deformed parent grains. Within the G1 grain, the bridging subgrain boundaries of two bulges have been partially developed into HAGBs (indicated by red arrows in Figure 12b). The feature highlights the DDRX mechanism. From the IPF and (0001) PF (Figure 12c,d), there is an RE texture. It is typically developed within the Mg-RE alloys. Due to the DRX, the original <10 1 ¯ 0> fiber texture has largely transformed into the RE texture. Figure 13 displays a typical EBSD analysis of the compressed Ex-2 material. It is observed that a relative homogeneous grain structure is obtained. A number of LAGBs is contained in the relative large grains like the G1-4 grains indicated in the figure and divides the deformed grains into a few subgrains (Figure 13b). The DRX mechanism can be classified as the DDRX. A relative random texture is formed in the Ex-2 material as compared to the initial texture from the IPF and (0001) PF (Figure 13c,d). This is due to the relative full DRX.

4. Conclusions

In present work, the hot deformation behavior and microstructure evolution of as-cast (AC) and as-extruded (Ex) WE43 alloy has been studied by means of a compressive test at a temperature of 400 °C with strain rates of 0.05–5.0 s−1. The Ex-1 material has a mixture of random oriented fine DRX grains and textured coarse elongated grains, while the Ex-2 material consists of relative homogeneous random oriented fine DRX grains. The results are summarized as below:
(1)
The AC material obtains the largest σp and strain to the σp (εp), while the Ex-2 material has the lowest value and the middle value is obtained for the Ex-1 material at every strain rate.
(2)
The necklace structures of fine DRXed grains along pancake-like deformed grains were obtained in the AC material at all of these strain rates and also formed in the Ex-1 and Ex-2 materials at a high strain rate of 0.5 and 5 s-1. It is worth noting that a lamellar structure was formed within the coarse elongated grain in the Ex-1 material and its density was increased with the strain. Only at a low strain rate of 0.05 s-1 did the Ex-2 material achieve a relatively more homogeneous fine grain structure than that of the initial microstructure after true strain of 1.0.
(3)
Within all of these materials, the original grain boundaries have been found to serrate and form a number of bulges at a strain rate of 0.05 s-1. Furthermore, their bridging boundaries were partially or fully developed into high angle boundaries with the increase in strain. This mainly indicates the discontinuous DRX mechanism.
(3)
After a true strain of 1.2 at a strain rate of 0.05 s-1, the AC material has a (0001) < 1 ¯ 2 1 ¯ 0> fiber texture due to a large fraction of unDRXed grains; the Ex-1 material has a typical rare earth (RE) texture from the high percentage of DRX grains and a relatively random texture forms in the Ex-2 material after a full DRX.

Author Contributions

Conceptualization, Y.K., Z.H. and H.Z.; investigation, Y.K.; writing—original draft preparation, Y.K.; Data curation, N.Z.; formal analysis, C.G.; resources, K.Z. and S.W.; writing—review and editing, J.Z., F.P. and J.C.H. All authors have read and agreed to the published version of the manuscript.

Funding

This research was funded by the Guangzhou science and technology planning project (Grant No. 201904010309), GDAS’ Project of Science and Technology Development (Grants No. 2018GDASCX-0117 and 2019GDASYL-0203002) and Zhaoqing science and technology planning project (Grant No. 2018K006).

Conflicts of Interest

The authors declare no conflict of interest.

References

  1. King, J.F. Magnesium: Commodity or exotic? Mater. Sci. Technol. 2007, 23, 1–14. [Google Scholar] [CrossRef]
  2. Mengucci, P.; Barucca, G.; Riontino, G.; Lussana, D.; Massazza, M.; Ferragut, R.; Aly, E.H. Structure evolution of a WE43 Mg alloy submitted to different thermal treatments. Mater. Sci. Eng. A 2008, 479, 37–44. [Google Scholar] [CrossRef]
  3. Kang, Y.-H.; Yan, H.; Chen, R.-S. Effects of heat treatment on the precipitates and mechanical properties of sand-cast Mg–4Y–2.3Nd–1Gd–0.6Zr magnesium alloy. Mater. Sci. Eng. A 2015, 645, 361–368. [Google Scholar] [CrossRef]
  4. Kang, Y.H.; Yan, H.; Chen, R.S. Creep behavior and microstructure evolution of Sand–Cast Mg–4Y–2.3Nd–1Gd–0.6Zr alloy crept at 523–573 K. J. Mater. Sci. Technol. 2017, 33, 79–89. [Google Scholar] [CrossRef]
  5. Mohri, T.; Mabuchi, M.; Saito, N.; Nakamura, M. Microstructure and mechanical properties of a Mg-4Y-3RE alloy processed by thermo-mechanical treatment. Mater. Sci. Eng. A 1998, 257, 287–294. [Google Scholar] [CrossRef]
  6. Panigrahi, S.K.; Yuan, W.; Mishra, R.S.; DeLorme, R.; Davis, B.; Howell, R.A.; Cho, K. A study on the combined effect of forging and aging in Mg–Y–RE alloy. Mater. Sci. Eng. A 2011, 530, 28–35. [Google Scholar] [CrossRef]
  7. Huang, X.; Suzuki, K.; Chino, Y. Static recrystallization and mechanical properties of Mg–4Y–3RE magnesium alloy sheet processed by differential speed rolling at 823 K. Mater. Sci. Eng. A 2012, 538, 281–287. [Google Scholar] [CrossRef]
  8. Kumar, N.; Choudhuri, D.; Banerjee, R.; Mishra, R.S. Strength and ductility optimization of Mg–Y–Nd–Zr alloy by microstructural design. Int. J. Plast. 2015, 68, 77–97. [Google Scholar] [CrossRef]
  9. Salandari-Rabori, A.; Zarei-Hanzaki, A.; Fatemi, S.M.; Ghambari, M.; Moghaddam, M. Microstructure and superior mechanical properties of a multi-axially forged WE magnesium alloy. J. Alloy. Compd. 2017, 693, 406–413. [Google Scholar] [CrossRef]
  10. Asqardoust, S.; Hanzaki, A.Z.; Abedi, H.R.; Krajnak, T.; Minarik, P. Enhancing the strength and ductility in accumulative back extruded WE43 magnesium alloy through achieving bimodal grain size distribution and texture weakening. Mater. Sci. Eng. A 2017, 698, 218–229. [Google Scholar] [CrossRef]
  11. Martynenko, N.S.; Lukyanova, E.A.; Serebryany, V.N.; Gorshenkov, M.V.; Shchetinin, I.V.; Raab, G.I.; Dobatkin, S.V.; Estrin, Y. Increasing strength and ductility of magnesium alloy WE43 by equal-channel angular pressing. Mater. Sci. Eng. A 2018, 712, 625–629. [Google Scholar] [CrossRef]
  12. Sabat, R.K.; Samal, P.K.; Ahamed, M.S. Effect of strain path on the evolution of microstructure, texture and tensile properties of WE43 alloy. Mater. Sci. Eng. A 2018, 715, 348–358. [Google Scholar] [CrossRef]
  13. Chapuis, A.; Driver, J.H. Temperature dependency of slip and twinning in plane strain compressed magnesium single crystals. Acta Mater. 2011, 59, 1986–1994. [Google Scholar] [CrossRef]
  14. Wang, L.; Fang, G.; Leeflang, S.; Duszczyk, J.; Zhou, J. Investigation into the hot workability of the as-extruded WE43 magnesium alloy using processing map. J. Mech. Behav. Biomed. Mater. 2014, 32, 270–278. [Google Scholar] [CrossRef]
  15. Jahedi, M.; McWilliams, B.A.; Kellogg, F.R.; Beyerlein, I.J.; Knezevic, M. Rate and temperature dependent deformation behavior of as-cast we43 magnesium-rare earth alloy manufactured by direct-chill casting. Mater. Sci. Eng. A 2018, 712, 50–64. [Google Scholar] [CrossRef]
  16. Schreiber, M.; Molodov, K.D.; Al-Samman, T.; Korte-Kerzel, S.; Molodov, D.A. Impact of grain boundaries on microstructure evolution during deformation of a magnesium tricrystal. Mater. Sci. Eng. A 2019, 742, 295–304. [Google Scholar] [CrossRef]
  17. Prasad, Y.V.R.K.; Rao, K.P.; Sasudhara, S. Hot Working Guide: A Compendium of Processing Maps, 2rd ed.; ASM International: Cleveland, OH, USA, 2015; pp. 2–10. [Google Scholar]
  18. Prasad, Y.V.R.K.; Rao, K.P. Effect of homogenization on the hot deformation behavior of cast AZ31 magnesium alloy. Mater. Des. 2009, 30, 3723–3730. [Google Scholar] [CrossRef]
  19. Prasad, Y.V.R.K.; Rao, K.P.; Hort, N.; Kainer, K.U. Effect of thermal and mechanical treatments on the hot working response of Mg-3Sn-1Ca alloy. Int. J. Mater. Res. 2010, 101, 300–306. [Google Scholar] [CrossRef]
  20. Tang, W.N.; Chen, R.S.; Han, E.H. Hot deformation behavior and hot workability of Mg-Y-Nd-Zr alloy. Acta Metall. Sin. 2006, 42, 1096–1100. [Google Scholar]
  21. Avadhani, G.S.; Tapase, S.; Suwas, S. Hot deformation processing and texture in magnesium alloy WE43. IFAC Proc. Vol. 2013, 46, 208–213. [Google Scholar] [CrossRef]
  22. Apps, P.J.; Karimzadeh, H.; King, J.F.; Lorimer, G.W. Phase compositions in magnesium-rare earth alloys containing yttrium,gadolinium or dysprosium. Scr. Mater. 2003, 48, 475–481. [Google Scholar] [CrossRef]
  23. Koltygin, A.V.; Belov, V.D.; Bazhenov, V.E. Effect of the rate of crystallization cooling ofa Mg-Zr addition alloy on the structure of magnesium alloys containing rem. Met. Sci. Heat Treat. 2014, 56, 381–386. [Google Scholar] [CrossRef]
  24. Zhu, S.-M.; Nie, J.F.; Gibson, M.A.; Easton, M.A. On the unexpected formation of rare earth hydrides in magnesium-rare earth casting alloys. Scr. Mater. 2014, 77, 21–24. [Google Scholar] [CrossRef]
  25. Li, J.-L.; Zhang, N.; Wang, X.-X.; Wu, D.; Chen, R.-S. Effect of solution treatment on the microstructure and mechanical properties of sand-cast Mg-9Gd-4Y-0.5Zr alloy. Acta Metall. Sin. Engl. Lett. 2018, 31, 189–198. [Google Scholar] [CrossRef]
  26. Kubasek, J.; Dvorsky, D.; Cavojsky, M.; Roudnicka, M.; Vojtech, D. WE43 magnesium alloy - material for challenging applications. Kov. Mater. Met. Mater. 2019, 57, 159–165. [Google Scholar] [CrossRef] [Green Version]
  27. Jiang, H.S.; Zheng, M.Y.; Qiao, X.G.; Wu, K.; Peng, Q.Y.; Yang, S.H.; Yuan, Y.H.; Luo, J.H. Microstructure and mechanical properties of WE43 magnesium alloy fabricated by direct-chill casting. Mater. Sci. Eng. A 2017, 684, 158–164. [Google Scholar] [CrossRef]
  28. Ball, E.A.; Prangnell, P.B. Tensile-compressive yield asymmetries in high strength wrought magnesium alloys. Scr. Mater. 1994, 31, 111–116. [Google Scholar] [CrossRef]
  29. Imandoust, A.; Barrett, C.D.; Al-Samman, T.; Inal, K.A.; El Kadiri, H. A review on the effect of rare-earth elements on texture evolution during processing of magnesium alloys. J. Mater. Sci. 2017, 52, 1–29. [Google Scholar] [CrossRef]
  30. Gao, J.; Wang, Q.; Wang, Y.; Li, W.; Niu, W. Microstructure and kinetics of hot deformation WE43 magnesium alloy. Rare Met. 2008, 27, 405–409. [Google Scholar] [CrossRef]
  31. Humphreys, F.J.; Hatherly, M. Recrystalization and Related Annealing Phenomena, 2rd ed.; Elsevier: Boston, MA, USA, 2004; pp. 285–319. [Google Scholar]
  32. Chen, Y.; Tekumalla, S.; Guo, Y.B.; Shabadi, R.; Shim, V.P.W.; Gupta, M. The dynamic compressive response of a high-strength magnesium alloy and its nanocomposite. Mater. Sci. Eng. A 2017, 702, 65–72. [Google Scholar] [CrossRef]
  33. Agnew, S.R.; Mulay, R.P.; Polesak, F.J.; Calhoun, C.A.; Bhattacharyya, J.J.; Clausen, B. In situ neutron diffraction and polycrystal plasticity modeling of a Mg-Y-Nd-Zr alloy: Effects of precipitation on individual deformation mechanisms. Acta Mater. 2013, 61, 3769–3780. [Google Scholar] [CrossRef]
  34. Takigawa, Y.; Honda, M.; Uesugi, T.; Higashi, K. Effect of initial grain size on dynamically recrystallized grain size in AZ31 magnesium alloy. Mater. Trans. 2008, 49, 1979–1982. [Google Scholar] [CrossRef] [Green Version]
  35. Wu, W.X.; Jin, L.; Dong, J.; Zhang, Z.Y.; Ding, W.J. Effect of initial microstructure on the dynamic recrystallization behavior of Mg–Gd–Y–Zr alloy. Mater. Sci. Eng. A 2012, 556, 519–525. [Google Scholar] [CrossRef]
  36. Sitdikov, O.; Kaibyshev, R. Dynamic recrystallization in pure magnesium. Mater. Trans. 2001, 42, 1928–1937. [Google Scholar] [CrossRef] [Green Version]
  37. Galiyev, A.; Kaibyshev, R.; Gottstein, G. Correlation of plastic deformation and dynamic recrystallization in magnesium alloy ZK60. Acta Mater. 2001, 49, 1199–1207. [Google Scholar] [CrossRef]
  38. Beer, A.G.; Barnett, M.R. Microstruetural development during hot working of Mg-3Al-1Zn. Metall. Mater. Trans. A 2007, 38A, 1856–1867. [Google Scholar] [CrossRef]
Figure 1. Typical (a) optical microscopy (OM) and (b) scanning electron microscopy (SEM) microstructures of the as-cast (AC) WE43 alloy with EDS analysis of Zr-rich and Y-rich particles in (c) and (d), respectively. The direct-chill casting direction (DC) is horizontal in picture (a).
Metals 10 00429 g001
Figure 2. Typical microstructures of the as-extruded Ex-1 WE43 alloy with partially dynamic recrystallization: (a,c,e) longitudinal direction, i.e., extrusion direction (ED), and (b,d,f) transverse direction.
Metals 10 00429 g002
Figure 3. Typical microstructures of the as-extruded Ex-2 WE43 alloy with fully dynamic recrystallization: (a,c,e) longitudinal direction, i.e., extrusion direction (ED), and (b,d,f) transverse direction.
Metals 10 00429 g003
Figure 4. Inverse pole figure (IPF) map (a) of the as-cast (AC) WE43 alloy along with its corresponding (b) boundary map, (c) typical IPF, and (d) (0001) basal pole figure (PF). The direct-chill casting direction (DC) is horizontal and the IPF map legend in picture (a) applies to all of the following IPF maps in this paper. The green and black color in picture (b) indicates the low and high angle grain boundaries, respectively (the same below). The color scale contours in pictures (c) and (d) represent multiples of a random distribution (similarly hereinafter).
Metals 10 00429 g004
Figure 5. Inverse pole figure (IPF) map (a) of the as-extruded Ex-1 WE43 alloy along with its corresponding (b) boundary map, (c) typical IPF, and (d) (0001) basal pole figure (PF). The extrusion direction (ED) is horizontal in picture (a).
Metals 10 00429 g005
Figure 6. Inverse pole figure (IPF) map (a) of the as-extruded Ex-2 WE43 alloy along with its corresponding (b) boundary map, (c) typical IPF, and (d) (0001) basal pole figure (PF). The extrusion direction (ED) is horizontal in picture (a).
Metals 10 00429 g006
Figure 7. True stress–true strain curves at various strain rates of 0.05-5 s−1 with a constant temperature of 400 °C for the (a) AC, (b) Ex-1, and (c) Ex-2 WE43 alloy, respectively. Their comparisons at a strain rate of 0.05 s−1, 0.5 s−1, and 5 s−1 are shown in (d), (e), and (f), respectively.
Metals 10 00429 g007
Figure 8. Typical microstructures after being compressed up to a true strain of 1.0 at various strain rates of 0.05, 0.5, and 5 s−1 for (a-c) AC, (d-f) Ex-1, and (g-i) Ex-2 WE43 alloy, respectively.
Metals 10 00429 g008
Figure 9. Typical microstructures after being compressed at a strain rate of 0.05 s−1 with various true strains of 0.2, 0.4, 0.8, and 1.2 for (ad) AC, (eh) Ex-l, and (il) Ex-2 WE43 alloy, respectively.
Metals 10 00429 g009
Figure 10. Typical SEM microstructures after compressed at a strain rate of 0.05 s−1 with different true strains of 0.4 and 1.2 for (a, b) AC, (c, d) Ex-1 and (e, f) Ex-2 WE43 alloy, respectively.
Metals 10 00429 g010
Figure 11. Inverse pole figure (IPF) map (a) of the compressed AC WE43 alloy after true strain of 1.2 with strain rate of 0.05 s−1 along with its corresponding (b) boundary map, (c) typical IPF and (d) (0001) basal pole figure (PF). The compression direction (PD) is shown in picture (a) (the same below).
Metals 10 00429 g011
Figure 12. Inverse pole figure (IPF) map (a) of the compressed Ex-1 WE43 alloy after a true strain of 1.2 with a strain rate of 0.05 s−1 along with its corresponding (b) boundary map, (c) typical IPF, and (d) (0001) basal pole figure (PF).
Metals 10 00429 g012
Figure 13. Inverse pole figure (IPF) map (a) of the compressed Ex-2 WE43 alloy after a true strain of 1.2 with a strain rate of 0.05 s−1 along with its corresponding (b) boundary map, (c) typical IPF, and (d) (0001) basal pole figure (PF).
Metals 10 00429 g013
Table 1. The flow stress and strain rate sensitivity, m, of the three WE43 alloy materials at strains of 2%, 10%, and 30% when compressed at 400 °C (LRS: low strain rate of 0.05 s−1; HRS: high strain rate of 0.5 s−1).
Flow Stress (MPa)Strain Rate Sensitivity, m
2%10%30%2%10%30%
ACLRS98 ± 4.5106 ± 3.0110 ± 5.00.08070.13900.1938
HRS118 ± 6.5146 ± 7.0168 ± 5.5
Ex-1LRS77 ± 2.573 ± 2.068 ± 3.50.13880.22660.2814
HRS106 ± 4.0123 ± 5.4130 ± 3.6
Ex-2LRS67 ± 2.063 ± 3.261 ± 2.50.16070.23410.2600
HRS97 ± 5.0108 ± 4.8111 ± 6.5
Table 2. Comparison of the peak stress (σp) and strain (εp) achieved by the AC, Ex-1 and Ex-2 specimens when compressed at 400 °C and various strain rates of 0.05, 0.5, and 5 s−1.
Condition0.05 s−10.5 s−15 s−1
σp (MPa)εpσp (MPa)εpσp (MPa)εp
AC109 ± 4.00.23 ± 0.05172 ± 5.20.37 ± 0.07192 ± 10.10.23 ± 0.03
Ex-177 ± 3.50.01 ± 0.01130 ± 4.00.23 ± 0.05166 ± 8.30.21 ± 0.03
Ex-268 ± 2.60.01 ± 0.01111 ± 5.10.14 ± 0.02143 ± 6.10.21 ± 0.02

