Article

In Situ Measurements for Plastic Zone Ahead of Crack Tip and Continuous Strain Variation under Cyclic Loading Using Digital Image Correlation Method

1
Research Institute of Aero-engine, Beihang University, 37 Xueyuan Rd., Haidian Dist., Beijing 100191, China
2
School of Energy and Power Engineering, Beihang University, 37 Xueyuan Rd., Haidian Dist., Beijing 100191, China
3
School of Reliability and Systems Engineering, Beihang University, 37 Xueyuan Rd., Haidian Dist., Beijing 100191, China
*
Author to whom correspondence should be addressed.
Metals 2020, 10(2), 273; https://doi.org/10.3390/met10020273
Submission received: 24 December 2019 / Revised: 12 February 2020 / Accepted: 17 February 2020 / Published: 19 February 2020

Abstract

:
Fatigue crack is one of the most common damage forms for aeronautical aluminum alloy. With crack propagation, the strain fields of the whole object surface and plastic zone (PZ) ahead of the crack tip are changing continuously. For most metallic materials, the behavior of PZ around the crack tip and continuous strain variation play a vital role in crack propagation. In this work, the “continuous” strain information at and in front of the crack tip on the specimen surface was obtained quantitatively and the PZ size ahead of crack tip was in situ measured quantitatively with crack propagation by using the digital image correlation (DIC) method, which overcomes the difficulty for the in situ measurement of mechanical variables. Moreover, the method of specimen preparation was simplified by using a white matt paint with strong adhesion, but also resulted in a higher resolution being shown, even for such a large area. Furthermore, the experimental results of the PZ size from the proposed method had good agreement with the theoretical values, which overcomes the limitation that the conventional approaches only consider the quasi-static crack. Finally, the continuous strain variation behavior was analyzed from the experimental results in detail with the consideration of crack propagation.

1. Introduction

Aluminum alloy is one of the most commonly used materials in aeronautical structures [1]. Different types of damage (such as cracks, corrosion, pits, wear, etc.) always occur during service. Among the damages, fatigue cracks are one of the most common damage forms for geometrical notches, which cause the stress concentration [2]. With fatigue crack propagation, not only do the mechanical properties of the whole structure decrease gradually, but also the non-uniform stress/strain field on the structure surface changes continuously [3]. However, there are few studies on quantitative in situ measurements of the plastic zone (PZ) near the crack tip and the continuous strain variation at and in front of the crack tip. In order to study the strain variation behavior at and in front of the crack tip with the fatigue crack propagation and in situ measure the PZ size, it is necessary to carry out “continuous” strain field and PZ size measurement with fatigue crack propagation under cyclic loading.
In this paper, the digital image correlation (DIC) method was used to in situ measure the continuous strain variation and distribution of the object surface for the entire crack propagation process under cyclic loading. Moreover, the quantitative in situ measurements of the PZ size were implemented. The DIC method, the optical methods of full-field non-contact, was first proposed by Peters [4] and Yamaguchi [5] et al. in the 1980s. It realizes the measurement of displacement and strain in the deformation process by tracking the speckle image of the reference image and current image. The 2-dimensional DIC method offers many attractive and particular advantages such as simple data acquisition and specimen preparation, lower requirements for measurement environment, etc. The DIC, a representative non-interferometric optical technique, has been widely used for the above purpose as a powerful and flexible tool [6]. The strain localization around a hole was studied using the DIC method, but the measurement accuracy was lower and there was no crack propagation [7]. Vasco-Olmo et al. [8] measured the size and shape of the PZ near the crack tip based on the DIC method. However, their experiments were limited to measure that of the plastic zone under static load. Zhang et al. [9] proposed an in situ microscopy fatigue testing method to measure the size of the forward and reversed PZ under cyclic loadings for Al-7075-T6. However, only one loading cycle was studied during the experiment. Additionally, it pointed out that it is difficult to in situ monitor the mechanical variables with crack propagation [10]. Besel et al. [11,12] studied the different types of PZ (including the primary plastic zone, forward cyclic plastic zone, backward cyclic plastic zone, etc.) and energy accumulation near the crack tip under 30 loading cycles using the DIC method. The crack growth length was less than 0.1 mm in the experiment, and quasi-static loading was simulated. However, continuous strain field variation behavior and strain measurement have not been studied. Vanlanduit et al. [13] pointed out a method based on the DIC technique to monitor the crack length by measuring the displacement of the object surface during a fatigue test. The digital image of the DIC is captured by stroboscopic illumination when the sample is loaded dynamically. However, quantitative analysis could not be provided because the displacement values were not calibrated. This form of measurement puts forward higher requirements for experimental loading conditions and equipment, and may also reduce the accuracy of the measurements. Carroll et al. [14] implemented quantitative, full-field measurements of accumulated plastic strain near the crack tip by using the DIC technique. Moreover, the measurement results of the DIC method were linked to electron backscatter diffraction (EBSD) measurements of grain structure. However, the ex situ measurements were used in the fatigue crack growth experiments to measure strain accumulation. Errors are inevitably introduced when moving the specimen. In addition, the specimen preparation is also an important factor affecting the accuracy of the DIC results. Lagattu et al. [7] sprayed a special mixture containing very fine white and black powders on the specimen surface. William et al. [15] sprayed a layer of black paint on the specimen surface before spraying with white paint, however, the procedures of these spraying methods are complex, and the random distribution of speckle cannot be guaranteed.
Very few studies exist for the investigation of PZ near the crack tip variation with crack propagation and continuous strain variation at and in front of the crack tip by in situ fatigue testing and imaging analysis. The proposed approach has three key advantages over the state-of-the-art. First, the “continuous” strain measurement with fatigue crack propagation under cyclic loading is realized using the DIC method. Second, the plastic zone ahead of the crack tip is in situ measured quantitatively using the DIC method. The proposed approach overcomes the difficulty for the in situ measurement of structural mechanical variables. Third, for fatigue testing, the spray method of speckle specimens is simplified by using a white matt paint with strong adhesion, but also results in a higher resolution even for such a large area.
The rest of the paper is organized as follows. Section 2 provides the primary principle of the DIC method. Section 3 shows the experimental design including the specimen preparation, experimental setup, and data acquisition. Section 4 shows the continuous strain changes and the PZ size at the crack tip measured by the DIC experiments under cyclic loading. In Section 5, the conclusions formed in this paper are presented.

2. Digital Image Correlation (DIC) Theory

In 2-dimensional DIC, strain values are directly measured from the digital images of the specimen surface. The principle of the DIC method for strain measurement on the object surface is shown in Figure 1. First, when the digital image is not deformed, it should be taken as the “reference image”, and its deformed image under loading conditions should be captured as the “current image”. Then, the reference images and the current images are divided into very small parts (called subsets). The surface displacement and strain is measured by taking the subset of the reference image and determining their respective locations in the current image.
To establish the similarity metric between the final reference subset and final current subset, two most commonly metric criteria were introduced in the DIC method (i.e., normalized cross correlation (NCC) and inverse combination Gauss–Newton (IC-GN)) [16].
C C C = ( i , j ) S ( f ( x ˜ r e f i , y ˜ r e f j ) f m ) ( g ( x ˜ c u r i , y ˜ c u r j ) g m ) ( i , j ) S [ f ( x ˜ r e f i , y ˜ r e f j ) f m ] 2 ( i , j ) S [ g ( x ˜ c u r i , y ˜ c u r j ) g m ] 2
C L S = ( i , j ) S [ f ( x ˜ r e f i , y ˜ r e f j ) f m ( i , j ) S [ g ( x ˜ r e f i , y ˜ r e f j ) f m ] 2 g ( x ˜ c u r i , y ˜ c u r j ) g m ( i , j ) S [ g ( x ˜ c u r i , y ˜ c u r j ) g m ] 2 ] 2
where x ˜ r e f i and y ˜ r e f j are the coordinates of a deformed reference subset, and x ˜ c u r i and x ˜ c u r j are the current subset coordinates. The f and g are the grayscale intensity functions of the reference and current image at a given coordinate ( x ,   y ), respectively. Functions f m and g m are the mean grayscale values for the above-mentioned. The similarity metric is achieved by comparing the grayscale value of the reference subset and current subset. The NCC and IC-GN criteria were used to provide the initial guesses and further refinement, respectively [17].

3. Experimental Design

This section mainly introduces the experimental process of fatigue crack propagation based on the DIC method. The geometric structure, specimen preparation, experiment setup, and data acquisition are described in detail.

3.1. Material and Dimension of the Specimen

The specimen for the fatigue crack propagation experiment system was made of aluminum alloy 7075-T6, which has been widely used for aircraft. The main properties of the aluminum alloy 7075-T6 are presented in Table 1.
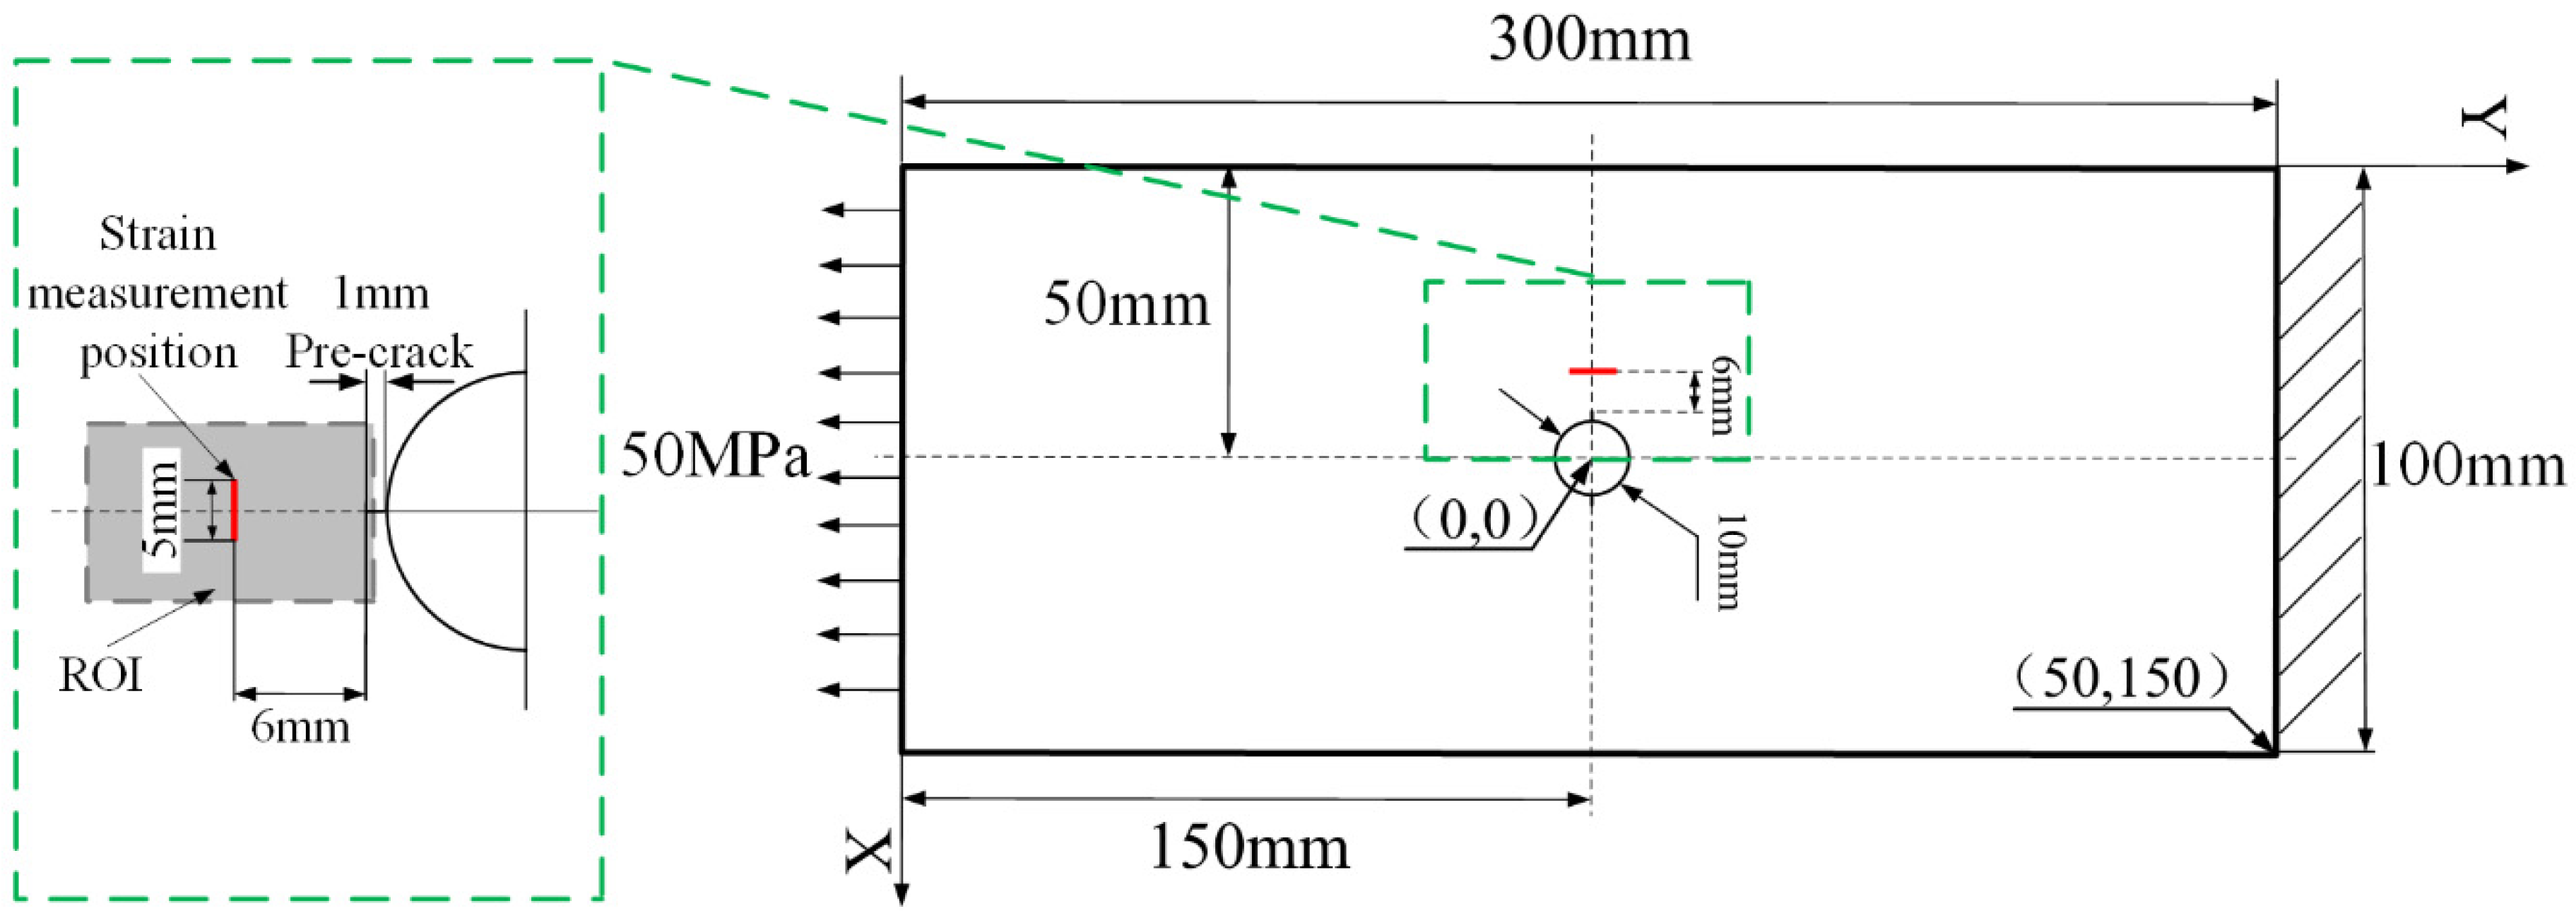
The dimensions of the specimen were 300   mm × 100   mm × 1   mm , and there is a hole with a diameter of 10 mm at the center of the specimen. In this paper, the center position of the hole was set to the coordinate origin (i.e., (0, 0)). The 0.1   mm × 1   mm pre-crack was introduced on both sides of the hole by electric discharge machining (EMD) to promote fatigue crack initiation. The detailed geometry of the specimen is shown in Figure 2. The gray area on the left side of the specimen is the region of interest (ROI), and the red area is the strain measurement position.

3.2. Specimen Preparation

Before carrying out a continuous strain measurement experiment based on DIC technology, the experimental specimen should be prepared. The crack propagation process of the specimen needs to be photographed frequently, since the dust and oxide on the specimen surface should be polished with an abrasive cloth. In order to better match the subset position of the reference images and the current images, a specimen is prepared with regular and random particles attached on the surface. Moreover, the smaller the particle size, the higher the spatial resolution. In this experiment, the specimen surface was sprayed with an ultra-fine spray gun (0.2 mm nozzle) to ensure a uniform particle size. The particles were “free” to fall on the surface of the specimen, which ensured that the particle distribution was random. Moreover, in order to track specimen deformation during the test, the particles must be well maintained on the surface and cannot interfere with the strain field of the specimen, regardless of the specimen materials and loading conditions. Thus, a white matt paint with strong adhesion was used, and the white granules turned black in the image, due to light absorption just to satisfy the DIC principle. Only a large number of particles were sprayed on the specimen surface, so that the specimen surface strain field was not affected.

3.3. Experimental Setup

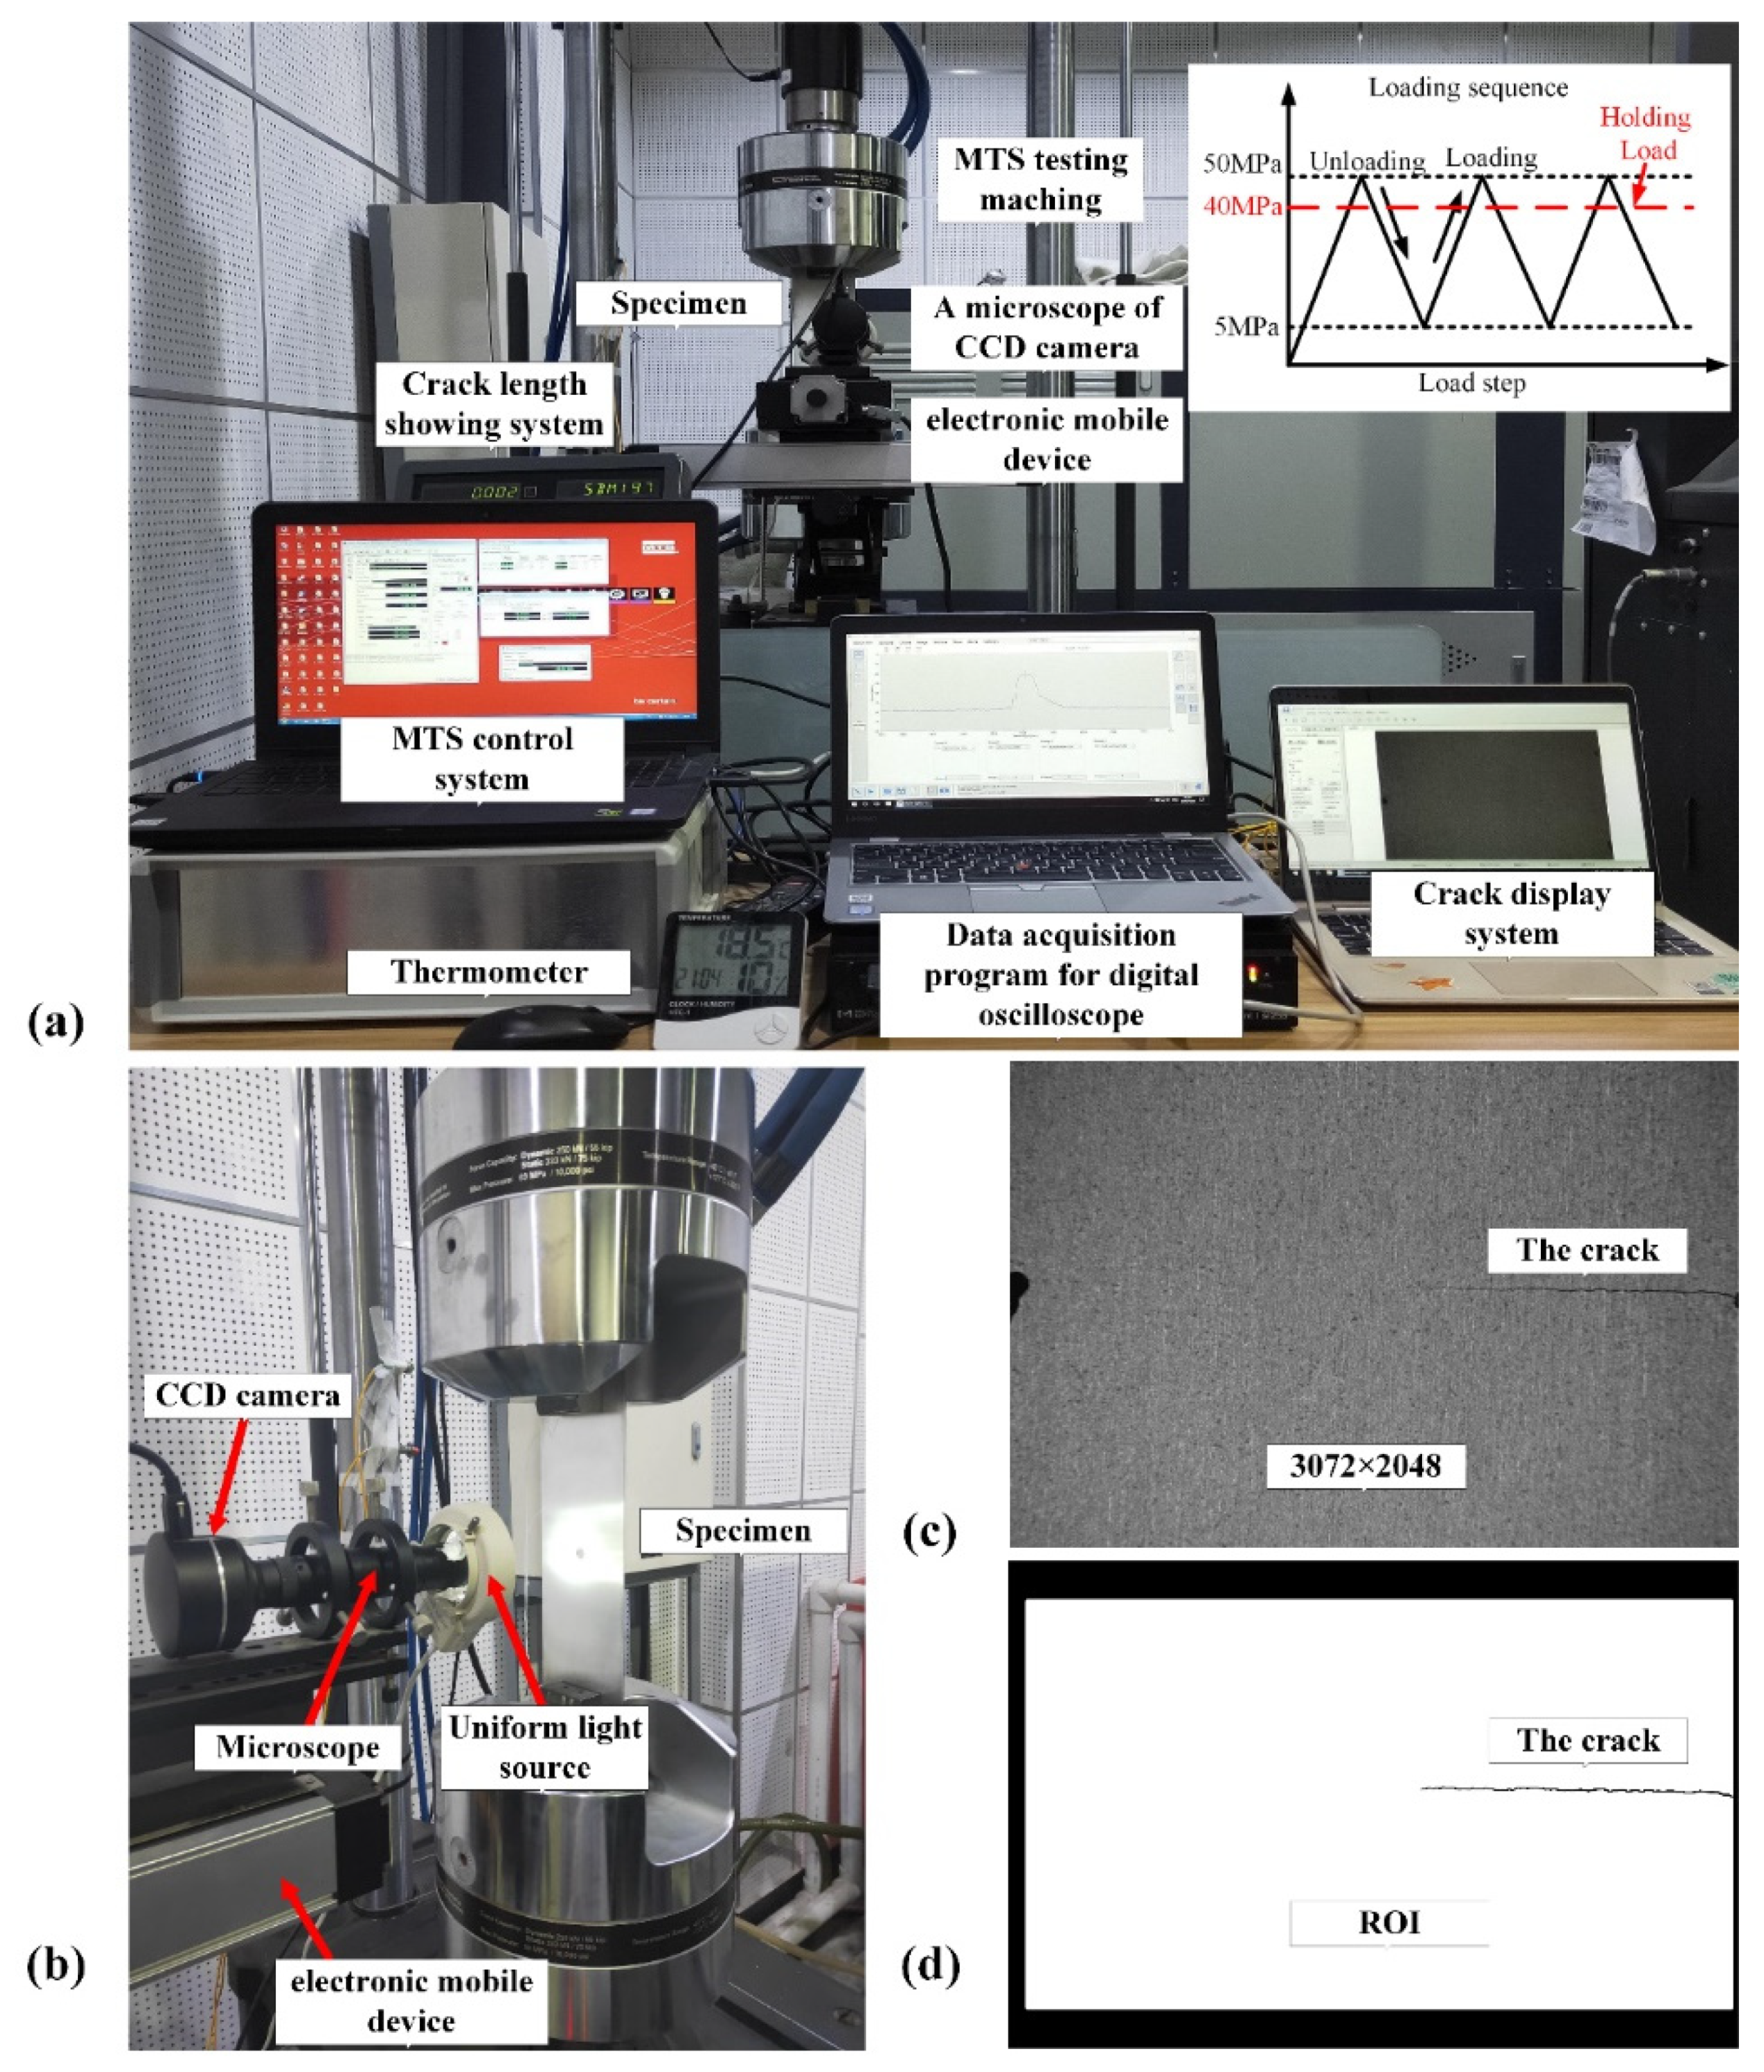
The experimental platform, which is a hole-edge crack of fatigue crack propagation contained fatigue load-cycling system, a DIC processing system, and fatigue crack measurement system, as shown in Figure 3a. First, a hydraulic mechanical testing & simulation (MTS) machine (MTS Systems Corporation, Eden Prairie, MN, USA) was used in the fatigue load-cycling system, shown in Figure 3b. The experiment was carried out at 18 ± 1   ° C . Second, the NASGRO software was used to calculate the reasonable stress magnitude to ensure the fatigue crack growth stably during loading with force control. In this paper, according to the fatigue crack propagation rate database in the NASGRO software (version: v8.01, Southwest Research Institute® (SwRI), San Antonio, TX, USA), the stress intensity factor was 7.08   MPa m and load amplitude was about 50 MPa for 7075-T6 aluminum alloy materials (1 mm thick). The top boundary of the specimen was fixed and its bottom was applied with a uniform tensile. The fatigue loading sequence was set to a triangular wave with a maximum 50 MPa and the load frequency of 10 Hz along the y-direction was undertaken by the hydraulic MTS machine (see Figure 3a). Third, a LEICA microsystem 8-bit intensity resolution Charge Coupled Device (CCD) camera ( 3027 × 2048   pix ) was used as a traveling optical microscope to monitor the fatigue crack propagation under cyclic loading. To ensure the accuracy of the camera’s movement, an electronic mobile device was installed below it, where its minimum movement scale was 0.01 mm, as shown in Figure 3b. A tripod and shock pad were used to keep the camera stable. The optical method, DIC, was used to process the various image by comparing them with a reference image, as shown in Figure 3c. Correspondingly, the ROI is shown in the white area of Figure 3d.

3.4. Data Acquisition

After completing the construction of the experimental platform, digital images of the surface of the specimen need to be captured. The DIC measurement system is shown in Figure 3a,b and included a CCD camera, an optical microscope, a light source, and the DIC processing system. The CCD camera was installed in front of the specimen and the optical axis was perpendicular to the object’s surface. Then, the prepared specimen was mounted on the fatigue testing machine, which cannot be moved or unloaded during the loading process. A uniform white light source was applied to illuminate the surface of the specimen, and the distance between the optical microscope and the sample was adjusted to maximize the clarity of the visual field. This DIC experiment had a higher spatial resolution for such a large area (about 11.40 × 7.60   mm 2 ). The digital images were captured at the same pixel ( 3072 × 2048   pix ), and one pixel corresponded to the area of about 3.6 × 3.6   μ m 2 on the object. Next, the ROI were drawn by Photoshop software in the current image. The surface strain of specimens during crack propagation, especially the strain field at the front of the crack tip, was studied. Figure 3c shows the current image taken by the camera at the crack length of 5.00 mm, and the ROI corresponding to the current image is shown in Figure 3d. In addition, as the standard optical lens was used, the extreme corners of the image will be interfered with by optical aberrations. These areas are not ROI in this work, so they can be ignored.

4. Results and Discussion

In this section, the measurement results of the PZ size ahead of the crack tip and continuous strain variation at and in front of the crack tip with fatigue crack propagation are given by using the DIC method. The first part shows the measurement results of the PZ size ahead of the crack tip with crack propagation under cyclic loading. The second part gives the measurement results of continuous strain variation at a fixed position with crack propagation under cyclic loading.

4.1. The Measurement Results of Plastic Zone (PZ) Size Ahead of the Crack Tip

The crack path (relatively straight) and speckle pattern are shown in the photomicrograph in Figure 4a, and the crack length of specimen-1 marked A–H in the digital image. Considering the crack growth in these materials can be stabilized or a crack arrested event caused by the high-over holding-load, the perfect holding-load may be 70–90% of the force amplitude, therefore the holding-load was set to 40 MPa (see Figure 3a). This moment, the deformed images were captured as the current images. In this work, three groups of the same experiment were carried out, and the specimens are shown in Figure 4b. Figure 4c shows the crack growth curve of the experimental results.
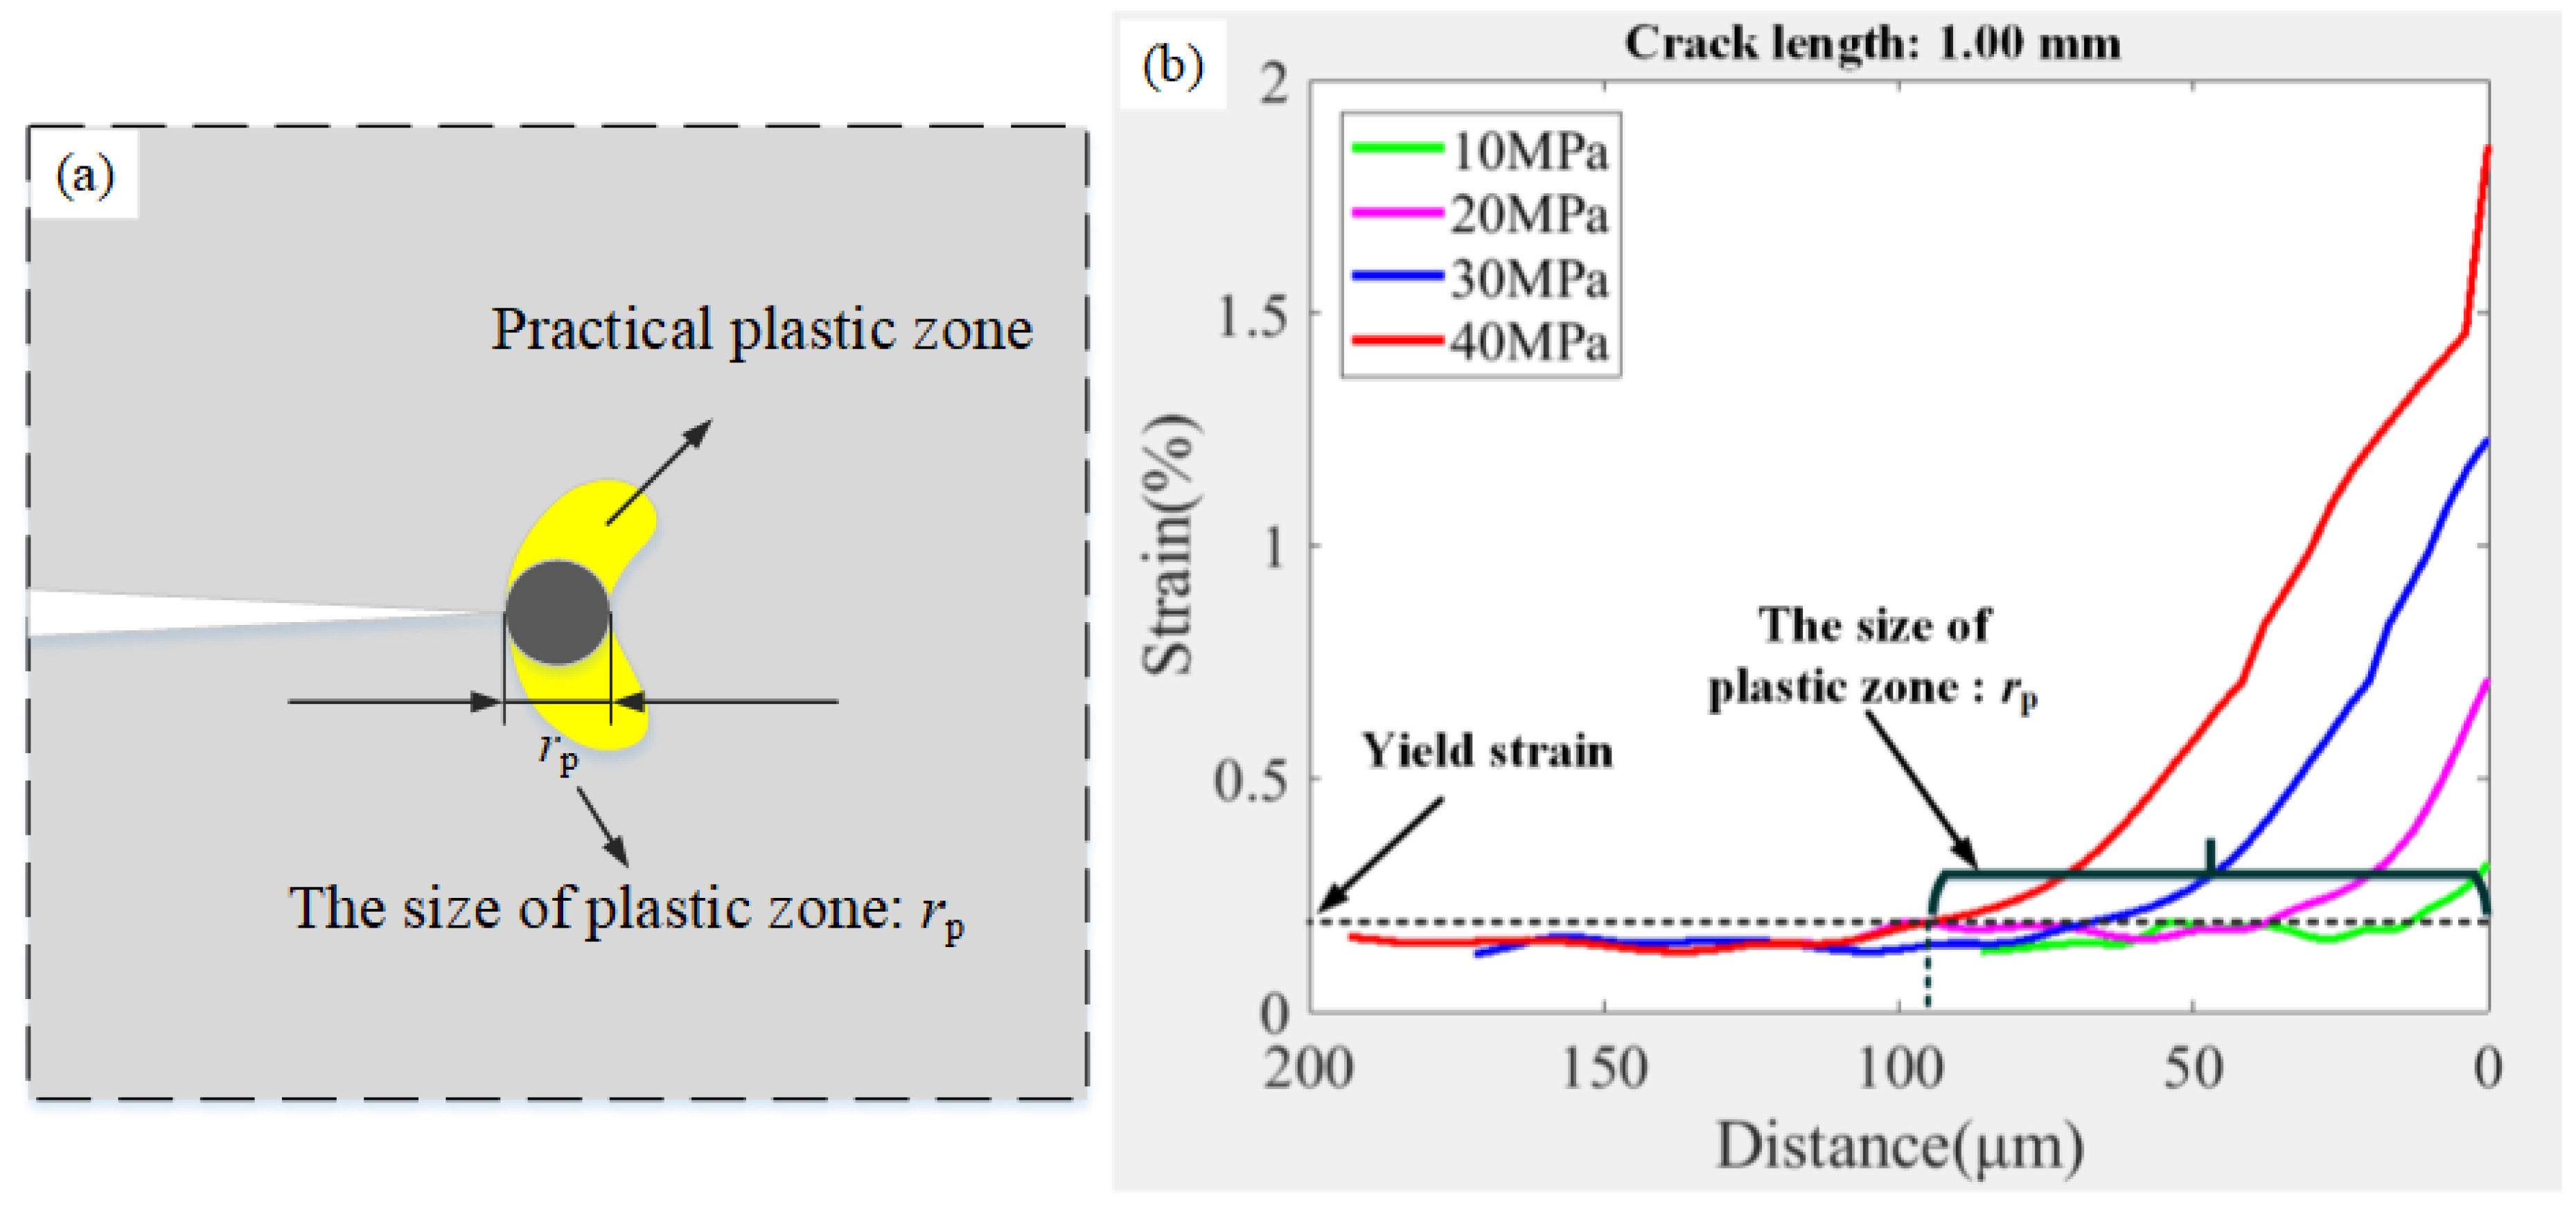
A schematic of the practical plastic zone (butterfly type) is shown in Figure 5a. McClung et al. [18] found that the distance r p from the crack tip to the boundary of the plastic zone along the crack direction can be used to represent the size of the PZ. The strain along the crack direction is measured to evaluate the size of the PZ. Moreover, the strain at the boundary of the plastic zone is approximately equal to yield strain. This is because Kebir et al. [19] pointed out that the hardening effect was not significant in Al7075-T6. The von-Mises strain distribution from the crack tip along the crack propagation direction under different loadings at the crack length of 1.00 mm can be seen, as presented in Figure 5b, where the image, under 0 MPa, is used as the reference image. Furthermore, the abscissa indicates the distance from the crack tip. The strain values decrease dramatically with the increase of distance, until it recovers to elastic strain, as shown in Figure 5b. Therefore, the size of the plastic zone can be obtained by measuring the abscissa value of the yield strain and strain distribution focus. The change behaviors of the plastic zone size can be studied by repeating the above process under different crack lengths.
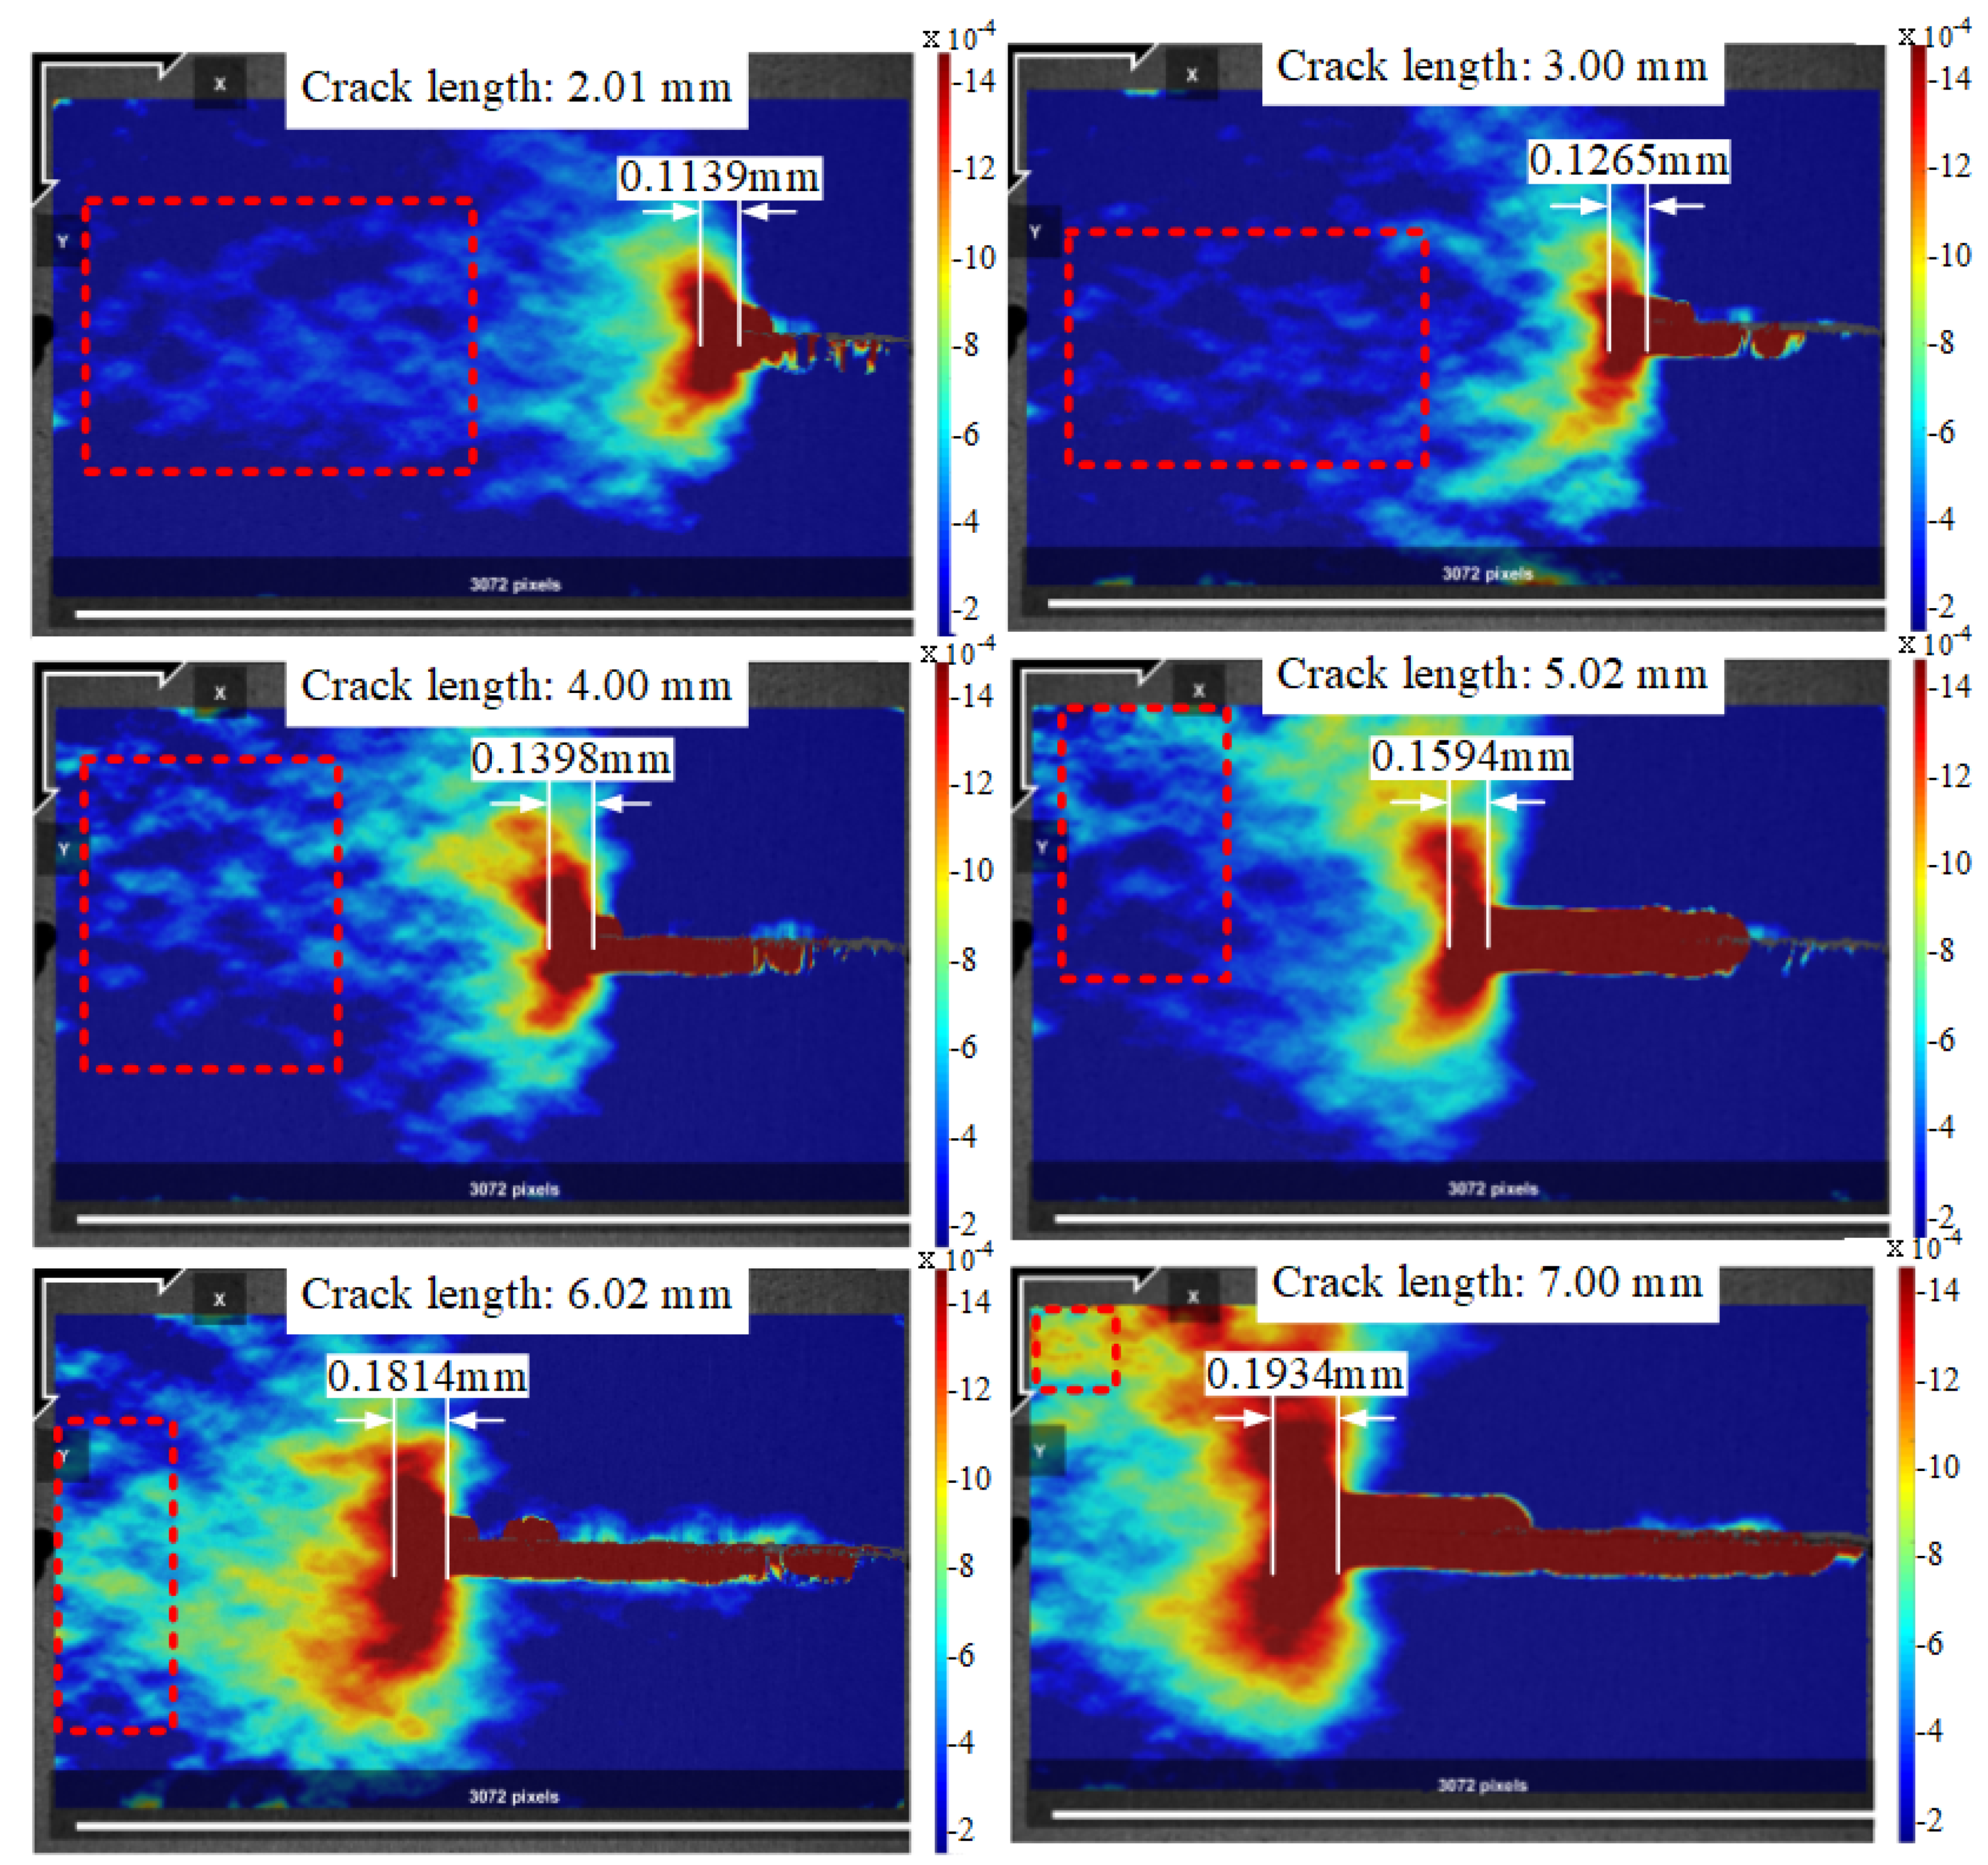
The DIC was performed on images sets A–H in Figure 4a. The partial measurement results of the PZ size at the crack tip under 40 MPa using the DIC method are shown in Figure 6. In the process of implementing the DIC, the subset radius, the subset space, and the strain subset was set to 15, 6 and 15, respectively. These figures clearly show the continuous variation of the PZ, which increased gradually during crack propagation. Due to stress concentration at the crack tip, the PZ near the crack tip showed the “butterfly type”, which conforms to the “Von-Mises” criterion. However, the DIC results showed that there was an unsmooth strain distribution far from the crack tip, as shown in the red region of Figure 6. The main reason is that the mechanical properties of the material are degenerated as the crack propagates. In addition, the digital images including the reference image and current image, were captured under 40   MPa . The plastic zone at the crack tip was mainly caused by stress, but strain changes would be experienced inevitably in front of the crack tip during the fatigue loading process [13]. Therefore, there was a small amount of strain accumulation at the crack front. In conclusion, these non-uniform strains may be caused by a decrease in the material mechanical properties, little strain accumulation, and stress.
Furthermore, Schijfe et al. [2] showed that the theoretical prediction of the plastic zone size is expressed as Equation (3) for cracks at the edge of a hole.
r p = 1 π ( K S 0.2 ) 2
K = β σ π a
2 a = D + 2 l
β = sec π a W
where r p is the PZ size; K is the stress intensity factor at the crack tip; and S 0.2 is the yield strength in Equation (3). The β is the geometry correction factor; σ is tensile stress; and a is the crack length in Equation (4). Then, D is the hole diameter and l is the crack length measured from the edge of the hole, in Equation (5). Finally, W is the specimen width in Equation (6).
In this work, the values of S 0.2 , D , and W were 345 MPa, 10 mm, and 100 mm, respectively. The holding load ( σ ) was 40 MPa. Therefore, the theoretical values of the plastic zone size under different crack lengths is shown in Table 2.

4.2. The Measurement Results of Continuous Strain Variation

In this work, the continuous strain variation at any location of the ROI could be measured with the crack propagation by using the full-field strain measurement method. The strain field parallel to the loading direction (i.e., longitudinal strain field) was expressed as E y y in the experiment. The longitudinal strain field in front of the crack tip can better reflect the true state of crack propagation and dominate the stress distribution characteristics at the crack tip. Therefore, the longitudinal strain distribution is mainly discussed.
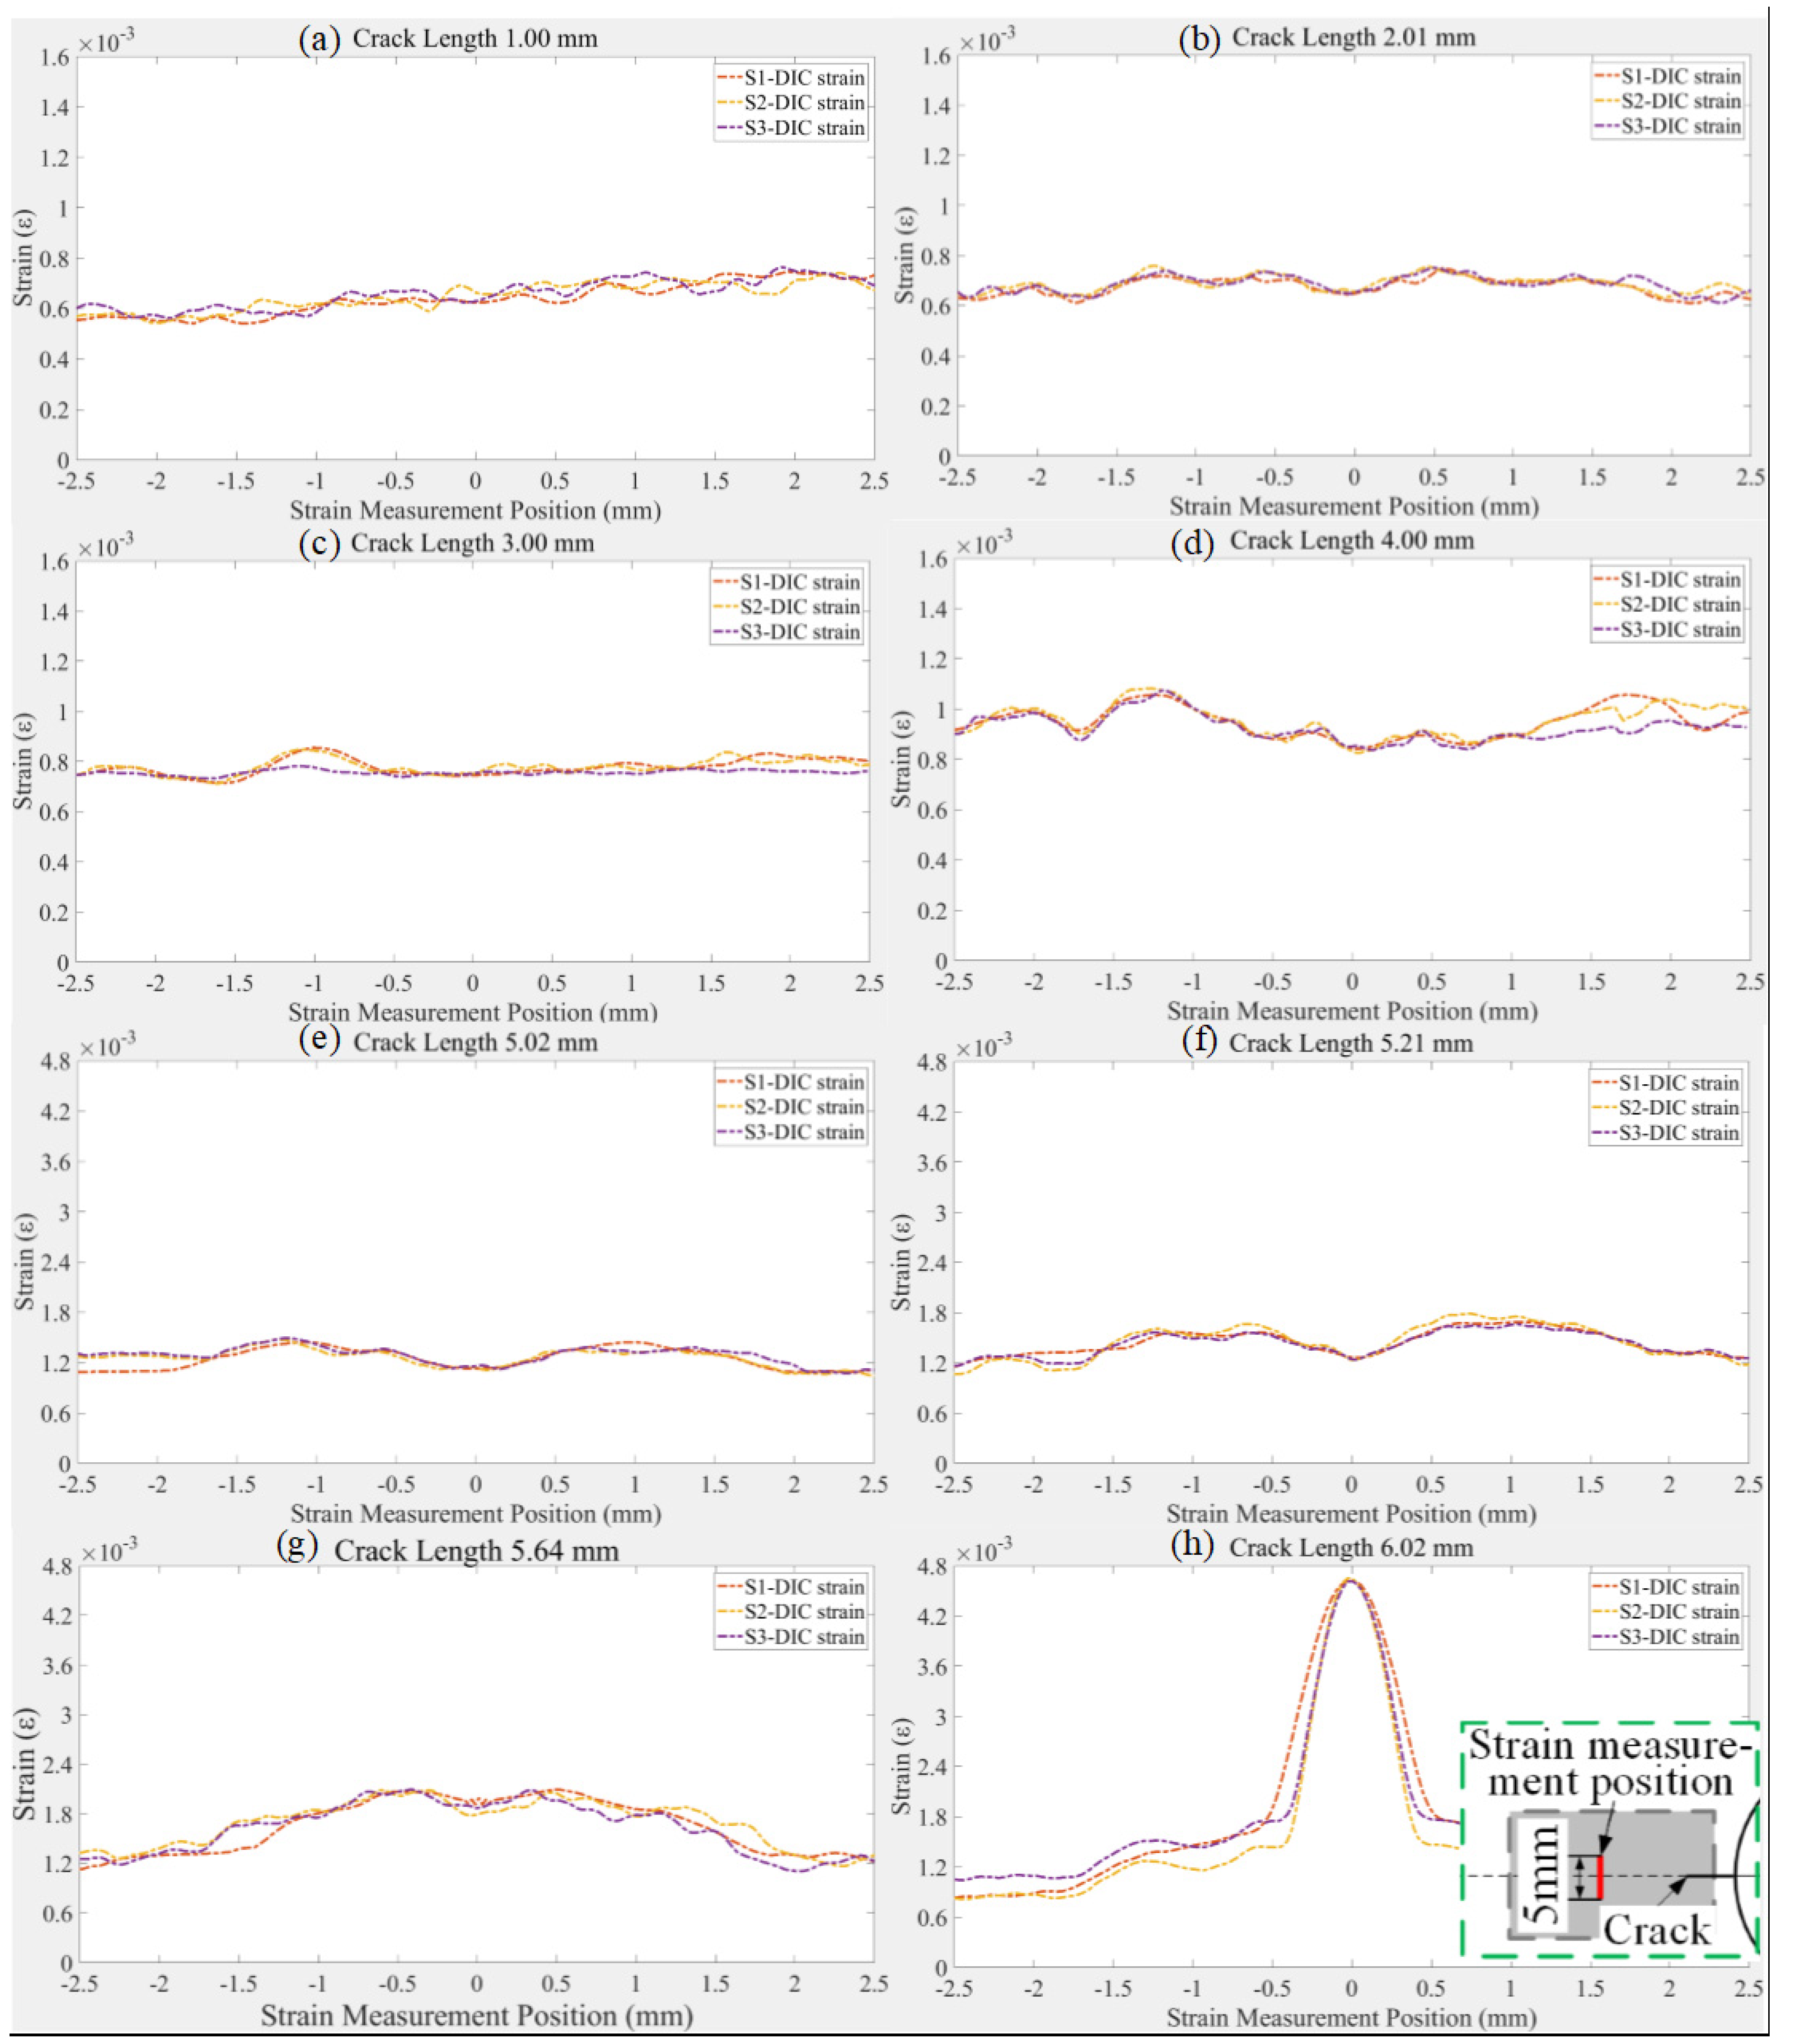
In order to quantitatively obtain the measurement results of continuous strain by using the DIC method, the continuous longitudinal strain ( E y y ) values were measured at 6 mm in front of the pre-crack tip (symmetrical along the crack center line, see the red region of Figure 2). In the process of implementing DIC, the subset radius, the subset space, and the strain subset was set to 15, 6 and 15, respectively, where the image of crack initiation is captured as the reference image (29,000 cycle) under 40 MPa.
Figure 7a–h shows the continuous strain curves with crack propagation for three specimens (S1, S2, and S3), which were measured using the DIC method (crack lengths: 1.00 mm, 2.01 mm, 3.00 mm, 4.00 mm, 5.02 mm, 5.21 mm, 5.64 mm, and 6.02 mm, respectively). Figure 7a–d shows a continuous longitudinal strain ( E y y ) curve at the distal end of the crack tip, and their strain values are small. This strain can be approximately regarded as a uniform strain, despite its slight oscillations. Then, the strain increased gradually with the crack propagation. Moreover, in Figure 7d, the strain curve began to rise first and then decreased. It can be seen from Figure 7a–d that the strain magnitude of the DIC results increased gradually, and the experimental results of the three specimens showed the same trend.
Figure 7e–h shows that the continuous longitudinal strain ( E y y ) on the object surface has approximately the same trend for the experimental results of the three sets. First, when the crack tip was gradually closed to the strain measurement position, the average strain and strain gradient increased. Second, the strain gradient at the strain measurement position gradually increased with the crack growth. When approaching the crack tip from a distance perpendicular to the crack line direction, the strain value increased first and then decreased. This is consistent with the “butterfly shape” of the plastic zone at the crack tip. Third, the break point of the maximum strain gradually approached the crack tip with the crack propagation until the strain value was the maximum at the crack tip.

5. Conclusions

In this paper, the continuous strain values at and in front of the crack tip on the specimen surface were obtained quantitatively and the plastic zone size ahead of the crack tip was in situ measured quantitatively by carrying out the fatigue crack propagation test based on the DIC method. The variation behaviors of the strain distribution and PZ were analyzed with the crack propagation under cyclic loadings. The in situ measurement of the plastic zone ahead of the crack tip was implemented by obtaining the strain distribution along the crack direction from the results of the DIC experiments. The experiment results had good agreement with the theoretical calculations. Moreover, continuous strain measurement was realized with crack growth by comparing the current images under different crack lengths with the reference images (29,000 cycles). Three groups of specimens were used in the fatigue crack growth tests, and the experimental results showed that they had the same trend. If necessary, the continuous strain information can be measured quantitatively at any position in the ROI. In order to provide quantitative results, some strain distributions and plastic zones were measured and analyzed in detail from the DIC data. In addition, a method of specimen preparation was simplified. The main conclusions are as follows:
First, the continuous strain values at and in front of the crack tip on the specimen surface were measured quantitatively by using the DIC method. The proposed approach overcomes the difficulty of the in situ measurement of structural mechanical variables. The longitudinal strain field ( E y y ) presented a “butterfly shape” at the crack tip, which is in accordance with the ‘Von-Mises’ criterion, which proves the validity of the continuous strain measurement on the surface of the structure.
Second, the plastic zone size ahead of the crack tip was in situ measured quantitatively with crack propagation under cyclic loadings and overcomes the limitation that the conventional approaches only consider quasi-static cracks.
Third, the method of specimen preparation was simplified by using a white matt paint with strong adhesion and an ultra-fine spray gun, which also resulted in a higher resolution being shown, even for such a large area. Under the premise of ensuring the random distribution of speckle, the method of specimen preparation has the advantages of simple operation, low price, and low requirements for equipment and environment. Furthermore, the area of the ROI was about 11.40 × 7.60   mm 2 in the DIC experiments. The digital images were captured at the same pixel ( 3072 × 2048   pix ), and one pixel corresponded to the spatial resolution of about 3.6 × 3.6   μ m 2 on the surface of the specimen.

Author Contributions

Y.Z. and W.Z. put forward the key ideas, designed the experiments and determined the measurement method; D.H. checked the manuscript; M.Z. and W.D. performed the DIC experiments and data processing. All authors made contributions to the writing and revising of the manuscript. All authors have read and agreed to the published version of the manuscript.

Funding

This work was supported by the National Natural Science Foundation of China (NSFC) (Grant Nos. 51675024 and 51811540406), Civil Aircraft Major Project (MJ-2018-D-26), Aerospace Power Foundation (Grant No. 6141B090314), and the Technical Foundation Program (grant JSZL2017601C002) from the Ministry of Industry and Information Technology of China.

Conflicts of Interest

The authors declare no conflict of interest.

References

  1. Dursun, T.; Soutis, C. Recent developments in advanced aircraft aluminum alloys. Mater. Des. 2014, 56, 862–871. [Google Scholar] [CrossRef]
  2. Schijve, J. Fatigue of Structures and Materials; Springer Science & Business Media: Berlin, Germany, 2001. [Google Scholar]
  3. Ostermann, H. Stress Concentration Factors of Plate Specimens for Fatigue Tests; Report TM; Laboratorium für Betriebsfestigkeit, LBF, Darmstadt: Darmstadt, Germany, 1971. [Google Scholar]
  4. Peters, W.H.; Ranson, W.F. Digital imaging techniques in experimental stress analysis. Opt. Eng. 1982, 21, 213427. [Google Scholar] [CrossRef]
  5. Yamaguchjc, I. Speckle displacement and deformation in the diffraction and image fields for small object deformation. Opt. Acta 1982, 28, 1359–1376. [Google Scholar] [CrossRef]
  6. Pan, B.; Qian, K.; Xie, H.; Asundi, A. Two-dimensional digital image correlation for in-plane displacement and strain measurement: A review. Meas. Sci. Technol. 2009, 20, 062001. [Google Scholar] [CrossRef]
  7. Lagattu, F.; Brillaud, J.; Lafarie-Frenot, M.C. High strain gradient measurements by using digital image correlation technique. Mater. Charact. 2004, 53, 17–28. [Google Scholar] [CrossRef]
  8. Besel, M.; Breitbarth, E. Advanced analysis of crack tip plastic zone under cyclic loading. Int. J. Fatigue 2016, 93, 92–108. [Google Scholar] [CrossRef]
  9. Breitbarth, E.; Besel, M. Energy based analysis of crack tip plastic zone of AA2024-T3 under cyclic loading. Int. J. Fatigue 2017, 100, 263–273. [Google Scholar] [CrossRef]
  10. Vasco-Olmo, J.M.; James, M.N.; Christopher, C.J.; Patterson, E.A.; Díaz, F.A. Assessment of crack tip plastic zone size and shape and its influence on crack tip shielding. Fatigue Fract. Eng. Mater. Struct. 2016, 39, 969–981. [Google Scholar] [CrossRef] [Green Version]
  11. Zhang, W.; Liu, Y. Plastic zone size estimation under cyclic loadings using in situ optical microscopy fatigue testing. Fatigue Fract. Eng. Mater. Struct. 2011, 34, 717–727. [Google Scholar] [CrossRef]
  12. Vanlanduit, S.; Vanherzeele, J.; Longo, R.; Guillaume, P. A digital image correlation method for fatigue test experiments. Opt. Lasers Eng. 2009, 47, 371–378. [Google Scholar] [CrossRef]
  13. Carroll, J.D.; Abuzaid, W.; Lambros, J.; Sehitoglu, H. High resolution digital image correlation measurements of strain accumulation in fatigue crack growth. Int. J. Fatigue 2013, 57, 140–150. [Google Scholar] [CrossRef]
  14. Toribio, J.; Kharin, V. Finite-deformation analysis of the crack-tip fields under cyclic loading. Int. J. Solids Struct. 2009, 46, 1937–1952. [Google Scholar] [CrossRef] [Green Version]
  15. Buttlar, W.; Hill, B.C.; Kim, Y.R.; Kutay, M.E.; Millien, A.; Montepara, A.; Paulino, G.H.; Petit, C.; Pop, O.; Romeo, E.; et al. Digital image correlation techniques to investigate strain fields and cracking phenomena in asphalt materials. Mater. Struct. 2014, 47, 1373–1390. [Google Scholar] [CrossRef]
  16. Blaber, J.; Adair, B.; Antoniou, A. Ncorr: Open-source 2D digital image correlation matlab software. Exp. Mech. 2015, 55, 1105–1122. [Google Scholar] [CrossRef]
  17. Pan, B. Reliability-guided digital image correlation for image deformation measurement. Appl. Opt. 2009, 48, 1535–1542. [Google Scholar] [CrossRef] [PubMed]
  18. McClung, R.C. Crack closure and plastic zone sizes in fatigue. Fatigue Fract. Eng. Mater. Struct. 1991, 14, 455–468. [Google Scholar] [CrossRef]
  19. Kebir, T.; Benguediab, M.; Miloudi, A.; Imad, A. Simulation of the cyclic hardening behavior of aluminum alloys. UPB Sci. Bull. Ser. D Mech. Eng. 2017, 79, 240–250. [Google Scholar]
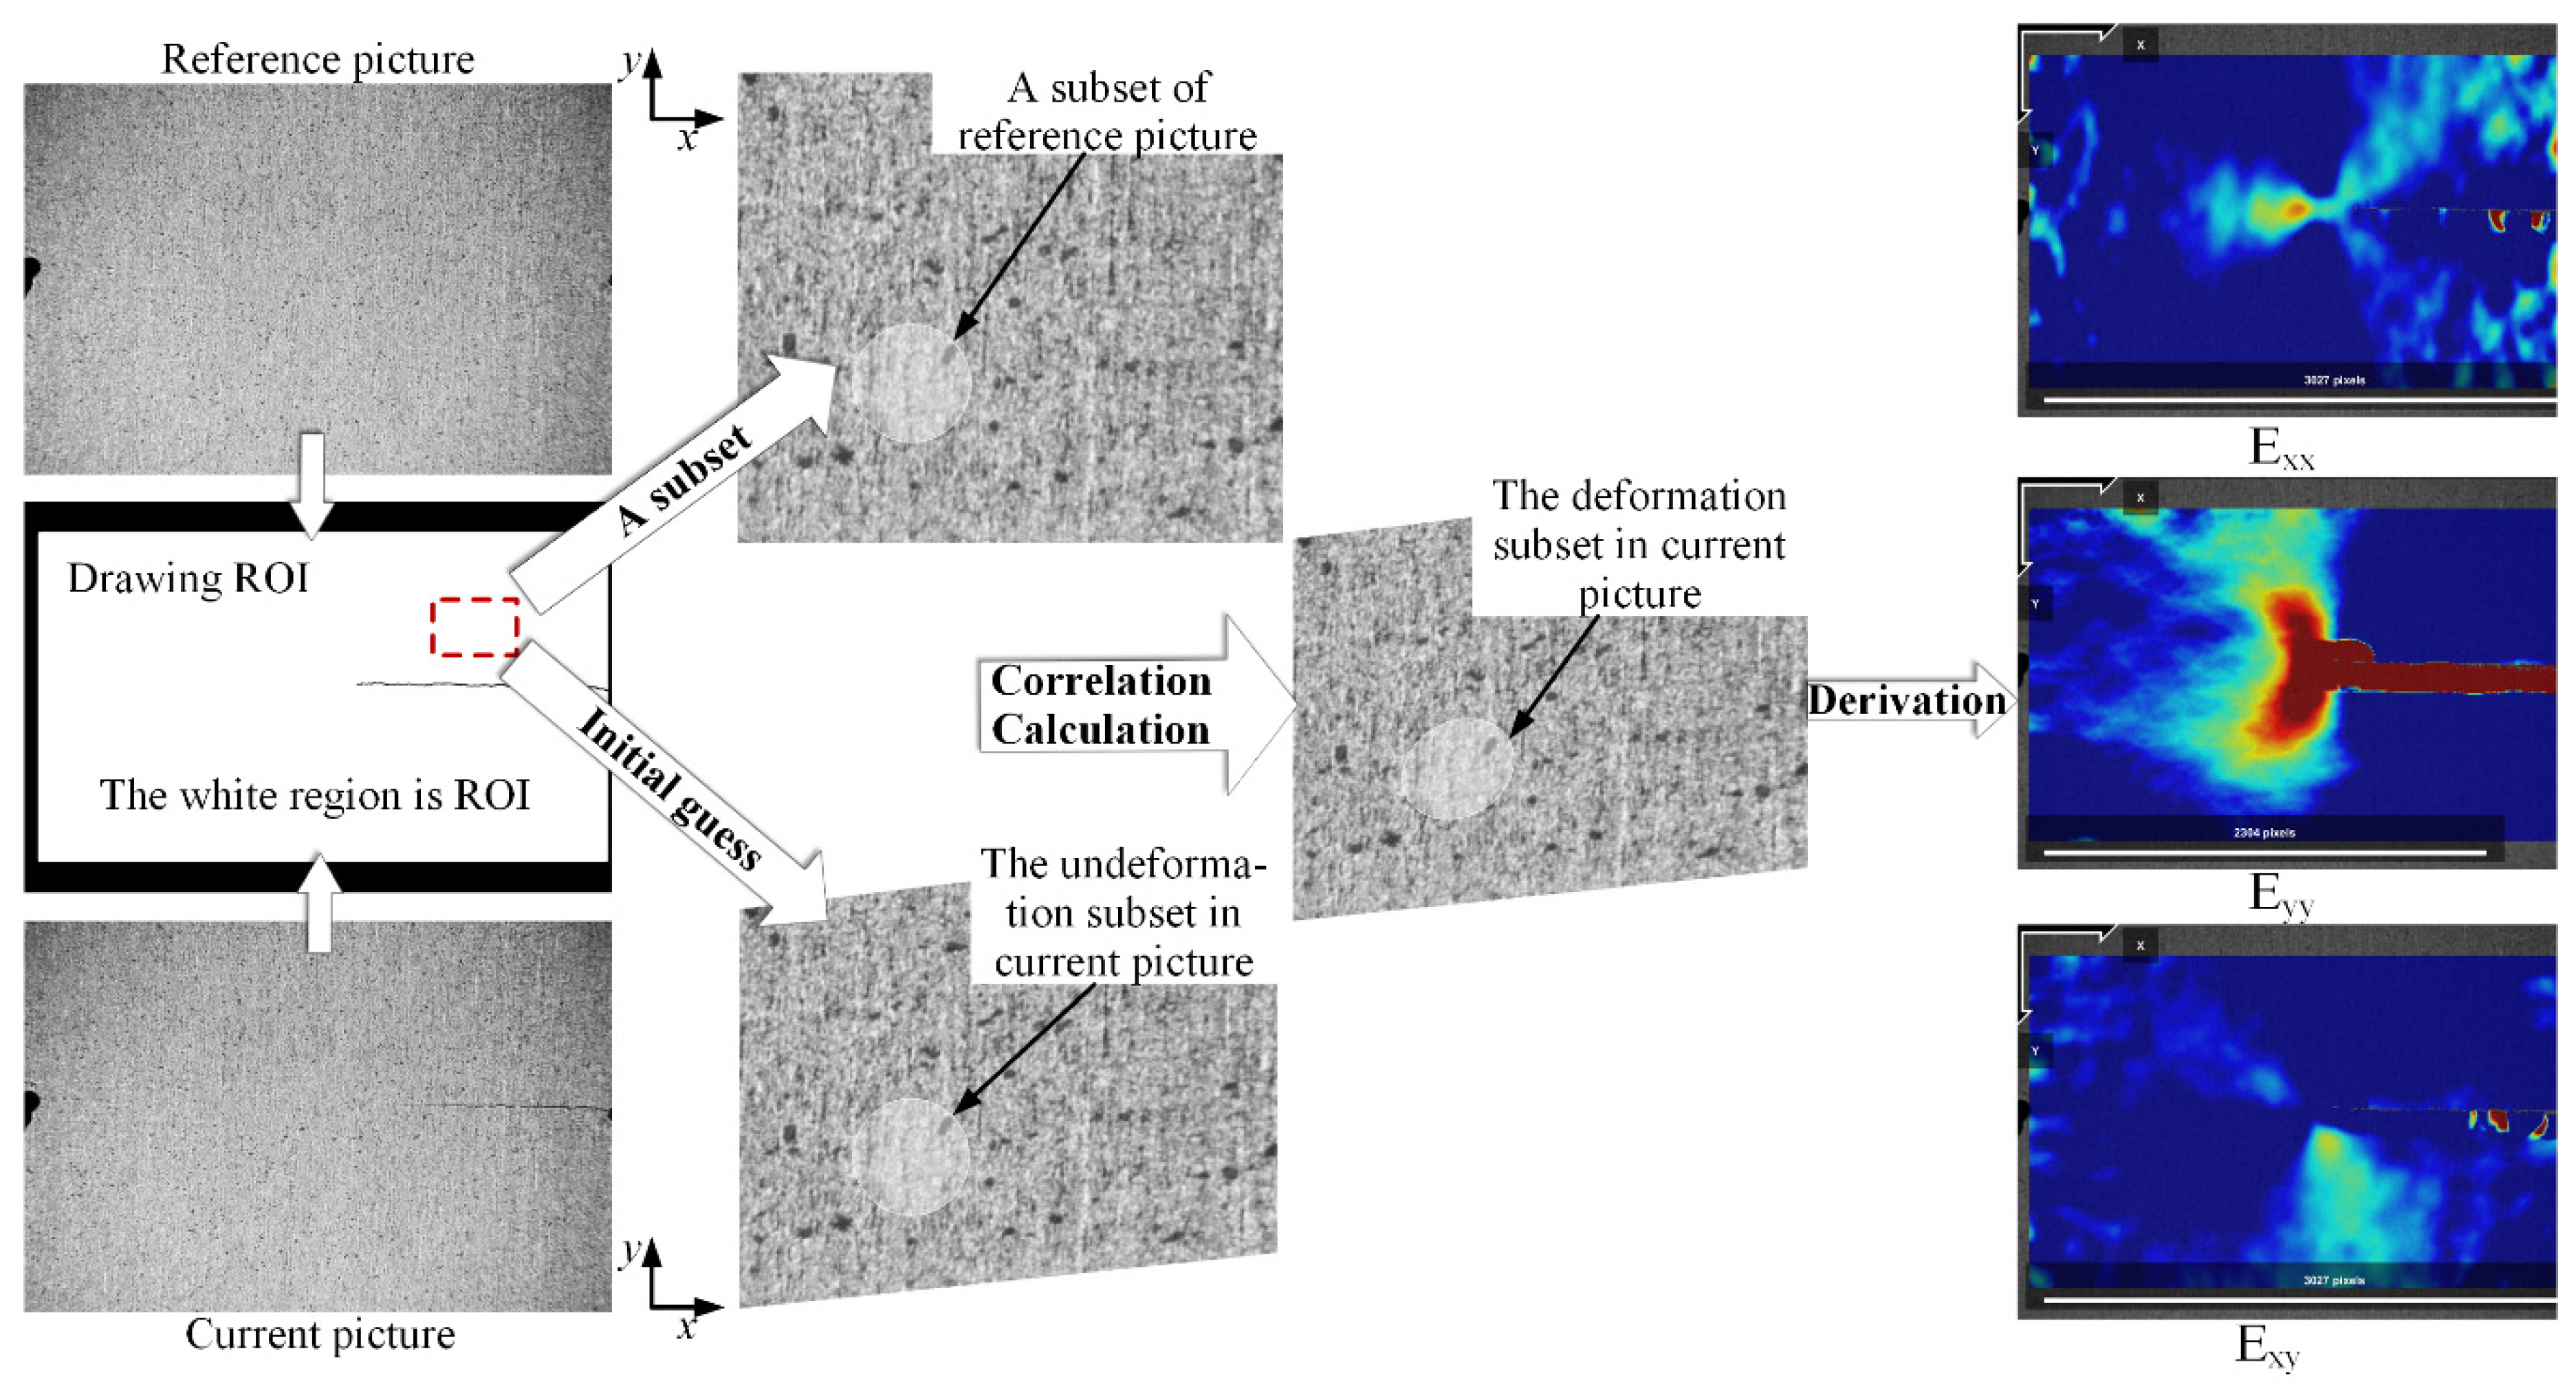
Figure 1. Principle of the digital image correlation (DIC) method used for in-plane strain mapping.
Metals 10 00273 g001
Figure 2. The schematic diagram of the geometric dimensions of the aluminum specimen.
Metals 10 00273 g002
Figure 3. Experimental setup of strain measurement using the DIC technology. (a) A photo of the test setup, (b) DIC processing system, (c) the digital image recorded by the Charge Coupled Device (CCD) camera, and (d)the region of interest (ROI) corresponding to Figure 3c.
Metals 10 00273 g003
Figure 4. (a) Crack propagation path and speckle image; (b) manufactured specimen; (c) the crack growth curve.
Metals 10 00273 g004
Figure 5. (a) Schematic illustration of the plastic zone ahead of the crack tip; (b) strain distribution along the crack plane under different loadings.
Metals 10 00273 g005
Figure 6. The measurement results of the PZ size ahead of the crack tip with crack propagation based on the DIC method.
Metals 10 00273 g006
Figure 7. The measurement results of the continuous strain curves at and in front of the crack tip were measured by the DIC method, and the (ah) show the continue strain variation with crack propagation.
Metals 10 00273 g007
Table 1. The main properties of the aluminum alloy 7075-T6.
MaterialTensile Strength Ultimate (MPa)Tensile Strength Yield (MPa)Poisson’s RatioElastic Modulus (GPa)
AL7075-T64833450.3370
Table 2. The plastic zone size with different crack lengths under 40 MPa.
Crack Length (mm)Plastic Zone Size (mm)Crack Length (mm)Plastic Zone Size (mm)
DICTheoretical CalculationDICTheoretical Calculation
1.000.09650.0964 5.020.15940.1575
2.010.11390.1112 6.020.18140.1738
3.000.12650.1260 7.000.19340.1904
4.000.13980.1413 7.980.21050.2076