Article

Mechanical Properties of 3D-Printed Maraging Steel Induced by Environmental Exposure

1
Mechanical and Aerospace Engineering Department, Naval Postgraduate School, Monterey, CA 93943, USA
2
Marine Corps Logistics Command, Marine Depot Maintenance Command, Albany, GA 31704, USA
*
Author to whom correspondence should be addressed.
Metals 2020, 10(2), 218; https://doi.org/10.3390/met10020218
Submission received: 11 January 2020 / Revised: 28 January 2020 / Accepted: 31 January 2020 / Published: 4 February 2020

Abstract

:
Changes in the mechanical properties of selective laser melted maraging steel 300 induced by exposure to a simulated marine environment were investigated. Maraging steel samples were printed in three orientations: vertical (V), 45° (45), and horizontal (H) relative to the print bed. These were tested as-printed or after heat-treatment (490 °C, 600 °C, or 900 °C). One set of specimens were exposed in a salt spray chamber for 500 h and then compared to unexposed samples. Environmental attack induced changes in the microstructural features and composition were analyzed by scanning electron microscopy and energy dispersive spectroscopy respectively. Samples printed in the H and 45° directions exhibited higher tensile strength than those printed in the V direction. Corrosion induced reduction in strength and hardness was more severe in specimens heat-treated between 480 °C and 600 °C versus as-printed samples. The greatest decrease in tensile strength was observed for the 45°-printed heat-treated samples after exposure. A comparison between additive and subtractive manufactured maraging steel is presented.

1. Introduction

Additive manufacturing (AM) is transforming how organizations manufacture and/or acquire products. The various rapid prototyping technologies: fused deposition model, stereolithography, selective laser melting, direct laser metal deposition, etc., are all changing not only how organizations prototype new parts but also how manufacturing of production and replacement parts are completed [1]. Selective laser melting (SLM) is a mature AM technology and is used for the direct fabrication of complex and functional metal components by laser melting a bed of metal powder layer by layer until a fully formed metal part is achieved. The SLM technique has been validated for a number of important metal alloys including Ti-6Al-4V [2], 316 stainless steel [3], AlMg10Si [4], and maraging steel [5,6]. Microstructure and mechanical properties of AM metals have been investigated and often compared to subtractive manufactured metals. Little is known, however, on how additively manufactured materials will behave in corrosive environments and how their properties compare to materials produced by traditional subtractive technologies. The aim of this paper is to present such a comparison for a maraging steel exposed to a simulated marine environment.
Maraging steel (a portmanteau of martensite and aging) is a class of high alloy, low carbon steel developed for structural applications requiring high strength such as rocket booster casings and pressure vessels [7,8]. These steels exhibit high strength and toughness and good ductility and are sought after for the alloys’ excellent resistance to fatigue loading and weldability [9,10]. The excellent mechanical properties of maraging steel are attributed to the presence of Ni and low C content (<0.03 wt%) contributing to the formation of an iron-nickel martensitic microstructure. Precipitation hardening occurs when applying an appropriate heat-treatment; Ni-based precipitates (Ni3Mo and Ni3Ti) are responsible for the strengthening [10,11]. Further increases in strength are accomplished by the addition of Co and Mo, which are part of alloys classified as 200, 250, 300, and 350 [7]. Maraging steel alloys contain between 15 wt% and 25 wt% Ni; however, the highest tensile and yield strength were measured in alloys with 18 wt% Ni [12]. The 18 wt% Ni alloys, 18Ni-300 exhibits high strength, hardness, and ductility.
Multiple studies have been published regarding additively manufactured maraging steel: fully dense parts made from the laser processing of 18Ni-300 powders were accomplished by Stanford et al. on an EOS M250 extended platform [13] and the effects that powder size and printing parameters (e.g., scan speed and layer thickness) have on the mechanical properties and microstructure of 18Ni-300 studied by Yasa et al., Kempen et al. and others [5,6,14,15,16]. Jägle et al. investigated the properties of heat-treated 18Ni-300 and found three Ni-based precipitates form and observed austenite reversion after aging [17]. Additional work on the behavior of aged 18Ni-300 was performed confirming austenite reversion and its deleterious effects on mechanical properties [16,18,19,20]. Print direction also affected the material properties of printed 18Ni-300 as observed by Tan et al. [21]. In that work, horizontally printed parts exhibited higher strength and hardness compared to vertically printed parts and aging relieved stresses caused by the layer-wise construction of specimens. Corrosion behavior of 18Ni-300 was also studied by Tan et al. using potentiodynamic polarization tests in 3.5% NaCl room-temperature solution [21]. The latter, however, only looked at differences in galvanic corrosion between as-printed and aged (heat-treated) samples printed along one direction. In this paper, the changes in mechanical properties of printed 18Ni-300 along diverse print orientations and various heat-treated states due to exposure to a simulated marine environment were investigated.

2. Materials and Methods

Test specimens were printed using Electro-Optical Systems (EOS) MaragingSteel MS1 powder [22] in an EOS M400 printer (EOS, Krailling, Germany). The powder had the composition of Maraging Steel 300 (18Ni-300, US; 1.2709, European; X3NiCoMoTi 19-9-5, German). The printer parameters are listed in Table 1. Three groups of samples were printed in three different orientations (group names given in parentheses): in the XY-plane of the print stage (H); perpendicular to the print stage (V), and in a 45° direction relative to the print stage (45). Printed specimens were then machined into tensile testing specimens following the ASTM standard E8/E8M-16a [23]. Completed samples were then tested “as-printed (AP)” or heat-treated following several different treatment conditions: 490 °C for six hours (HT490), 600 °C for six hours (HT600), or 900 °C for 45 min (HT900). All heat-treatments were completed in an argon atmosphere and air-cooled (with between 30–60 min cool-down time). Printed specimens were compared to 18Ni-300 maraging steel processed by the vacuum induction melting-vacuum arc remelting (VIM-VAR) method (MSC Industrial Supply Co., Cleveland, OH, USA), that was then machined following ASTM E8/E8M, hereafter referred to as CNC.
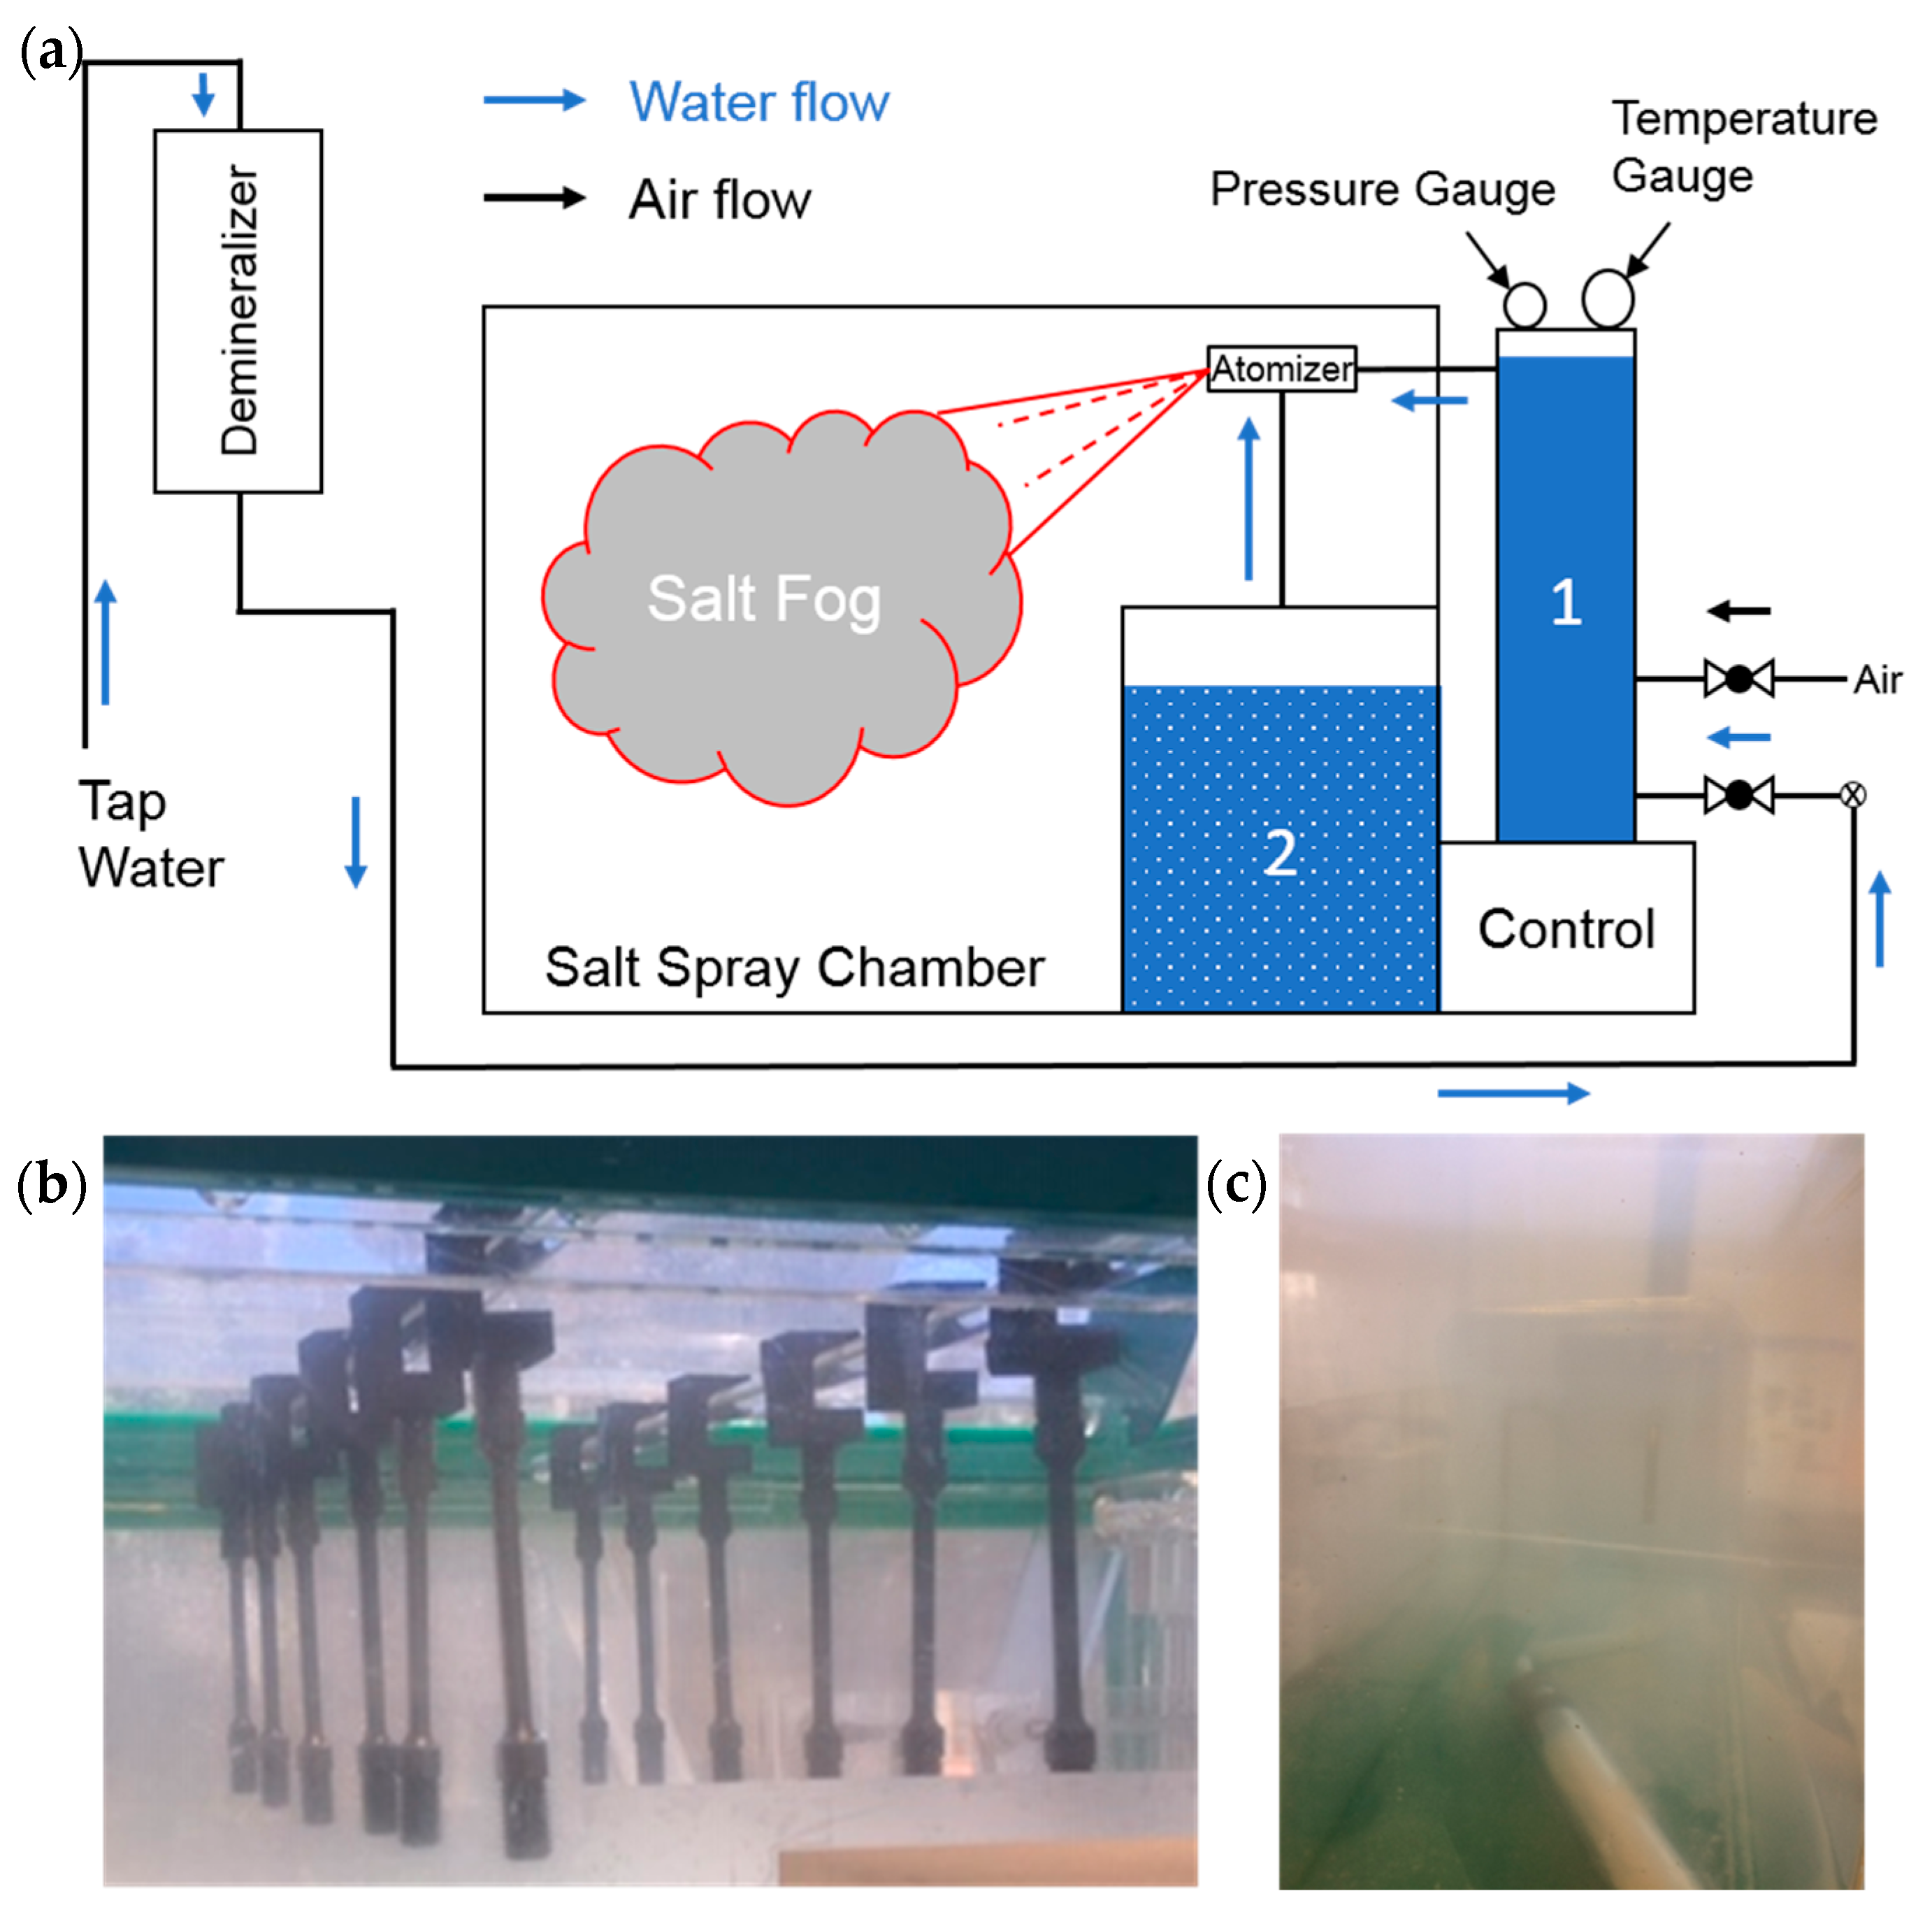
An MX-9204 Salt Spray Chamber (Associated Environmental Systems, Acton, MA, USA) was used for exposing samples to a simulated marine environment (a schematic is shown in Figure 1a). First, a solution of 3.5 g NaCl per 100 mL of distilled water was prepared to approximately simulate the salinity found on average in the world’s oceans [24]. The salt solution was then added to the salt solution reservoir. Compressed air was pumped into the saturation tower where pressure was maintained between 82.7–103 kPa (12–15 psi) while temperature was held between 41–43 °C during the test run. Tap water was pumped through a demineralizer before flowing into the saturation tower. Demineralized water was then routed to an atomizer. Saltwater from the reservoir was siphoned through a filter assembly (containing a nylon mesh strainer) up to the atomizer. The atomizer mixed and atomized the two water sources and sprayed the mixture into the salt spray chamber.
One end of the samples was threaded in custom-printed sample holders made of either carbon fiber reinforced nylon (CarbonX™ by 3DX Technology, Grand Rapids, MI, USA) or polyethylene terephthalate (Esun, Shenzhen, China). These were hung in the salt spray chamber. Figure 1b shows samples placed in the salt spray chamber (colloquially “salt fog”) hanging down from printed sample holders. Salt fog is visible in Figure 1c. Samples were exposed for three weeks in total (approximately 500 h).
The naming scheme for samples was chosen based on whether samples were exposed to a salt fog environment (simulated marine environment) or not, their printing orientation, and heat-treatment (or lack thereof). For example; samples exposed to a salt fog environment for three weeks, printed perpendicular to the stage, and heat-treated at 600 °C for six hours are called 3V600 (time of exposure in weeks, print orientation, and temperature of heat-treatment in °C). Another example; samples with no exposure, printed horizontally and with no heat-treatment, are called 0HAP.
Tensile test specimens were then installed in a tensile tester (Instron 5982 Tensile Tester, Norwood, MA, USA). The tensile test speed for all samples was 2 mm/min. Fractured samples were then prepared for further analysis using standard metallurgical processing involving cutting, mounting, polishing, and etching. Microhardness measurements were completed on a Durascan Microhardness Tester (Struers, Ballerup, Denmark).
Optical imaging of samples was performed on an Epiphot 200 reflective optical microscope (Nikon, Tokyo, Japan). Microstructural characterization was done on mounted specimens using a Neon 40 Dual-beam (Zeiss, Oberkochen, Germany) scanning electron microscope (SEM). Microanalysis was conducted by energy-dispersive spectroscopy (EDS) using an Octane Plus EDS detector (EDAX, Mahwah, NJ, USA). Samples were prepared for SEM/EDS analysis by first mounting specimens in epoxy mounts. Mounted samples were then placed in an automatic polisher (Buehler, Lake Bluff, IL, USA) and ground using 300-, 600-, and 1200-grit paper at a wheel speed of 26.2 rad/s (250 RPM) and a force of 22.2 N (5.0 lbs. f) for 15–60 min at each step. After grinding, samples were polished in the sample automatic polisher using long-napped synthetic polishing cloth (Buehler Microcloth PSA) and polishing fluid, 1 µm alumina suspension (Buehler MicroPolish). Prior to SEM microstructural analysis, samples were etched with a Nital etching solution (methanol was the alcohol in this case).

3. Results and Discussion

Raw powders used for printing consisted of mostly spherical particles with sizes ranging from 1 µm up to 84 µm and an average size of 14 ± 11 µm. A few of the particles observed in the SEM were irregularly shaped due to being formed by agglomerates that sintered. Those types of particulates are typically observed in powders produced by atomization. The composition of the powders, printed and heat-treated (at 490 °C) parts were studied using EDS. The elements found, in wt%, in the powders and printed parts are shown in Table 2. The powder samples were rich in Ni and Co, but low in Mo as compared to the composition of 18Ni-300 found in the literature [6,22,25]. The printed parts matched the expected composition. It is worth noting that EDS is only a semi-quantitative method of analysis that renders data from localized sections rather than a bulk analysis.
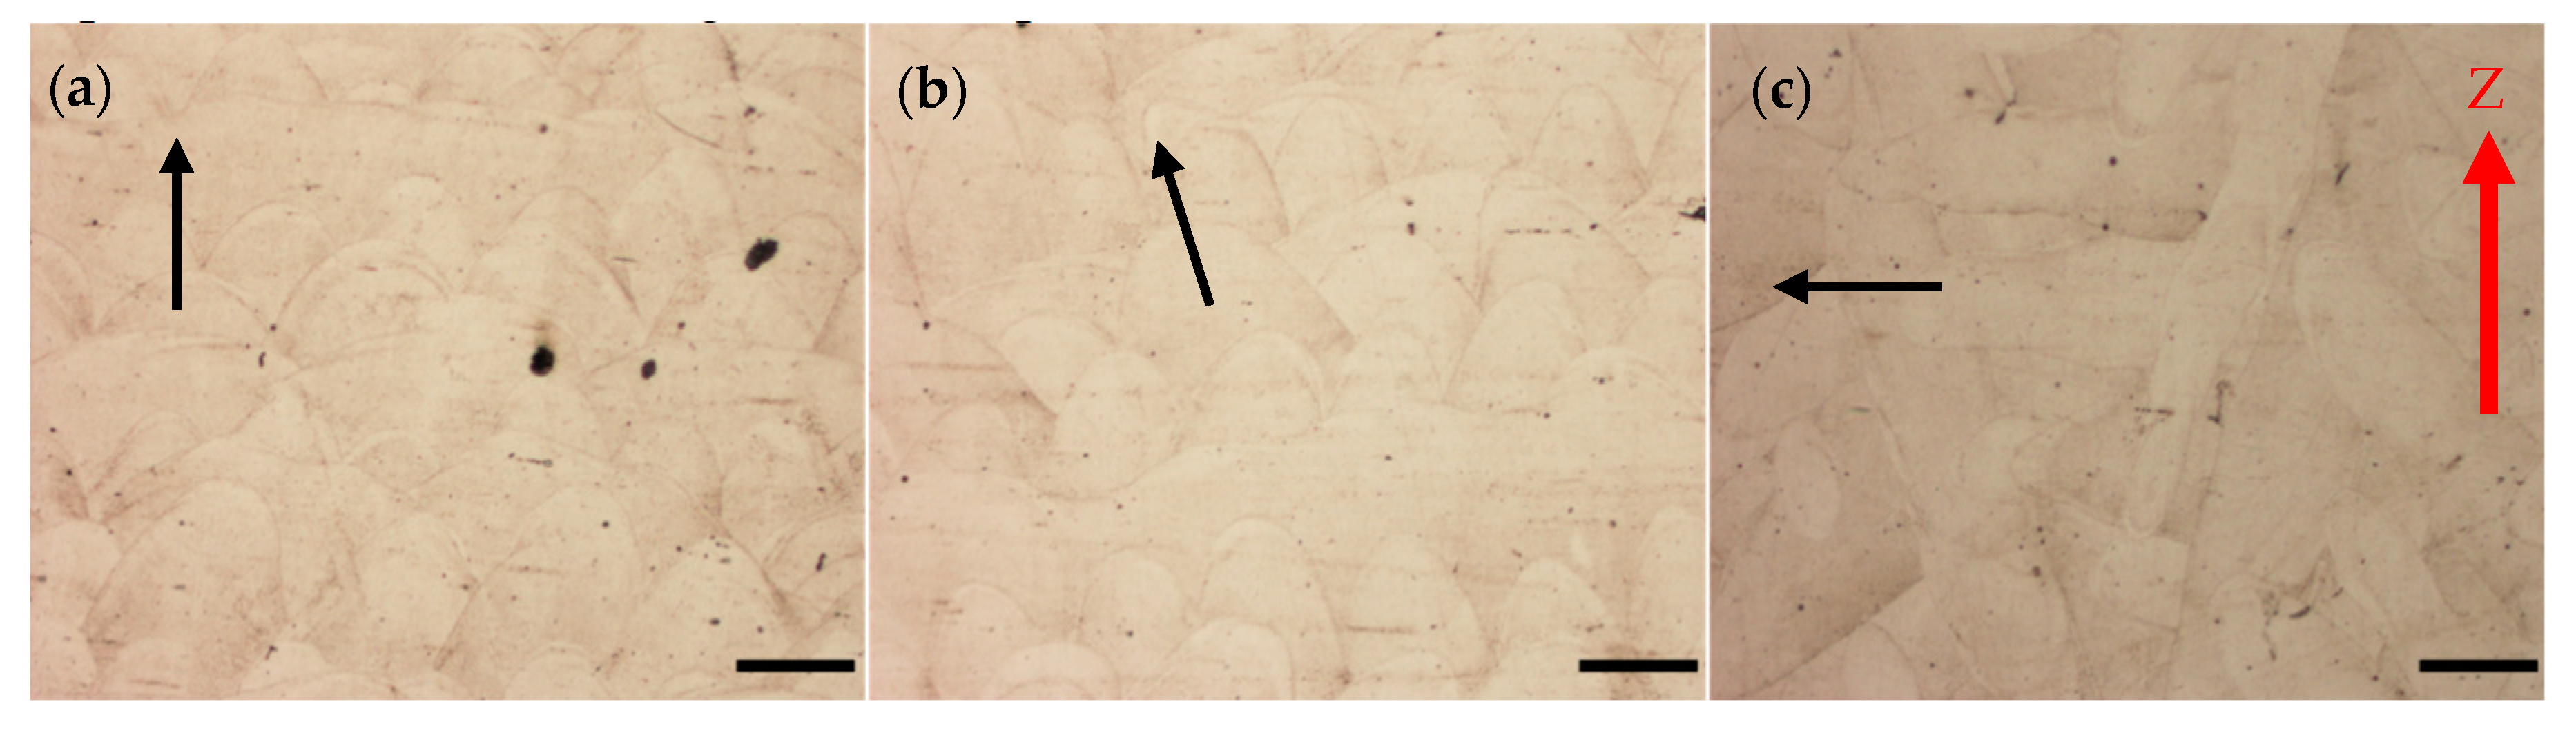
Printed metals exhibit a unique microstructure as a result of SLM printing in the form of track marks as seen in Figure 2. The direction of the track marks indicates the orientation of a printed sample in relation to the build plate. Unaged maraging steel printed in the V (Figure 2a), 45° (Figure 2b), and H (Figure 2c) directions. Arrows are placed in the figures to indicate the general direction of the apex of laser track marks. During SLM printing, the high-power laser melts the powders deposited on the build plate. As the laser passes any one point in the build plate, the melted powders begin to cool and fuse together. Once the printer completes one layer, the next layer of powder is deposited, and the laser begins its next pass.
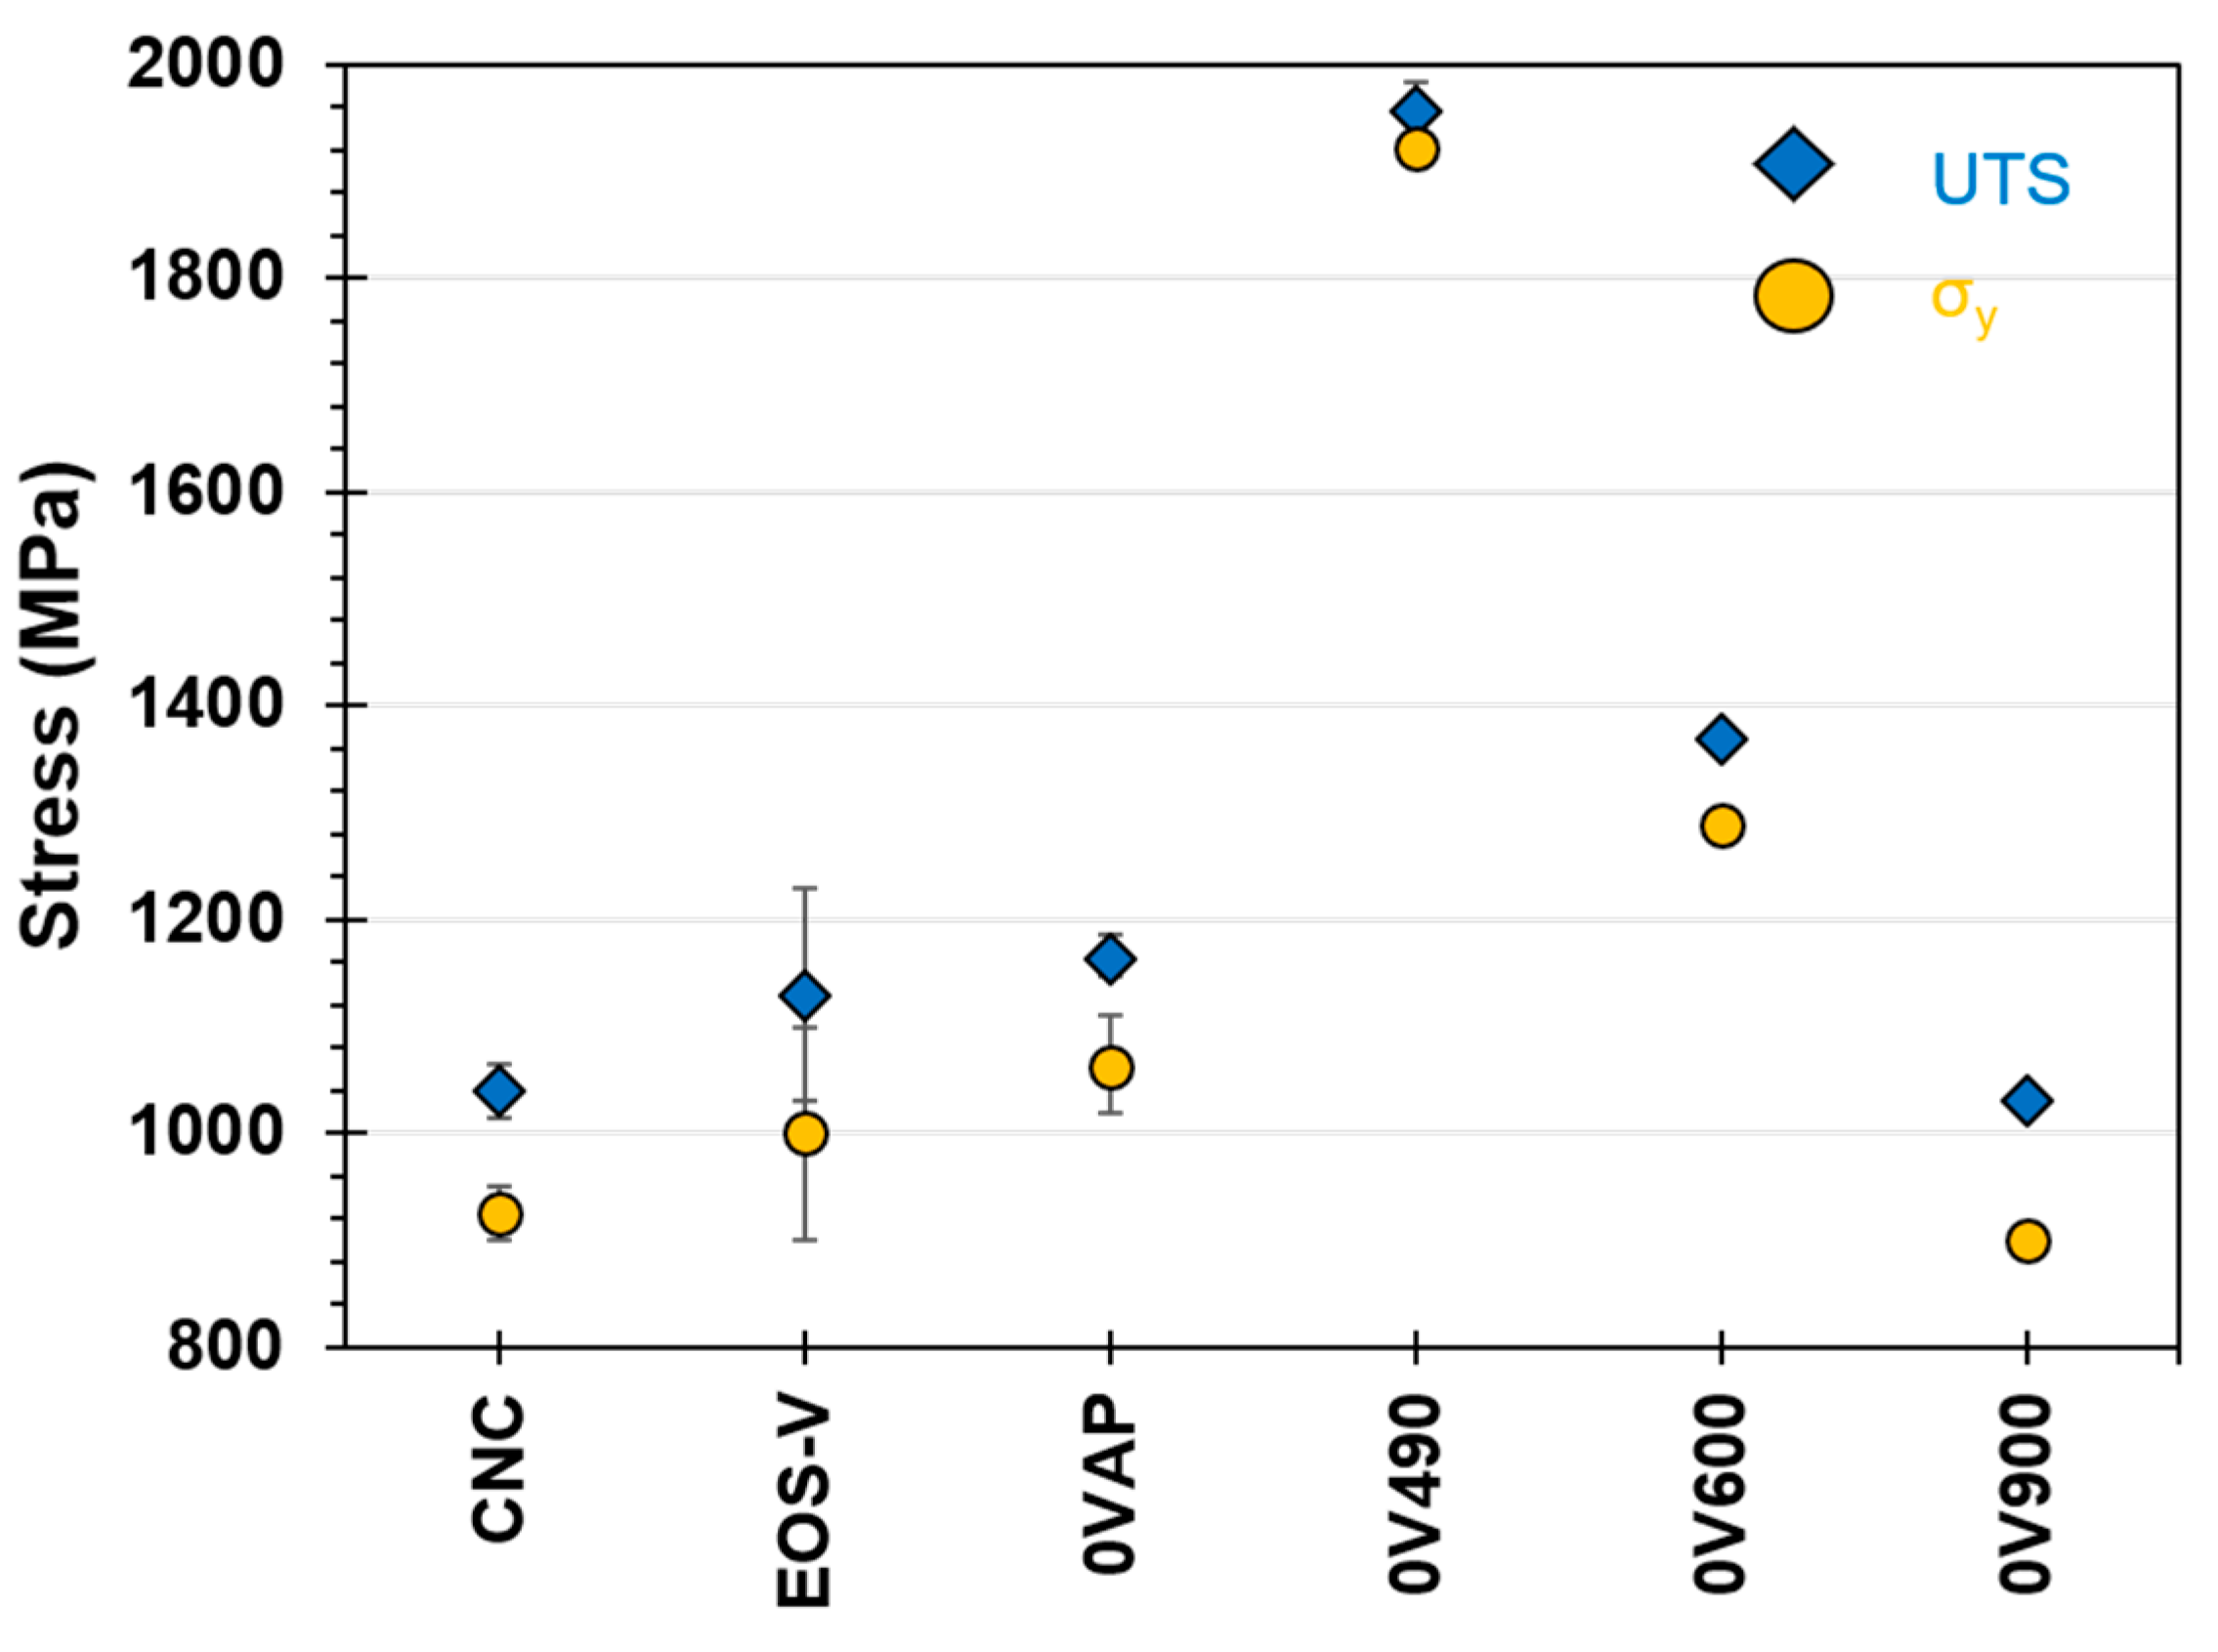
Shown in Figure 3 are measurements of the ultimate tensile strength (UTS) of as-printed and heat-treated maraging steel with a V orientation. The as-printed samples met EOS benchmark values and exceeded the values of traditionally fabricated CNC parts measured here. Samples aged at 490 °C (0V490) saw an increase in UTS close to 2000 MPa. Tensile strength decreased below this maximum when printed samples were heat-treated at higher temperatures. At 600 °C, the 0V600 sample exhibited a UTS of 1370 MPa. When heat-treated at 900 °C, the 0V900 sample showed a further decrease in UTS down to 950 MPa; a value which was lower than UTS for as-printed or CNC samples. The behavior of yield strength closely matched the behavior of UTS for all samples.
These results are similar to those seen by Yasa and Kempen [5,6]. The tensile properties of as-printed 18Ni-300 exceeded those of wrought maraging steel by several hundred MPa while Young’s modulus and ductility were comparable and toughness values were reduced. The microstructure of printed maraging steel was found to be different from the traditional microstructure. When printed samples were aged, hardness and tensile strength were comparable to aged wrought maraging steel while ductility and toughness were reduced. Aged or heat-treated maraging steel properties closely matched those of aged wrought or other traditionally fabricated maraging steel [6]. Figure 3 shows the same, that printed 18Ni-300 exhibited higher strength than CNC 18Ni-300 steel.
Strength is reduced when the heat-treatment temperature exceeds 500 °C. Maraging steel is precipitation hardened to obtain high-strength. In traditionally fabricated maraging steel, lath martensite will form during cooling from an initial melt. Age hardening causes the transformation of martensite to austenite if the temperature is increased above the austenite start temperature, AS. How high the temperature is above AS and how rapid the cooling will determine the amount of austenite formation and whether precipitates form during cooling. If the aging temperature is set between 455 °C and 510 °C, the transformation to austenite is slow enough to allow precipitates to form out of solution [10]. At temperatures higher than 510 °C, the transformation rate of martensite to austenite is increased and precipitates do not form.
Microstructural analysis of vertically printed specimens with or without heat-treatment is shown in Figure 4. The intercellular structure revealed in 0VAP samples (Figure 4a) is believed to be caused by the rapid solidification of material following laser re-melting. As-printed samples exhibited a multi “domain” structure made of a combination of fine dendrites with short secondary arms, cellular regions, and columnar regions similar to the ones previously reported by [5,6,17,18,19]. The onset of laser-induced rapid solidification prevents the formation of lath martensite [6,18] usually associated with maraging steel. This cellular structure is responsible for the improved strength of as-printed maraging steel as compared to traditionally fabricated maraging steel. Break-up of the cellular structure is seen in a sample of 0V490 (Figure 4b). This is caused by the formation of austenite within the cells and through the cell boundaries in accordance with prior studies [17,19]. Further removal of the cells and enlarging of the austenite phase occurred with 600 °C and 900 °C heat-treatments as seen in Figure 4c,d, which are images of 0V600 and 0V900, respectively.
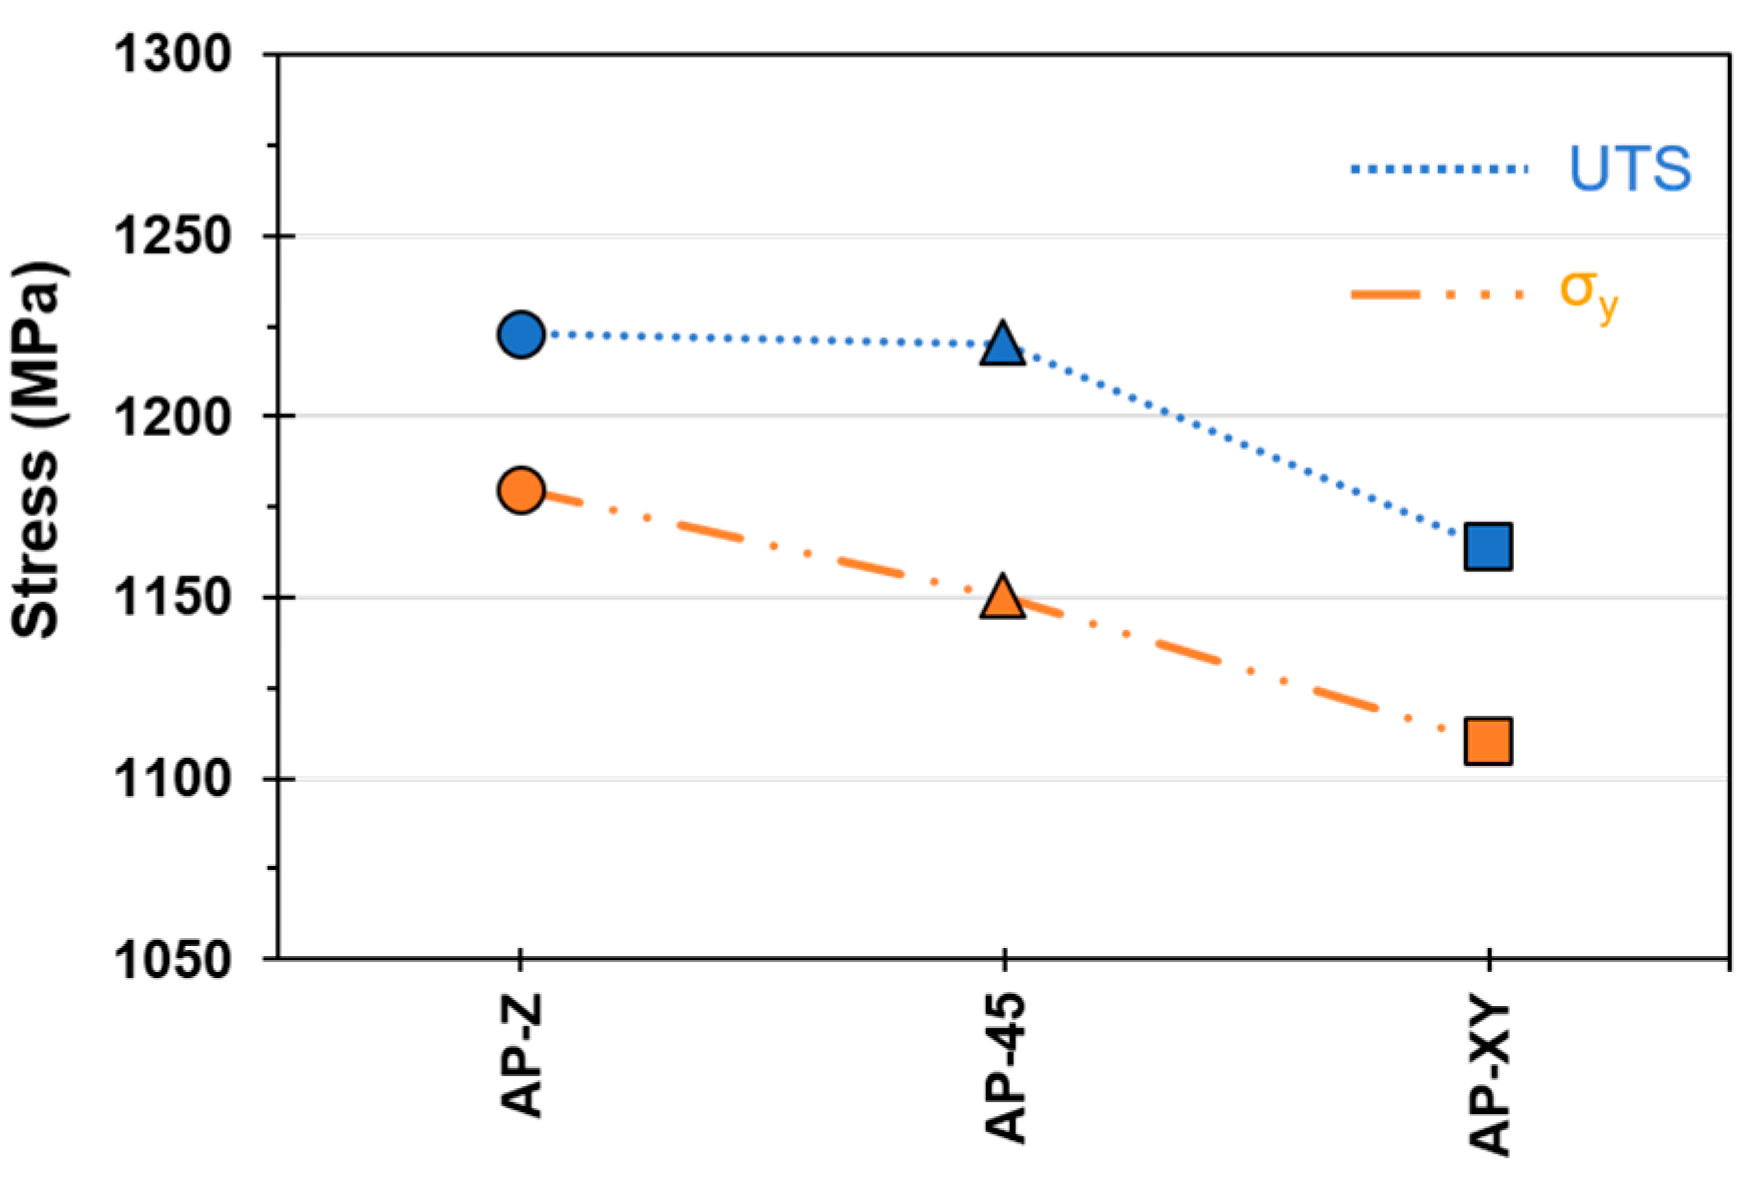
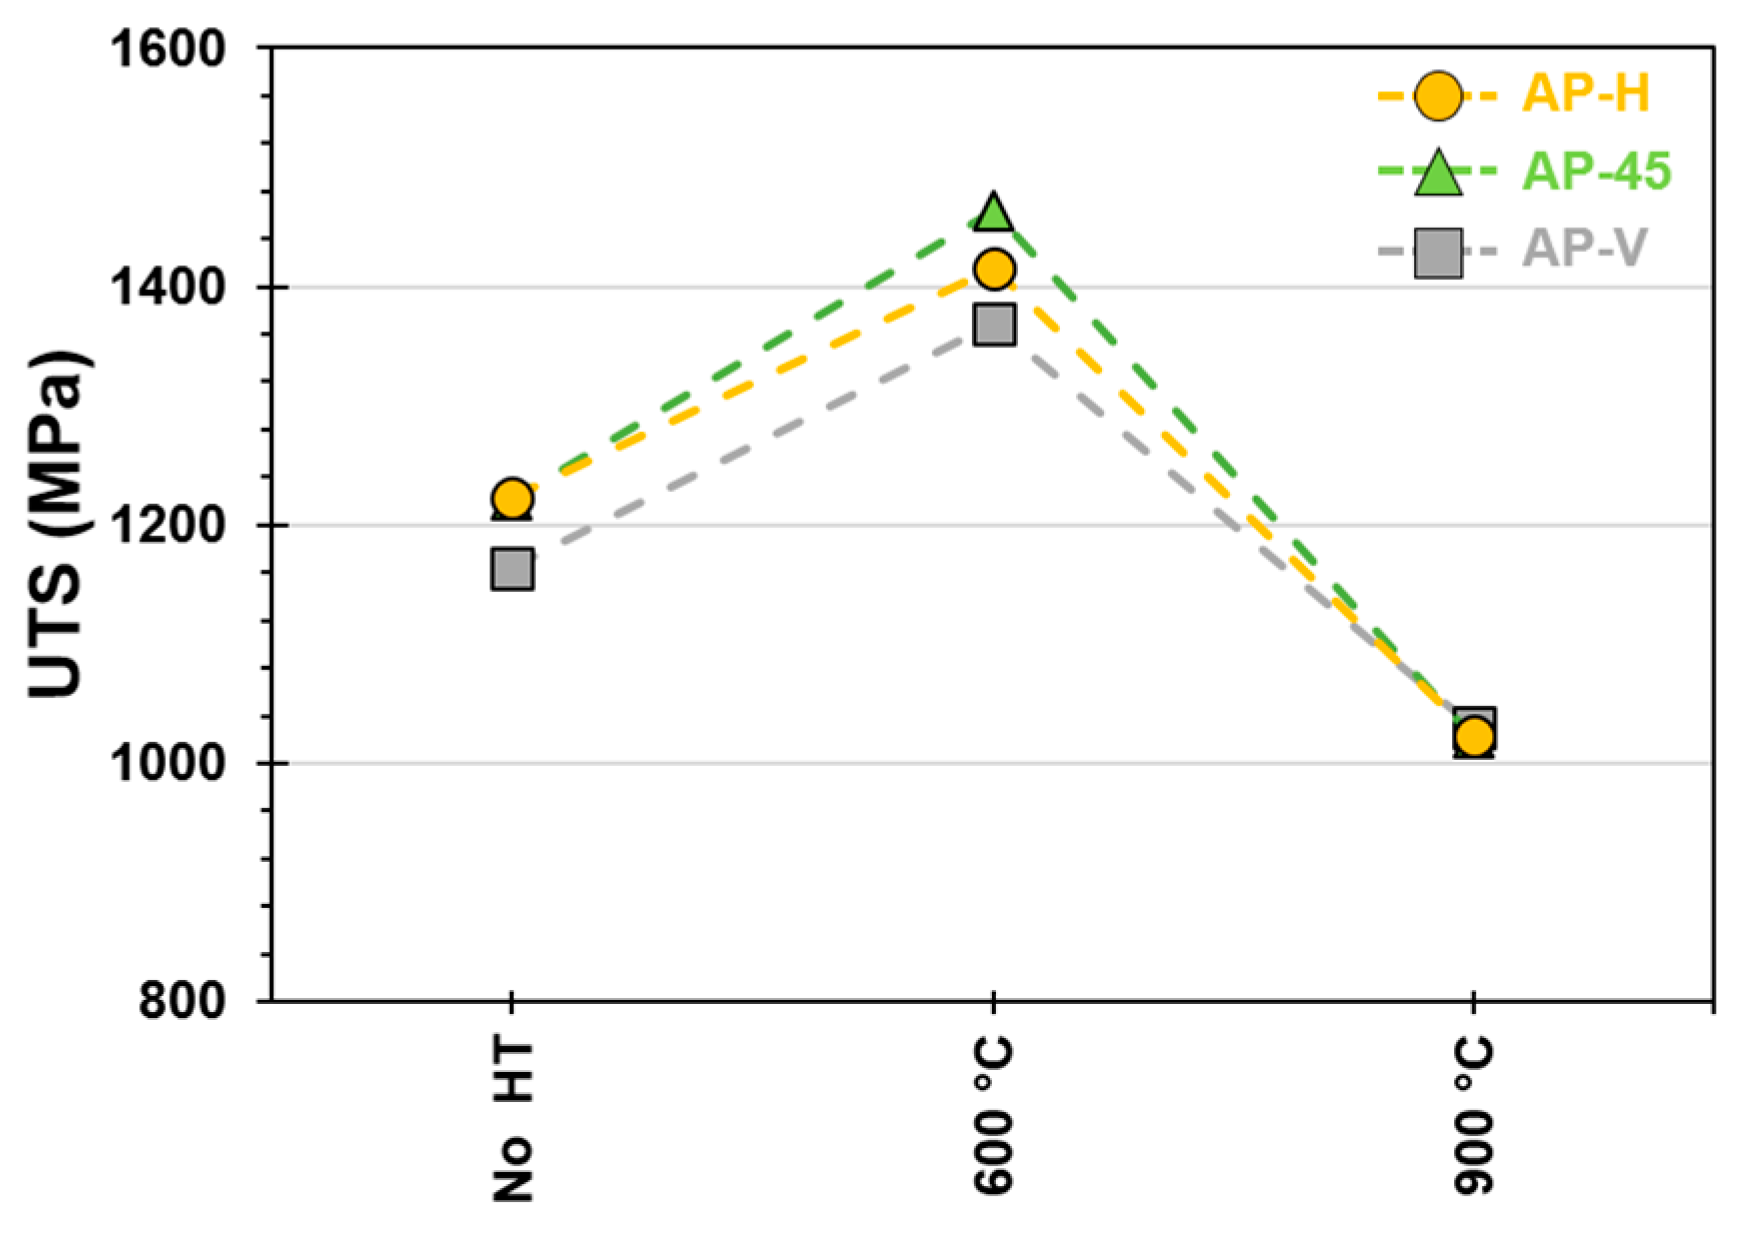
The printing orientation also affected the tensile and yield strength of maraging steel. Shown in Figure 5, samples printed in the H or 45° orientations exhibited increased tensile strength over V-printed samples. In printed samples where layering is perpendicular to the direction of the applied load, failure occurs before samples printed such that layers are parallel to the loading direction (H). Tan et al. found that similar to observations in this paper, the horizontally printed maraging steel exhibited higher tensile strength then vertically printed specimens [21].
The changes induced in tensile strength after heat-treatment of V samples were also seen in H and 45° printed tensile specimens. Seen in Figure 6, tensile strength increased for samples printed in all three orientations after the 600 °C heat-treatment. Then the tensile strength decreased for all print orientations upon the 900 °C heat-treatment.
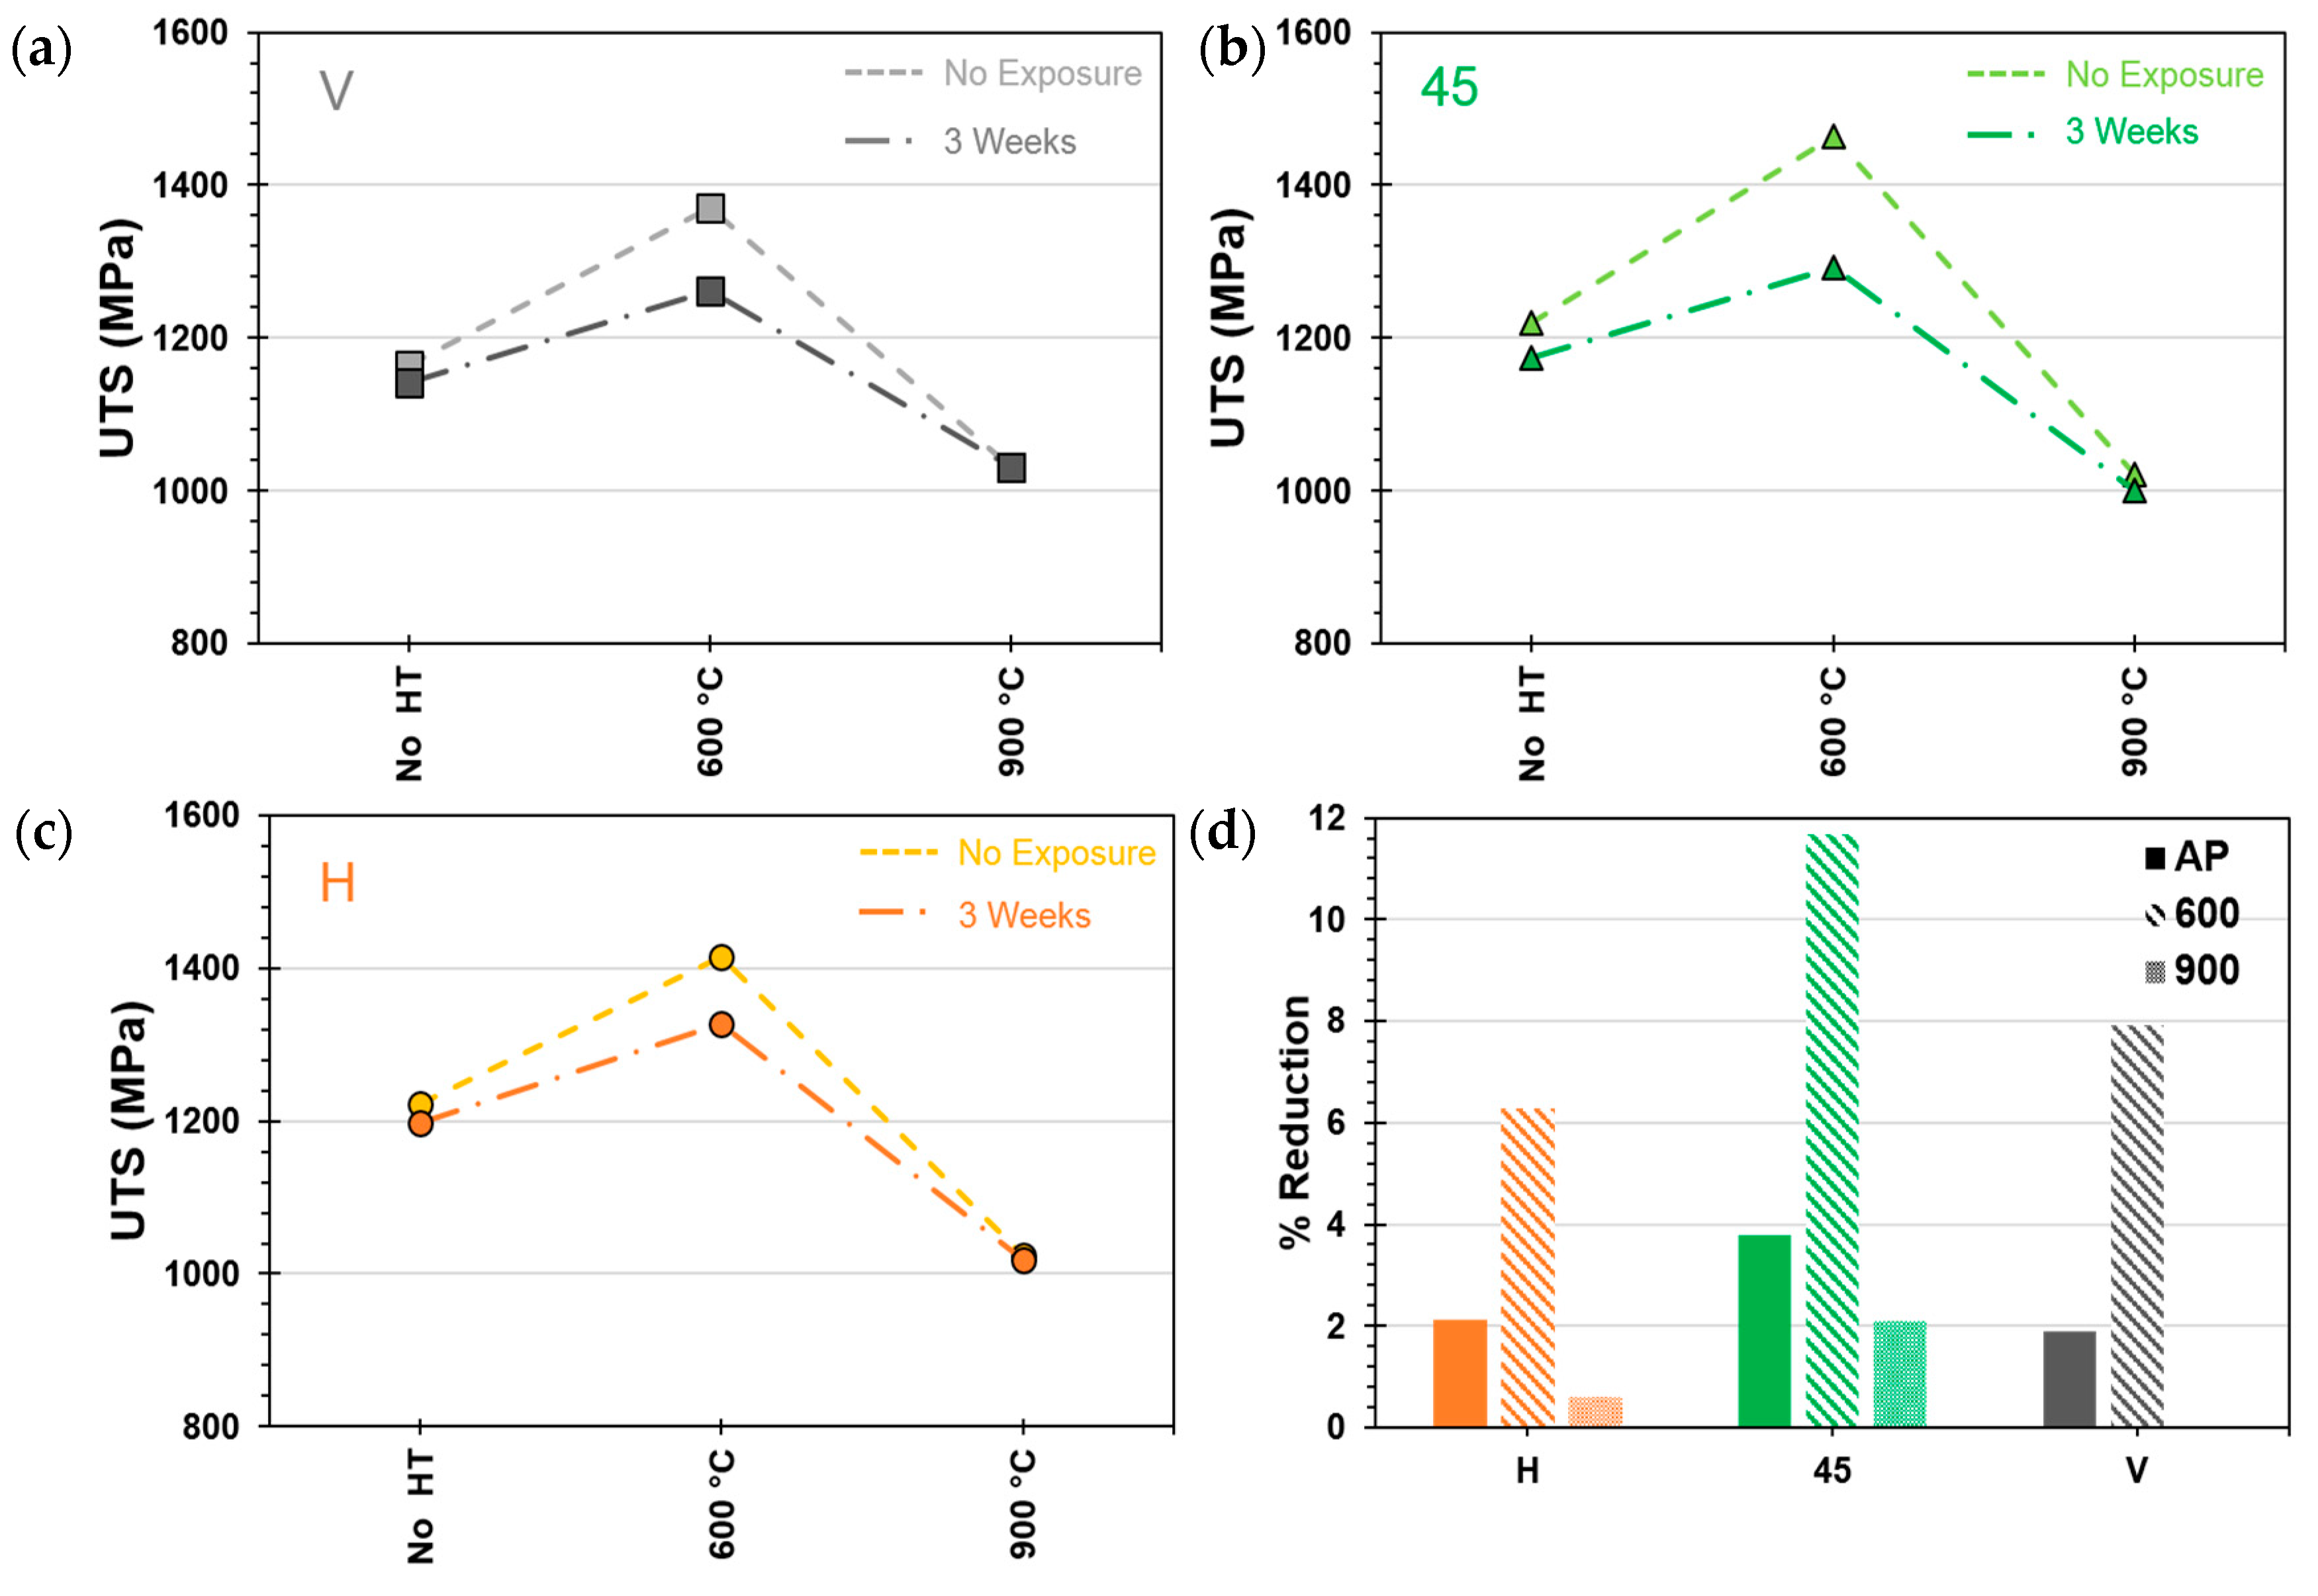
Samples placed in the salt fog for three weeks (~500 h) of simulated marine exposure experienced a decrease in tensile strength. Figure 7 shows the change in tensile strength of samples before and after exposure. Testing results for V-printed samples are shown in Figure 7a; 45°-printed samples in Figure 7b; and H-printed samples in Figure 7c. Surface corrosion degraded the tensile strength between 1.9% and 3.7% for as-printed specimens (1.9% for 3VAP and 3.7% for 345AP). HT600 samples experienced the highest reduction in strength with 6.3% for 3H600 and 11.7% reduction for the 345,600 sample. The smallest reduction in strength occurred for HT900 samples with a negligible reduction in V samples and a 2.1% reduction in UTS for the 345,900 samples. Figure 7d presents the relative percent changes in UTS of all samples after 500 h of exposure. As will be seen later, corrosion penetration in samples causes the formation of cracking which may otherwise not appear in pristine samples. This may explain the reduction in strength of samples upon exposure to a marine environment.
As evidenced in Figure 7, the as-printed samples (printed in all three orientations) exhibited relatively good corrosion resistance and little reduction in strength after exposure. Samples heat-treated at 600 °C saw larger reductions in strength after exposure. Samples heat-treated to 900 °C experienced a softening after cooling but also show better corrosion resistance. This was seen by a smaller reduction in strength after exposure as compared to the as-printed samples. Figure 7d summarizes these results.
It was also seen in 
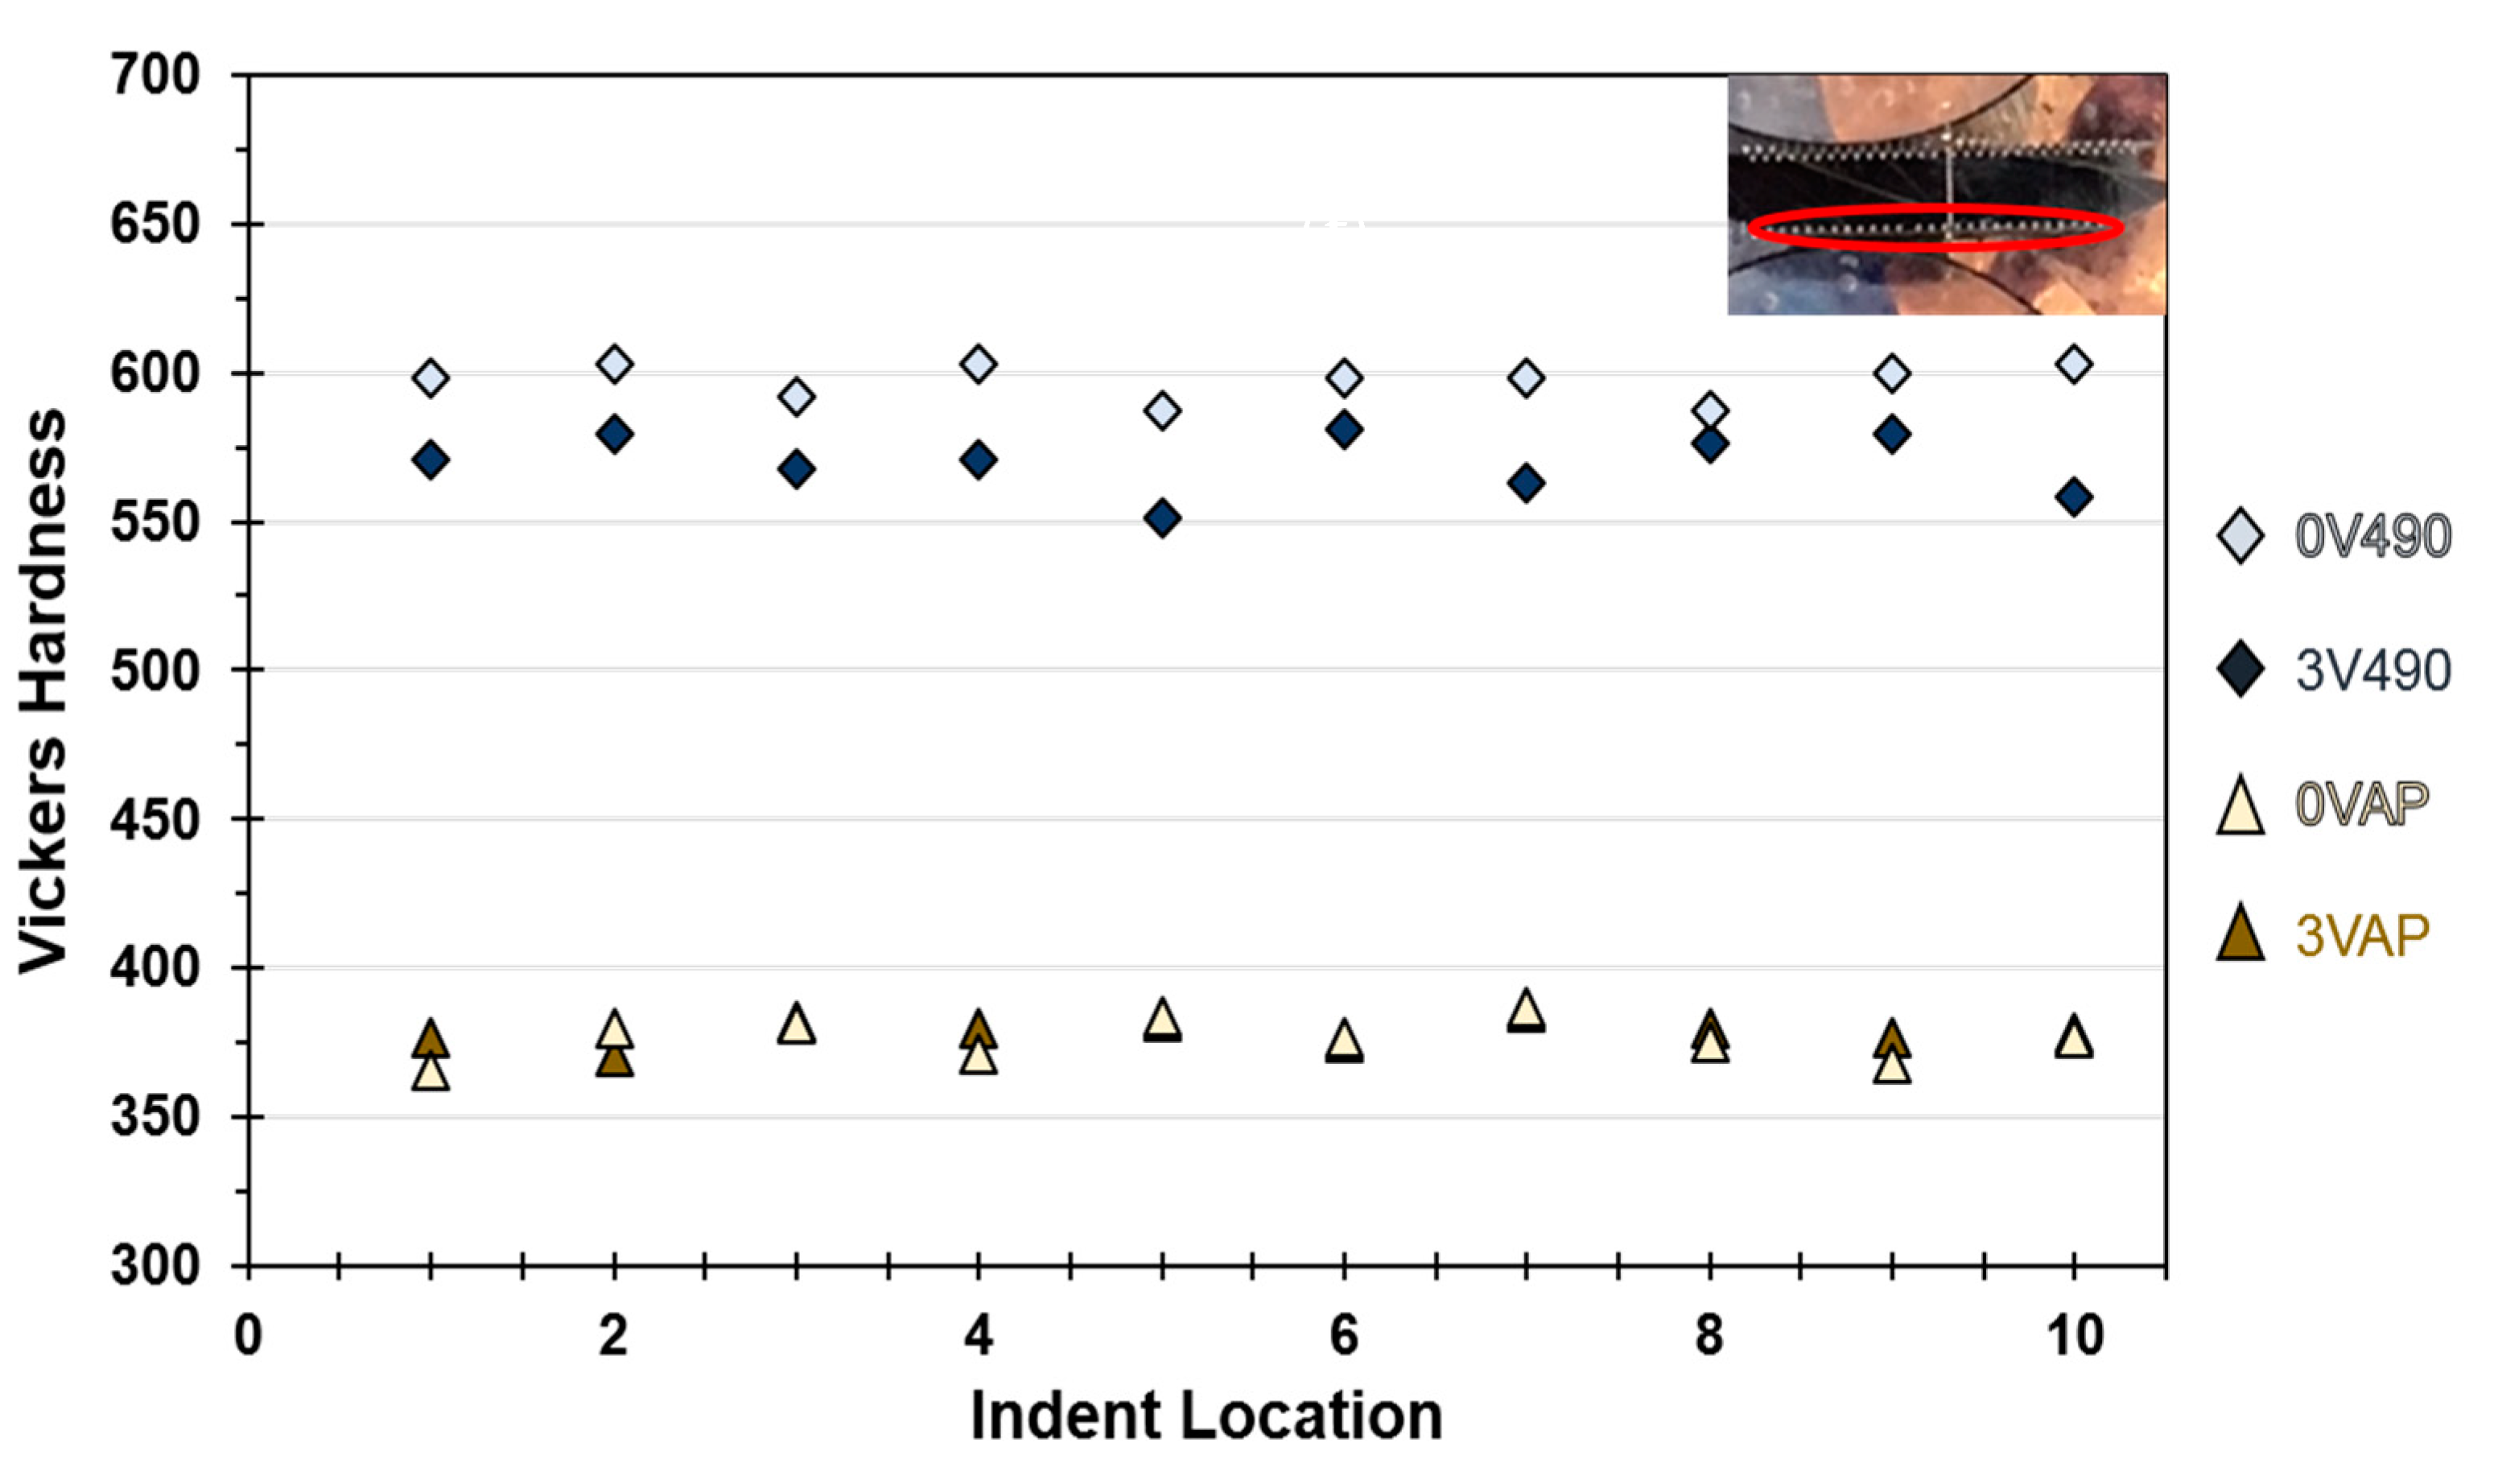
Figure 7 that samples heat-treated at 600 °C were more affected by corrosion than as-printed samples in terms of tensile strength. Heat treatment at 490 °C also increased the susceptibility to corrosion in aged samples. Microhardness tests were conducted on AP and HT490 samples and shown in Figure 8. Comparisons of hardness between 0VAP and 3VAP (bottom two sets of data) and between 0V490 and 3V490 (top two sets of data) are shown. The locations of hardness measurements of the 0V490 sample are shown in the inset. Similar positions were chosen for the hardness measurements conducted on the other samples where hardness was measured.
There was no difference in hardness away from the surface between as-printed specimens before and after exposure, 0VAP and 3VAP. There was a measurable difference (close to 10%) in the near-surface hardness between heat-treated at 490 °C samples 0V490 and 3V490. Results of hardness tests align with the results of tensile testing seen in the increased rate of decline of both in samples after exposure. Therefore, heat-treatment between 490 °C and 600 °C led to parts with a greater susceptibility to corrosion. Such an outcome is in agreement with previous reports [26,27,28,29] and it is believed to be a result of the formation of intermetallic precipitates. It has been shown that the existence of austenite with high Ni content leads to preferential pitting corrosion as shown in duplex stainless steels used for welding [30]. Recall, during heat-treatments, if the temperature is higher than As, austenite reversion will take place [10].
Microstructural analysis revealed the differences in susceptibility to general corrosion depending on heat-treatment (or lack thereof). SEM analysis of V printed maraging steel samples both unaged (Figure 9a) and heat-treated at 600 °C for six hours (Figure 9b) revealed pitting and corrosion by-products. Figure 9 shows the differences in corrosion susceptibility between as-printed and heat-treated maraging steel. Note the deeper penetration of corrosion in the aged sample. Observed on the left-hand side of Figure 9b, is a contrast difference between the base metal and corrosion affected metal. The contrast difference is due to exposure to the underlying microstructure. In effect, the environment in the salt spray chamber etched part of the metal near the surface. The increased corrosion susceptibility of heat-treated (490 °C and 600 °C) samples is likely due to the existence of precipitates and multiple phases. For samples heat-treated at 900 °C, corrosion susceptibility was like as-printed samples due to the existence of a one-phase only (austenite in this case).
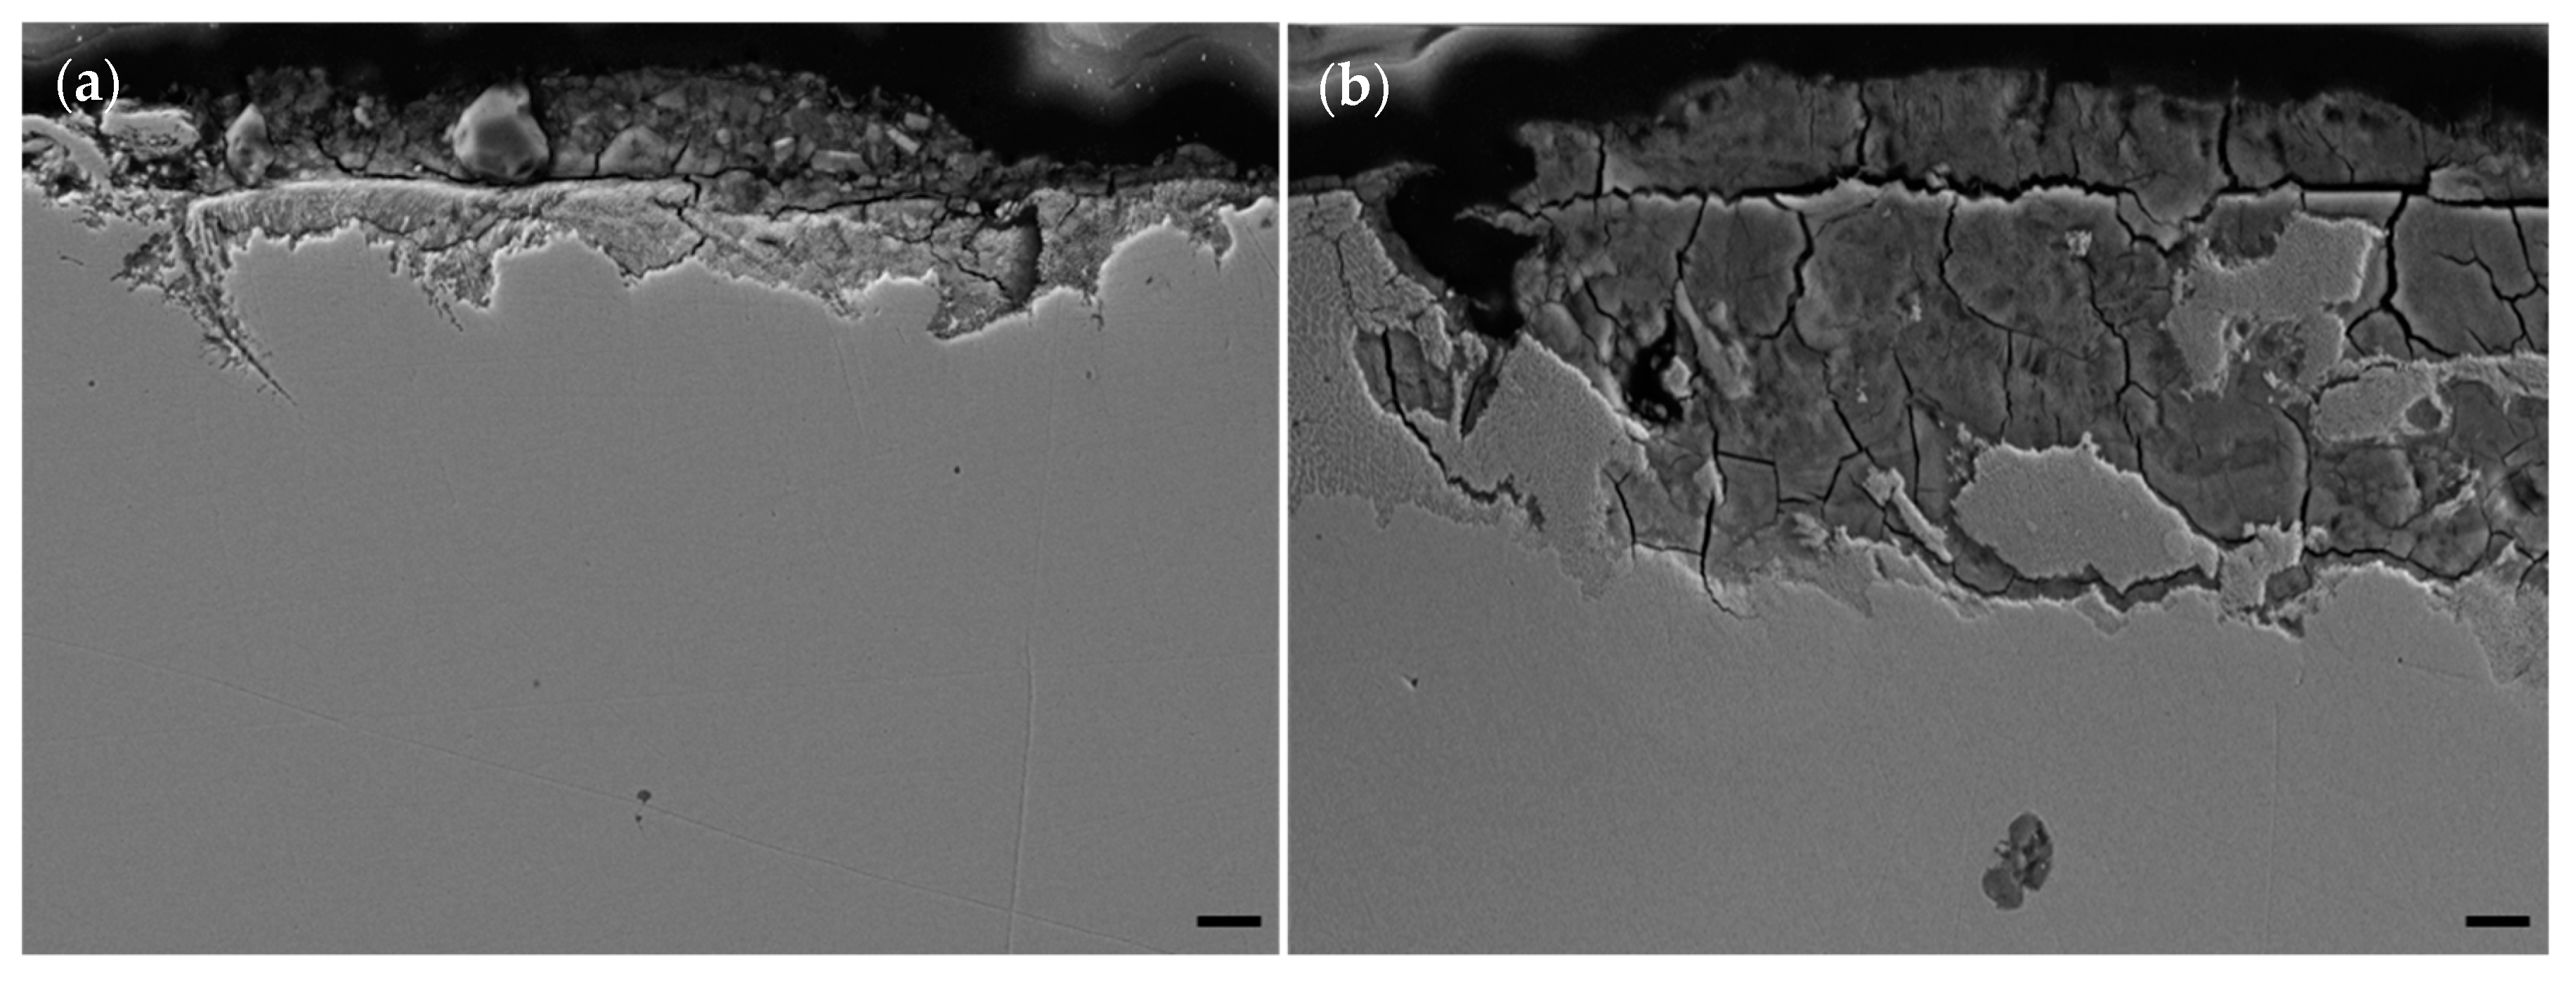
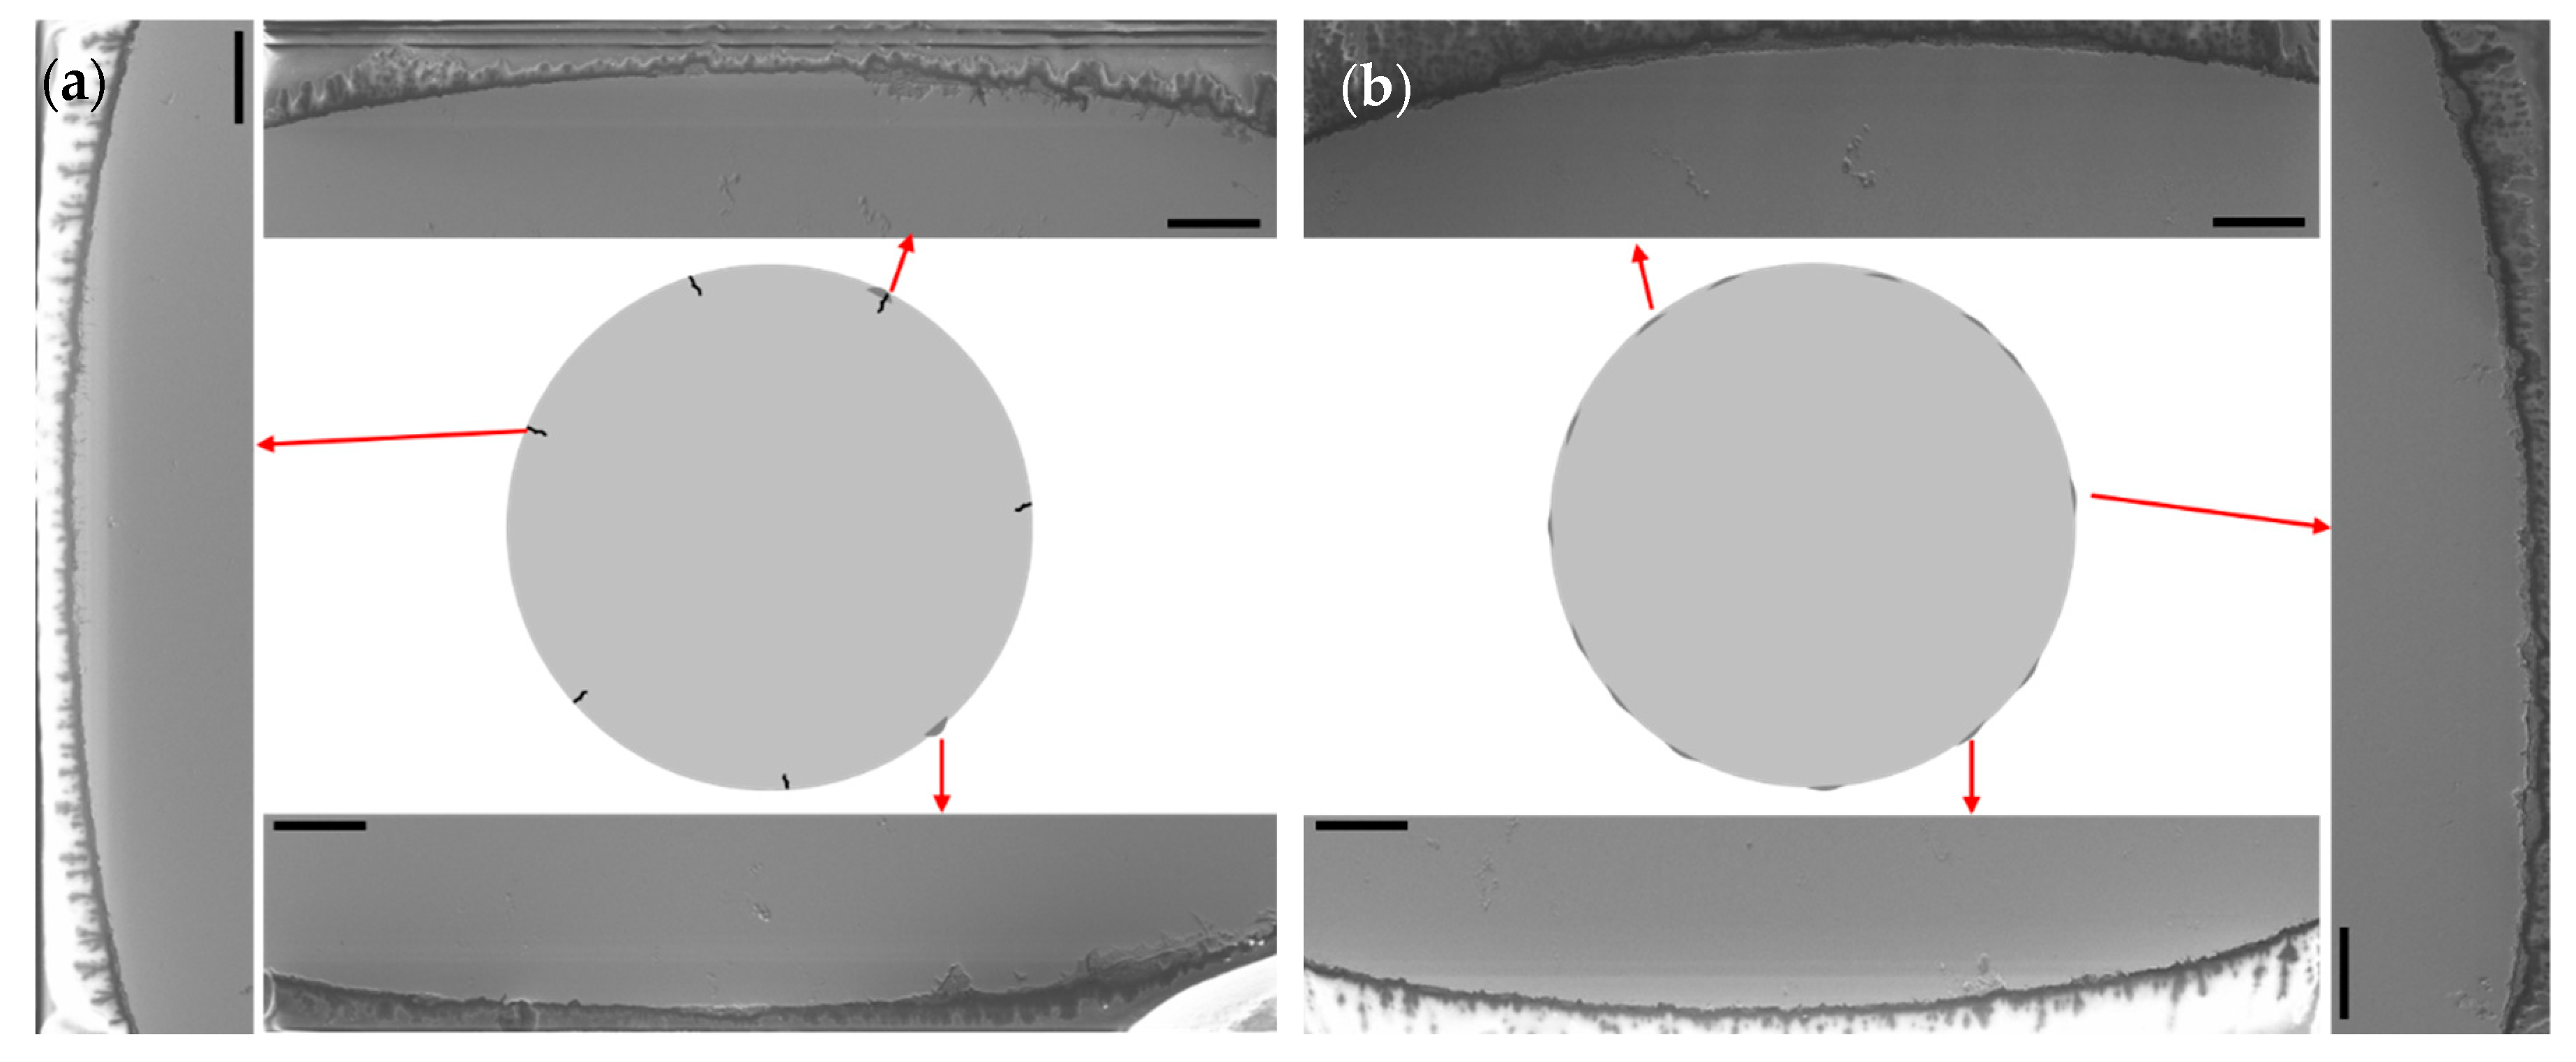
Corrosion induced a 4.7% decrease in the ultimate tensile strength of the as-fabricated CNC sample. This decrease was greater than in the as-printed specimens with decreases in UTS of 1.8% (between 0VAP and 3VAP), 2.1% (0HAP and 3HAP), and 3.8% (045AP and 345AP). After tensile testing, cross-sections were cut from corroded as-printed and CNC samples. Electron microscopy was performed on the surface of the cross-sections where corrosion formed. Microscopy of the exposed samples showed a greater volume of pitting corrosion in the surface of the as-printed specimens (Figure 10a) as compared to the as-fabricated CNC specimens (Figure 10b). Microscopy observations indicated a larger number of surface cracks in as-printed samples compared to the CNC sample.
Despite the extent of surface corrosion features identified in the SEM study in the as-printed parts, those features did not seem to be greater than the samples manufactured by traditional methods or have affected the overall UTS performance under the conditions explored herein. The 3D printed aged specimens; however, seemed greatly affected indicating heat-treated specimens should be protected by coatings or their exposure to marine environments be limited. It is worth noting that the surface cracks found in the additively manufactured parts could be exacerbated with longer exposure times, application of stress or more corrosive environments, thus, future studies should include a wider set of those variables.

4. Conclusions

Maraging steel 18Ni-300 was printed by the SLM method in an EOS M400 3D metal printer. Samples were printed in three different orientations: V, 45°, and H relative to the print plate. Results of the OM examination showed directional changes in laser track marks due to printing orientation differences. Printing orientation also affected tensile properties, where unexposed and non-heat-treated H and 45° specimens had higher UTS over as-printed V samples. The tensile strength of as-printed V samples was higher than the as-fabricated CNC (VIM-VAR) 18Ni-300. Heat-treatments at 490 °C and 600 °C led to improved mechanical properties due to precipitation hardening. Heat-treatment at 900 °C led to a decrease in mechanical properties. For all three printing directions, heat-treatments at 490 °C or 600 °C degraded corrosion resistance in relation to the as-printed samples. Exposed as-printed samples exhibited a smaller loss in tensile properties when compared to exposed as-fabricated CNC 18Ni-300. Yet the as-printed samples were more susceptible to surface pitting corrosion.

Author Contributions

T.Y.A. conducted the optical and electron microscopy on exposed and unexposed samples and analysis of the data. J.P.R. carried out the metallographic sample preparation; conducted some of the electron microscopy of corroded samples; and performed microhardness tests. C.P. assisted in the salt spray work and tensile testing. C.S.T. printed the maraging steel parts. C.C.L. secured the funding for the project; directed the overall research; conducted analysis of the data; and assisted in the salt spray work, electron microscopy, hardness testing, and tensile testing. All authors have read and agreed to the published version of the manuscript.

Funding

This research was funded by the Naval Postgraduate School through the Naval Research Program, grants NPS-19-M283-A and NPS-19-N180-A.

Acknowledgments

The authors would like to express our gratitude to John Mobley for his machining of samples and the sample mounts for tensile testing. The authors acknowledge the assistance of Chantel Lavendar to the microscopy effort. The authors appreciate the assistance in corrosion testing provided by student interns Isaiah Stewman and Tiffany Smith. The authors would also like to thank William Alday for his help during the sample printing stage.

Conflicts of Interest

The authors declare no conflict of interest. The views expressed in this document are those of the authors and do not reflect the official policy or position of the Department of Defense or the U.S. Government.

References

  1. Khajavi, S.H.; Holmström, J.; Partanen, J. Additive manufacturing in the spare parts supply chain: Hub configuration and technology maturity. Rapid Prototyp. J. 2018, 24, 1178–1192. [Google Scholar] [CrossRef] [Green Version]
  2. Arcella, F.G.; Abbott, D.H.; House, M.A. Titanium Alloy Structures for Airframe Application by the Laser Forming Process. In Proceedings of the 41st Structures, Structural Dynamics, and Materials Conference and Exhibit, Atlanta, GA, USA, 3–6 April 2000. [Google Scholar]
  3. Yasa, E.; Kruth, J.-P. Microstructural investigation of Selective Laser Melting 316L stainless steel parts exposed to laser re-melting. Procedia Eng. 2011, 19, 389–395. [Google Scholar] [CrossRef]
  4. Aboulkhair, N.T.; Everitt, N.M.; Ashcroft, I.; Tuck, C. Reducing porosity in AlSi10Mg parts processed by selective laser melting. Addit. Manuf. 2014, 1–4, 77–86. [Google Scholar] [CrossRef]
  5. Yasa, E.; Kempen, K.; Kruth, J.-P.; Humbeeck, J.V. Microstructure and Mechanical Properties of Maraging Steel 300 After Selective Laser Melting. In Proceedings of the Materials, Austin, TX, USA; 2010. [Google Scholar]
  6. Kempen, K.; Yasa, E.; Thijs, L.; Kruth, J.-P.; Humbeeck, J.V. Microstructure and mechanical properties of Selective Laser Melted 18Ni-300 steel. Phys Procedia 2011, 12, 255–263. [Google Scholar] [CrossRef] [Green Version]
  7. Decker, R.F.; Eash, J.T.T.; Goldman, A.J.J. 18% nickel maraging steel. Trans. ASM 1962, 55, 58. [Google Scholar]
  8. Campbell, J.E.; Barone, F.J.; Moon, D.P. The Mechanical Properties of the 18 Per Cent Nickel Maraging Steels; Defense Metals Information Center (DMIC): Columbus, OH, USA, 1964. [Google Scholar]
  9. Shamantha, C.R.; Narayanan, R.; Iyer, K.J.L.; Radhakrishnan, V.M.; Seshadri, S.K.; Sundararajan, S.; Sundaresan, S. Microstructural changes during welding and subsequent heat treatment of 18Ni (250-grade) maraging steel. Mater. Sci. Eng. A 2000, 287, 43–51. [Google Scholar] [CrossRef]
  10. Carson, C. Heat Treating of Maraging Steel. In ASM Handbook; ASM International: Cleveland, OH, USA, 2014; pp. 469–480. [Google Scholar]
  11. Moshka, O.; Pinkas, M.; Brosh, E.; Ezersky, V.; Meshi, L. Addressing the issue of precipitates in maraging steels—Unambiguous answer. Mater. Sci. Eng. A 2015, 638, 232–239. [Google Scholar] [CrossRef]
  12. Drennen, D.C.; Roach, D.B. Properties of Mar-Aging Steels; Defense Metals Information Center (DMIC): Columbus, OH, USA, 1962. [Google Scholar]
  13. Stanford, M.; Kibble, K.A.; Lindop, M.; Mynors, D.; Durnall, C. An investigation into fully melting a maraging steel using direct metal laser sintering (DMLS). Steel Res. Int. 2008, 79, 847–852. [Google Scholar]
  14. Yan, J.; Zhou, Y.; Gu, R.; Zhang, X.; Quach, W.-M.; Yan, M. A Comprehensive Study of Steel Powders (316L, H13, P20 and 18Ni300) for Their Selective Melting Additive Manufacturing. Metals 2019, 9, 86. [Google Scholar] [CrossRef] [Green Version]
  15. Sinico, M.; Witvrouw, A.; Dewulf, W. Influence of the particle size distribution on surface quality of Maraging 300 parts produced by Laser Powder Bed Fusion. In Proceedings of the Advancing Precision in Additive Manufacturing, Ecole Centrale de Nantes, France, 16–18 September 2019. [Google Scholar]
  16. Turk, C.; Zunko, H.; Aumayr, C.; Leitner, H.; Kapp, M. Advances in Maraging Steel for Additive Manufacturing. Berg Huettenmaenn Monatsh 2019, 164, 112–116. [Google Scholar] [CrossRef] [Green Version]
  17. Jägle, E.A.; Choi, P.-P.; Humbeeck, J.V.; Raabe, D. Precipitation and austenite reversion behavior of a maraging steel produced by selective laser melting. J. Mater. Res. 2014, 29. [Google Scholar] [CrossRef] [Green Version]
  18. Becker, T.H.; Dimitrov, D. The achievable mechanical properties of SLM produced Maraging Steel 300 components. Rapid Prototyp. J. 2016, 22, 487–494. [Google Scholar] [CrossRef]
  19. Tan, C.; Zhou, K.; Ma, W.; Zhang, P.; Liu, M.; Kuang, T. Microstructural evolution, nanoprecipitation behavior and mechanical properties of selective laser melted high-performance grade 300 maraging steel. Mater. Des. 2017, 134, 23–34. [Google Scholar] [CrossRef]
  20. Conde, F.F.; Escobar, J.D.; Oliveira, J.P.; Jardini, A.L.; Bose Filho, W.W.; Avila, J.A. Austenite reversion kinetics and stability during tempering of an additively manufactured maraging 300 steel. Addit. Manuf. 2019, 29, 100804. [Google Scholar] [CrossRef]
  21. Tan, C.; Zhou, K.; Kuang, M.; Ma, W.; Kuang, T. Microstructural characterization and properties of selective laser melted maraging steel with different build directions. Sci. Techno. Adv. Mater. 2018, 19, 746–758. [Google Scholar] [CrossRef] [Green Version]
  22. EOS MaragingSteel MS1 2010. Available online: http://dmls.net/materials-data-sheets/eos-maraging-steel-ms1-msd.pdf (accessed on 2 February 2020).
  23. ASTM E8/E8M-16a, Standard Test Methods for Tension Testing of Metallic Materials; ASTM International: West Conshohocken, PA, USA, 2016.
  24. Millero, F.J.; Feistel, R.; Wright, D.G.; McDougall, T.J. The composition of Standard Seawater and the definition of the Reference-Composition Salinity Scale. Deep-Sea Res. 2008, 55, 50–72. [Google Scholar] [CrossRef]
  25. Casati, R.; Lemke, J.N.; Tuissi, A.; Vedani, M. Aging Behaviour and Mechanical Performance of 18-Ni 300 Steel Processed by Selective Laser Melting. Metals 2016, 6, 218. [Google Scholar] [CrossRef]
  26. Srinivasan, P.B.; Marikkannu, C.; Ramu, S.; Balakrishnan, K. Corrosion of maraging steels in chloride solutions. Br. Corros. J. 1994, 29, 132–135. [Google Scholar] [CrossRef]
  27. Dean, S.W.; Copson, H.R. Stress Corrosion Behavior of Maraging Nickel Steels in Natural Environments. Corrosion 1965, 21, 95–103. [Google Scholar] [CrossRef]
  28. Wadhwa, V.C. Corrosion Behavior of Heat Treated 18 Per Cent Nickel Maraging Steel; Kansas State University: Manhattan, KS, USA, 1965. [Google Scholar]
  29. Tian, J.-L.; Wang, W.; Shahzad, M.B.; Yan, W.; Shan, Y.-Y.; Jiang, Z.-H.; Yang, K. Corrosion Resistance of Co-containing Maraging Stainless Steel. Acta Metall. Sin-engl. 2018, 31, 785–797. [Google Scholar] [CrossRef] [Green Version]
  30. Ogawa, T.; Koseki, T. Effect of Composition Profiles on Metallurgy and Corrosion Behavior of Duplex Stainless Steel Weld Metals. Weld. J. 1989, 68, 181s–191s. [Google Scholar]
Figure 1. Schematic of the salt spray chamber (“salt fog”). In the sketch (a), the saturation tower and salt solution reservoir are labeled 1 and 2, respectively. The flow of air and water are indicated. Samples are seen hanging from 3D printed sample holders in (b). Visible “fog,” in (c), generated from the atomized salt solution located in the reservoir.
Metals 10 00218 g001
Figure 2. Optical images of as-printed maraging steel samples printed in (a) V, (b) 45°, and (c) H orientations. The red arrow indicates the orientation of samples when imaged in the optical microscope. The scale is 10 µm.
Metals 10 00218 g002
Figure 3. Ultimate tensile strength of as-printed and heat-treated specimens printed in the V orientation and unexposed. Values are compared to CNC maraging steel and EOS benchmark values [22].
Metals 10 00218 g003
Figure 4. Microstructure (SEM) of V-printed samples with different heat-treatments: (a) 0VAP; (b) 0V490; (c) 0V600; and (d) 0V900. The scale is 1.0 µm.
Metals 10 00218 g004
Figure 5. Effect of printing orientation on the ultimate tensile strength (top line) and yield strength (bottom line).
Metals 10 00218 g005
Figure 6. Changes in tensile strength due to heat-treatment for all three print orientations.
Metals 10 00218 g006
Figure 7. Reduction in tensile strength due to three weeks exposure in a simulated marine environment (both as-printed and heat-treated): (a) V printed samples; (b) 45° oriented samples; (c) H printed samples; and (d) percent change in tensile strength of exposed printed samples compared to before exposure.
Metals 10 00218 g007
Figure 8. Results of microhardness testing in as-printed and heat-treated V samples, inset indicates indent location.
Metals 10 00218 g008
Figure 9. SEM images of (a) 3VAP and (b) 3V600 showing differences in corrosion susceptibility. The scale for both images is 10 µm.
Metals 10 00218 g009
Figure 10. Schematic representation of (a) 3VAP and (b) 3CNC (no heat-treatment). Cross-sections cut away from fracture zones. Scale of 100 µm included with each SEM image.
Metals 10 00218 g010
Table 1. Parameters used in Electro-Optical Systems (EOS) M400 to print 18Ni-300 samples.
Volume Rate (mm2/s)Layer Height (µm)Powder Dosing (%)Pressure (Pa)Recoating Speed (mm/s)
5.550120 to 130280260
Table 2. Composition of maraging steel samples used to produce test samples in this work. All values in wt%.
SampleFeNiCoMoTiAlCrSi
[22]balance17–198.5–9.54.5–5.20.6–0.80.05–0.150.5 max0.1 max
Powdersbalance179.12.91.30.10.70.1
HT490balance189.24.10.70.10.20.2

